Best MA Finder: Sharpe/Sortino ScannerThis script, Best MA Finder: Sharpe/Sortino Scanner, is a tool designed to identify the moving average (SMA or EMA) that best acts as a dynamic trend threshold on a chart, based on risk-adjusted historical performance. It scans a wide range of MA lengths (SMA or EMA) and selects the one whose simple price vs MA crossover delivered the strongest results using either the Sharpe ratio or the Sortino ratio. Reading it is intuitive: when price spent time above the selected MA, conditions were on average more favorable in the backtest; below, less favorable. It is a trend and risk gauge, not an overbought or oversold signal.
What it does:
- Runs individual long-only crossover backtests for many MA lengths across short to very long horizons.
- For each length, measures the total number of trades, the annualized Sharpe ratio, and the annualized Sortino ratio.
- Uses the chosen metric value (Sharpe or Sortino) as the score to rank candidates.
- Applies a minimum trade filter to discard statistically weak results.
- Optionally applies a local stability filter to prefer a length that also outperforms its close neighbors by at least a small margin.
- Selects the optimal MA and displays it on the chart with a concise summary table.
How to use it:
- Choose MA type: SMA or EMA.
- Choose the metric: Sharpe or Sortino.
- Set the minimum trade count to filter out weak samples.
- Select the risk-free mode:
Auto: uses a short-term risk-free rate for USD-priced symbols when available.
Manual: you provide a risk-free ticker.
None: no risk-free rate.
- Optionally enable stability controls: neighbor radius and epsilon.
- Toggle the on-chart summary table as needed.
On-chart output:
- The selected optimal MA is plotted.
- The optional table shows MA length, number of trades, chosen metric value annualized, and the annual risk-free rate used.
Key features:
- Risk-adjusted optimization via Sharpe or Sortino for fair, comparable assessment.
- Broad MA scan with SMA and EMA support.
- Optional stability filter to avoid one-off spikes.
- Clear and auditable presentation directly on the chart.
Use cases:
- Traders who want a defensible, data-driven trend threshold without manual trial and error.
- Swing and trend-following workflows across timeframes and asset classes.
- Quick SMA vs EMA comparisons using risk-adjusted results.
Limitations:
- Not a full trading strategy with position sizing, costs, funding, slippage, or stops.
- Long-only, one position at a time.
- Discrete set of MA lengths, not a continuous optimizer.
- Requires sufficient price history and, if used, a reliable risk-free series.
This script is open-source and built from original logic. It does not replicate closed-source scripts or reuse significant external components.
스크립트에서 "乌德勒支+VS+赫拉克勒斯"에 대해 찾기

Multi Momentum 10/21/42/63 — Histogram + 2xSMAMY MM INDICATOR INDIRED BY KARADI
It averages four rate-of-change snapshots of price, all anchored at today’s close.
If “Show as %” is on, the value is multiplied by 100.
Each term is a simple momentum/ROC over a different lookback.
Combining 10, 21, 42, 63 bars blends short, medium, and intermediate horizons into one number.
Positive MM → average upward pressure across those horizons; negative MM → average downward pressure.
Why those lengths?
They roughly stack into ~2× progression (10→21≈2×10, 21→42=2×21, 63≈1.5×42). That creates a “multi-scale” momentum that’s less noisy than a single fast ROC but more responsive than a long ROC alone.
How to read the panel
Gray histogram = raw Multi-Momentum value each bar.
SMA Fast/Slow lines (defaults 12 & 26 over the MM values) = smoothing of the histogram to show the trend of momentum itself.
Typical signals
Zero-line context:
Above 0 → bullish momentum regime on average.
Below 0 → bearish regime.
Crosses of SMA Fast & Slow: momentum trend shifts (fast above slow = improving momentum; fast below slow = deteriorating).
Histogram vs SMA lines: widening distance suggests strengthening momentum; narrowing suggests momentum is fading.
Divergences: price makes a new high/low but MM doesn’t → potential exhaustion.
Compared to a classic ROC
A single ROC(20) is very sensitive to that one window.
MM averages several windows, smoothing idiosyncrasies (e.g., a one-off spike 21 bars ago) and reducing “lookback luck.”
Settings & customization
Lookbacks (10/21/42/63): you can tweak for your asset/timeframe; the idea is to mix short→medium horizons.
Percent vs raw ratio: percent is easier to compare across symbols.
SMA lengths: shorter = more reactive but choppier; longer = smoother but slower.
Practical tips
Use regime + signal: trade longs primarily when MM>0 and fast SMA>slow SMA; consider shorts when MM<0 and fast

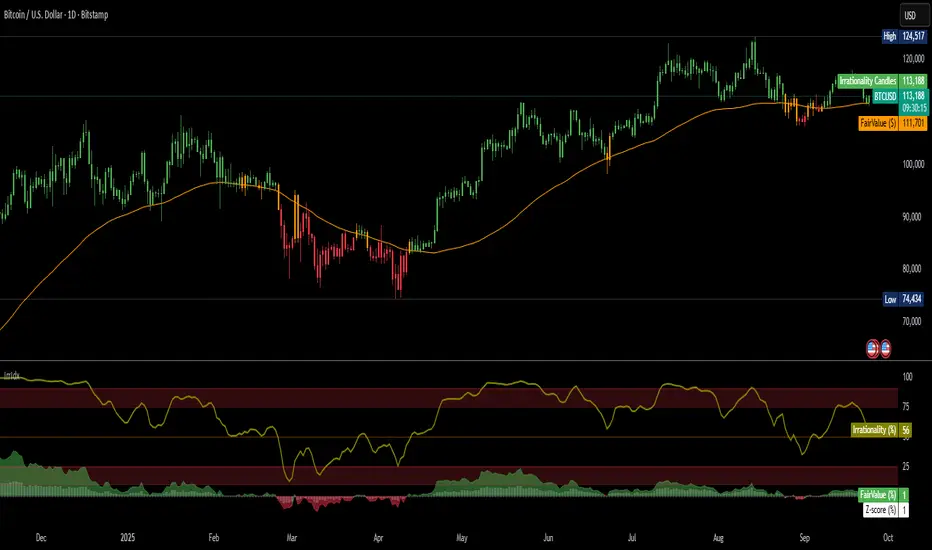
Irrationality Index by CRYPTO_ADA_BTC"The market can be irrational longer than you can stay solvent" ~ John Maynard Keynes
This indicator, the Irrationality Index, measures how far the current market price has deviated from a smoothed estimate of its "fair value," normalized for recent volatility. It provides traders with a visual sense of when the market may be behaving irrationally, without giving direct buy or sell signals.
How it works:
1. Fair Value Calculation
The indicator estimates a "fair value" for the asset using a combination of a long-term EMA (exponential moving average) and a linear regression trend over a configurable period. This fair value serves as a smoothed baseline for price, balancing trend-following and mean-reversion.
2. Volatility-Adjusted Z-Score
The deviation between price and fair value is measured in standard deviations of recent log returns:
Z = (log(price) - log(fairValue)) / volatility
This standardization accounts for different volatility environments, allowing comparison across assets.
3. Irrationality Score (0–100)
The Z-score is transformed using a logistic mapping into a 0–100 scale:
- 50 → price near fair value (rational zone)
- >75 → high irrationality, price stretched above fair value
- >90 → extreme irrationality, unsustainable extremes
- <25 → high irrationality, price stretched below fair value
- <10 → extreme bearish irrationality
4. Price vs Fair Value (% deviation)
The indicator plots the percentage difference between price and fair value:
pctDiff = (price - fairValue) / fairValue * 100
- Positive values → Percentage above fair value (optimistic / overvalued)
- Negative values → Percentage below fair value (pessimistic / undervalued)
Visuals:
- Irrationality (%) Line (0–100) shows irrationality level.
- Background Colors: Yellow= high bullish irrationality, Green= extreme bullish irrationality, Orange= high bearish irrationality, Red= extreme bearish irrationality.
- Price - FairValue (%) plot: price deviation vs fair value (%), Colored green above 0 and red below 0.
- Label: display actual price, estimated fair value, and Z-score for the latest bar.
- Alerts: configurable thresholds for high and extreme irrationality.
How to read it:
- 50 → Market trading near fair value.
- >75 / >90 → Price may be irrationally high; risk of pullback increases.
- <25 / <10 → Price may be irrationally low; potential rebound zones, but trends can continue.
- Price - FairValue (%) plot → visual guide for % price stretch relative to fair value.
Notes / Warnings:
- Measures relative deviation, not fundamental value!
- High irrationality scores do not automatically indicate trades; markets can remain can be irrational longer than you can stay solvent .
- Best used with other tools: momentum, volume, divergence, and multi-timeframe analysis.
Pairs Trading Scanner [BackQuant]Pairs Trading Scanner
What it is
This scanner analyzes the relationship between your chart symbol and a chosen pair symbol in real time. It builds a normalized “spread” between them, tracks how tightly they move together (correlation), converts the spread into a Z-Score (how far from typical it is), and then prints clear LONG / SHORT / EXIT prompts plus an at-a-glance dashboard with the numbers that matter.
Why pairs at all?
Markets co-move. When two assets are statistically related, their relationship (the spread) tends to oscillate around a mean.
Pairs trading doesn’t require calling overall market direction you trade the relative mispricing between two instruments.
This scanner gives you a robust, visual way to find those dislocations, size their significance, and structure the trade.
How it works (plain English)
Step 1 Pick a partner: Select the Pair Symbol to compare against your chart symbol. The tool fetches synchronized prices for both.
Step 2 Build a spread: Choose a Spread Method that defines “relative value” (e.g., Log Spread, Price Ratio, Return Difference, Price Difference). Each lens highlights a different flavor of divergence.
Step 3 Validate relationship: A rolling Correlation checks if the pair is moving together enough to be tradable. If correlation is weak, the scanner stands down.
Step 4 Standardize & score: The spread is normalized (mean & variability over a lookback) to form a Z-Score . Large absolute Z means “stretched,” small means “near fair.”
Step 5 Signals: When the Z-Score crosses user-defined thresholds with sufficient correlation , entries print:
LONG = long chart symbol / short pair symbol,
SHORT = short chart symbol / long pair symbol,
EXIT = mean reversion into the exit zone or correlation failure.
Core concepts (the three pillars)
Spread Method Your definition of “distance” between the two series.
Guidance:
Log Spread: Focuses on proportional differences; robust when prices live on different scales.
Price Ratio: Classic relative value; good when you care about “X per Y.”
Return Difference: Emphasizes recent performance gaps; nimble for momentum-to-mean plays.
Price Difference: Straight subtraction; intuitive for similar-scale assets (e.g., two ETFs).
Correlation A rolling score of co-movement. The scanner requires it to be above your Min Correlation before acting, so you’re not trading random divergence.
Z-Score “How abnormal is today’s spread?” Positive = chart richer than pair; negative = cheaper. Thresholds define entries/exits with transparent, statistical context.
What you’ll see on the chart
Correlation plot (blue line) with a dashed Min Correlation guide. Above the line = green zone for signals; below = hands off.
Z-Score plot (white line) with colored, dashed Entry bands and dotted Exit bands. Zero line for mean.
Normalized spread (yellow) for a quick “shape read” of recent divergence swings.
Signal markers :
LONG (green label) when Z < –Entry and corr OK,
SHORT (red label) when Z > +Entry and corr OK,
EXIT (gray label) when Z returns inside the Exit band or correlation drops below the floor.
Background tint for active state (faint green for long-spread stance, faint red for short-spread stance).
The two built-in dashboards
Statistics Table (top-right)
Pair Symbol Your chosen partner.
Correlation Live value vs. your minimum.
Z-Score How stretched the spread is now.
Current / Pair Prices Real-time anchors.
Signal State NEUTRAL / LONG / SHORT.
Price Ratio Context for ratio-style setups.
Analysis Table (bottom-right)
Avg Correlation Typical co-movement level over your window.
Max |Z| The recent extremes of dislocation.
Spread Volatility How “lively” the spread has been.
Trade Signal A human-readable prompt (e.g., “LONG A / SHORT B” or “NO TRADE” / “LOW CORRELATION”).
Risk Level LOW / MEDIUM / HIGH based on current stretch (absolute Z).
Signals logic (plain English)
Entry (LONG): The spread is unusually negative (chart cheaper vs pair) and correlation is healthy. Expect mean reversion upward in the spread: long chart, short pair.
Entry (SHORT): The spread is unusually positive (chart richer vs pair) and correlation is healthy. Expect mean reversion downward in the spread: short chart, long pair.
Exit: The spread relaxes back toward normal (inside your exit band), or correlation deteriorates (relationship no longer trusted).
A quick, repeatable workflow
1) Choose your pair in context (same sector/theme or known macro link). Think: “Do these two plausibly co-move?”
2) Pick a spread lens that matches your narrative (ratio for relative value, returns for short-term performance gaps, etc.).
3) Confirm correlation is above your floor no corr, no trade.
4) Wait for a stretch (Z beyond Entry band) and a printed LONG / SHORT .
5) Manage to the mean (EXIT band) or correlation failure; let the scanners’ state/labels keep you honest.
Settings that matter (and why)
Spread Method Defines the “mispricing” you care about.
Correlation Period Longer = steadier regime read, shorter = snappier to regime change.
Z-Score Period The window that defines “normal” for the spread; it sets the yardstick.
Use Percentage Returns Normalizes series when using return-based logic; keep on for mixed-scale assets.
Entry / Exit Thresholds Set your stretch and your target reversion zone. Wider entries = rarer but stronger signals.
Minimum Correlation The gatekeeper. Raising it favors quality over quantity.
Choosing pairs (practical cheat sheet)
Same family: two index ETFs, two oil-linked names, two gold miners, two L1 tokens.
Hedge & proxy: stock vs. sector ETF, BTC vs. BTC index, WTI vs. energy ETF.
Cross-venue or cross-listing: instruments that are functionally the same exposure but price differently intraday.
Reading the cues like a pro
Divergence shape: The yellow normalized spread helps you see rhythm fast spike and snap-back versus slow grind.
Corr-first discipline: Don’t fight the “Min Correlation” line. Good pairs trading starts with a relationship you can trust.
Exit humility: When Z re-centers, let the EXIT do its job. The edge is the journey to the mean, not overstaying it.
Frequently asked (quick answers)
“Long/Short means what exactly?”
LONG = long the chart symbol and short the pair symbol.
SHORT = short the chart symbol and long the pair symbol.
“Do I need same price scales?” No. The spread methods normalize in different ways; choose the one that fits your use case (log/ratio are great for mixed scales).
“What if correlation falls mid-trade?” The scanner will neutralize the state and print EXIT . Relationship first; trade second.
Field notes & patterns
Snap-back days: After a one-sided session, return-difference spreads often flag cleaner intraday mean reversions.
Macro rotations: Ratio spreads shine during sector re-weights (e.g., value vs. growth ETFs); look for steady corr + elevated |Z|.
Event bleed-through: If one symbol reacts to news and its partner lags, Z often flags a high-quality, short-horizon re-centering.
Display controls at a glance
Show Statistics Table Live state & key numbers, top-right.
Show Analysis Table Context/risk read, bottom-right.
Show Correlation / Spread / Z-Score Toggle the sub-charts you want visible.
Show Entry/Exit Signals Turn markers on/off as needed.
Coloring Adjust Long/Short/Neutral and correlation line colors to match your theme.
Alerts (ready to route to your workflow)
Pairs Long Entry Z falls through the long threshold with correlation above minimum.
Pairs Short Entry Z rises through the short threshold with correlation above minimum.
Pairs Trade Exit Z returns to neutral or the relationship fails your correlation floor.
Correlation Breakdown Rolling correlation crosses your minimum; relationship caution.
Final notes
The scanner is designed to keep you systematic: require relationship (correlation), quantify dislocation (Z-Score), act when stretched, stand down when it normalizes or the relationship degrades. It’s a full, visual loop for relative-value trading that stays out of your way when it should and gets loud only when the numbers line up.

BioSwarm Imprinter™BioSwarm Imprinter™ — Agent-Based Consensus for Traders
What it is
BioSwarm Imprinter™ is a non-repainting, agent-based sentiment oscillator. It fuses many short-to-medium lookback “opinions” into one 0–100 consensus line that is easy to read at a glance (50 = neutral, >55 bullish bias, <45 bearish bias). The engine borrows from swarm intelligence: many simple voters (agents) adapt their influence over time based on how well they’ve been predicting price, so the crowd gets smarter as conditions change.
Use it to:
• Detect emerging trends sooner without overreacting to noise.
• Filter mean-reversion vs continuation opportunities.
• Gate entries with a confidence score that reflects both strength and persistence of the move.
• Combine with your execution tools (VWAP/ORB/levels) as a state filter rather than a trade signal by itself.
⸻
Why it’s different
• Swarm learning: Each agent improves or decays its “fitness” depending on whether its vote matched the next bar’s direction. High-fitness agents matter more; weak agents fade.
• Multi-horizon by design: The crowd is composed of fixed, simple lookbacks spread from lenMin to lenMax. You get a blended, robust view instead of a single fragile parameter.
• Two complementary lenses: Each agent evaluates RSI-style balance (via Wilder’s RMA) and momentum (EMA deviation). You decide the weight of each.
• No repaint, no MTF pitfalls: Everything runs on the chart’s timeframe with bar-close confirmation; no request.security() or forward references.
• Actionable UI: A clean consensus line, optional regime background, confidence heat, and triangle markers when thresholds are crossed.
⸻
What you see on the chart
• Consensus line (0–100): Smoothed to your preference; color/area makes bull/bear zones obvious.
• Regime coloring (optional): Light green in bull zone, light red in bear zone; neutral otherwise.
• Confidence heat: A small gauge/number (0–100) that combines distance from neutral and recent persistence.
• Markers (optional): Triangles when consensus crosses up through your bull threshold (e.g., 55) or down through your bear threshold (e.g., 45).
• Info panel (optional): Consensus value, regime, confidence, number of agents, and basic diagnostics.
⸻
How it works (under the hood)
1. Horizon bins: The range is divided into numBins. Each bin has a fixed, simple integer length (crucial for Pine’s safety rules).
2. Per-bin features (computed every bar):
• RSI-style balance using Wilder’s RMA (not ta.rsi()), then mapped to −1…+1.
• Momentum as (close − EMA(L)) / EMA(L) (dimensionless drift).
3. Agent vote: For its assigned bin, an agent forms a weighted score: score = wRSI*RSI_like + wMOM*Momentum. A small dead-band near zero suppresses chop; votes are +1/−1/0.
4. Fitness update (bar close): If the agent’s previous vote agreed with the next bar’s direction, multiply its fitness by learnGain; otherwise by learnPain. Fitness is clamped so it never explodes or dies.
5. Consensus: Weighted average of all votes using fitness as weights → map to 0–100 and smooth with EMA.
Why it doesn’t repaint:
• No future references, no MTF resampling, fitness updates only on confirmed bars.
• All TA primitives (RMA/EMA/deltas) are computed every bar unconditionally.
⸻
Signals & confidence
• Bullish bias: consensus ≥ bullThr (e.g., 55).
• Bearish bias: consensus ≤ bearThr (e.g., 45).
• Confidence (0–100):
• Distance score: how far consensus is from 50.
• Momentum score: how strong the recent change is versus its recent average.
• Combined into a single gate; start filtering entries at ≥60 for higher quality.
Tip: For range sessions, raise thresholds (60/40) and increase smoothing; for momentum sessions, lower smoothing and keep thresholds at 55/45.
⸻
Inputs you’ll actually tune
• Agents & horizons:
• N_agents (e.g., 64–128)
• lenMin / lenMax (e.g., 6–30 intraday, 10–60 swing)
• numBins (e.g., 12–24)
• Weights & smoothing:
• wRSI vs wMOM (e.g., 0.7/0.3 for FX & indices; 0.6/0.4 for crypto)
• deadBand (0.03–0.08)
• consSmooth (3–8)
• Thresholds & hygiene:
• bullThr/bearThr (55/45 default)
• cooldownBars to avoid signal spam
⸻
Playbooks (ready-to-use)
1) Breakout / Trend continuation
• Timeframe: 15m–1h for day/swing.
• Filter: Take longs only when consensus > 55 and confidence ≥ 60.
• Execution: Use your ORB/VWAP/pullback trigger for entry. Trail with swing lows or 1.5×ATR. Exit on a close back under 50 or when a bearish signal prints.
2) Mean reversion (fade)
• When: Sideways days or low-volatility clusters.
• Setup: Increase deadBand and consSmooth.
• Signal: Bearish fades when consensus rolls over below ≈55 but stays above 50; bullish fades when it rolls up above ≈45 but stays below 50.
• Targets: The neutral zone (~50) as the first take-profit.
3) Multi-TF alignment
• Keep BioSwarm on 1H for bias, execute on 5–15m:
• Only take entries in the direction of the 1H consensus.
• Skip counter-bias scalps unless confidence is very low (explicit mean-reversion plan).
⸻
Integrations that work
• DynamoSent Pro+ (macro bias): Only act when macro bias and swarm consensus agree.
• ORB + Session VWAP Pro: Trade London/NY ORB breakouts that retest while consensus >55 (long) or <45 (short).
• Levels/Orderflow: BioSwarm is your “go / no-go”; execution stays with your usual triggers.
⸻
Quick start
1. Drop the indicator on a 1H chart.
2. Start with: N_agents=64, lenMin=6, lenMax=30, numBins=16, deadBand=0.06, consSmooth=5, thresholds 55/45.
3. Trade only when confidence ≥ 60.
4. Add your favorite execution tool (VWAP/levels/OR) for entries & exits.
⸻
Non-repainting & safety notes
• No request.security(); no hidden lookahead.
• Bar-close confirmation for fitness and signals.
• All TA calls are unconditional (no “sometimes called” warnings).
• No series-length inputs to RSI/EMA — we use RMA/EMA formulas that accept fixed simple ints per bin.
⸻
Known limits & tips
• Too many signals? Raise deadBand, increase consSmooth, widen thresholds to 60/40.
• Too few signals? Lower deadBand, reduce consSmooth, narrow thresholds to 53/47.
• Over-fitting risk: Keep learnGain/learnPain modest (e.g., ×1.04 / ×0.96).
• Compute load: Large N_agents × numBins is heavier; scale to your device.
⸻
Example recipes
EURUSD 1H (swing):
lenMin=8, lenMax=34, numBins=16, wRSI=0.7, wMOM=0.3, deadBand=0.06, consSmooth=6, thr=55/45
Buy breakouts when consensus >55 and confidence ≥60; confirm with 5–15m pullback to VWAP or level.
SPY 15m (US session):
lenMin=6, lenMax=24, numBins=12, consSmooth=4, deadBand=0.05
On trend days, stay with longs as long as consensus >55; add on shallow pullbacks.
BTC 1H (24/7):
Increase momentum weight: wRSI=0.6, wMOM=0.4, extend lenMax to ~50. Use dynamic stops (ATR) and partials on strong verticals.
⸻
Final word
BioSwarm is a state engine: it tells you when the market is primed to continue or mean-revert. Pair it with your entries and risk framework to turn that state into trades. If you’d like, I can supply a companion strategy template that consumes the consensus and back-tests the three playbooks (Breakout/Fade/Flip) with standard risk management.

Whale Money Flow DetectorKey Components:
Volume Analysis: Detects unusual volume spikes compared to average
Money Flow Index: Shows buying vs selling pressure
Whale Detection: Identifies large moves with high volume
Cumulative Flow: Tracks net whale activity over time
Visual Signals: Background colors and whale emoji labels
What it detects:
Large volume transactions (configurable multiplier)
Significant price moves with corresponding volume
Buying vs selling pressure from large players
Cumulative whale flow momentum
Customizable Parameters:
Volume MA Length (default: 20)
Whale Volume Multiplier (default: 2.0x)
Money Flow Length (default: 14)
Detection Sensitivity (default: 1.5)
Visual Features:
Green background for whale buying
Red background for whale selling
Whale emoji labels on significant moves
Real-time stats table
Multiple plot lines for different metrics
How to use:
Copy the code to TradingView's Pine Editor
Apply to your chart
Adjust sensitivity settings based on your asset's behavior
Set up alerts for whale buy/sell signals

Dual Best MA Strategy AnalyzerDual Best MA Strategy Analyzer (Lookback Window)
What it does
This indicator scans a range of moving-average lengths and finds the single best MA for long crossovers and the single best MA for short crossunders over a fixed lookback window. It then plots those two “winner” MAs on your chart:
Best Long MA (green): The MA length that would have made the highest total profit using a simple “price crosses above MA → long; exit on cross back below” logic.
Best Short MA (red): The MA length that would have made the highest total profit using “price crosses below MA → short; exit on cross back above.”
You can switch between SMA and EMA, set the min/max length, choose a step size, and define the lookback window used for evaluation.
How it works (brief)
For each candidate MA length between Min MA Length and Max MA Length (stepping by Step Size), the script:
Builds the MA (SMA or EMA).
Simulates a naïve crossover strategy over the last Lookback Window candles:
Long model: enter on crossover, exit on crossunder.
Short model: enter on crossunder, exit on crossover.
Sums simple P&L in price units (no compounding, no fees/slippage).
Picks the best long and best short lengths by total P&L and plots those two MAs.
Note: Long and short are evaluated independently. The script plots MAs only; it doesn’t open positions.
Inputs
Min MA Length / Max MA Length – Bounds for MA search.
Step Size – Spacing between tested lengths (e.g., 10 tests 10, 20, 30…).
Use EMA instead of SMA – Toggle average type.
Lookback Window (candles) – Number of bars used to score each MA. Needs enough history to be meaningful.
What the plots mean
Best Long MA (green): If price crosses above this line (historically), that MA length produced the best long-side results over the lookback.
Best Short MA (red): If price crosses below this line (historically), that MA length produced the best short-side results.
These lines can change over time as new bars enter the lookback window. Think of them as adaptive “what worked best recently” guides, not fixed signals.
Practical tips
Timeframe matters: Run it on the timeframe you trade; the “best” length on 1h won’t match 1m or 1D.
Step size trade-off: Smaller steps = more precision but heavier compute. Larger steps = faster scans, coarser choices.
Use with confirmation: Combine with structure, volume, or volatility filters. This is a single-factor tester.
Normalization: P&L is in raw price units. For cross-symbol comparison, consider using one symbol at a time (or adapt the script to percent P&L).
Limitations & assumptions
No fees, funding, slippage, or position sizing.
Simple “in/out” on the next crossover; no stops/targets/filters.
Results rely on lookback choice and will repaint historically as the “best” length is re-selected with new data (the plot is adaptive, not forward-fixed).
The script tests up to ~101 candidates internally (bounded by your min/max/step).
Good uses
Quickly discover a recently effective MA length for trend following.
Compare SMA vs EMA performance on your market/timeframe.
Build a playbook: note which lengths tend to win in certain regimes (trending vs choppy).
Not included (by design)
Alerts, entries/exits, or a full strategy report. It’s an analyzer/overlay.
If you want alerts, you can add simple conditions like:
ta.crossover(close, plotLongMA) for potential long interest
ta.crossunder(close, plotShortMA) for potential short interest
Changelog / Notes
v1: Initial release. Array-based scanner, SMA/EMA toggle, adaptive long/short best MA plots, user-set lookback.
Disclaimer
This is educational tooling, not financial advice. Test thoroughly and use proper risk management.

Structural Liquidity Signals [BullByte]Structural Liquidity Signals (SFP, FVG, BOS, AVWAP)
Short description
Detects liquidity sweeps (SFPs) at pivots and PD/W levels, highlights the latest FVG, tracks AVWAP stretch, arms percentile extremes, and triggers after confirmed micro BOS.
Full description
What this tool does
Structural Liquidity Signals shows where price likely tapped liquidity (stop clusters), then waits for structure to actually change before it prints a trigger. It spots:
Liquidity sweeps (SFPs) at recent pivots and at prior day/week highs/lows.
The latest Fair Value Gap (FVG) that often “pulls” price or serves as a reaction zone.
How far price is stretched from two VWAP anchors (one from the latest impulse, one from today’s session), scaled by ATR so it adapts to volatility.
A “percentile” extreme of an internal score. At extremes the script “arms” a setup; it only triggers after a small break of structure (BOS) on a closed bar.
Originality and design rationale, why it’s not “just a mashup”
This is not a mashup for its own sake. It’s a purpose-built flow that links where liquidity is likely to rest with how structure actually changes:
- Liquidity location: We focus on areas where stops commonly cluster—recent pivots and prior day/week highs/lows—then detect sweeps (SFPs) when price wicks beyond and closes back inside.
- Displacement context: We track the last Fair Value Gap (FVG) to account for recent inefficiency that often acts as a magnet or reaction zone.
- Stretch measurement: We anchor VWAP to the latest N-bar impulse and to the Daily session, then normalize stretch by ATR to assess dislocation consistently across assets/timeframes.
- Composite exhaustion: We combine stretch, wick skew, and volume surprise, then bend the result with a tanh transform so extremes are bounded and comparable.
- Dynamic extremes and discipline: Rather than triggering on every sweep, we “arm” at statistical extremes via percent-rank and only fire after a confirmed micro Break of Structure (BOS). This separates “interesting” from “actionable.”
Key concepts
SFP (liquidity sweep): A candle briefly trades beyond a level (where stops sit) and closes back inside. We detect these at:
Pivots (recent swing highs/lows confirmed by “left/right” bars).
Prior Day/Week High/Low (PDH/PDL/PWH/PWL).
FVG (Fair Value Gap): A small 3‑bar gap (bar2 high vs bar1 low, or vice versa). The latest gap often acts like a magnet or reaction zone. We track the most recent Up/Down gap and whether price is inside it.
AVWAP stretch: Distance from an Anchored VWAP divided by ATR (volatility). We use:
Impulse AVWAP: resets on each new N‑bar high/low.
Daily AVWAP: resets each new session.
PR (Percentile Rank): Where the current internal score sits versus its own recent history (0..100). We arm shorts at high PR, longs at low PR.
Micro BOS: A small break of the recent high (for longs) or low (for shorts). This is the “go/no‑go” confirmation.
How the parts work together
Find likely liquidity grabs (SFPs) at pivots and PD/W levels.
Add context from the latest FVG and AVWAP stretch (how far price is from “fair”).
Build a bounded score (so different markets/timeframes are comparable) and compute its percentile (PR).
Arm at extremes (high PR → short candidate; low PR → long candidate).
Only print a trigger after a micro BOS, on a closed bar, with spacing/cooldown rules.
What you see on the chart (legend)
Lines:
Teal line = Impulse AVWAP (resets on new N‑bar extreme).
Aqua line = Daily AVWAP (resets each session).
PDH/PDL/PWH/PWL = prior day/week levels (toggle on/off).
Zones:
Greenish box = latest Up FVG; Reddish box = latest Down FVG.
The shading/border changes after price trades back through it.
SFP labels:
SFP‑P = SFP at Pivot (dotted line marks that pivot’s price).
SFP‑L = SFP at Level (at PDH/PDL/PWH/PWL).
Throttle: To reduce clutter, SFPs are rate‑limited per direction.
Triggers:
Triangle up = long trigger after BOS; triangle down = short trigger after BOS.
Optional badge shows direction and PR at the moment of trigger.
Optional Trigger Zone is an ATR‑sized box around the trigger bar’s close (for visualization only).
Background:
Light green/red shading = a long/short setup is “armed” (not a trigger).
Dashboard (Mini/Pro) — what each item means
PR: Percentile of the internal score (0..100). Near 0 = bullish extreme, near 100 = bearish extreme.
Gauge: Text bar that mirrors PR.
State: Idle, Armed Long (with a countdown), or Armed Short.
Cooldown: Bars remaining before a new setup can arm after a trigger.
Bars Since / Last Px: How long since last trigger and its price.
FVG: Whether price is in the latest Up/Down FVG.
Imp/Day VWAP Dist, PD Dist(ATR): Distance from those references in ATR units.
ATR% (Gate), Trend(HTF): Status of optional regime filters (volatility/trend).
How to use it (step‑by‑step)
Keep the Safety toggles ON (default): triggers/visuals on bar‑close, optional confirmed HTF for trend slope.
Choose timeframe:
Intraday (5m–1h) or Swing (1h–4h). On very fast/thin charts, enable Performance mode and raise spacing/cooldown.
Watch the dashboard:
When PR reaches an extreme and an SFP context is present, the background shades (armed).
Wait for the trigger triangle:
It prints only after a micro BOS on a closed bar and after spacing/cooldown checks.
Use the Trigger Zone box as a visual reference only:
This script never tells you to buy/sell. Apply your own plan for entry, stop, and sizing.
Example:
Bullish: Sweep under PDL (SFP‑L) and reclaim; PR in lower tail arms long; BOS up confirms → long trigger on bar close (ATR-sized trigger zone shown).
Bearish: Sweep above PDH/pivot (SFP‑L/P) and reject; PR in upper tail arms short; BOS down confirms → short trigger on bar close (ATR-sized trigger zone shown).
Settings guide (with “when to adjust”)
Safety & Stability (defaults ON)
Confirm triggers at bar close, Draw visuals at bar close: Keep ON for clean, stable prints.
Use confirmed HTF values: Applies to HTF trend slope only; keeps it from changing until the HTF bar closes.
Performance mode: Turn ON if your chart is busy or laggy.
Core & Context
ATR Length: Bigger = smoother distances; smaller = more reactive.
Impulse AVWAP Anchor: Larger = fewer resets; smaller = resets more often.
Show Daily AVWAP: ON if you want session context.
Use last FVG in logic: ON to include FVG context in arming/score.
Show PDH/PDL/PWH/PWL: ON to see prior day/week levels that often attract sweeps.
Liquidity & Microstructure
Pivot Left/Right: Higher values = stronger/rarer pivots.
Min Wick Ratio (0..1): Higher = only more pronounced SFP wicks qualify.
BOS length: Larger = stricter BOS; smaller = quicker confirmations.
Signal persistence: Keeps SFP context alive for a few bars to avoid flicker.
Signal Gating
Percent‑Rank Lookback: Larger = more stable extremes; smaller = more reactive extremes.
Arm thresholds (qHi/qLo): Move closer to 0.5 to see more arms; move toward 0/1 to see fewer arms.
TTL, Cooldown, Min bars and Min ATR distance: Space out triggers so you’re not reacting to minor noise.
Regime Filters (optional)
ATR percentile gate: Only allow triggers when volatility is at/above a set percentile.
HTF trend gate: Only allow longs when the HTF slope is up (and shorts when it’s down), above a minimum slope.
Visuals & UX
Only show “important” SFPs: Filters pivot SFPs by Volume Z and |Impulse stretch|.
Trigger badges/history and Max badge count: Control label clutter.
Compact labels: Toggle SFP‑P/L vs full names.
Dashboard mode and position; Dark theme.
Reading PR (the built‑in “oscillator”)
PR ~ 0–10: Potential bullish extreme (long side can arm).
PR ~ 90–100: Potential bearish extreme (short side can arm).
Important: “Armed” ≠ “Enter.” A trigger still needs a micro BOS on a closed bar and spacing/cooldown to pass.
Repainting, confirmations, and HTF notes
By default, prints wait for the bar to close; this reduces repaint‑like effects.
Pivot SFPs only appear after the pivot confirms (after the chosen “right” bars).
PD/W levels come from the prior completed candles and do not change intraday.
If you enable confirmed HTF values, the HTF slope will not change until its higher‑timeframe bar completes (safer but slightly delayed).
Performance tips
If labels/zones clutter or the chart lags:
Turn ON Performance mode.
Hide FVG or the Trigger Zone.
Reduce badge history or turn badge history off.
If price scaling looks compressed:
Keep optional “score”/“PR” plots OFF (they overlay price and can affect scaling).
Alerts (neutral)
Structural Liquidity: LONG TRIGGER
Structural Liquidity: SHORT TRIGGER
These fire when a trigger condition is met on a confirmed bar (with defaults).
Limitations and risk
Not every sweep/extreme reverses; false triggers occur, especially on thin markets and low timeframes.
This indicator does not provide entries, exits, or position sizing—use your own plan and risk control.
Educational/informational only; no financial advice.
License and credits
© BullByte - MPL 2.0. Open‑source for learning and research.
Built from repeated observations of how liquidity runs, imbalance (FVG), and distance from “fair” (AVWAPs) combine, and how a small BOS often marks the moment structure actually shifts.

PolyFilter [BackQuant]PolyFilter
A flexible, low-lag trend filter with three smoothing engines—optimized for clean bias, fewer whipsaws, and clear alerting.
What it does
PolyFilter draws a single “intelligent” baseline that adapts to price while suppressing noise. You choose the engine— Fractional MA , Ehlers 2-Pole Super Smoother , or a Multi-Kernel blend . The line can color itself by slope (trend) or by position vs price (above/below), and you get four ready-made alerts for flips and crosses.
What it plots
PolyFilter line — your smoothed trend baseline (width set by “Line Width”).
Optional candle & background coloring — choose: color by trend slope or by whether price is above/below the filter.
Signal markers — Arrows with L/S when the slope flips or when price crosses the line (if you enable shapes/alerts).
How the three engines differ
Fractional MA (experimental) — A power-law weighting of past bars (heavier focus on the most recent samples without throwing away history). The Adaptation Speed acts like the “fraction” exponent (default 0.618). Lower values lean more on recent bars; higher values spread weight further back.
Ehlers 2-Pole Super Smoother — Classic low-lag IIR smoother that aggressively reduces high-frequency noise while preserving turns. Great default when you want a steady, responsive baseline with minimal parameter fuss.
Multi-Kernel — A 70/30 blend of a Gaussian window and an exponential kernel. The Gaussian contributes smooth structure; the exponential adds a hint of responsiveness. Useful for assets that oscillate but still trend.
Reading the colors
Trend mode (default) — Line & candles turn green while the filter is rising (signal > signal ) and red while it’s falling.
Above/Below mode — Line & candles reflect price’s position relative to the filter: green when price > filter, red when price < filter. This is handy if you treat the filter like a dynamic “fair value” or bias line.
Inputs you’ll actually use
Calculation Settings
Price Source — Default HLC/3. Switch to Close for stricter trend, or HLC3/HL2 to soften single-print spikes.
Filter Length — Window/period for all engines. Shorter = snappier turns; longer = smoother line.
Adaptation Speed — Only affects Fractional MA . Lower it for faster, more local weighting; raise it for smoother, more global weighting.
Filter Type — Pick one of: Fractional MA, Ehlers 2-Pole, Multi-Kernel.
UI & Plotting
Color based off… — Choose Trend (slope) or > or < Close (position vs price).
Long/Short Colors — Customize bull/bear hues to your theme.
Show Filter Line / Paint candles / Color background — Visual toggles for the line, bars, and backdrop.
Line Width — Make the filter stand out (2–3 works well on most charts).
Signals & Alerts
PolyFilter Trend Up — Slope flips upward (the filter crosses above its prior value). Good for early continuation entries or stop-tightening on shorts.
PolyFilter Trend Down — Slope flips downward. Often used to scale out longs or rotate bias.
PolyFilter Above Price — The filter line crosses up through price (filter > price). This can confirm that mean has “caught up” after a pullback.
PolyFilter Below Price — The filter line crosses down through price (filter < price). Useful to confirm momentum loss on bounces.
Quick starts (suggested presets)
Intraday (5–15m, crypto or indices) — Ehlers 2-Pole, Length 55–80. Trend coloring ON, candle paint ON. Look for pullbacks to a rising filter; avoid fading a falling one.
Swing (1H–4H) — Multi-Kernel, Length 80–120. Background color OFF (cleaner), candle paint ON. Add a higher-TF confirmation (e.g., 4H filter rising when you trade 1H).
Range-prone FX — Fractional MA, Length 70–100, Adaptation ~0.55–0.70. Consider Above/Below mode to trade mean reversion to the line with a strict risk cap.
How to use it in practice
Bias line — Trade in the direction of the filter slope; stand aside when it flattens and color chops back and forth.
Dynamic support/resistance — Treat the line as a moving value area. In trends, entries often appear on shallow tags of the line with structure confluence.
Regime switch — When the filter flips and holds color for several bars, tighten stops on the opposing side and look for first pullback in the new color.
Stacking filters — Many users run PolyFilter on the active chart and a slower instance (longer length) on a higher timeframe as a “macro bias” guardrail.
Tuning tips
If you see too many flips, lengthen the filter or switch to Multi-Kernel.
If turns feel late, shorten the filter or try Ehlers 2-Pole for lower lag.
On thin or very noisy symbols, prefer HLC3 as the source and longer lengths.
Performance note: very large lengths increase computation time for the Multi-Kernel and Fractional engines. Start moderate and scale up only if needed.
Summary
PolyFilter gives you a single, trustworthy baseline that you can read at a glance—either as a pure trend line (slope coloring) or as a dynamic “above/below fair value” reference. Pick the engine that matches your market’s personality, set a sensible length, and let the color and alerts guide bias, entries on pullbacks, and risk on reversals.

EMA+RSI Buy/Sell with Fibonacci GuideSingle-Instance EUR/USD & GBP/USD Trend+MACD ATR EA
Purpose:
This EA is designed for automated Forex trading on EUR/USD and GBP/USD. It identifies trend-based trading opportunities, dynamically calculates position sizes based on your available capital and risk percentage, and manages trades with ATR-based stop-loss and take-profit levels, including optional trailing stops.
Key Features:
Auto Pair Selection:
Compares the trend strength of EUR/USD vs GBP/USD using a combination of EMA slopes and MACD direction.
Automatically trades the stronger trending pair.
Trend & Signal Detection:
Uses Fast EMA / Slow EMA crossover for trend direction.
Confirms trend with MACD line vs signal line.
Generates long and short signals only when trend and MACD align.
Dynamic SL/TP:
Stop-loss and take-profit are calculated based on ATR (Average True Range).
Supports optional trailing stops to lock in profits.
Position Sizing:
Automatically calculates micro-lot sizes based on your capital and risk percentage.
Ensures risk per trade does not exceed the defined % of your account equity.
Chart Visualization:
Plots Fast EMA / Slow EMA.
Displays SL and TP levels on the chart.
Shows a label indicating the active pair currently being traded.
Alerts:
Generates alerts for long and short signals.
Can be used with TradingView alerts to notify or trigger webhooks.
Single Strategy Instance:
Fully compatible with Pine Script v6.
Only one strategy instance runs on the chart to prevent “too many strategies” errors.

Small-Cap — Sell Every Spike (Rendon1) Small-Cap — Sell Every Spike v6 — Strict, No Look-Ahead
Educational use only. This is not financial advice or a signal service.
This strategy targets low/ mid-float runners (≤ ~20M) that make parabolic spikes. It shorts qualified spikes and scales out into flushes. Logic is deliberately simple and transparent to avoid curve-fit.
What the strategy does
Detects a parabolic up move using:
Fast ROC over N bars
Big range vs ATR
Volume spike vs SMA
Fresh higher high (no stale spikes)
Enters short at bar close when conditions are met (no same-bar fills).
Manages exits with ATR targets and optional % covers.
Tracks float rotation intraday (manual float input) and blocks trades above a hard limit.
Draws daily spike-high resistance from confirmed daily bars (no repaint / no look-ahead).
Timeframes & market
Designed for 1–5 minute charts.
Intended for US small-caps; turn Premarket on.
Works intraday; avoid illiquid tickers or names with constant halts.
Entry, Exit, Risk (short side)
Entry: parabolic spike (ROC + Range≥ATR×K + Vol≥SMA×K, new HH).
Optional confirmations (OFF by default to “sell every spike”): upper-wick and VWAP cross-down.
Stop: ATR stop above entry (default 1.2× ATR).
Targets: TP1 = 1.0× ATR, TP2 = 2.0× ATR + optional 10/20/30% covers.
Safety: skip trades if RVOL is low or Float Rotation exceeds your limit (default warn 5×, hard 7×).
Inputs (Balanced defaults)
Price band: $2–$10
Float Shares: set per ticker (from Finviz).
RVOL(50) ≥ 1.5×
ROC(5) ≥ 1.0%, Range ≥ 1.6× ATR, Vol ≥ 1.8× SMA
Cooldown: 10 bars; Max trades/day: 6
Optional: Require wick (≥35%) and/or Require VWAP cross-down.
Presets suggestion:
• Balanced (defaults above)
• Safer: wick+VWAP ON, Range≥1.8×, trades/day 3–4
• Micro-float (<5M): ROC 1.4–1.8%, Range≥1.9–2.2×, Vol≥2.2×, RVOL≥2.0, wick 40–50%
No look-ahead / repaint notes
Daily spike-highs use request.security(..., lookahead_off) and shifted → only closed daily bars.
Orders arm next bar after entry; entries execute at bar close.
VWAP/ATR/ROC/Vol/RVOL are computed on the chart timeframe (no HTF peeking).
How to use
Build a watchlist: Float <20M, RelVol >2, Today +20% (Finviz).
Open 1–5m chart, enter Float Shares for the ticker.
Start with Balanced, flip to Safer on halty/SSR names or repeated VWAP reclaims.
Scale out into flushes; respect the stop and rotation guard.
Limitations & risk
Backtests on small-caps can be optimistic due to slippage, spreads, halts, SSR, and limited premarket data. Always use conservative sizing. Low-float stocks can squeeze violently.
Alerts
Parabolic UP (candidate short)
SHORT Armed (conditions met; entry at bar close)

Liquidity Void Detector (Zeiierman)█ Overview
Liquidity Void Detector (Zeiierman) is an oscillator highlighting inefficient price displacements under low participation. It measures the most recent price move (standardized return) and amplifies it only when volume is below its own trend.
Positive readings ⇒ strong up-move on low volume → potential Buy-Side Imbalance (void below) that often refills.
Negative readings ⇒ strong down-move on low volume → potential Sell-Side Imbalance (void above) that often refills.
This tool provides a quantitative “void” proxy: when price travels far with unusually thin volume, the move is flagged as likely inefficient and prone to mean-reversion/mitigation.
█ How It Works
⚪ Volume Shock (Participation Filter)
Each bar, volume is compared to a rolling baseline. This is then z-scored.
// Volume Shock calculation
volTrend = ta.sma(volume, L)
vs = (volume > 0 and volTrend > 0) ? math.log(volume) - math.log(volTrend) : na
vsZ = zScore(vs, vzLen) // z-scored volume shock
lowVS = (vsZ <= vzThr) // low-volume condition
Bars with VolShock Z ≤ threshold are treated as low-volume (thin).
⚪ Prior Return Extremeness
The 1-bar log return is computed and z-scored.
// Prior return extremeness
r1 = math.log(close / close )
retZ = zScore(r1, rLen) // z-scored prior return
This shows whether the latest move is unusually large relative to recent history.
⚪ Void Oscillator
The oscillator is:
// Oscillator construction
weight = lowVS ? 1.0 : fadeNoLow
osc = retZ * weight
where Weight = 1 when volume is low, otherwise fades toward a user-set factor (0–1).
Osc > 0: up-move emphasized under low volume ⇒ Buy-Side Imbalance.
Osc < 0: down-move emphasized under low volume ⇒ Sell-Side Imbalance.
█ Why Use It
⚪ Targets Inefficient Moves
By filtering for low participation, the oscillator focuses on moves most likely driven by thin books/noise trading, which are statistically more likely to retrace.
⚪ Simple, Robust Logic
No need for tick data or order-book depth. It derives a practical void proxy from OHLCV, making it portable across assets and timeframes.
⚪ Complements Price-Action Tools
Use alongside FVG/imbalance zones, key levels, and volume profile to prioritize voids that carry the highest reversal probability.
█ How to Use
Sell-Side Imbalance = aggressive sell move (price goes down on low volume) → expect price to move up to fill it.
Buy-Side Imbalance = aggressive buy move (price goes up on low volume) → expect price to move down to fill it.
█ Settings
Volume Baseline Length — Bars for the volume trend used in VolShock. Larger = smoother baseline, fewer low-volume flags.
Vol Shock Z-Score Lookback — Bars to standardize VolShock; larger = smoother, fewer extremes.
Low-Volume Threshold (VolShock Z ≤) — Defines “thin participation.” Typical: −0.5 to −1.0.
Return Z-Score Lookback — Bars to standardize the 1-bar log return; larger = smoother “extremeness” measure.
Fade When Volume Not Low (0–1) — Weight applied when volume is not low. 0.00 = ignore non-low-volume bars entirely. 1.00 = treat volume condition as irrelevant (pure return extremeness).
Upper Threshold (Osc ≥) — Trigger for Sell-Side Imbalance (void below).
Lower Threshold (Osc ≤) — Trigger for Buy-Side Imbalance (void above).
-----------------
Disclaimer
The content provided in my scripts, indicators, ideas, algorithms, and systems is for educational and informational purposes only. It does not constitute financial advice, investment recommendations, or a solicitation to buy or sell any financial instruments. I will not accept liability for any loss or damage, including without limitation any loss of profit, which may arise directly or indirectly from the use of or reliance on such information.
All investments involve risk, and the past performance of a security, industry, sector, market, financial product, trading strategy, backtest, or individual's trading does not guarantee future results or returns. Investors are fully responsible for any investment decisions they make. Such decisions should be based solely on an evaluation of their financial circumstances, investment objectives, risk tolerance, and liquidity needs.

8MA Compass — HTF map + GC/DC cues8MA Compass provides a clean trend context by combining strict 4-of-4 confluence (Current TF vs Higher TF) with SMA200 repainting on Golden/Death Cross (GC/DC).
What it shows
4-of-4 background (context): compares EMA10, EMA20, SMA50, SMA200 on the Current TF against the same four MAs on the Higher TF (HTF).
All 4 above their HTF values → bullish background.
All 4 below their HTF values → bearish background.
SMA200 color on GC/DC (Current TF):
Last signal is DC and price below SMA200 → SMA200 turns red.
Price above SMA200 but the last signal is DC (no GC afterward) → SMA200 stays base color.
Last signal is GC and price above SMA200 → SMA200 turns green #089981.
Why “8MA” ? The 4-of-4 logic uses 8 moving averages in total: 4 on the Current TF and 4 on the HTF (EMA10/20 and SMA50/200 on both frames). HTF EMAs are used in calculations but are not plotted by default—hence the name 8MA Compass.
Auto HTF mapping
Current 1H → HTF 4H
Current 4H → HTF 1D
Current 1D → HTF 1W
All other timeframes: HTF defaults to Current TF (4-of-4 will typically be neutral).
Manual mode: choose any HTF. If Manual HTF equals Current TF, HTF SMAs are hidden to avoid overlap.
Settings
1. Display
Show CURRENT TF — plot EMA10/20, SMA50/200 on Current TF.
Show HARD TF — plot SMA50/200 on HTF (hidden if HTF == Current TF).
HTF mode — Auto / Manual, with Hard TF (Manual) selector.
2. Filter
Show base background (4-of-4) — enable/disable confluence shading.
Epsilon (in ticks) — small tolerance in Cur vs HTF comparisons to reduce flicker.
3. Golden/Death
Color SMA200 on GC/DC (Cur TF) — repaint SMA200 on GC/DC per rules above (enabled by default).
Alerts
GC/DC (Current TF, SMA50/200): Golden Cross / Death Cross (on bar close).
EMA10/20 (Current TF): “Bull regime ON” / “Bear regime ON” on crossovers.
Optional HTF GC/DC alerts (SMA50/200 on chosen HTF).
Visual details
HTF SMA50/200 are drawn first; Current TF lines are drawn on top for clarity.
SMA200 (Current TF) is drawn last (and slightly thicker) to remain readable.
HTF EMAs are used in 4-of-4 logic but not plotted by design.
Usage
1. Use the 4-of-4 background as inter-timeframe momentum context.
2. Use SMA200 color to gauge long-term regime confirmation:
Prefer longs when last GC and price holds above SMA200 (#089981 line).
Avoid longs when last DC and price is below SMA200 (red line).
Disclaimer : For educational purposes only. Not financial advice. Trading involves risk.

Confluence Engine Confluence Engine is a practical, non-repainting decision aid that scores market conditions from −100…+100 by combining six proven modules: Trend, Momentum, Volatility, Volume, Structure, and an HTF confirmation. It’s designed for crypto, forex, indices, and stocks, and it fires entries only on confirmed bar closes.
What’s inside
Trend: EMA 20/50/200 alignment plus a Supertrend/KAMA toggle (you choose the baseline).
Momentum: RSI + MACD with confirmed-pivot divergence detection.
Volatility: ATR% and Bollinger Band width vs its average to favor expansion over chop.
Volume: OBV-style cumulative flow slope + volume surge vs SMA×multiplier.
Market Structure: Confirmed pivots, BOS (break of structure) and CHOCH (change of character).
HTF Filter: Closed higher-timeframe context via request.security(..., barmerge.gaps_on, barmerge.lookahead_off).
Why it does not repaint
Signals are computed and plotted on closed bars only.
Pivots/divergences use confirmed pivot points (no forward look).
HTF series are fetched with lookahead_off and use the last closed HTF bar in realtime.
No future bar references are used for entries or alerts.
How to use (3 steps)
Pick a timeframe pair: use a 4–6× HTF multiplier (5m→30m, 15m→1h, 1h→4h, 4h→1D, 1D→1W).
Trade with the HTF: take longs only when the HTF filter is bullish; shorts only when bearish.
Prefer expansion: act when BB width > its average and ATR% is elevated; skip most signals in compression.
Suggested presets (start here)
Crypto (BTC/ETH): 15m→1h, 1h→4h. stLen=10, stMult=3.0, bbLen=20, surgeMul=1.8–2.2, thresholds +40 / −40 (intraday can try +35 / −35).
Forex majors: 15m→1h, 1h→4h. stLen=10–14, stMult=2.5–3.0, surgeMul=1.5–1.8, thresholds +35 / −35 (swing: +45 / −45).
US equities (liquid): 5m→30m/1h, 15m→1h/2h. stMult=3.0–3.5, surgeMul=1.6–2.0, thresholds +45 / −45 to reduce chop.
Indices (ES/NQ): 5m→30m, 15m→1h. Defaults are fine; start at +40 / −40.
Gold/Oil: 15m→1h, 1h→4h. Thresholds +35 / −35, surgeMul=1.6–1.9.
Inputs (plain English)
Use Supertrend (off = KAMA): choose the trend baseline.
EMA Fast/Mid/Slow: 20/50/200 by default for classic stack.
RSI/MACD + divergence pivots: momentum and exhaustion context.
ATR Length & BB Length: volatility regime detection.
Volume SMA & Surge Multiplier: defines “meaningful” volume spikes.
Pivot left/right & “Confirm BOS/CHOCH on Close”: structure strictness.
Enable HTF & Higher Timeframe: confirms the lower timeframe direction.
Thresholds (+long / −short): when the score crosses these, you get signals.
Signals & alerts (IDs preserved)
Entry shapes plot at bar close when the score crosses thresholds.
Alerts you can enable:
CONFLUENCE LONG — long entry signal
CONFLUENCE SHORT — short entry signal
BULLISH BIAS — score turned positive
BEARISH BIAS — score turned negative
Best practices
Focus on signals with HTF agreement and volatility expansion; require volume participation (surge or rising OBV slope) for higher quality.
Raise thresholds (+45/−45 or +50/−50) to reduce whipsaws in choppy sessions.
Lower thresholds (+35/−35) only if you also require volatility/volume filters.
Performance & scope
Works across crypto/FX/equities/indices; no broker data or special feeds required.
No repainting by design; signals/alerts are computed on closed bars.
As with any tool, results vary by regime; always combine with risk management.
Disclosure
This script is for educational purposes only and is not financial advice. Trading involves risk. Test on historical data and paper trade before using live.

LP Sweep / Reclaim & Breakout Grading: Long-onlySignals
1) LP Sweep & Reclaim (mean-reversion entry)
Compute LP bounds from prior-bar window extremes:
lpLL_prev = lowest low of the last N bars (offset 1).
lpHH_prev = highest high of the last N bars (offset 1).
Sweep long trigger: current low dips below lpLL_prev and closes back above it.
Real-time quality grading (A/B/C) for sweep:
Trend filter & slope via EMA(88).
BOS bonus: close > last confirmed swing high.
Body size vs ATR, location above a long EMA, headroom to swing high (penalty if too close), and multi-sweep count bonus.
Sum → score → grade A/B/C; A or B required for sweep entry.
2) Trend Breakout (momentum entry)
Core trigger: close > previous Donchian high (length boLen) + ATR buffer.
Optional filter: close must be above the default EMA.
Breakout grading (A/B/C) in real time combining:
Trend up (price > EMA and EMA rising),
Body/ATR, Gap above breakout level (in ATR),
Volume vs MA,
Upper-wick penalty,
Position-in-Score: headroom to last swing high (penalty if too near) + EMA slope bonus.
Sum → score → A or B required if grading enabled.

Transformer Flux DashboardHere’s a practical guide to what your Transformer Flux Dashboard does and how to use it.
What it is
A compact, two-column trading dashboard + signal pack that blends trend, MACD, and OBV into one view (“Flux Score”) and adds session awareness (pre-sessions and main sessions in Eastern time). It’s designed for regular candles by default and avoids repaint by letting you confirm on bar close.
Core pieces it calculates
Moving Averages
Two MAs: Fast (HMA/EMA) and Slow (HMA/EMA).
You choose length, line width, color, and transparency.
Trend engine (Strict/Lenient)
Uses the relation between Fast/Slow MA and a debounced fast-MA slope filter (slope > ATR×buffer).
Strict: requires fast>slow and slow rising (or the inverse for down).
Lenient: fast>slow or slow rising (or the inverse).
A confirmation window (bars) must hold true before trend flips. That window can be auto-tuned by session (Asia/London/NY) or set globally.
OBV confirmation (optional)
OBV smoothed by SMA; needs to be rising/falling for N bars (also session-aware if you enable presets).
MACD
Standard MACD Fast/Slow/Signal; the dashboard shows Bull ▲, Bear ▼ or Flat based on line vs signal.
Flux Score (top row)
A composite, smoothed gauge from 0–100:
40% Trend, 30% MACD, 30% OBV → EMA(3) smoothed.
Labels: Bullish ≥ 70, Bearish ≤ 30, otherwise Neutral.
Summary line explains why (e.g., “MACD↑, OBV↑, Trend up”).
Sessions & zones (Eastern/NY time)
Recognizes Asia / London / New York main sessions and pre-sessions using your chart’s Eastern time.
Session label (top of chart): text is white; background auto-matches the current session color (or your manual color).
Zone backgrounds (optional): off by default; when on, default transparency ≈ 95% (very light), with separate colors for each session and pre-session. A toggle lets you draw pre-session on top or beneath main sessions.
Signals & markers
Two strength tiers: Strong (Trend + OBV + MACD aligned) and Weak (2 of the 3 agree).
To reduce clutter, markers only appear on direction shifts (from last visible direction to a new one), and you can enforce a minimum bar gap.
Marker style:
Default Icons with LabelUp/LabelDown (tiny).
Colors: strong long = bright white by default; others configurable.
Weak markers are slightly offset from price using ATR so they don’t overlap wicks.
Dashboard (2-column)
Left column = label, right column = value:
Flux Score: numeric + Bullish/Neutral/Bearish tag.
Summary: short reason of the score.
Trend: UP / DOWN / FLAT (cell tinted green/red/gray).
MACD: Bull ▲ / Bear ▼ / Flat (tinted).
Signal: last printed signal + bar age (fresh signals get a lighter tint).
MA: slow MA type/length and up/down arrow.
Sess: current session label (e.g., “Pre-London”, “New York”).
VIX / VXN (optional): shows current value.
Auto tint: based on calm/watch/elevated thresholds (you control levels and colors).
Manual tint: fixed BG color if you prefer consistency.
Params: “P”=trend bars, “O”=OBV bars, mode (Strict/Lenient), and “Candles”.
You can set a global Default Transparency for the dashboard cells.
Key settings to know
Confirm On Close: when on (default), trend/OBV/MACD states use the last confirmed bar; this avoids mid-bar flicker and reduces repaint risk.
Session presets: when enabled, the number of bars required for confirmations tightens/loosens per session (e.g., Asia uses more bars than NY).
Colors & Opacity:
MA lines have their own transparency (default 0 = fully opaque).
Dashboard cells use a single global transparency (default 40%).
Session zones default to very light (95%) and are off by default.
VIX/VXN cells can auto-color by regime or use a manual background.
Markers:
“Icons” vs “Ticks.” Default is Icons with tiny labels up/down.
“Shift only” display reduces noise; you can also set min bar spacing.
How to read it (quick workflow)
Flux Score row: a fast “risk-on/off” gauge.
≥70 with green Trend/MACD cells → higher-conviction long context.
≤30 with red Trend/MACD cells → higher-conviction short context.
Summary explains why the score is what it is.
Signal row: tells you the last official signal and how many bars ago it fired. Fresh signals tint lighter.
MA row: aligns your slow baseline; arrow helps spot slow-turns early.
Sess row + label: know which market is active; behavior and your confirmation bars adapt by session if presets are on.
VIX/VXN (if enabled): extra context for risk regime (values and color band).
Good practices & caveats
It’s confirmation-based to reduce false flips; you’ll get signals slightly later, by design.
All signals are informational; there’s no position management or stops in this build (we removed the stop visuals by request).
If you switch to exotic chart types or extreme resolutions, re-tune lengths and confirmation bars (and potentially disable session presets).
For scalping, consider reducing confirmation bars and OBV smoothing; for higher timeframes, increase them.
Quick customization ideas
Want faster flips? Lower confirmBars and obvBars, increase slope buffer a bit to retain quality.
Want fewer weak signals? Show only strong markers (toggle off weak via colors/visibility or increase min bar gap).
Prefer EMA stacking? Set both Fast/Slow to EMA.
Don’t care about OBV? Turn OBV confirm off; Trend + MACD will drive

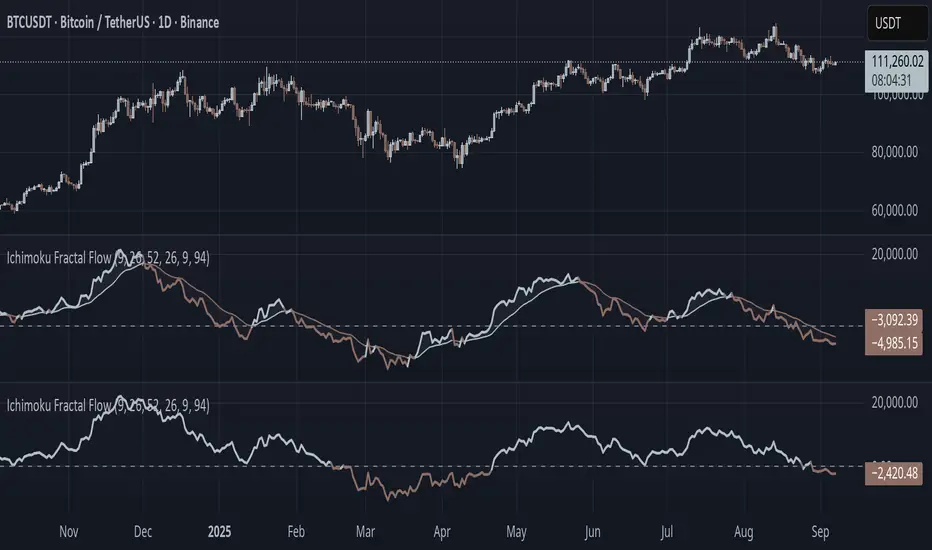
Ichimoku Fractal Flow### Ichimoku Fractal Flow (IFF)
By Gurjit Singh
Ichimoku Fractal Flow (IFF) distills the Ichimoku system into a single oscillator by merging fractal echoes of price and cloud dynamics into one flow signal. Instead of static Ichimoku lines, it measures the "flow" between Conversion/Base, Span A/B, price echoes, and cloud echoes. The result is a multidimensional oscillator that reveals hidden rhythm, momentum shifts, and trend bias.
#### 📌 Key Features
1. Fourfold Fusion – The oscillator blends:
* Phase: Tenkan vs. Kijun spread (short vs. medium trend).
* Kumo Phase: Span A vs. Span B spread (cloud thickness).
* Echo: Price vs lagged reflection.
* Cloud Echo: Price vs. projected cloud center.
2. Oscillator Output – A unified flow line oscillating around zero.
3. Dual Calculation Modes – Oscillator can be built using:
* High-Low Midpoint (classic Ichimoku-style averaging).
* Wilder’s RMA (smoother, less noisy averaging averaging).
4. Optional Smoothing – EMA or Wilder’s RMA creates a trend line, enabling MACD-style crossovers.
5. Dynamic Coloring – Bullish/Bearish color shifts for quick bias recognition.
6. Fill Styling – Highlighted regions between oscillator & smoothing line.
7. Zero Line Reference – Acts as a structural pivot (bull vs. bear).
#### 🔑 How to Use
1. Add to Chart: Works across all assets and timeframes.
2. Flow Bias (Zero Line):
* Above 0 → Bullish flow 🐂
* Below 0 → Bearish flow 🐻
3. With Signal Line:
* Oscillator above smoothing line → Possible upward trend shift.
* Oscillator below smoothing line → Possible downward trend shift.
4. Strength:
* Wide separation from smoothing = strong trend.
* Flat, tight clustering = indecision/range.
5. Contextual Edge: Combine signals with Ichimoku Cloud analysis for stronger confluence.
#### ⚙️ Inputs & Options
* Conversion Line (Tenkan, default 9)
* Base Line (Kijun, default 26)
* Leading Span B (default 52)
* Lag/Lead Shift (default 26)
* Oscillator Mode: High-Low Midpoint vs Wilder’s RMA
* Use Smoothing (toggle on/off)
* Signal Smoothing: Wilder/EMA option
* Smoothing Length (default 9)
* Bullish/Bearish Colors + Transparency
#### 💡 Tips
* Wilder’s RMA (both oscillator & smoothing) is gentler, reducing whipsaws in sideways markets.
* High-Low Mid captures pure Ichimoku-style ranges, good for structure-based traders.
* EMA reacts faster than RMA; use if you want early momentum signals.
* Zero-line flips act like momentum pivots—watch them near cloud boundaries.
* Signal line crossovers behave like MACD-style triggers.
* Strongest signals appear when oscillator, signal line, and Ichimoku Cloud all align.
👉 In short: Ichimoku Fractal Flow compresses multi-layered Ichimoku system into a single fractal oscillator that detects flow, pivotal shifts, and momentum with clarity—bridging price, cloud, and echoes into one signal. Where the cloud shows structure, IFF reveals the underlying flow. Together, they offer a fractal lens into market rhythm.
High Probability Order Blocks [AlgoAlpha]🟠 OVERVIEW
This script detects and visualizes high-probability order blocks by combining a volatility-based z-score trigger with a statistical survival model inspired by Kaplan-Meier estimation. It builds and manages bullish and bearish order blocks dynamically on the chart, displays live survival probabilities per block, and plots optional rejection signals. What makes this tool unique is its use of historical mitigation behavior to estimate and plot how likely each zone is to persist, offering traders a probabilistic perspective on order block strength—something rarely seen in retail indicators.
🟠 CONCEPTS
Order blocks are regions of strong institutional interest, often marked by large imbalances between buying and selling. This script identifies those areas using z-score thresholds on directional distance (up or down candles), detecting statistically significant moves that signal potential smart money footprints. A bullish block is drawn when a strong up-move (zUp > 4) follows a down candle, and vice versa for bearish blocks. Over time, each block is evaluated: if price “mitigates” it (i.e., closes cleanly past the opposite side and confirmed with a 1 bar delay), it’s considered resolved and logged. These resolved blocks then inform a Kaplan-Meier-like survival curve, estimating the likelihood that future blocks of a given age will remain unbroken. The indicator then draws a probability curve for each side (bull/bear), updating it in real time.
🟠 FEATURES
Live label inside each block showing survival probability or “N.E.D.” if insufficient data.
Kaplan-Meier survival curves drawn directly on the chart to show estimated strength decay.
Rejection markers (▲ ▼) if price bounces cleanly off an active order block.
Alerts for zone creation and rejection signals, supporting rule-based trading workflows.
🟠 USAGE
Read the label inside each block for Age | Survival% (or N.E.D. if there aren’t enough samples yet); higher survival % suggests blocks of that age have historically lasted longer.
Use the right-side survival curves to gauge how probability decays with age for bull vs bear blocks, and align entries with the side showing stronger survival at current age.
Treat ▲ (bullish rejection) and ▼ (bearish rejection) as optional confluence when price tests a boundary and fails to break.
Turn on alerts for “Bullish Zone Created,” “Bearish Zone Created,” and rejection signals so you don’t need to watch constantly.
If your chart gets crowded, enable Prevent Overlap ; tune Max Box Age to your timeframe; and adjust KM Training Window / Minimum Samples to trade off responsiveness vs stability.

Theil-Sen Line Filter [BackQuant]Theil-Sen Line Filter
A robust, median-slope baseline that tracks price while resisting outliers. Designed for the chart pane as a clean, adaptive reference line with optional candle coloring and slope-flip alerts.
What this is
A trend filter that estimates the underlying slope of price using a Theil-Sen style median of past slopes, then advances a baseline by a controlled fraction of that slope each bar. The result is a smooth line that reacts to real directional change while staying calm through noise, gaps, and single-bar shocks.
Why Theil-Sen
Classical moving averages are sensitive to outliers and shape changes. Ordinary least squares is sensitive to large residuals. The Theil-Sen idea replaces a single fragile estimate with the median of many simple slopes, which is statistically robust and less influenced by a few extreme bars. That makes the baseline steadier in choppy conditions and cleaner around regime turns.
What it plots
Filtered baseline that advances by a fraction of the robust slope each bar.
Optional candle coloring by baseline slope sign for quick trend read.
Alerts when the baseline slope turns up or down.
How it behaves (high level)
Looks back over a fixed window and forms many “current vs past” bar-to-bar slopes.
Takes the median of those slopes to get a robust estimate for the bar.
Optionally caps the magnitude of that per-bar slope so a single volatile bar cannot yank the line.
Moves the baseline forward by a user-controlled fraction of the estimated slope. Lower fractions are smoother. Higher fractions are more responsive.
Inputs and what they do
Price Source — the series the filter tracks. Typical is close; HL2 or HLC3 can be smoother.
Window Length — how many bars to consider for slopes. Larger windows are steadier and slower. Smaller windows are quicker and noisier.
Response — fraction of the estimated slope applied each bar. 1.00 follows the robust slope closely; values below 1.00 dampen moves.
Slope Cap Mode — optional guardrail on each bar’s slope:
None — no cap.
ATR — cap scales with recent true range.
Percent — cap scales with price level.
Points — fixed absolute cap in price points.
ATR Length / Mult, Cap Percent, Cap Points — tune the chosen cap mode’s size.
UI Settings — show or hide the line, paint candles by slope, choose long and short colors.
How to read it
Up-slope baseline and green candles indicate a rising robust trend. Pullbacks that do not flip the slope often resolve in trend direction.
Down-slope baseline and red candles indicate a falling robust trend. Bounces against the slope are lower-probability until proven otherwise.
Flat or frequent flips suggest a range. Increase window length or decrease response if you want fewer whipsaws in sideways markets.
Use cases
Bias filter — only take longs when slope is up, shorts when slope is down. It is a simple way to gate faster setups.
Stop or trail reference — use the line as a trailing guide. If price closes beyond the line and the slope flips, consider reducing exposure.
Regime detector — widen the window on higher timeframes to define major up vs down regimes for asset rotation or risk toggles.
Noise control — enable a cap mode in very volatile symbols to retain the line’s continuity through event bars.
Tuning guidance
Quick swing trading — shorter window, higher response, optionally add a percent cap to keep it stable on large moves.
Position trading — longer window, moderate response. ATR cap tends to scale well across cycles.
Low-liquidity or gappy charts — prefer longer window and a points or ATR cap. That reduces jumpiness around discontinuities.
Alerts included
Theil-Sen Up Slope — baseline’s one-bar change crosses above zero.
Theil-Sen Down Slope — baseline’s one-bar change crosses below zero.
Strengths
Robust to outliers through median-based slope estimation.
Continuously advances with price rather than re-anchoring, which reduces lag at turns.
User-selectable slope caps to tame shock bars without over-smoothing everything.
Minimal visuals with optional candle painting for fast regime recognition.
Notes
This is a filter, not a trading system. It does not account for execution, spreads, or gaps. Pair it with entry logic, risk management, and higher-timeframe context if you plan to use it for decisions.

UDVR + OBV Combo — MTF (v6)The UDVR + OBV Combo is a multi-timeframe volume analysis tool that blends the Up/Down Volume Ratio with a normalized On-Balance Volume signal. It highlights when accumulation or distribution truly supports price action, adds higher-timeframe context, and shades the background when both indicators align. Use it to confirm breakouts, spot divergences, and filter trades with the backing of real volume flows.
1.Up/Down Volume Ratio (UDVR)
•Compares the rolling sum of up-volume (bars where price closed higher) vs down-volume (bars where price closed lower).
•A ratio > 1.0 = more accumulation (bullish pressure).
•A ratio < 1.0 = more distribution (bearish pressure).
•Optional histogram shows deviations from the 1.0 baseline.
•Customizable handling of equal closes (count as up, down, split, or ignore).
•Configurable lookback length and optional EMA smoothing.
2. On-Balance Volume (OBV)
•Classic cumulative OBV implemented natively (adds volume on up-bars, subtracts on down-bars).
•Normalized with a z-score so it can be compared across different symbols/timeframes.
•Includes an EMA signal line for slope detection.
•Alignment of OBV vs its EMA highlights rising or waning participation.
3. Multi-Timeframe Support
•Both UDVR and OBV can be plotted from a higher timeframe (HTF) (e.g. Daily UDVR shown on a 1h chart).
•Lets you see big-money accumulation/distribution while trading intraday.
•Shaded background when current TF and HTF agree (both bullish or both bearish).
How to read it
• Bullish confirmation = UDVR > 1 (accumulation) and OBV above EMA (rising participation).
• Bearish confirmation = UDVR < 1 (distribution) and OBV below EMA (falling participation).
• Mixed signals (e.g. UDVR > 1 but OBV falling) = caution; price may lack conviction.
• Divergences : If price makes a new high but OBV or UDVR does not, it’s a warning of weakening trend.
• Higher timeframe context : set HTF = Daily or Weekly and watch how short-term signals align with institutional flows. A long trade on the 15m chart is stronger when Daily UDVR is also above 1.
Inputs
•UDVR Lookback: number of bars for rolling volume sums.
•Smoothing EMA: smooths UDVR for stability.
•Equal Close Handling: decide how equal closes affect UDVR.
•Signal Band: optional UDVR extreme thresholds.
•Show Histogram: toggle UDVR histogram around baseline.
•Higher Timeframe UDVR: overlay Daily/Weekly UDVR on lower timeframe charts.
•OBV EMA length: slope proxy for normalized OBV.
•OBV Normalization window: controls z-score sensitivity.
•Higher Timeframe OBV: overlay higher timeframe OBV.
Alerts
•UDVR Bullish/Bearish cross at the 1.0 baseline.
•OBV slope up/down when OBV crosses its EMA.
•Alignment signals when UDVR and OBV agree (both confirm bullish or bearish conditions).
Why it’s useful
•Combines trend, momentum, and participation in one place.
•Helps avoid false breakouts by checking if volume supports the move.
•Lets you spot accumulation/distribution shifts before they show up in price.
•Gives a higher timeframe context so you’re not trading against the “big picture.”
Once applied, the indicator creates a dedicated pane below price with the following components:
UDVR Line (green/red)
• Green when UDVR > 1.0 (more up-volume than down-volume → accumulation).
• Red when UDVR < 1.0 (more down-volume → distribution).
UDVR Baseline and Bands
• Grey baseline at 1.0 = balance between buying and selling volume.
• Optional upper/lower bands (default 1.5 and 0.67) highlight extreme imbalances.
• Shaded areas between baseline and bands provide visual context for strength/weakness.
UDVR Histogram (optional)
• Columns around the baseline showing (UDVR – 1.0).
• Quick way to gauge how far above/below balance the ratio is.
Higher-Timeframe UDVR (teal line)
• Overlays the UDVR from a higher timeframe (e.g. Daily) on your intraday chart.
• Lets you see whether institutional flows support your shorter-term signals.
OBV Normalized (blue/orange line)
• Classic OBV, but normalized with a z-score so it stays readable across assets.
• Blue when OBV is above its EMA (rising participation).
• Orange when below its EMA (waning participation).
OBV EMA (grey line)
• Signal line showing the slope of OBV.
• Crosses between OBV and this line mark shifts in participation.
Higher-Timeframe OBV (purple line, optional)
• Plots OBV from a higher timeframe for additional context.
Background Shading
• Light green = both UDVR > 1 and OBV > OBV-EMA (bullish alignment).
• Light red = both UDVR < 1 and OBV < OBV-EMA (bearish alignment).
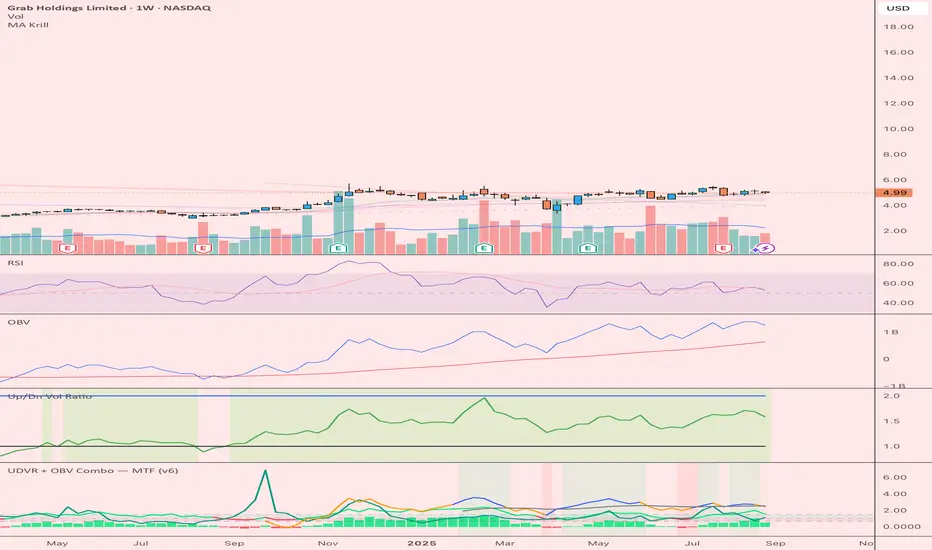
PumpC PAC & MAsPumpC – PAC & MAs (Open Source)
A complete Price Action Candles (PAC) toolkit combining classical price action patterns (Fair Value Gaps, Inside Bars, Hammers, Inverted Hammers, and Volume Imbalances) with a flexible Moving Averages (MAs) module and an advanced bar-coloring system.
This script highlights supply/demand inefficiencies and micro-patterns with forward-extending boxes, recolors zones when mitigated, qualifies patterns with a global High-Volume filter, and ships with ready-to-use alerts. It works across intraday through swing trading on any market (e.g., NASDAQ:QQQ , $CME:ES1!, FX:EURUSD , BITSTAMP:BTCUSD ).
This is an open-source script. The description is detailed so users understand what the script does, how it works, and how to use it. It makes no performance claims and does not provide trade advice.
Acknowledgment & Credits
This script originates from the structural and box-handling logic found in the Super OrderBlock / FVG / BoS Tools by makuchaku & eFe. Their pioneering framework provided the base methods for managing arrays of boxes, extending zones forward, and recoloring once mitigated.
Building on that foundation, I have substantially expanded and adapted the code to create a unified Price Action Candles toolkit . This includes Al Brooks–inspired PAC logic, additional patterns like Inside Bars, Hammers, Inverted Hammers, and the new Volume Imbalance module, along with strong-bar coloring, close-threshold detection, a flexible global High-Volume filter, and a multi-timeframe Moving Averages system.
What it does
Fair Value Gaps (FVG) : Detects 3-bar displacement gaps, plots forward-extending boxes, and optionally recolors them once mitigated.
Inside Bars (IB) : Highlights bars fully contained within the prior candle’s range, with optional high-volume filter.
Hammers (H) & Inverted Hammers (IH) : Identifies rejection candles using configurable body/upper/lower wick thresholds. High-volume qualification optional.
Volume Imbalances (VI) : Detects inter-body gaps where one candle’s body does not overlap the prior candle’s body. Boxes extend forward until wick-based mitigation occurs (only after the two-bar formation completes). Alerts available for creation and mitigation.
Mitigation Recolor : Each pattern can flip to a mitigated color once price trades back through its vertical zone.
Moving Averages (MAs) : Four configurable EMAs/SMAs, with per-MA timeframe, length, color, and clutter-free plotting rules.
Strong Bar Coloring : Highlights bullish/bearish engulfing reversals with different colors for high-volume vs low-volume cases.
Close Threshold Bars : Marks candles that close in the top or bottom portion of their range, even if the body is small. Helps spot continuation pressure before a full trend bar forms.
Alerts : Notifications available for FVG+, FVG−, IB, H, IH, VI creation, and VI mitigation.
Connection to Al Brooks’ PAC teachings
This script reflects Al Brooks’ Price Action Candle methodology. PAC patterns like Inside Bars, Hammers, and Inverted Hammers are not trade signals on their own—they gain meaning in context of trend, failed breakouts, and effort vs. result.
By layering in volume imbalances, strong-bar reversals, and volume filters, this script focuses attention on the PACs that show true participation and conviction, aligning with Brooks’ emphasis on reading crowd psychology through price action.
Why the High-Volume filter matters
Volume is a key proxy for conviction. A PAC or VI formed on light volume can be misleading noise; one formed on above-average volume carries more weight.
Elevates Inside Bars that show absorption/compression with heavy activity.
Distinguishes Hammers that reject price aggressively vs. weak drifts.
Filters Inverted Hammers to emphasize true supply pressure.
Highlights VI zones where institutional order flow left inefficiencies.
Differentiates strong engulfing reversals from weaker, low-participation moves.
Inputs & Customization
Inputs are grouped logically for fast configuration:
High-Volume Filter : Global lookback & multiple, per-pattern toggles.
FVG : Visibility, mitigated recolor, box style/transparency, label controls.
IB : Visibility, require high volume, mitigated recolor, colors, label settings.
Hammer / IH : Visibility, require high volume, mitigated recolor, wick/body thresholds.
VI : Visibility, require high volume, mitigated recolor, box style, labels, mitigation alerts.
Strong Bars : Enable/disable, separate colors for high-volume and low-volume outcomes.
Close Threshold Bars : Customizable close thresholds, labels, optional count markers.
MAs : EMA/SMA type, per-MA toggle, length, timeframe, color.
Alerts
New Bullish FVG (+)
New Bearish FVG (−)
New Inside Bar (IB)
New Hammer (H)
New Inverted Hammer (IH)
New Volume Imbalance (VI)
VI Mitigated
Strong Bullish Engulfing / Bearish Engulfing (high- and low-volume variants)
Suggested workflow
Choose your market & timeframe (script works across equities, futures, FX, crypto).
Toggle only the PACs you actually trade. Assign distinct colors for clarity.
Use MAs for directional bias and higher timeframe structure.
Enable High-Volume filters when you want to emphasize conviction.
Watch mitigation recolors to see which levels/zones have been interacted with.
Use alerts selectively for setups aligned with your plan.
Originality
Builds upon Super OrderBlock / FVG / BoS Tools (makuchaku & eFe) for FVG/box framework.
Expanded into a unified PAC toolkit including IB, H, IH, and VI patterns.
Brooks-inspired design: Patterns contextualized with volume and trend, not isolated.
Flexible high-volume gating with per-pattern toggles.
New VI integration with wick-based mitigation.
Strong Bar Coloring differentiates conviction vs weak reversals.
MTF-aware MAs prevent clutter while providing structure.
Open-source: Transparent for learning, editing, and extension.
Disclaimer
For educational and informational purposes only. This script is not financial advice. Trading carries risk—always test thoroughly before live use.

Volume Profile + VAH, VAL, and POCWhat it is
A clean, on-chart volume profile that approximates your visible range using a configurable Bars Back window. It builds a horizontal histogram of volume by price, splits each price bin into Buy vs Sell volume, draws POC, and computes Value Area High/Low (VAH/VAL). A Stealth Mode toggle switches to a subtle grayscale palette for low-key charts.
Why this instead of the built-in VPVR?
Buy/Sell split per bin: See which prices were defended by buyers vs sellers, not just total volume.
Value Area from POC outward: Classic expansion method until the selected % of total volume (default 70%).
Sleek borders & Stealth Mode: Crisp bin outlines and a one-click professional colorway.
Deterministic & fast: No sessions or anchors needed—set your Bars Back and go.
How it works (under the hood)
Window selection – Pine can’t read your viewport, so we approximate it with Bars Back (user input).
Binning – The window’s price range is divided into N bins.
Volume allocation – For each bar in the window:
Distribute Across Hi–Lo (optional): Spread volume across all bins the bar overlaps, weighted by overlap; or
Single-price mode: Assign all volume to one bin using a representative price (hlc3).
Buy/Sell split (two methods):
Body Proportional (recommended): Split by relative up/down body size (|close−open|).
Up/Down Candle: 100% buy if close ≥ open, else 100% sell.
POC & VA: Point of Control is the bin with max total volume. VAH/VAL expands from POC toward the higher-volume neighbor until the selected % of total volume is included.
Reading the visuals
Horizontal bars (right side): Total volume per price bin.
Left sub-segment = Sell volume
Right sub-segment = Buy volume
POC line: Price level with peak total volume.
VAH / VAL (dashed): Upper and lower bounds of the selected Value Area.
Borders: Each bin has a clean outer outline so the profile looks tight and organized.
Stealth Mode: Grayscale palette that preserves contrast without loud colors.
Key inputs (organized for clarity)
Theme
Stealth Mode: Toggles the grayscale look.
Core
Price Bins: Vertical resolution of the profile.
Lookback (Bars): Approximates your visible range.
Style
Profile Width (bars): How far the histogram extends to the right.
Bin Border Width: Outline thickness.
Markers & Lines
Show POC, Show VAH/VAL, Value Area %, VA line width.
Advanced
Distribute Volume Across Hi–Lo: More accurate, heavier compute.
Buy/Sell Split Method: Body Proportional (realistic) or Up/Down (simple).
Tips & best practices
Start with Body Proportional + Distribute Across ON for intraday accuracy.
If the chart lags, reduce Price Bins or Bars Back, or switch off distribution.
For small windows, fewer bins often looks cleaner (e.g., 30–60).
Stealth Mode plays nicely with both dark and light chart themes.
Limitations & notes
Viewport: Pine can’t access the actual visible bars; Bars Back is a practical stand-in.
Buy/Sell split: This is an approximation from candle bodies, not true bid/ask delta.
Designed for overlay; profile renders to the right of the latest bar.

Same-Direction Candles (Two Symbols)Same-Direction Candles (Two Symbols)
What it does
Highlights bars on your chart when two symbols print the same candle direction on the chosen timeframe:
Both Bullish → one color
Both Bearish → another color
Great for spotting synchronous moves (e.g., NQ & ES, QQQ & SPY), or confirming risk-on/risk-off with an inverse asset (e.g., NQ vs DXY with inversion).
How it works
For each bar, the script checks whether close > open (bullish), close < open (bearish), or equal (doji) for:
The chart’s symbol
A second symbol pulled via request.security() (optionally on a different timeframe)
If both symbols are bullish, it paints Bull color; if both are bearish, it paints Bear color. Dojis can be ignored.
Inputs
Second symbol: Ticker to compare (e.g., CME_MINI:ES1!, NASDAQ:QQQ, TVC:DXY).
Second symbol timeframe: Leave blank to use the chart’s TF, or set a specific one (e.g., 5, 15, D).
Invert second symbol direction?: Flips the second symbol’s candle direction (useful for inversely related assets like DXY vs indices).
Ignore doji candles: Skip highlights when either candle is neutral (open == close).
Coloring options: Toggle bar coloring and/or background shading; pick colors; set background transparency.
Alerts
Three alert conditions:
Both Bullish
Both Bearish
Both Same Direction (bullish or bearish)
Create alerts from the Add Alert dialog after adding the script.
Use cases
Index confluence: NQ & ES moving in lockstep
ETF confirmation: QQQ & SPY agreement
FX/Index risk signals: Invert DXY against NQ/ES to see when equity strength aligns with dollar weakness
Tips
For mixed timeframes (e.g., chart on 1m, ES on 5m), set Second symbol timeframe to the higher TF to reduce noise.
Keep Ignore dojis on for cleaner signals.
Combine with your own entry rules (structure, FVGs, liquidity sweeps).
Notes
Works on any symbol/timeframe supported by TradingView.
Overlay script; no strategy/entries/exits are executed.
Past performance ≠ future results; for education only.
Version: 1.0 – initial release (bar/background highlights, doji filter, inversion, multi-TF support, alerts).
