TASC 2025.04 The Ultimate Oscillator█ OVERVIEW
This script implements an alternative, refined version of the Ultimate Oscillator (UO) designed to reduce lag and enhance responsiveness in momentum indicators, as introduced by John F. Ehlers in his article "Less Lag In Momentum Indicators, The Ultimate Oscillator" from the April 2025 edition of TASC's Traders' Tips .
█ CONCEPTS
In his article, Ehlers states that indicators are essentially filters that remove unwanted noise (i.e., unnecessary information) from market data. Simply put, they process a series of data to place focus on specific information, providing a different perspective on price dynamics. Various filter types attenuate different periodic signals within the data. For instance, a lowpass filter allows only low-frequency signals, a highpass filter allows only high-frequency signals, and a bandpass filter allows signals within a specific frequency range .
Ehlers explains that the key to removing indicator lag is to combine filters of different types in such a way that the result preserves necessary, useful signals while minimizing delay (lag). His proposed UltimateOscillator aims to maintain responsiveness to a specific frequency range by measuring the difference between two highpass filters' outputs. The oscillator uses the following formula:
UO = (HP1 - HP2) / RMS
Where:
HP1 is the first highpass filter.
HP2 is another highpass filter that allows only shorter wavelengths than the critical period of HP1.
RMS is the root mean square of the highpass filter difference, used as a scaling factor to standardize the output.
The resulting oscillator is similar to a bandpass filter , because it emphasizes wavelengths between the critical periods of the two highpass filters. Ehlers' UO responds quickly to value changes in a series, providing a responsive view of momentum with little to no lag.
█ USAGE
Ehlers' UltimateOscillator sets the critical periods of its highpass filters using two parameters: BandEdge and Bandwidth :
The BandEdge sets the critical period of the second highpass filter, which determines the shortest wavelengths in the response.
The Bandwidth is a multiple of the BandEdge used for the critical period of the first highpass filter, which determines the longest wavelengths in the response. Ehlers suggests that a Bandwidth value of 2 works well for most applications. However, traders can use any value above or equal to 1.4.
Users can customize these parameters with the "Bandwidth" and "BandEdge" inputs in the "Settings/Inputs" tab.
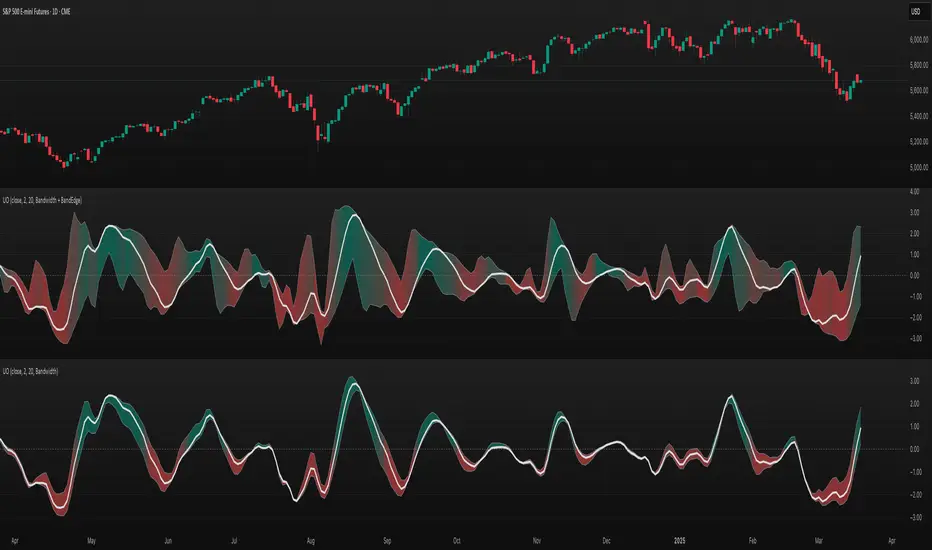
The script plots the UO calculated for the specified "Source" series in a separate pane, with a color based on the chart's foreground color. Positive UO values indicate upward momentum or trends, and negative UO values indicate the opposite.
Additionally, this indicator provides the option to display a "cloud" from 10 additional UO series with different settings for an aggregate view of momentum. The "Cloud" input offers four display choices: "Bandwidth", "BandEdge", "Bandwidth + BandEdge", or "None".
The "Bandwidth" option calculates oscillators with different Bandwidth values based on the main oscillator's setting. Likewise, the "BandEdge" option calculates oscillators with varying BandEdge values. The "Bandwidth + BandEdge" option calculates the extra oscillators with different values for both parameters.
When a user selects any of these options, the script plots the maximum and minimum oscillator values and fills their space with a color gradient. The fill color corresponds to the net sum of each UO's sign , indicating whether most of the UOs reflect positive or negative momentum. Green hues mean most oscillators are above zero, signifying stronger upward momentum. Red hues mean most are below zero, indicating stronger downward momentum.
스크립트에서 "中国中免股票+2025年走势"에 대해 찾기
Mogwai Method with RSI and EMA - BTCUSD 15mThis is a custom TradingView indicator designed for trading Bitcoin (BTCUSD) on a 15-minute timeframe. It’s based on the Mogwai Method—a mean-reversion strategy—enhanced with the Relative Strength Index (RSI) for momentum confirmation. The indicator generates buy and sell signals, visualized as green and red triangle arrows on the chart, to help identify potential entry and exit points in the volatile cryptocurrency market.
Components
Bollinger Bands (BB):
Purpose: Identifies overextended price movements, signaling potential reversions to the mean.
Parameters:
Length: 20 periods (standard for mean-reversion).
Multiplier: 2.2 (slightly wider than the default 2.0 to suit BTCUSD’s volatility).
Role:
Buy signal when price drops below the lower band (oversold).
Sell signal when price rises above the upper band (overbought).
Relative Strength Index (RSI):
Purpose: Confirms momentum to filter out false signals from Bollinger Bands.
Parameters:
Length: 14 periods (classic setting, effective for crypto).
Overbought Level: 70 (price may be overextended upward).
Oversold Level: 30 (price may be overextended downward).
Role:
Buy signal requires RSI < 30 (oversold).
Sell signal requires RSI > 70 (overbought).
Exponential Moving Averages (EMAs) (Plotted but not currently in signal logic):
Purpose: Provides trend context (included in the script for visualization, optional for signal filtering).
Parameters:
Fast EMA: 9 periods (short-term trend).
Slow EMA: 50 periods (longer-term trend).
Role: Can be re-added to filter signals (e.g., buy only when Fast EMA > Slow EMA).
Signals (Triangles):
Buy Signal: Green upward triangle below the bar when price is below the lower Bollinger Band and RSI is below 30.
Sell Signal: Red downward triangle above the bar when price is above the upper Bollinger Band and RSI is above 70.
How It Works
The indicator combines Bollinger Bands and RSI to spot mean-reversion opportunities:
Buy Condition: Price breaks below the lower Bollinger Band (indicating oversold conditions), and RSI confirms this with a reading below 30.
Sell Condition: Price breaks above the upper Bollinger Band (indicating overbought conditions), and RSI confirms this with a reading above 70.
The strategy assumes that extreme price movements in BTCUSD will often revert to the mean, especially in choppy or ranging markets.
Visual Elements
Green Upward Triangles: Appear below the candlestick to indicate a buy signal.
Red Downward Triangles: Appear above the candlestick to indicate a sell signal.
Bollinger Bands: Gray lines (upper, middle, lower) plotted for reference.
EMAs: Blue (Fast) and Orange (Slow) lines for trend visualization.
How to Use the Indicator
Setup
Open TradingView:
Log into TradingView and select a BTCUSD chart from a supported exchange (e.g., Binance, Coinbase, Bitfinex).
Set Timeframe:
Switch the chart to a 15-minute timeframe (15m).
Add the Indicator:
Open the Pine Editor (bottom panel in TradingView).
Copy and paste the script provided.
Click “Add to Chart” to apply it.
Verify Display:
You should see Bollinger Bands (gray), Fast EMA (blue), Slow EMA (orange), and buy/sell triangles when conditions are met.
Trading Guidelines
Buy Signal (Green Triangle Below Bar):
What It Means: Price is oversold, potentially ready to bounce back toward the Bollinger Band middle line.
Action:
Enter a long position (buy BTCUSD).
Set a take-profit near the middle Bollinger Band (bb_middle) or a resistance level.
Place a stop-loss 1-2% below the entry (or based on ATR, e.g., ta.atr(14) * 2).
Best Context: Works well in ranging markets; avoid during strong downtrends.
Sell Signal (Red Triangle Above Bar):
What It Means: Price is overbought, potentially ready to drop back toward the middle line.
Action:
Enter a short position (sell BTCUSD) or exit a long position.
Set a take-profit near the middle Bollinger Band or a support level.
Place a stop-loss 1-2% above the entry.
Best Context: Effective in ranging markets; avoid during strong uptrends.
Trend Filter (Optional):
To reduce false signals in trending markets, you can modify the script:
Add and ema_fast > ema_slow to the buy condition (only buy in uptrends).
Add and ema_fast < ema_slow to the sell condition (only sell in downtrends).
Check the Fast EMA (blue) vs. Slow EMA (orange) alignment visually.
Tips for BTCUSD on 15-Minute Charts
Volatility: BTCUSD can be erratic. If signals are too frequent, increase bb_mult (e.g., to 2.5) or adjust RSI levels (e.g., 75/25).
Confirmation: Use volume spikes or candlestick patterns (e.g., doji, engulfing) to confirm signals.
Time of Day: Mean-reversion works best during low-volume periods (e.g., Asian session in crypto).
Backtesting: Use TradingView’s Strategy Tester (convert to a strategy by adding entry/exit logic) to evaluate performance with historical BTCUSD data up to March 13, 2025.
Risk Management
Position Size: Risk no more than 1-2% of your account per trade.
Stop Losses: Always use stops to protect against BTCUSD’s sudden moves.
Avoid Overtrading: Wait for clear signals; don’t force trades in choppy or unclear conditions.
Example Scenario
Chart: BTCUSD, 15-minute timeframe.
Buy Signal: Price drops to $58,000, below the lower Bollinger Band, RSI at 28. A green triangle appears.
Action: Buy at $58,000, target $59,000 (middle BB), stop at $57,500.
Sell Signal: Price rises to $60,500, above the upper Bollinger Band, RSI at 72. A red triangle appears.
Action: Sell at $60,500, target $59,500 (middle BB), stop at $61,000.
This indicator is tailored for mean-reversion trading on BTCUSD. Let me know if you’d like to tweak it further (e.g., add filters, alerts, or alternative indicators)!

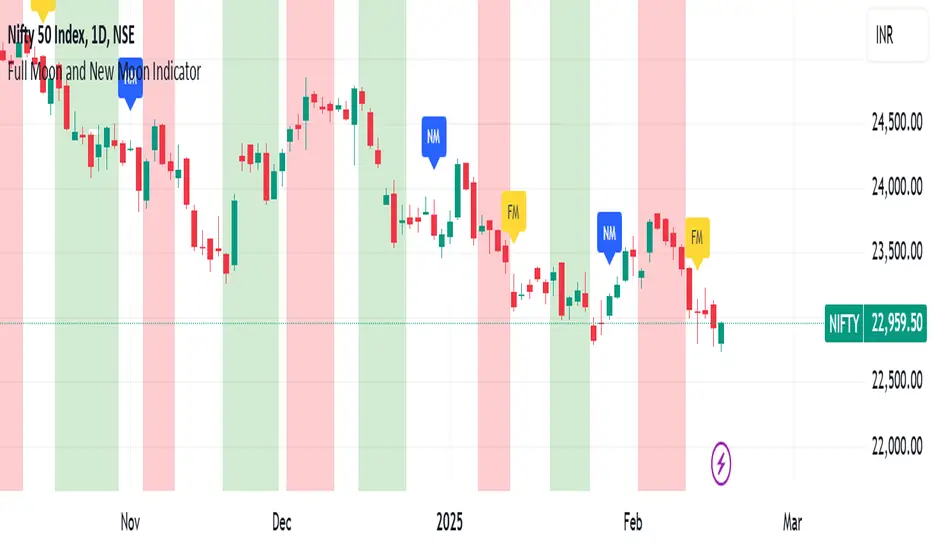
Full Moon and New Moon IndicatorThe Full Moon & New Moon Indicator is a custom Pine Script indicator which marks Full Moon (Pournami) and New Moon (Amavasya) events on the price chart. This indicator helps traders who incorporate lunar cycles into their market analysis, as certain traders believe these cycles influence market sentiment and price action. The current script is added for the year 2024 and 2025 and the dates are considered as per the Telugu calendar.
Features
✅ Identifies and labels Full Moon & New Moon days on the chart for the year 2024 and 2025
How it Works!
On a Full Moon day, it places a yellow label ("Pournami") above the corresponding candle.
On a New Moon day, it places a blue label ("Amavasya") above the corresponding candle.
Example Usage
When a Full Moon label appears, check for potential trend reversals or high volatility.
When a New Moon label appears, watch for market consolidation or a shift in sentiment.
Combine with candlestick patterns, support/resistance, or momentum indicators for a stronger trading setup.
🚀 Add this indicator to your TradingView chart and explore the market’s reaction to lunar cycles! 🌕
TASC 2025.03 A New Solution, Removing Moving Average Lag█ OVERVIEW
This script implements a novel technique for removing lag from a moving average, as introduced by John Ehlers in the "A New Solution, Removing Moving Average Lag" article featured in the March 2025 edition of TASC's Traders' Tips .
█ CONCEPTS
In his article, Ehlers explains that the average price in a time series represents a statistical estimate for a block of price values, where the estimate is positioned at the block's center on the time axis. In the case of a simple moving average (SMA), the calculation moves the analyzed block along the time axis and computes an average after each new sample. Because the average's position is at the center of each block, the SMA inherently lags behind price changes by half the data length.
As a solution to removing moving average lag, Ehlers proposes a new projected moving average (PMA) . The PMA smooths price data while maintaining responsiveness by calculating a projection of the average using the data's linear regression slope.
The slope of linear regression on a block of financial time series data can be expressed as the covariance between prices and sample points divided by the variance of the sample points. Ehlers derives the PMA by adding this slope across half the data length to the SMA, creating a first-order prediction that substantially reduces lag:
PMA = SMA + Slope * Length / 2
In addition, the article includes methods for calculating predictions of the PMA and the slope based on second-order and fourth-order differences. The formulas for these predictions are as follows:
PredictPMA = PMA + 0.5 * (Slope - Slope ) * Length
PredictSlope = 1.5 * Slope - 0.5 * Slope
Ehlers suggests that crossings between the predictions and the original values can help traders identify timely buy and sell signals.
█ USAGE
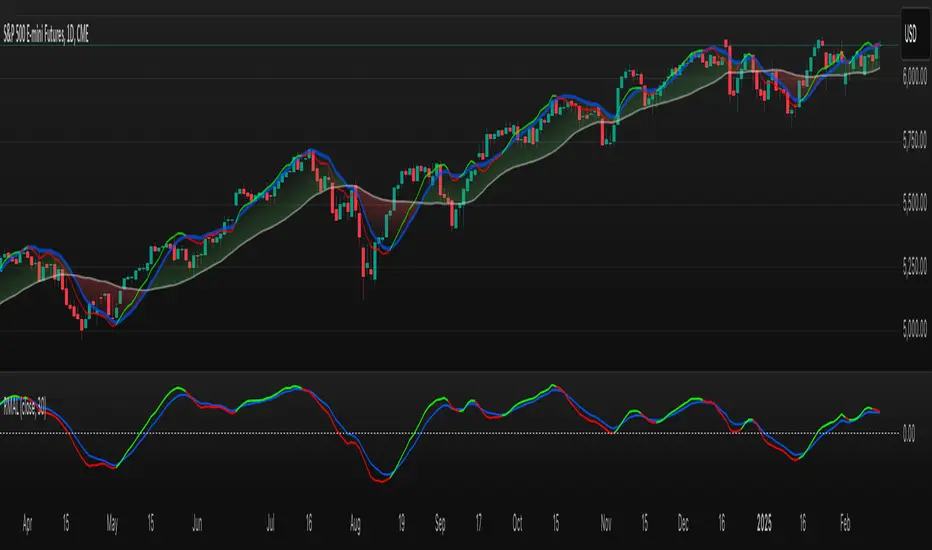
This indicator displays the SMA, PMA, and PMA prediction for a specified series in the main chart pane, and it shows the linear regression slope and prediction in a separate pane. Analyzing the difference between the PMA and SMA can help to identify trends. The differences between PMA or slope and its corresponding prediction can indicate turning points and potential trade opportunities.
The SMA plot uses the chart's foreground color, and the PMA and slope plots are blue by default. The plots of the predictions have a green or red hue to signify direction. Additionally, the indicator fills the space between the SMA and PMA with a green or red color gradient based on their differences:
Users can customize the source series, data length, and plot colors via the inputs in the "Settings/Inputs" tab.
█ NOTES FOR Pine Script® CODERS
The article's code implementation uses a loop to calculate all necessary sums for the slope and SMA calculations. Ported into Pine, the implementation is as follows:
pma(float src, int length) =>
float PMA = 0., float SMA = 0., float Slope = 0.
float Sx = 0.0 , float Sy = 0.0
float Sxx = 0.0 , float Syy = 0.0 , float Sxy = 0.0
for count = 1 to length
float src1 = src
Sx += count
Sy += src
Sxx += count * count
Syy += src1 * src1
Sxy += count * src1
Slope := -(length * Sxy - Sx * Sy) / (length * Sxx - Sx * Sx)
SMA := Sy / length
PMA := SMA + Slope * length / 2
However, loops in Pine can be computationally expensive, and the above loop's runtime scales directly with the specified length. Fortunately, Pine's built-in functions often eliminate the need for loops. This indicator implements the following function, which simplifies the process by using the ta.linreg() and ta.sma() functions to calculate equivalent slope and SMA values efficiently:
pma(float src, int length) =>
float Slope = ta.linreg(src, length, 0) - ta.linreg(src, length, 1)
float SMA = ta.sma(src, length)
float PMA = SMA + Slope * length * 0.5
To learn more about loop elimination in Pine, refer to this section of the User Manual's Profiling and optimization page.
TASC 2025.02 Autocorrelation Indicator█ OVERVIEW
This script implements the Autocorrelation Indicator introduced by John Ehlers in the "Drunkard's Walk: Theory And Measurement By Autocorrelation" article from the February 2025 edition of TASC's Traders' Tips . The indicator calculates the autocorrelation of a price series across several lags to construct a periodogram , which traders can use to identify market cycles, trends, and potential reversal patterns.
█ CONCEPTS
Drunkard's walk
A drunkard's walk , formally known as a random walk , is a type of stochastic process that models the evolution of a system or variable through successive random steps.
In his article, John Ehlers relates this model to market data. He discusses two first- and second-order partial differential equations, modified for discrete (non-continuous) data, that can represent solutions to the discrete random walk problem: the diffusion equation and the wave equation. According to Ehlers, market data takes on a mixture of two "modes" described by these equations. He theorizes that when "diffusion mode" is dominant, trading success is almost a matter of luck, and when "wave mode" is dominant, indicators may have improved performance.
Pink spectrum
John Ehlers explains that many recent academic studies affirm that market data has a pink spectrum , meaning the power spectral density of the data is proportional to the wavelengths it contains, like pink noise . A random walk with a pink spectrum suggests that the states of the random variable are correlated and not independent. In other words, the random variable exhibits long-range dependence with respect to previous states.
Autocorrelation function (ACF)
Autocorrelation measures the correlation of a time series with a delayed copy, or lag , of itself. The autocorrelation function (ACF) is a method that evaluates autocorrelation across a range of lags , which can help to identify patterns, trends, and cycles in stochastic market data. Analysts often use ACF to detect and characterize long-range dependence in a time series.
The Autocorrelation Indicator evaluates the ACF of market prices over a fixed range of lags, expressing the results as a color-coded heatmap representing a dynamic periodogram. Ehlers suggests the information from the periodogram can help traders identify different market behaviors, including:
Cycles : Distinguishable as repeated patterns in the periodogram.
Reversals : Indicated by sharp vertical changes in the periodogram when the indicator uses a short data length .
Trends : Indicated by increasing correlation across lags, starting with the shortest, over time.
█ USAGE
This script calculates the Autocorrelation Indicator on an input "Source" series, smoothed by Ehlers' UltimateSmoother filter, and plots several color-coded lines to represent the periodogram's information. Each line corresponds to an analyzed lag, with the shortest lag's line at the bottom of the pane. Green hues in the line indicate a positive correlation for the lag, red hues indicate a negative correlation (anticorrelation), and orange or yellow hues mean the correlation is near zero.
Because Pine has a limit on the number of plots for a single indicator, this script divides the periodogram display into three distinct ranges that cover different lags. To see the full periodogram, add three instances of this script to the chart and set the "Lag range" input for each to a different value, as demonstrated in the chart above.
With a modest autocorrelation length, such as 20 on a "1D" chart, traders can identify seasonal patterns in the price series, which can help to pinpoint cycles and moderate trends. For instance, on the daily ES1! chart above, the indicator shows repetitive, similar patterns through fall 2023 and winter 2023-2024. The green "triangular" shape rising from the zero lag baseline over different time ranges corresponds to seasonal trends in the data.
To identify turning points in the price series, Ehlers recommends using a short autocorrelation length, such as 2. With this length, users can observe sharp, sudden shifts along the vertical axis, which suggest potential turning points from upward to downward or vice versa.

Highs & Lows RTH/OVN/IBs/D/W/M/YOverview
Plots the highs and lows of RTH, OVN/ETH, IBs of those sessions, previous Day, Week, Month, and Year.
Features
Allows the user to enable/disable plotting the high/low of each period.
Lines' length, offset, and colors can be customized
Labels' position, size, color, and style can be customized
Support
Questions, feedbacks, and requests are welcomed. Please feel free to use Comments or direct private message via TradingView.
Disclaimer
This stock chart indicator provided is for informational purposes only and should not be considered as financial or investment advice. The data and information presented in this indicator are obtained from sources believed to be reliable, but we do not warrant its completeness or accuracy.
Users should be aware that:
Any investment decisions made based on this indicator are at your own risk.
The creators and providers of this indicator disclaim all liability for any losses, damages, or other consequences resulting from its use. By using this stock chart indicator, you acknowledge and accept the inherent risks associated with trading and investing in financial markets.
Release Date: 2025-01-17
Release Version: v1 r1
Release Notes Date: 2025-01-17

SW monthly Gann Days**Script Description:**
The script you are looking at is based on the work of W.D. Gann, a famous trader and market analyst in the early 20th century, known for his use of geometry, astrology, and numerology in market analysis. Gann believed that certain days in the market had significant importance, and he observed that markets often exhibited significant price moves around specific dates. These dates were typically associated with cyclical patterns in price movements, and Gann referred to these as "Gann Days."
In this script, we have focused on highlighting certain days of the month that Gann believed to have an influence on market behavior. The specific days in question are the **6th to 7th**, **9th to 10th**, **14th to 15th**, **19th to 20th**, **23rd to 24th**, and **29th to 31st** of each month. These ranges are based on Gann’s theory that there are recurring time cycles in the market that cause turning points or critical price movements to occur around certain days of the month.
### **Why Gann Used These Days:**
1. **Mathematical and Astrological Cycles:**
Gann believed that markets were influenced by natural cycles, and that certain dates (or combinations of dates) played a critical role in the price movements. These specific days are part of his broader theory of "time cycles" where the market would often change direction, reverse, or exhibit significant volatility on particular days. Gann's research was based on both mathematical principles and astrological observations, leading him to assign importance to these days.
2. **Gann's Universal Timing Theory:**
According to Gann, financial markets operate in a universe governed by geometric and astrological principles. These cycles repeat themselves over time, and specific days in a given month correspond to key turning points within these repeating cycles. Gann found that the 6th to 7th, 9th to 10th, 14th to 15th, 19th to 20th, 23rd to 24th, and 29th to 31st often marked significant changes in the market, making them particularly important for traders to watch.
3. **Market Psychology and Sentiment:**
These specific days likely correspond to key moments where market participants tend to react in predictable ways, influenced by past market behavior on similar dates. For example, news events or scheduled economic reports might fall within these time windows, causing the market to respond in a particular way. Gann's method involves using these cyclical patterns to predict turning points in market prices, enabling traders to anticipate when the market might make a reversal or face a significant shift in direction.
4. **Turning Points:**
Gann believed that markets often reversed or encountered critical points around specific dates. This is why he considered certain days more important than others. By identifying and focusing on these days, traders can better anticipate the market’s movement and make more informed trading decisions.
5. **Numerology:**
Gann also utilized numerology in his trading system, believing that numbers, and particularly certain key numbers, had significance in predicting market movements. The days selected in this script may correspond to numerological patterns that Gann identified in his analysis of the markets, such as recurring numbers in his astrological and geometric systems.
### **Purpose of the Script:**
This script highlights these "Gann Days" within a trading chart for 2024 and 2025. The color-coding or background highlighting is intended to draw attention to these dates, so traders can observe the potential for significant market movements during these times. By identifying these specific dates, traders following Gann's theories may gain insights into possible turning points, corrections, or key price movements based on the market's historical behavior around these days.
Overall, Gann’s use of specific days was based on his deep belief in the cyclical nature of the market and his attempt to tie those cycles to the natural laws of time, geometry, and astrology. By focusing on these dates, Gann aimed to give traders an edge in predicting significant market events and price shifts.

TASC 2025.01 Linear Predictive Filters█ OVERVIEW
This script implements a suite of tools for identifying and utilizing dominant cycles in time series data, as introduced by John Ehlers in the "Linear Predictive Filters And Instantaneous Frequency" article featured in the January 2025 edition of TASC's Traders' Tips . Dominant cycle information can help traders adapt their indicators and strategies to changing market conditions.
█ CONCEPTS
Conventional technical indicators and strategies often rely on static, unchanging parameters, which may fail to account for the dynamic nature of market data. In his article, John Ehlers applies digital signal processing principles to address this issue, introducing linear predictive filters to identify cyclic information for adapting indicators and strategies to evolving market conditions.
This approach treats market data as a complex series in the time domain. Analyzing the series in the frequency domain reveals information about its cyclic components. To reduce the impact of frequencies outside a range of interest and focus on a specific range of cycles, Ehlers applies second-order highpass and lowpass filters to the price data, which attenuate or remove wavelengths outside the desired range. This band-limited analysis isolates specific parts of the frequency spectrum for various trading styles, e.g., longer wavelengths for position trading or shorter wavelengths for swing trading.
After filtering the series to produce band-limited data, Ehlers applies a linear predictive filter to predict future values a few bars ahead. The filter, calculated based on the techniques proposed by Lloyd Griffiths, adaptively minimizes the error between the latest data point and prediction, successively adjusting its coefficients to align with the band-limited series. The filter's coefficients can then be applied to generate an adaptive estimate of the band-limited data's structure in the frequency domain and identify the dominant cycle.
█ USAGE
This script implements the following tools presented in the article:
Griffiths Predictor
This tool calculates a linear predictive filter to forecast future data points in band-limited price data. The crosses between the prediction and signal lines can provide potential trade signals.
Griffiths Spectrum
This tool calculates a partial frequency spectrum of the band-limited price data derived from the linear predictive filter's coefficients, displaying a color-coded representation of the frequency information in the pane. This mode's display represents the data as a periodogram . The bottom of each plotted bar corresponds to a specific analyzed period (inverse of frequency), and the bar's color represents the presence of that periodic cycle in the time series relative to the one with the highest presence (i.e., the dominant cycle). Warmer, brighter colors indicate a higher presence of the cycle in the series, whereas darker colors indicate a lower presence.
Griffiths Dominant Cycle
This tool compares the cyclic components within the partial spectrum and identifies the frequency with the highest power, i.e., the dominant cycle . Traders can use this dominant cycle information to tune other indicators and strategies, which may help promote better alignment with dynamic market conditions.
Notes on parameters
Bandpass boundaries:
In the article, Ehlers recommends an upper bound of 125 bars or higher to capture longer-term cycles for position trading. He recommends an upper bound of 40 bars and a lower bound of 18 bars for swing trading. If traders use smaller lower bounds, Ehlers advises a minimum of eight bars to minimize the potential effects of aliasing.
Data length:
The Griffiths predictor can use a relatively small data length, as autocorrelation diminishes rapidly with lag. However, for optimal spectrum and dominant cycle calculations, the length must match or exceed the upper bound of the bandpass filter. Ehlers recommends avoiding excessively long lengths to maintain responsiveness to shorter-term cycles.

Cloud Matrix [CongTrader]🚀 Cloud Matrix — Advanced Multi-Layer Ichimoku System
Cloud Matrix is an enhanced trend-analysis system built on the public-domain Ichimoku Kinko Hyo methodology.
This indicator delivers a multi-dimensional view of trend, momentum, and market structure, allowing traders to evaluate market conditions at a glance.
Cloud Matrix is not a simple Ichimoku clone. It introduces advanced confirmation logic, multi-timeframe trend filtering, and a modern visual framework designed for today’s dynamic markets.
🔥 Key Features & Highlights
1️⃣ Smart Preset Engine (4 Modes)
Choose from optimized presets for different markets and volatility levels:
Traditional 9/26/52
Crypto Fast 10/30/60
Crypto Medium 20/60/120
Custom Mode
→ Fast, adaptable, and beginner-friendly.
2️⃣ Advanced Trend Confirmation Engine
Cloud Matrix uses a 5-factor scoring system to filter high-quality signals:
Tenkan vs Kijun
Price vs Cloud
Cloud Twist
Chikou Position
Close vs Kijun
A bullish/bearish signal only triggers when multiple Ichimoku conditions align, reducing noise dramatically.
3️⃣ Higher-Timeframe EMA200 Filter
One of the signature strengths of Cloud Matrix:
EMA200 from a higher timeframe
Helps you follow the dominant macro trend
Avoids counter-trend traps
Ideal for swing and position traders
4️⃣ Intelligent Auto Signals
The indicator includes refined and clean signals for:
Bullish / Bearish TK Cross
Bullish / Bearish Kumo Breakout
All signals support:
Labels
Alerts
“Alert on Close” mode to avoid repaint-related confusion
5️⃣ Enhanced Kumo Cloud Visualization
Adjustable opacity (strong / soft)
Clear bullish/bearish cloud shading
Improved readability on fast markets
6️⃣ Real-Time Market State Dashboard
A compact dashboard shows all key Ichimoku conditions:
Price vs Cloud
Cloud Twist (Bullish/Bearish)
Tenkan–Kijun Relationship
Chikou Status
HTF EMA Trend
Active Preset
→ Designed for instant market diagnostics.
🎯 How Traders Use Cloud Matrix
Perfect for:
Trend following
Swing trading
Crypto, Stocks, Forex
Early breakout detection
Filtering low-quality setups
📌 Suggested Usage
Bullish Bias When:
Price is above the Cloud
Cloud Twist is bullish
Tenkan crosses above Kijun
Chikou is above price
HTF EMA200 is bullish
Bearish Bias When:
Opposite conditions apply.
⚠️ Important Note
This indicator is for analysis and educational purposes only.
It does not provide financial advice or guaranteed trading results.
Ichimoku concepts belong to the public domain; this is a modernized expansion built for study and research.
✍️ Author
CongTrader – 2025
Designed to help traders see the market through a multi-layered, structured lens..

ART MACRO PEEK 2025-Info v2 With this indicator you will be able to understand what the (vix, btc, triple aaa, dxy) looks like before entering market in one glance, it will act more like market thermometer.

Trend Gazer: Unified ICT Trading System with Signals# Trend Gazer User Guide (English)
## 📖 Table of Contents
1. (#about-this-indicator)
2. (#quick-start-guide-3-steps)
3. (#detailed-usage)
4. (#settings-customization)
5. (#why-combine-multiple-features)
6. (#faq)
---
## About This Indicator
**Trend Gazer** is an integrated trading system designed to read institutional order flow like professional traders.
### 🎯 3 Problems This Indicator Solves
#### ❌ Problem 1: Too Many Indicators = Information Overload
```
Normal: RSI + MACD + Moving Average + Bollinger Bands... → Cluttered chart
Solution: All integrated into ONE indicator → Clean & Clear
```
#### ❌ Problem 2: Single Indicators Give False Signals
```
Normal: Enter based on RSI alone → Frequent stop-outs
Solution: Structure × Zone × Momentum multi-angle confirmation → Higher win rate
```
#### ❌ Problem 3: Unclear Entry Timing
```
Normal: Know the trend but don't know WHERE to enter
Solution: LS Bounce Signal shows EXACT entry points
```
---
## Quick Start Guide (3 Steps)
### 🚀 STEP 1: Confirm Trend Direction
**Look for CHoCH (Change of Character)**
```
📍 (1.CHoCH) label = Uptrend starting
📍 (a.CHoCH) label = Downtrend starting
```
**Important**: Wait for CHoCH! No direction without it.
---
### 🎯 STEP 2: Find Entry Points
**Wait for LS Bounce Signal (green/red labels)**
```
🟢 "Long@ HL only" label → LONG (buy) candidate
🔴 "Short@ LH only" label → SHORT (sell) candidate
```
**Label text color meaning**:
- **White text**: Clean trend (high confidence)
- **Yellow text**: Trend transition (moderate caution)
---
### 🛡️ STEP 3: Final Confirmation with Bar Color
**Bar color shows market state**
```
🔴 Red bar: BUY zone (buying is favored)
🟢 Green bar: SELL zone (selling is favored)
⚪ White bar: Neutral (wait and see)
```
---
## Detailed Usage
### 📊 Understanding the Chart
#### 1. Labels (Market Structure Changes)
```
(1.CHoCH) / (a.CHoCH) : Trend reversal
(2.SiMS) / (b.SiMS) : Momentum confirmation
(3.BoMS) / (c.BoMS) : Trend continuation
```
#### 2. Boxes (Institutional Order Zones)
```
📦 Blue boxes: Bullish OB (buy orders accumulated)
📦 Red boxes: Bearish OB (sell orders accumulated)
📦 Black transparent boxes: Liquidity Sweep
```
**How to use Order Blocks**:
- Function as support/resistance
- Signals within OB have higher reliability
- Use for stop-loss placement
#### 3. Lines (Trends and Support/Resistance)
```
━━━ Red lines: EMA20, EMA50, EMA100 (short to mid-term trends)
━━━ Blue lines: 60min NPR/BB bands (support/resistance)
```
#### 4. Bar Colors (Filter 6)
```
Bar color = Real-time market state
🔴 Red: Buying is favored
🟢 Green: Selling is favored
⚪ White: Neutral
```
---
### 🎯 Practical Trading Flow
#### 📍 Preparation Phase
```
1. Open chart (recommended: 5min or 15min)
2. Add Trend Gazer to chart
3. Start in observation mode (don't enter yet)
```
#### 📍 Entry Decision
```
✅ CHoCH confirms direction → Uptrend starting
✅ LS Bounce Signal "Long@ HL only" appears
→ Entry point candidate
✅ Bar turns red → Market supports buying
→ Entry decision 🎯
✅ Place stop below nearest Order Block (blue box)
```
#### 📍 Exit Decision
```
🔴 Opposite LS Bounce Signal "Short@ LH only" appears
→ Consider taking profit
🔴 Bar turns green
→ Potential trend reversal, review position
🔴 Stop loss hit
→ Exit with loss
```
---
### 💡 Tips for Higher Win Rate
#### ✅ DO's
```
1. Enter AFTER CHoCH appears
2. Prioritize white-text LS Bounce Signals
3. Check higher timeframe (1H or Daily) trend
4. Emphasize signals within Order Blocks
5. Use bar color as final confirmation
```
#### ❌ DON'Ts
```
1. Enter before CHoCH → No clear direction
2. Enter only on yellow text → Unstable transition period
3. Ignore bar color → Trading against market state
4. Don't check Order Blocks → Unclear support/resistance
5. Enter same direction consecutively → Overtrading
```
---
## Settings Customization
### 🔧 How to Open Settings
```
1. Right-click on indicator name on chart
2. Select "Settings..."
3. Settings panel opens
```
---
### 📋 Recommended Setting Profiles
#### 🔰 Beginner Settings (Simple)
**Goal**: Reduce noise, show only important signals
```
【FILTERS】
✅ Bonus Filter: ON
✅ Filter 6 (OB/BB/NPR Zone Filter): ON
❌ Direction Filter: OFF
❌ Liquidation Reversal Filter: OFF
❌ ICT Market Structure Filter: OFF
❌ EMA Trend Filter: OFF
❌ OB/FVG Filter 1: OFF
❌ OB/FVG Filter 2: OFF
【SIGNALS】
✅ Signal 0 (Bonus): ON
✅ Signal 1 (VWC Change): ON
✅ Signal 2 (Liq Rev): ON
❌ Signal 3 (LS): OFF (complex alone)
❌ Signal 4 (LS Break): OFF
❌ Signal 5 (OB+LS NPR): OFF
❌ Signal 6 (OB+LS EMA): OFF
【LS BOUNCE SIGNAL】
✅ Exclude EMA50 from touch detection: OFF
❌ Only show when EMA fills are mixed: OFF
```
**What happens with this setup**:
- Only Bonus (black background) signals display
- LS Bounce Signals clearly visible
- Noisy signals filtered out
---
#### 💪 Intermediate Settings (Balanced)
**Goal**: Enable key filters for better accuracy
```
【FILTERS】
✅ Bonus Filter: ON
✅ Filter 6 (OB/BB/NPR Zone Filter): ON
✅ ICT Market Structure Filter: ON
❌ Direction Filter: OFF
❌ Liquidation Reversal Filter: OFF
❌ EMA Trend Filter: OFF
❌ OB/FVG Filter 1: OFF
❌ OB/FVG Filter 2: OFF
【SIGNALS】
✅ Signal 0 (Bonus): ON
✅ Signal 1 (VWC Change): ON
✅ Signal 2 (Liq Rev): ON
✅ Signal 3 (LS): ON
❌ Signal 4 (LS Break): OFF
❌ Signal 5 (OB+LS NPR): OFF
❌ Signal 6 (OB+LS EMA): OFF
【LS BOUNCE SIGNAL】
✅ Exclude EMA50 from touch detection: OFF
❌ Only show when EMA fills are mixed: OFF
```
**What happens with this setup**:
- Signals only after CHoCH (trend confirmed)
- Filter 6 changes bar colors
- Liquidity Sweeps also displayed
---
#### 🚀 Advanced Settings (Full Utilization)
**Goal**: Master all features
```
【FILTERS】
✅ Bonus Filter: ON
✅ Filter 6 (OB/BB/NPR Zone Filter): ON
✅ ICT Market Structure Filter: ON
✅ Direction Filter: ON
✅ EMA Trend Filter: ON
❌ Liquidation Reversal Filter: OFF (optional)
✅ OB/FVG Filter 1: ON
✅ OB/FVG Filter 2: ON
【SIGNALS】
✅ All ON
【LS BOUNCE SIGNAL】
✅ Exclude EMA50 from touch detection: ON (reduce EMA50 noise)
✅ Only show when EMA fills are mixed: ON (show only transition zones)
```
**What happens with this setup**:
- Fewer signals (precision-focused)
- Multiple confirmations greatly reduce false signals
- Only signals confirmed by trend, momentum, and zones
---
### 🎨 Display Customization
#### Change Label Size
```
【BUY/SELL SIGNAL APPEARANCE】
→ "BUY/SELL Label Size"
→ Choose from: tiny / small / normal / large / huge
Recommended: small (default)
```
#### Order Block Display Settings
```
【ORDER BLOCK (OB) SETTINGS】
✅ Show Current TF OB: Current timeframe OB
✅ Show 1min OB: 1-minute OB
✅ Show 5min OB: 5-minute OB
✅ Show 15min OB: 15-minute OB
Recommended: Only 15min OB ON (simple)
```
#### Liquidity Sweep Display
```
【LIQUIDITY SWEEPS SETTINGS】
→ "Sweep Length": Sensitivity (small=frequent, large=selective)
→ "Sweep Option": Standard / Maximum
Recommended: Length=40, Option=Standard
```
#### NPR/BB Bands Display
```
【NPR (NON-REPAINT STDEV) SETTINGS】
✅ Display 60min NPR Bands: 60-minute support/resistance
❌ Display Current TF NPR Bands: Current timeframe (optional)
Recommended: Only 60min ON
```
---
### ⚙️ Advanced Settings
#### Fine-tune Filter 6
```
【FINAL FILTERS】
→ "Enable Filter 6 (OB/BB/NPR Zone Filter)"
When ON:
- Bars color-coded red/green/white
- Behavior at OB, NPR/BB touches controlled
```
#### LS Bounce Signal Adjustments
```
【LS BOUNCE SIGNAL】
→ "Exclude EMA50 from touch detection"
OFF: Detect NPR/BB/EMA50 (all 3)
ON: Detect NPR/BB only (exclude EMA50)
→ "Only show when EMA fills are mixed"
OFF: Show all LS Bounce Signals
ON: Show only transition zone signals (yellow text)
```
#### MTF (Multi-Timeframe) Control
```
【ORDER BLOCK (OB) SETTINGS】
→ "Disable MTF on 1hr+ Charts"
ON: Disable MTF on 1H+ (save memory)
OFF: MTF enabled on all timeframes
Recommended: ON (unnecessary on larger timeframes)
```
---
### 🎯 Purpose-Based Configuration Guide
#### 🔍 Goal 1: Reduce Signal Count
```
✅ Bonus Filter: ON
✅ ICT Market Structure Filter: ON
✅ Filter 6: ON
✅ All Signals OFF, only Signal 0 ON
```
#### 🔍 Goal 2: Get More Signals
```
❌ All Filters OFF
✅ All Signals ON
```
#### 🔍 Goal 3: Trend Following Only
```
✅ ICT Market Structure Filter: ON
✅ Direction Filter: ON
✅ EMA Trend Filter: ON
```
#### 🔍 Goal 4: Counter-Trend Trading
```
✅ LS Bounce Signal: ON
✅ Filter 6: ON
❌ ICT Market Structure Filter: OFF
```
#### 🔍 Goal 5: Day Trading (5-15min charts)
```
✅ Show 15min OB: ON
✅ Display 60min NPR Bands: ON
✅ LS Bounce Signal: ON
❌ Show 1min/5min OB: OFF
```
#### 🔍 Goal 6: Scalping (1-5min charts)
```
✅ Show 5min OB: ON
✅ Show 15min OB: ON
✅ Display 60min NPR Bands: ON
✅ All Signals: ON
```
---
### 💾 Saving and Loading Settings
#### Save Settings
```
1. Click "..." in top-right of Settings screen
2. Select "Save as default"
→ Same settings auto-applied next time
```
#### Reset Settings
```
1. Click "..." in top-right of Settings screen
2. Select "Reset settings"
→ Return to default settings
```
---
## Why Combine Multiple Features?
### 🎯 Problem: Single Indicator Limitations
Common trader problems:
```
❌ RSI alone → Trade against trend, lose
❌ Moving Average alone → Late entry timing
❌ Support/Resistance alone → Caught by false breakouts
```
**Markets are complex**. One angle isn't enough.
---
### 💡 Solution: Multi-Angle Integrated Approach
#### 1️⃣ Structure × Zone × Momentum
```
📐 Structure (ICT CHoCH)
→ "Which direction is likely?"
📦 Zone (OB/NPR/BB)
→ "Where will price react?"
💨 Momentum (EMA/VWC)
→ "Is there momentum now?"
```
**When all 3 align = Highest win-rate timing**
---
#### 2️⃣ Multi-Timeframe Analysis
```
Big picture: Confirm Daily direction
Medium-term: Check 1H Order Blocks
Short-term: Time entry on 5min
```
**Short-term entries aligned with higher timeframes = Better win rate**
---
#### 3️⃣ Understanding Liquidity
```
🎣 Institutional strategy:
1. Intentionally move price opposite to stop out retail
2. Then, move in real direction
💡 Liquidity Sweep = Visualize this "trap"
→ Read institutional order flow
```
---
### 🧠 Integration Examples
#### Case 1: RSI Alone vs Integrated System
**Scenario**: RSI at 30 (oversold)
```
❌ RSI-only decision:
→ "Buy!"
→ But downtrend continues, loss 😢
✅ Trend Gazer:
CHoCH check → Still downtrend ❌
Order Block → In Bearish OB ❌
LS Bounce → SHORT signal only ❌
→ Skip or SHORT
→ Avoid loss ✅
```
**Result**: Multiple filters block wrong entry
---
#### Case 2: LS Bounce Signal 2-Stage Logic
**Scenario**: Price touches 60min NPR lower band
```
🔍 Traditional method:
Touched → Buy!
→ But price continues down 😢
✅ Trend Gazer:
Stage 1: NPR touch + red bar → Flag ON
Stage 2: EMA20 crosses above EMA50 → Confirm bounce
→ Now "Long@ HL only" displays
→ Entry → Success ✅
```
**Result**: Not just "touch" but "touch + bounce confirmation" improves accuracy
---
### 🎓 Progressive Learning Design
This indicator is designed for **beginners to advanced**:
```
📖 Beginner (Month 1):
Use only CHoCH + LS Bounce Signal
→ Learn trend and entry points
📖 Intermediate (Months 2-3):
Add Order Block + Bar Color
→ Learn support/resistance and filtering
📖 Advanced (Month 6+):
Master all features
→ Read institutional order flow
```
**Ultimate goal**: Indicator becomes confirmation tool. Your market sense becomes primary.
---
### 🔬 Technical Advantages
#### 1. Non-Repaint STDEV (NPR)
```
Normal Bollinger Bands:
→ Past data changes (repaints)
→ Inaccurate backtesting
NPR:
→ Past data doesn't change (non-repaint)
→ Reliable verification possible
```
#### 2. 2-Stage Signal Logic
```
Traditional: Condition met → Immediate signal
→ Many false signals
Trend Gazer: Condition1 → Flag ON → Condition2 → Signal
→ Confirmation step improves accuracy
```
#### 3. Alternating Filter
```
Problem: Same-direction signals spam
→ Overtrading
Solution: LONG → SHORT → LONG alternating only
→ Prevent unnecessary entries
```
---
### 💎 Conclusion: Why Integration?
```
Single indicator = "Partial truth"
Integrated system = "3D market perspective"
```
**Markets are multifaceted**. One angle isn't enough.
Trend Gazer **integrates multiple screens pros watch simultaneously into ONE**,
allowing beginners to read charts with institutional perspective.
---
## FAQ
### ❓ Q1: Which timeframe is best?
**A**: Depends on trading style
```
Scalping: 1min ~ 5min
Day Trading: 5min ~ 15min
Swing: 1H ~ 4H
```
**Important**: LS Bounce Signal only works on 30min and below.
---
### ❓ Q2: Too many signals, confused
**A**: Enable filters
```
【Recommended Settings】
✅ Bonus Filter: ON
✅ Filter 6: ON
✅ ICT Market Structure Filter: ON
→ Show only Signal 0
```
This significantly reduces signal count.
---
### ❓ Q3: No CHoCH appearing, what to do?
**A**: Wait or check higher timeframe
```
Method 1: Wait for CHoCH (recommended)
Method 2: Check higher timeframe (e.g., Daily) for trend
Method 3: Disable ICT Filter (not recommended)
```
**When trend is unclear, sitting out is also strategy**.
---
### ❓ Q4: LS Bounce Signal not appearing
**A**: Checkpoints
```
1. Are you on 30min or below chart?
→ Doesn't show on 1H+
2. Are NPR/BB bands displayed?
→ Check Settings "Display 60min NPR Bands"
3. Is EMA50 excluded?
→ If "Exclude EMA50" is ON, EMA50 signals won't show
```
---
### ❓ Q5: Bar color not changing?
**A**: Check Filter 6
```
Settings → FINAL FILTERS
→ Confirm "Enable Filter 6 (OB/BB/NPR Zone Filter)" is ON
If ON but still not changing:
→ Current price may be outside OB/NPR/BB zones
```
---
### ❓ Q6: Too many Order Blocks, hard to see
**A**: Narrow down displayed OBs
```
Settings → ORDER BLOCK (OB) SETTINGS
Recommended:
❌ Show Current TF OB: OFF
❌ Show 1min OB: OFF
❌ Show 5min OB: OFF
✅ Show 15min OB: ON (only this)
```
---
### ❓ Q7: How to improve win rate?
**A**: Thorough multiple confirmations
```
Checklist:
✅ CHoCH appeared
✅ LS Bounce Signal (white text)
✅ Bar color matches (red bar=LONG, green bar=SHORT)
✅ Signal within Order Block
✅ Aligns with higher timeframe trend
Enter ONLY when all align
```
---
### ❓ Q8: Want to practice on demo
**A**: Recommended practice method
```
Week 1: Observation only
→ Watch signals and chart movement
→ Resist entering
Weeks 2-3: Keep records
→ Screenshot when signal appears
→ Record subsequent movement
Week 4+: Start demo trading
→ Start with small amounts
→ Continue keeping records
```
---
### ❓ Q9: Are there alert features?
**A**: Yes, multiple alerts available
```
Setup method:
1. Right-click indicator on chart
2. Select "Add Alert..."
3. Choose from:
- ANY ALERT: BUY/SELL Signals
- BUY ONLY ALERT
- SELL ONLY ALERT
- MS UP / MS DOWN
- BAR COLOR: RED / LIME
- LS BOUNCE: LONG / SHORT Signal
```
---
### ❓ Q10: Works on other markets?
**A**: Yes, works on all markets
```
✅ Cryptocurrency (BTC, ETH, etc.)
✅ Forex (EUR/USD, USD/JPY, etc.)
✅ Stocks (individual stocks, indices)
✅ Futures (oil, gold, etc.)
```
Works on any market with price and volume data.
---
## 📋 Disclaimer
### ⚠️ Important Notice
This indicator is for **educational and informational purposes only**.
```
❌ NOT investment advice
❌ Does NOT guarantee profits
❌ Past results do NOT guarantee future performance
```
### Risk Warning
```
⚠️ Trading involves substantial risk
⚠️ Only trade with funds you can afford to lose
⚠️ Practice extensively on demo account before live trading
⚠️ Make your own informed decisions and act at your own risk
```
---
## 📞 Support
### Feedback & Questions
Feel free to ask questions in TradingView comments section.
### Bug Reports
Please report with specific details (timeframe, symbol, screenshots).
---
**Author**: rasukaru666
**License**: Mozilla Public License 2.0
**Last Updated**: December 2025
**Version**: Latest
---
**Thank you for using Trend Gazer!**
**Happy Trading! 📈**
---------------

Inyerneck Quiet Bottom Hunter v36 — Last Sorta-Working VersionQuiet Bottom Hunter v36 — Accurate Description (the sorta-working version that fires signals)
Overview
A mean-reversion bottom-hunting strategy for small-cap stocks (<$2B market cap). Designed to catch slow-bleed stocks that quietly bottom out and rebound 20–60%+. Good for beginners because signals are infrequent and the setup is easy to understand.
Timeframe
Daily (D) — best results on 1-day charts. Works on weekly too, but signals are rarer.
Triggers / Conditions (all must be true at bar close)
Drop from high ≥ 25% from the highest high in the last 100 bars (previous bars only — no repainting)
Volume ≤ 80% of the 50-day average (quiet accumulation, no panic selling left)
RSI(14) ≤ 38 (oversold territory)
Green/flat streak ≥ 2 consecutive days where close ≥ open (shows sellers are exhausted)
When all four line up → tiny green “QB” triangle below the bar
Firing Frequency
1–4 signals per month on an average small-cap stock (depends on market conditions). Some months zero, some months a handful. Not spammy, but not ultra-rare either.
Usage Parameters
Position size: 10% of equity per trade (default — change to 5–20% depending on risk tolerance)
Profit target: 40%
Stop loss: 12%
Hold time: usually 2–8 weeks
Best on low-float, high-volatility small caps (TLRY, SNDL, MVIS, SOUN, INHD, etc.)
Expected Performance (backtested on 2025 small caps)
Win rate: ~80–85%
Average rebound on winners: +30–40%
Some losers when the bottom isn't "quiet" enough
How to use
Add to daily charts of your small-cap watchlist
When “QB” arrow appears, buy at next open or market
Set 40% target / 12% stop or trail it
Wait for the rebound — no day-trading needed

Buy & Sell Arrows - MACD + Best_Solve WPRMACD + Best_Solve Williams %R – Aggressive Trend-Reversal Catcher
(Allow Signals Even in Overbought/Oversold Zones)
This indicator combines the classic MACD histogram with Best_Solve’s popular custom Williams %R (a 0–100 momentum oscillator that behaves more like a fast Stochastic) to deliver clean, high-conviction entry signals on daily (and higher) timeframes.
Core Logic – Only TWO conditions are required
BUY (large green arrow below bar)
MACD histogram is green (bullish momentum)
Williams %R fast line is crossing above OR already above its EMA
SELL (large red arrow above bar)
MACD histogram is red (bearish momentum)
Williams %R fast line is crossing below OR already below its EMA
Unlike most oscillators, this version deliberately removes the traditional “do not buy when overbought / do not sell when oversold” filters. This allows the script to catch powerful trend reversals and explosive moves immediately — even on violent earnings gaps or panic sell-offs (example: META’s -11 % drop on Oct 30 2025 triggered an instant sell even though %R was deeply oversold).
Built-in Clean-Signal Logic
No consecutive buys or sells — each new signal must be preceded by the opposite direction.
This keeps the chart extremely clean and prevents whipsaw clusters during strong trends.
Best Use Cases
Daily and 4H swing trading on stocks, indices, crypto, forex
Excellent for catching sharp reversals after earnings, news events, or overextended moves
Works especially well on high-beta names and growth stocks
Visuals
Large green/red arrows with “BUY” / “SELL” text (your favorite style)
Subtle transparent MACD histogram overlaid on price for instant momentum context
Ready-to-use alerts (“Buy Alert” / “Sell Alert”)
Set it, alert it, trade it — one of the cleanest and most responsive daily reversal systems you’ll find.
Enjoy the edge!

Ichimoku Multi-Timeframe Heatmap 12/5/2025
Multi-Timeframe Ichimoku Heatmap - Scan Your Watchlist in Seconds
This indicator displays all 5 critical Ichimoku signals (Cloud Angle, Lagging Line, Price vs Cloud, Kijun Slope, and Tenkan/Kijun Cross) across 10 timeframes (15s, 1m, 3m, 5m, 15m, 30m, 1h, 4h, Daily, Weekly) in one compact heatmap table. Instantly spot multi-timeframe trend alignment with color-coded cells: green for bullish, red for bearish, and gray for neutral. Perfect for quickly scanning through your entire watchlist to identify the strongest setups with confluent signals across all timeframes.

DXY Volatility Ranges TableThe Dollar Index (DXY) measures the US dollar's value against a basket of six major currencies, including the Euro, Japanese Yen, British Pound, Canadian Dollar, Swedish Krona, and Swiss Franc. Here are some key ranges for the DXY:
- Historical Highs and Lows:
- All-time high: 164.720 in February 1985
- All-time low: 70.698 on March 16, 2008
- Recent Trends:
- Current value: around 99.603 (as of December 5, 2025)
- 52-week high: 129.670 (November 8, 1985)
- 52-week low: 94.650 (projected target by some analysts)
- Volatility Ranges:
- Low volatility: DXY < 95
- Moderate volatility: DXY between 95-105
- High volatility: DXY > 105
- Support and Resistance Levels:
- Support: around 94.650 and 90.00
- Resistance: around 100.15/35 and 105.00

GOD MODE HUNT v2.0 — SCREENER ULTIME 2025test screener pour détecter les crypto basée sur des règles strict

Anchored VWAP + Bands + Signals//@version=5
indicator("Anchored VWAP + Bands + Signals", overlay=true)
// ===== INPUTS =====
anchorTime = input.time(timestamp("2025-12-02 00:00"), "Anchor Date/Time")
std1 = input.float(1.0, "±1σ Band")
std2 = input.float(2.0, "±2σ Band")
// ===== VWAP CALCULATION =====
var float cumPV = 0.0
var float cumVol = 0.0
if time >= anchorTime
cumPV += close * volume
cumVol += volume
vwap = cumVol != 0 ? cumPV / cumVol : na
// ===== STANDARD DEVIATION =====
barsSinceAnchor = bar_index - ta.valuewhen(time >= anchorTime, bar_index, 0)
sd = barsSinceAnchor > 1 ? ta.stdev(close, barsSinceAnchor) : 0
// ===== BANDS =====
upper1 = vwap + std1 * sd
lower1 = vwap - std1 * sd
upper2 = vwap + std2 * sd
lower2 = vwap - std2 * sd
plot(vwap, color=color.orange, title="VWAP")
plot(upper1, color=color.green, title="+1σ Band")
plot(lower1, color=color.green, title="-1σ Band")
plot(upper2, color=color.red, title="+2σ Band")
plot(lower2, color=color.red, title="-2σ Band")
// ===== SIGNALS =====
buySignal = ta.crossover(close, lower1)
sellSignal = ta.crossunder(close, upper1)
plotshape(buySignal, style=shape.triangleup, location=location.belowbar, color=color.green, size=size.small, title="Buy Signal")
plotshape(sellSignal, style=shape.triangledown, location=location.abovebar, color=color.red, size=size.small, title="Sell Signal")
alertcondition(buySignal, title="Buy Alert", message="Price touched lower 1σ band – Buy Opportunity")
alertcondition(sellSignal, title="Sell Alert", message="Price touched upper 1σ band – Sell Opportunity")

Market Movers TrackerMarket Movers Tracker — Live Big-Move + Volume + Gap Screener (2025)
The cleanest, fastest, most beautiful real-time scanner for stocks, crypto, forex — instantly tells you:
• Daily / Session / Weekly % change
• HUGE moves (5%+) and BIG moves (3%+) with glowing background
• Volume spikes (2x+ average) with orange bar highlights
• Gap-up / Gap-down detection with arrows
• Live stats table (movable to any corner)
• “HUGE” / “BIG” / “Normal” status with emoji
• Built-in alerts for huge moves, volume spikes & gaps
Perfect for:
→ Day traders hunting momentum
→ Swing traders catching breakouts
→ Scalpers riding volume explosions
→ Anyone who wants to see the hottest movers at a glance
Works on ANY symbol, ANY timeframe.
Zero lag. Zero repainting. Pure price + volume truth.
No complicated settings — turn it on and instantly see what’s moving the market right now.
Not financial advice. Just the sharpest scanner on TradingView.
Made with love for the degens, apes, and momentum chads & volume junkies.

NQUSB Sector Industry Stocks Strength
A Comprehensive Multi-Industry Performance Comparison Tool
The complete Pine Script code and supporting Python automation scripts are available on GitHub:
GitHub Repository: github.com
Original idea from by www.tradingview.com
━━━━━━━━━━━━━━━━━━━━━━━━━━━━━━━━━━━━━━━━
═══ WHAT'S NEW ═══
4-Level Hierarchical Navigation:
Primary: All 11 NQUSB sectors (NQUSB10, NQUSB15, NQUSB20, etc.)
Secondary (Default): Broad sectors like Technology, Energy
Tertiary: Industry groups within sectors
Quaternary: Individual stocks within industries (37 semiconductors)
Enhanced Stock Coverage:
1,176 total stocks across 129 industries
37 semiconductor stocks
Market-cap weighted selection: 60% tech / 35% others
Range: 1-37 stocks per industry
━━━━━━━━━━━━━━━━━━━━━━━━━━━━━━━━━━━━━━━━
═══ CORE FEATURES ═══
1. Drill-Down/Drill-Up Navigation
View NVDA at different granularity levels:
Quaternary: ● NVDA ranks #3 of 37 semiconductors
Tertiary: ✓ Semiconductors at 85% (strongest in tech hardware)
Secondary: ✓ Tech Hardware at 82% (stronger than software)
Primary: ✓ Technology at 78% (#1 sector overall)
Insight: One indicator, one stock, four perspectives - instantly see if strength is stock-specific, industry-specific, or sector-wide.
━━━━━━━━━━━━━━━━━━━━━━━━━━━━━━━━━━━━━━━━
2. Visual Current Stock Identification
Violet Markers - Instant Recognition:
● (dot) marker when current stock is in top N performers
✕ (cross) marker when current stock is below top N
Violet color (#9C27B0) on both symbol and value labels
Example: "NVDA ● ranks #3 of 37"
━━━━━━━━━━━━━━━━━━━━━━━━━━━━━━━━━━━━━━━━
3. Rank Display in Title
Dynamic title shows performance context:
"Semiconductors (RS Rating - 3 Months) | NVDA ranks #3 of 37"
#1 = Best performer, higher number = lower rank
Total adjusts if current stock auto-added
━━━━━━━━━━━━━━━━━━━━━━━━━━━━━━━━━━━━━━━━
4. Auto-Add Current Stock
Always Included:
Current stock automatically added if not in predefined list
Example: Viewing PRSO → "PRSO ranks #37 of 39 ✕"
Works for any stock - from NVDA to obscure small-caps
Violet markers ensure visibility even when ranked low
━━━━━━━━━━━━━━━━━━━━━━━━━━━━━━━━━━━━━━━━
═══ DUAL PERFORMANCE METRICS ═══
RS Rating (Relative Strength):
Normalized strength score 1-99
Compare stocks across different price ranges
Default benchmark: SPX
% Return:
Simple percentage price change
Direct performance comparison
11 Time Periods:
1 Week, 2 Weeks, 1 Month, 2 Months, 3 Months (Default) , 6 Months, 1 Year, YTD, MTD, QTD, Custom (1-500 days)
Result: 22 analytical combinations (2 metrics × 11 periods)
━━━━━━━━━━━━━━━━━━━━━━━━━━━━━━━━━━━━━━━━
═══ USE CASES ═══
Sector Rotation Analysis:
Is NVDA's strength semiconductors-specific or tech-wide?
Drill through all 4 levels to find answer
Identify which industry groups are leading/lagging
Finding Hidden Gems:
JPM ranks #3 of 13 in Major Banks
But Financials sector weak overall (68%)
= Relative strength play in weak sector
Cross-Industry Comparison:
129 industries covered
Market-wide scan capability
Find strongest performers across all sectors
━━━━━━━━━━━━━━━━━━━━━━━━━━━━━━━━━━━━━━━━
═══ TECHNICAL SPECIFICATIONS ═══
V32 Stats:
Total Industries: 129
Total Stocks: 1,176
File Size: 82,032 bytes (80.1 KB)
Request Limit: 39 max (Semiconductors), 10-16 typical
Granularity Levels: 4 (Primary → Quaternary)
Smart Stock Allocation:
Technology industries: 60% coverage
Other industries: 35% coverage
Market-cap weighted selection
Formula: MIN(39, MAX(5, CEILING(total × percentage)))
━━━━━━━━━━━━━━━━━━━━━━━━━━━━━━━━━━━━━━━━
═══ KEY ADVANTAGES ═══
vs. Single Industry Tools:
✓ 129 industries vs 1
✓ Market-wide perspective
✓ Hierarchical navigation
✓ Sector rotation detection
vs. Manual Comparison:
✓ No ETF research needed
✓ Instant visual markers
✓ Automatic ranking
✓ One-click drill-down
━━━━━━━━━━━━━━━━━━━━━━━━━━━━━━━━━━━━━━━━
For complete documentation, Python automation scripts, and CSV data files:
github.com
Version: V32
Last Updated: 2025-11-30
Pine Script Version: v5

Ultra Reversion DCA Strategy with Manual Leverage - V.1Ultra Reversion DCA Strategy with Manual Leverage - V.1
2025-10-27

MFM – Light Context HUD (Minimal)Overview
MFM Light Context HUD is the free version of the Market Framework Model. It gives you a fast and clean view of the current market regime and phase without signals or chart noise. The HUD shows whether the asset is in a bullish or bearish environment and whether it is in a volatile, compression, drift, or neutral phase. This helps you read structure at a glance.
Asset availability
The free version works only on a selected list of five assets.
Supported symbols are
SP:SPX
TVC:GOLD
BINANCE:BTCUSD
BINANCE:ETHUSDT
OANDA:EURUSD
All other assets show a context banner only.
How it works
The free version uses fixed settings based on the original MFM model. It calculates the regime using a higher timeframe RSI ratio and identifies the current phase using simplified momentum conditions. The chart stays clean. Only a small HUD appears in the top corner. Full visual phases, ratio logic, signals, and auto tune are part of the paid version.
The free version shows the phase name only. It does not display colored phase zones on the chart.
Phase meaning
The Market Framework Model uses four structural phases to describe how the market
behaves. These are not signals but context layers that show the underlying environment.
Volatile (Phase 1)
The market is in a fast, unstable or directional environment. Price can move aggressively with
stronger momentum swings.
Compression (Phase 2)
The market is in a contracting state. Momentum slows and volatility decreases. This phase
often appears before expansion, but it does not predict direction.
Drift (Phase 3)
The market moves in a more controlled, persistent manner. Trends are cleaner and volatility
is lower compared to volatile phases.
No phase
No clear structural condition is active.
These phases describe market structure, not trade entries. They help you understand the conditions you are trading in.
Cross asset context
The Market Framework Model reads markets as a multi layer system. The full version includes cross asset analysis to show whether the asset is acting as a leader or lagger relative to its benchmark. The free version uses the same internal benchmark logic for regime detection but does not display the cross asset layer on the chart.
Cross asset structure is a core part of the MFM model and is fully available in the paid version.
Included in this free version
Higher timeframe regime
Current phase name
Clean chart output
Context only
Works on a selected set of assets
Not included
No forecast signals
No ratio leader or lagger logic
No MRM zones
No MPF timing
No auto tune
The full version contains all features of the complete MFM model.
Full version
You can find the full indicator here:
payhip.com
More information
Model details and documentation:
mfm.inratios.com
Momentum Framework Model free HUD indicator User Guide: mfm.inratios.com
Disclaimer
The Market Framework Model (MFM) and all related materials are provided for educational and informational purposes only. Nothing in this publication, the indicator, or any associated charts should be interpreted as financial advice, investment recommendations, or trading signals. All examples, visualizations, and backtests are illustrative and based on historical data. They do not guarantee or imply any future performance. Financial markets involve risk, including the potential loss of capital, and users remain fully responsible for their own decisions. The author and Inratios© make no representations or warranties regarding the accuracy, completeness, or reliability of the information provided. MFM describes structural market context only and should not be used as the sole basis for trading or investment actions.
By using the MFM indicator or any related insights, you agree to these terms.
© 2025 Inratios. Market Framework Model (MFM) is protected via i-Depot (BOIP) – Ref. 155670. No financial advice.

$TGM | Topological Geometry Mapper (Custom)TGM | Topological Geometry Mapper (Custom) – 2025 Edition
The first indicator that reads market structure the way institutions actually see it: through persistent topological features (Betti-1 collapse) instead of lagging price patterns.
Inspired by algebraic topology and persistent homology, TGM distills regime complexity into a single, real-time proxy using the only two macro instruments that truly matter:
• CBOE:VIX – market fear & convexity
• TVC:DXY – dollar strength & global risk appetite
When the weighted composite β₁ persistence drops below the adaptive threshold → market structure radically simplifies. Noise dies. Order flow aligns. A directional explosion becomes inevitable.
Features
• Structural Barcode Visualization – instantly see complexity collapsing in real time
• Dynamic color system:
→ Neon green = long breakout confirmed
→ red = short breakout confirmed
→ yellow = simplification in progress (awaiting momentum)
→ deep purple = complex/noisy regime
• Clean HUD table with live β₁ value, threshold, regime status and timestamp
• Built-in high-precision alerts (Long / Short / Collapse)
• Zero repaint – uses only confirmed data
• Works on every timeframe and every market
Best used on:
BTC, ETH, ES/NQ, EURUSD, GBPUSD, NAS100, SPX500, Gold – anywhere liquidity is institutional.
This is not another repainted RSI or MACD mashup.
This is structural regime detection at the topological level.
Welcome to the future of market geometry.
Made with love for the real traders.
Open-source. No paywalls. No BS.
#topology #betti #smartmoney #ict #smc #orderflow #regime #institutional

MFM - Light Context HUD (Free)Overview
MFM Light Context HUD is the free version of the Market Framework Model. It gives you a fast and clean view of the current market regime and phase without signals or chart noise. The HUD shows whether the asset is in a bullish or bearish environment and whether it is in a volatile, compression, drift, or neutral phase. This helps you read structure at a glance.
Asset availability
The free version works only on a selected list of five assets.
Supported symbols are
SP:SPX
TVC:GOLD
BINANCE:BTCUSD
BINANCE:ETHUSDT
OANDA:EURUSD
All other assets show a context banner only.
How it works
The free version uses fixed settings based on the original MFM model. It calculates the regime using a higher timeframe RSI ratio and identifies the current phase using simplified momentum conditions. The chart stays clean. Only a small HUD appears in the top corner. Full visual phases, ratio logic, signals, and auto tune are part of the paid version.
The free version shows the phase name only. It does not display colored phase zones on the chart.
Phase meaning
The Market Framework Model uses four structural phases to describe how the market behaves. These are not signals but context layers that show the underlying environment.
Volatile (Phase 1)
The market is in a fast, unstable or directional environment. Price can move aggressively with stronger momentum swings.
Compression (Phase 2)
The market is in a contracting state. Momentum slows and volatility decreases. This phase often appears before expansion, but it does not predict direction.
Drift (Phase 3)
The market moves in a more controlled, persistent manner. Trends are cleaner and volatility is lower compared to volatile phases.
No phase
No clear structural condition is active.
These phases describe market structure, not trade entries. They help you understand the conditions you are trading in.
Cross asset context
The Market Framework Model reads markets as a multi layer system. The full version includes cross asset analysis to show whether the asset is acting as a leader or lagger relative to its benchmark. The free version uses the same internal benchmark logic for regime detection but does not display the cross asset layer on the chart.
Cross asset structure is a core part of the MFM model and is fully available in the paid version.
Included in this free version
Higher timeframe regime
Current phase name
Clean chart output
Context only
Works on a selected set of assets
Not included
No forecast signals
No ratio leader or lagger logic
No MRM zones
No MPF timing
No auto tune
The full version contains all features of the complete MFM model.
Full version
You can find the full indicator here:
payhip.com
More information
Model details and documentation:
mfm.inratios.com
Disclaimer
The Market Framework Model (MFM) and all related materials are provided for educational and informational purposes only. Nothing in this publication, the indicator, or any associated charts should be interpreted as financial advice, investment recommendations, or trading signals. All examples, visualizations, and backtests are illustrative and based on historical data. They do not guarantee or imply any future performance. Financial markets involve risk, including the potential loss of capital, and users remain fully responsible for their own decisions. The author and Inratios© make no representations or warranties regarding the accuracy, completeness, or reliability of the information provided. MFM describes structural market context only and should not be used as the sole basis for trading or investment actions.
By using the MFM indicator or any related insights, you agree to these terms.
© 2025 Inratios. Market Framework Model (MFM) is protected via i-Depot (BOIP) – Ref. 155670. No financial advice.
