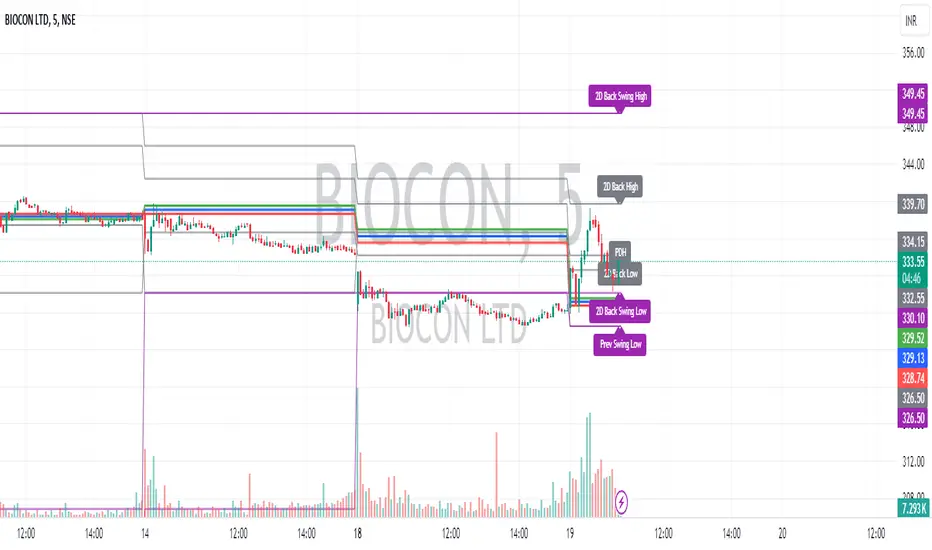
Intraday CPR with Previous Highs and Lows and Swing Highs/LowsThis Pine Script indicator plots the Central Pivot Range (CPR) for the current trading day along with previous day's high (PDH), low (PDL), and swing high/low (Swing H/L) values. It also includes the high, low, and swing high/low values from two days back for reference.
Key Features:
Central Pivot Range (CPR):
Pivot Point (PP): The central pivot point.
Bottom Central Pivot (BC): The lower boundary of the CPR.
Top Central Pivot (TC): The upper boundary of the CPR.
The area between the BC and TC is shaded for better visualization.
Previous Day and Two Days Back Values:
Previous Day High (PDH) and Low (PDL): Plots the high and low of the previous trading day.
Two Days Back High and Low: Plots the high and low from two trading days ago.
Previous Day Swing High/Low: The highest high and lowest low from a specified period (swing period) of the previous trading day.
Two Days Back Swing High/Low: The highest high and lowest low from a specified period (swing period) of two trading days ago.
스크립트에서 "williams"에 대해 찾기


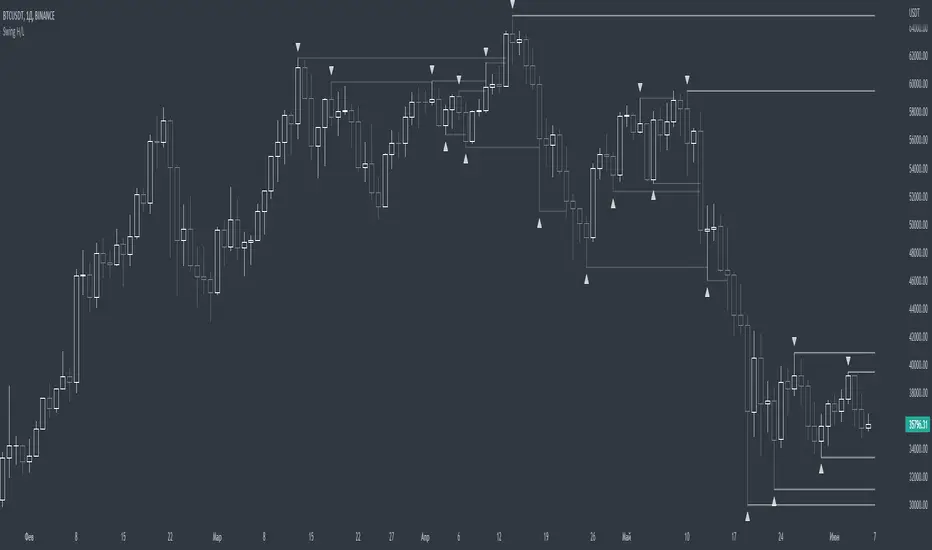
Swing PointsEnglish:
The indicator shows the fractals where stop-losses may be located and can be used to trade from their taking.
You can adjust the length of the fractal (the number of bars with which it is surrounded on both sides, to confirm the validity).
You can also display lines from fractal points for clarity.
To keep the chart clean, you can enable deletion of already taken fractals.
Example of use with deleted fractals and without lines:
Русский:
Индикатор показывает фракталы где могут находиться стоп-лоссы и его можно использовать для торговли от их снятия.
Можно настраивать длину фрактала (количество баров, которыми он окружен с обеих сторон, для подтверждения валидности).
Так же можно выводить линии от фрактальных точек для наглядности.
Для сохранения чистоты графика можно включить удаление уже снятых фракталов.
Пример использования с удалением снятых фракталов и без линий:
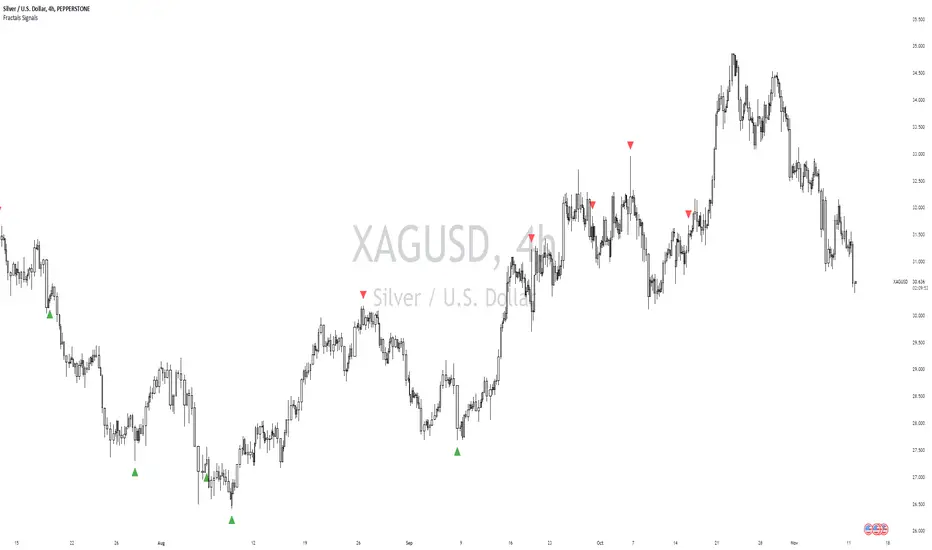
William Fractals + SignalsWilliams Fractals + Trading Signals
This indicator identifies Williams Fractals and generates trading signals based on price sweeps of these fractal levels.
Williams Fractals are specific candlestick patterns that identify potential market turning points. Each fractal requires a minimum of 5 bars (2 before, 1 center, 2 after), though this indicator allows you to customize the number of bars checked.
Up Fractal (High Point) forms when you have a center bar whose HIGH is higher than the highs of 'n' bars before and after it. For example, with n=2, you'd see a pattern where the center bar's high is higher than 2 bars before and 2 bars after it. The indicator also recognizes patterns where up to 4 bars after the center can have equal highs before requiring a lower high.
Down Fractal (Low Point) forms when you have a center bar whose LOW is lower than the lows of 'n' bars before and after it. For example, with n=2, you'd see a pattern where the center bar's low is lower than 2 bars before and 2 bars after it. The indicator also recognizes patterns where up to 4 bars after the center can have equal lows before requiring a higher low.
Trading Signals:
The indicator generates signals when price "sweeps" these fractal levels:
Buy Signal (Green Triangle) triggers when price sweeps a down fractal. This requires price to go BELOW the down fractal's low level and then CLOSE ABOVE it . This pattern often indicates a failed breakdown and potential reversal upward.
Sell Signal (Red Triangle) triggers when price sweeps an up fractal. This requires price to go ABOVE the up fractal's high level and then CLOSE BELOW it. This pattern often indicates a failed breakout and potential reversal downward.
Customizable Settings:
1. Periods (default: 10) - How many bars to check before and after the center bar (minimum value: 2)
2. Maximum Stored Fractals (default: 1) - How many fractal levels to keep in memory. Older levels are removed when this limit is reached to prevent excessive signals and maintain indicator performance.
Important Notes:
• The indicator checks the actual HIGH and LOW prices of each bar, not just closing prices
• Fractal levels are automatically removed after generating a signal to prevent repeated triggers
• Signals are only generated on bar close to avoid false triggers
• Alerts include the ticker symbol and the exact price level where the sweep occurred
Common Use Cases:
• Identifying potential reversal points
• Finding stop-hunt levels where price might reverse
• Setting stop-loss levels above up fractals or below down fractals
• Trading failed breakouts/breakdowns at fractal levels
Tap n Barrel
This indicator implements the Tap n Barrel model.
The model is fully mechanical and follows a defined sequence of steps, removing discretionary ambiguity for the trader.
Instead of reacting to events after they occur, the model identifies a future price level where an entry may be placed. Its logic is based on the 5-minute and 15-minute timeframes and incorporates liquidity concepts, fakeouts, market structure, and Fibonacci OTE levels.
Both the directional bias and the entry criteria are rule-based, and the model targets a fixed 1:3 risk-to-reward ratio. Each element of the framework is informed by data collected across multiple currency pairs, representing over 40 years of combined historical testing.
Indicator features
Automatic market bias detection, or you can input your own
Customise your entry level and RR
Alerts for each stage of the model
Customisable entry and take out alerts for users looking to automate placing trades

Fractals with Flexible Visuals and Auto HTFPurpose:
This indicator displays fractals, including significant ones, with enhanced visual
flexibility and new visualization modes.
Functionality:
- Regular Fractals of Current Timeframe: **
Displays standard fractals based on the current chart timeframe.
- Significant Fractals: **
Recognizes significant fractals through a combination of apexes from the current
timeframe and a higher timeframe (HTF).
- Fractal Filtering: **
- Please note that this option makes some fractals dissapear, but someone finds this
to be useful.
- Fractal filtering has been made separate for Regular and Significant fractals.
- HH/LL Labels: **
HH/LL and LH/HL labels are now available separately for Regular and Significant
fractals.
- Automatic HTF Switching for Significant Fractals:
Added automatic HTF thresholds, removing the need to set HTF manually when changing
the chart's timeframe.
- Marker Relocation Modes:
- Mode 0:0
The fractal appears on the bar when it is recognized, not where it forms. This
mode assists traders who want to observe recognition in real-time when developing
strategies with fractals.
- Mode 1:1
The fractal appears on the previous bar when it is recognized, not where it forms.
- Mode 2:2 (General)
The fractal appears two bars back, where it is recognized, not when.
- Other additional Modes for Significant Fractals:
May be good for experimenting with Significant fractals. The first number
indicates bars back for the current timeframe; the second number indicates
bars back for the higher timeframe.
Other modes may assist with additional filtering or be suitable for specific
pairs or timeframes.
- Visual Adjustments:
Added user settings to customize visuals according to preferences.
Acknowledgment:
This indicator's functionality has been refactored from Fractals V9 by Ricardo
Santos (with gratitude to him):
()
'RSFractals' is not used as a name prefix, reflecting that this version lacks the
Zigzag and Pattern functionalities present in 'RSFractals'. If the original author
prefers a different naming convention, they may contact me, and I will gladly make
the adjustment.

SMC StructuresTitle: SMC Structures Indicator
Description:
The SMC Structures indicator is a powerful tool designed to identify and visualize key structural elements in price action, based on the principles of Smart Money Concepts (SMC). This indicator helps traders identify potential areas of support, resistance, and price reversals by highlighting significant market structures.
Key Features:
Structure Identification: The indicator automatically detects and marks important high and low structures in the market.
Break of Structure (BOS) Detection: It identifies and labels instances where previous structures are broken, indicating potential trend changes or continuations.
Change of Character (CHoCH) Detection: The indicator recognizes and marks Changes of Character, which are significant shifts in market behavior.
Customizable Visuals: Users can personalize the appearance of BOS and CHoCH markings, including colors, line styles, and widths.
Current Structure Display: The indicator can optionally show the current active structure, helping traders understand the immediate market context.
Historical Structure Tracking: Users can specify the number of historical structure breaks to display, allowing for a cleaner chart while maintaining relevant information.
Flexible Break Confirmation: The indicator offers the option to confirm structure breaks using either the candle body or wick, accommodating different trading styles.
Technical Details:
The indicator uses advanced algorithms to identify significant price structures based on local highs and lows.
It employs a lookback period of 10 bars for structure detection, ensuring relevance to current market conditions.
The code includes safeguards to handle different market phases and avoid false signals during ranging periods.
Customization Options:
Colors for Bullish and Bearish BOS and CHoCH markings
Line styles and widths for all structure markings
Number of historical breaks to display
Option to show or hide the current active structure
Choice between candle body or wick for structure break confirmation
Use Cases:
Trend Analysis: Identify the start of new trends or potential trend reversals.
Support and Resistance: Pinpoint key levels where price may react.
Trade Entry and Exit: Use structure breaks as potential entry or exit signals.
Market Context: Understand the broader market structure to make informed trading decisions.
This indicator is particularly useful for traders who follow Smart Money Concepts and those looking to enhance their understanding of market structure. It provides a visual representation of complex market dynamics, helping traders make more informed decisions based on structural analysis.
Note: This indicator is best used in conjunction with other analytical tools and a solid understanding of market dynamics. Always practice proper risk management when using any trading indicator.
Would you like me to explain or break down any part of the code?

Essa's Indicator 2.0Essa's Indicator V2: Beginner's Guide
This custom TradingView indicator has been designed to help you identify key trading opportunities based on session highs/lows, volatility, and moving averages. Below is a breakdown of the main features:
1. Exponential Moving Averages (EMAs)
Fast EMA (Blue Line): Tracks the short-term market trend (default: 9-period EMA).
Slow EMA (Red Line): Tracks the longer-term market trend (default: 21-period EMA).
You can turn on/off the EMAs using the "Show EMAs" option in the settings.
EMAs help smooth out price action and give a clearer picture of trends. A crossover of the fast EMA above the slow EMA can signal an upward trend, while the reverse may indicate a downward trend.
2. Session Highs and Lows
The indicator tracks price highs and lows for three major trading sessions:
London Session (Red): Highlighted in red. Active between 08:00 and 17:00 (LDN timezone) or 03:00 and 12:00 (NY timezone).
New York Session (Blue): Highlighted in blue. Active between 12:00 and 21:00 (LDN timezone) or 07:00 and 16:00 (NY timezone).
Asia Session (Yellow): Highlighted in yellow. Active between 22:00 and 08:00 (LDN timezone) or 18:00 and 03:00 (NY timezone).
Highs and lows for each session are plotted on the chart as lines. Breakouts from these levels can signal important trading opportunities:
London High/Low: Red lines.
New York High/Low: Blue lines.
Asia High/Low: Yellow lines.
The background color also changes depending on the active session:
London: Light red background.
New York: Light blue background.
Asia: Light yellow background.
3. Breakout Alerts
You can set alerts when the price breaks above or below session highs/lows:
Break Above London High: Alert triggered when the price crosses the London session high.
Break Below London Low: Alert triggered when the price falls below the London session low.
Similar alerts exist for the New York and Asia sessions as well.
4. Volatility-Adjusted EMA
The EMAs in this indicator are adjusted based on volatility (ATR - Average True Range). This allows the EMAs to respond to market conditions more dynamically, giving you more accurate trend readings in volatile markets.
5. ZigZag Feature (Optional)
You can enable the ZigZag feature to help visualize the price action's highs and lows:
ZigZag Lines: Highlight major peaks and troughs in price movements, helping you spot trends more easily.
This is helpful for identifying reversals or trend continuations.
6. Fractal Markers
This indicator uses fractals to mark potential turning points in the market:
Green Triangles (Above the Price): Indicate up fractals (potential reversal points where the price could move upwards).
Red Triangles (Below the Price): Indicate down fractals (potential reversal points where the price could move downwards).
Fractals can be a helpful confirmation tool when identifying entry and exit points.
7. Custom Timezone Options
You can choose between London (LDN) and New York (NY) timezones in the settings to adapt the session times to your trading location. This ensures the session high/low markers are displayed correctly for your trading region.
By default, the New York (NY) timezone is enabled for FXCM charts in the UK.
For BTC charts, you will need to switch to the appropriate time zone manually.
Thanks
Essa

Pivotal MomentsPivotal Moments draws lines for each of up to 500 pivot high and pivot low levels that have never been revisited at the present moment in time. After the Pivotal Moments indicator has been loaded onto chart and any of the subsequent realtime bars that are formed touch or cross a pivot level it is deleted. The duration for how long any touched or crossed pivot levels remain on chart before deletion may be extended by N bars or N units of time.
There are user selectable options for the following:
• Pivot Bars Left : the number of lower highs or higher lows that must be formed before a possible pivot bar can occur.
• Right : the number of lower highs or higher lows that must be formed after potential pivot to validate a pivot bar.
• Lines Show As : the choice of line style to use for the drawn pivot levels includes Dashed, Dotted, or Solid.
• Wide : the number of lines wide for how thick the drawn pivot levels are desired to be on the chart.
• Delay Removal : the number of units that touched or crossed pivot levels will persist on chart.
• Units : the choice of which delay unit type includes nBars, nSecs, nMins, nHrs, or nDays.
• Extend Right : the number of bars right of current bar to extend drawn pivot levels.
• Show : the number of maximum recent drawn pivot levels to keep on chart.
• Colors Used : the colors used for pivots high, low, and dual pivot bars.
• Show Price Labels : the choice whether to show prices for levels.
• On Right : the choice to move prices to right of pivot levels.
• Show Pivot Bars : the choice to colorize pivot bars.
If desired, alerts can be received for whenever new touches or crosses occur for both pivot highs and pivot lows by creating a single Alert. Note that these alerts are triggered by realtime bars which by their very nature are repainting prices, thus the alert creation window will warn of this with an orange exclamation symbol. For an illustration of how to create alerts for this indicator click the chart below:
Credit: this indicator was originally built for @Luckshury, who has graciously given me permission to publish it publicly.
NOTICE: This is an example script and not meant to be used as an actual strategy. By using this script or any portion thereof, you acknowledge that you have read and understood that this is for research purposes only and I am not responsible for any financial losses you may incur by using this script!

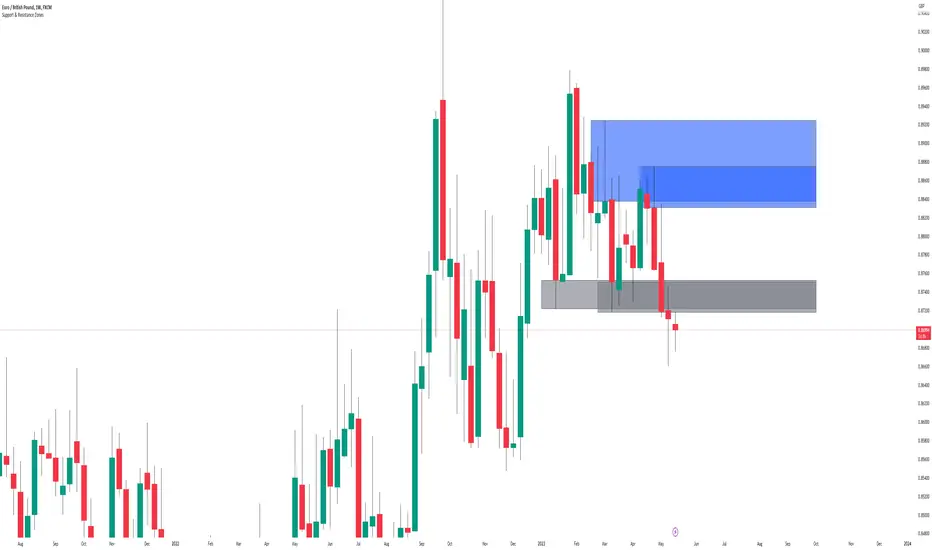
Support & Resistance ZonesTitle: A Comprehensive Guide to the Support & Resistance Zones Indicator
Introduction
In the world of technical analysis, the Support & Resistance Zones indicator plays a crucial role in identifying potential trading opportunities. These zones are essential for traders looking to capitalize on bounces or break and retests. In this article, we will delve into the specifics of the Support & Resistance Zones indicator, outlining how it works, how it finds and marks zones, and the various options available for traders.
What the indicator is about
The Support & Resistance Zones indicator, developed by @HarryCTC, is a powerful tool for detecting areas of potential price reversal or consolidation in a financial market. These zones are significant as they can act as a guide for traders to make informed decisions on entering or exiting positions. Specifically, the indicator helps identify:
1. Support Zones: Areas where the price has a tendency to bounce back up after falling, indicating a potential buying opportunity.
2. Resistance Zones: Areas where the price has a tendency to reverse after rising, indicating a potential selling opportunity.
How the indicator finds its zones
The Support & Resistance Zones indicator utilizes pivot points to identify potential support and resistance levels. By analyzing the fractal structure of the price chart, the indicator identifies key turning points, known as bull and bear fractals. The bull fractal is a high pivot point, while the bear fractal is a low pivot point.
The fractal structure is determined by the 'Switch Zone Period' input, which can be adjusted to suit the trader's preferences. A higher value will result in fewer zones being identified, while a lower value will result in more zones.
How it marks zones and why it marks zones
The indicator marks the support and resistance zones by creating rectangular boxes around the identified fractal points. The zones are extended horizontally from the fractal point, allowing traders to visualize the potential areas of price reversal.
The zones are marked for the following reasons:
1. To provide a clear visual representation of potential support and resistance levels.
2. To help traders identify potential entry and exit points based on the price's reaction to these zones.
3. To serve as a reference for stop-loss and take-profit levels when planning trades.
The indicator's for traders trading bounces or break and retests
Traders who focus on trading bounces or break and retests can benefit immensely from the Support & Resistance Zones indicator. By providing a visual representation of key support and resistance levels, the indicator enables traders to:
1. Identify potential buying opportunities at support zones where the price is likely to bounce back up.
2. Identify potential selling opportunities at resistance zones where the price is likely to reverse after rising.
3. Make informed decisions on stop-loss and take-profit levels based on the price's proximity to support and resistance zones.
4. Monitor the market for potential breakouts or breakdowns when the price breaches these zones.
Indicator options
The Support & Resistance Zones indicator offers several customizable options to suit the trader's preferences. These options include:
1. Switch Zone Period: Adjusts the number of periods used to calculate the fractal structure, influencing the number of identified zones.
2. No. of Displayed Zones: Determines the maximum number of zones displayed on the chart, ranging from 1 to 8.
3. Zone Extension: Adjusts the horizontal extension of the support and resistance zones.
4. Resistance Zone Color: Customizes the color of the resistance zone boxes.
5. Support Zone Color: Customizes the color of the support zone boxes.
6. Zone Border Color: Customizes the color of the zone box borders.
Conclusion
The Support & Resistance Zones indicator is a valuable tool for traders looking to identify potential trading opportunities based on the price's interaction with support and resistance levels. By providing a clear visual representation of these zones, the
indicator allows traders to make informed decisions on entry and exit points, stop-loss, and take-profit levels. With customizable options, the indicator can be tailored to suit individual trading preferences and strategies.
[JL] Fractals ATR BlockI decided to combine Fractal ROC , ATR Break, and Order Blocks to an Indicator
The Fractal ROC , ATR Break, and Order Blocks indicator combines three concepts to help traders identify potential trade opportunities and manage risk. By using a combination of Fractal ROC , ATR Break, and Order Blocks, traders can gain a deeper understanding of market dynamics and make more informed trading decisions.
Fractal ROC is a momentum-based indicator that calculates the rate of change of the price between fractals, which are turning points in the market. It is calculated by taking the difference between the closing price and the lowest price in the previous n+1 periods, and dividing it by the difference between the open price 2n periods ago and the lowest price in the previous n+1 periods. This calculation is done for both up and down fractals. When the Fractal ROC value is greater than the ROC Break Level (as determined by the input variable roclevel), it indicates a potential momentum shift in the market. This can be used to identify potential trade entries or exits, depending on your trading strategy.
ATR Break is an indicator that helps traders identify significant price movements in the market. It measures the distance between the price and the Average True Range (ATR), which is a measure of the volatility of the market. ATR Break is calculated by taking the difference between the close and high/low, and dividing it by the previous ATR value. This calculation is done for both up and down movements. When the ATR Break value is greater than the ATR Break Level (as determined by the input variable atrlevel), it indicates a significant move in the market. This can be used to identify potential breakouts or breakdowns, and can be used to set stop-loss and take-profit levels.
An Order Block is a price level where significant buying or selling activity has taken place. The order blocks made by ATR Break and Fractal ROC are drawn using boxes on the chart. When the ATR or Fractal ROC level is breached, a box is drawn with the high and low of the candle that breached the level as the top and bottom of the box, respectively. The box is then extended to the right until the end of the chart or until another ATR or Fractal ROC level is breached, at which point a new box is drawn. This allows traders to easily identify significant price movements and potential support and resistance levels on the chart. When an Order Block is identified, it can be used as a potential support or resistance level . If price approaches an Order Block from below, it is likely to bounce off this level and continue in an upward direction. Similarly, if price approaches an Order Block from above, it is likely to bounce off this level and continue in a downward direction. Traders can use these levels to identify potential trade entries or exits, as well as to set stop-loss and take-profit levels.
Overall, the Fractal ROC , ATR Break, and Order Blocks indicator is a powerful tool for traders who want to identify potential trade opportunities and manage risk. By combining these three concepts, traders can gain a deeper understanding of market dynamics and make more informed trading decisions. As with any indicator, it is important to use it in conjunction with other analysis tools and to have a clear trading plan in place.

Liquidity Raid - Stop HuntLiquidity Raid - Stop Hunt
The market always seeks liquidity. Liquidity rests above previous highs and below previous lows as many traders see these as obvious points to place their stops. These are areas in the chart where many orders are placed together and serve as tipping points for market makers.
The script marks the breach of a market structure high/low with a vertical line. The script has the option to show the current W,D,4H & 1H market structure high and low.
How to use:
Once a raid occurs, use a higher timeframe to search for high probability supply and demand zones. Price needs to react to something. You may have multiple breaches before a reversal happens as price is likely looking for fresh(untested) zones. So don't trade blindly.
A good understanding of supply and demand concepts, odds enhancers, and how to identify fresh levels is expected to utilise it's full potential.
Lines and colours are all customizable
Alerts function included.
Indicator in use:

CHOCH - MSB for Supply and DemandChange of Character (CHOCH) - Market Structure Break (MSB) for Supply & Demand
Description
The script is designed as a confirmation entry tool to be used with supply and demand zones (predefined proximal and distal levels).
When price hits a predefined level it will monitor price action using fractals and an algorithm to determine a potential reversal in trend or change of trend direction.
Once this has been identified you will be alerted in order to anticipate a retracement entry. A good understanding of supply and demand concepts, odds enhancers, and how to identify fresh levels is expected to utilise it's full potential.
Indicator in use
How To Use
Apply one indicator on a higher timeframe, and another on a lower timeframe. In settings, select long for a demand zone and short for a supply zone. Use the higher timeframe to plot major supply and demand zones and a lower timeframe of your choice for the alert. You can refine your levels by manually entering the price levels in settings. The alert is set on the timeframe you set it on.
Manual Selection
Check "override custom levels" and manually enter the price levels of your proximal and distal lines. Input the time and date of your pivot point (candle). Manual selection is recommended as you can refine your zones.
Automatic Selection
Drag and drop the pivot on the candle of choice . The pivot point will mark the zone using the candle's high and low (default setting). Source for top and bottom levels can be changed in settings.
Start Control after X Bar
This defines how many bars is required (from your pivot point) before it sets to anticipate a breach.

[VDB]TrendScalp-FractalBox-3EMAThere are many indicators with William’s Fractal and Alligator. As many use EMA’s it may be useful to define a 3-EMA ribbon and combining Fractal Levels/Box (filling background between top and bottom fractals) for trend scalping. I searched for this kind of indicator in community – some show fractals, some just levels, some with alligator etc. but couldn't find the one needed. Hence thought of this indicator which may be of interest to other users too.
Key Points:
EMA ribbon is created using 3 EMA’s 35/70/105. Users can change these as per their preference. This is used for trend identification – 1. Bullish bias if Price > EMA1 > EMA2 > EMA3. 2. Bearish bias if Price < EMA1 < EMA2 < EMA3.
Background is marked during crossing of EMA1 and EMA2 to alert possible trend change.
5-bar fractals are used to mark the Fractal levels and background between top and bottom fractals are filled to create a Fractal Box.
Fractal levels are marked only when the fractal formation is complete. Given offset is used this is lagging.
How to Use:
Sloping EMA ribbon is used for identifying the trend.
Fractal box break-out/ break-downs are used to trigger the trade with fractal high/low for entry/SL. Waiting for price contraction towards EMA ribbon resulting in smaller boxes is key to initiate trade. Avoid bigger boxes as SL’s will be big and price may move within. To draw the vertical lines of FractalBox change fractal level0 style to step-line.
This indicator combined with the cycle high/low (overbought/oversold) indicators such as CCI/Stochastic/RSI etc. can make it a good trend scalping setup while trading in the direction of momentum in higher timeframe.
This setup could be used for any timeframes. Do your back-testing before using it in live market.
This indicator was achieved by combing some fractal ideas from “Fractal and Alligator Alerts by JustUncleL”
DISCLAIMER : This indicator has been created for educational reference only and do not constitute investment advice. This indicator should not be relied upon as a substitute for extensive independent market research before making your actual trading decisions. Market data or any other content is subject to change at any time without notice. Liability for any loss or damage, including without limitation any loss of profit, which may arise directly or indirectly from use of this indicator is accountability of user using it.

Liquidity RaidThe market always seeks liquidity. Liquidity rests above previous highs and below previous lows.
The script highlights the breach of a market structure high or low (W/D/4H/1H), and will alert you on the first fractal break in the opposite direction.
The idea is that the raid happens, and you are only alerted once a candle breaks a fractal and closes in the opposite direction.
When a signal is printed, it does not mean to enter immediately. It just means that there is a fractal break in the opposite direction, and that you will need to assess current price action and market structure for a potential trade on pullback.
You still need to take HTF directional bias, market structure, order blocks and imbalances into consideration.
The script is for trading on on smaller time frames (1/2/3/5m).
Fractal periods, lines and colours are all customizable

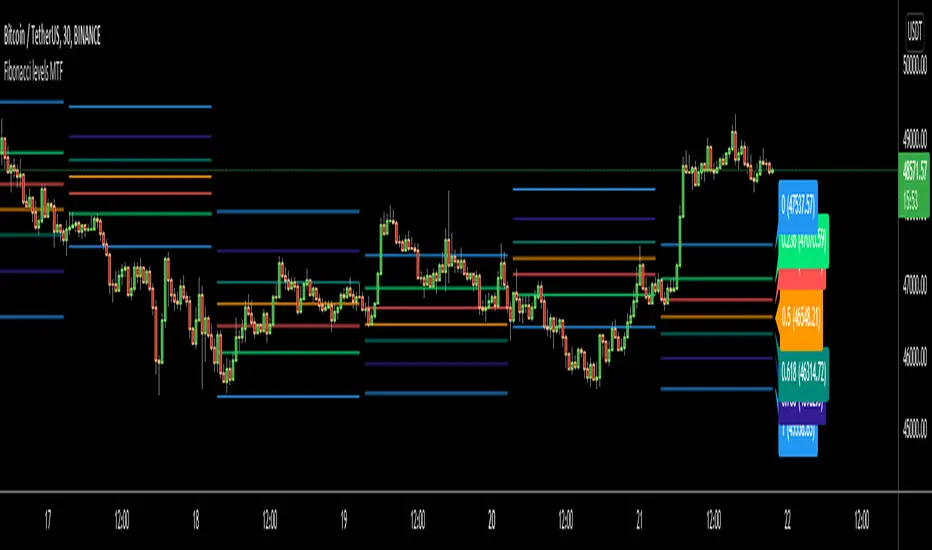
Fibonacci levels MTFHello All,
I got some requests for a script that shows Fibonacci Levels of Higher Time Frame Candles. so I made/published this script. I hope it would be useful for you.
Options:
You can set Higher Time Frame, by default it's 1 Day.
Optionally it can use Current or Last Candle of higher time frame to calculate/show its Fibonacci Levels.
It can show higher time frame candles at the background optionally. You can change its colors.
You can enable/disable/change each Fibonacci levels and their colors.
You can enable/disable Fibonacci Labels that is shown at the right ride and see only Fibonacci lines/levels
example, Fibonacci levels with higher time frame candles:
P.S. if you have ideas to improve this script, drop a comment under the script please
Enjoy!
HPH's FractalTradesThis indicator is based on some dark fractal magic.
Not really, it's inspired by Vladimir Poltoratskiy and basically just waits for the price to go higher or lower than a previous fractal. If that's the case and all the additional settings allow the trade to take place, it is entered with the stop loss at the last opposite fractal of were it was entered (so if we enter a trade because the price went higher than the last up fractal, the sl is at the last down fractal).
The trades are visualised with a stop loss and 3 take profits levels (at a 1:1, 2,1:1 and 4:1 risk/reward ratio). The stop loss will trail once a certain take profit level is reached. Enjoy!
The settings:
LiveVersion : If ticked it will use close for stop losses and take profits. If unticked high and low will be used. Neither is accurate when backtesting as there is no intrabar data...
CancelEarly : Swings trade in the opposite direction when an opposite signal is received. If unticked the trade will continue until a tp or sl is hit.
ShowStats : Show a table in the top right displaying how many times the stop losses or take profits got hit.
FractalPeriods : Number of bars that are required for a fractal. E.g. if it's 2, 2 bars need to be lower on the left and right of a candle for it to print an up fractal.
MinFractalDiv : If this is bigger than 0, it will not allow new fractals to print unless they are at least a percentage based amount bigger than the last one. So this can be used to filter out fractals that are in the same range. Bigger value = more aggressive filtering!
TicksOnFractal : Tick based offset to add onto the fractals to enter trades. E.g. if it's 5 and the price goes above an up fractal, it needs to go up 5 more ticks to enter a trade.
UseFilter, FilterMultMin and FilterMultMax : If ticked, trades are limited to the once in the specified range (distance of the stop loss). E.g. if FilterMultMax is 0.05, the stop loss can not be bigger than 5% of the assets price for the trade to take place.

Fractal Fire Zones/Wave RiderMulti timeframe confluence reader: This indicator plots fractals on any specific timeframe selected, multi time frame ema cross that changes color with the trend, multi timeframe 200ema and a calculation that shows potential turning points with a multi timeframe stochastic oscillator confluence. The fire zones are preferred in a ranging market or for potential scalps while the ema trend is designed to keep you with the main trend in any given session. The accumulation/distribution candles can be used to gauge pull backs for re entry or exits based on time or multiple confirmations.

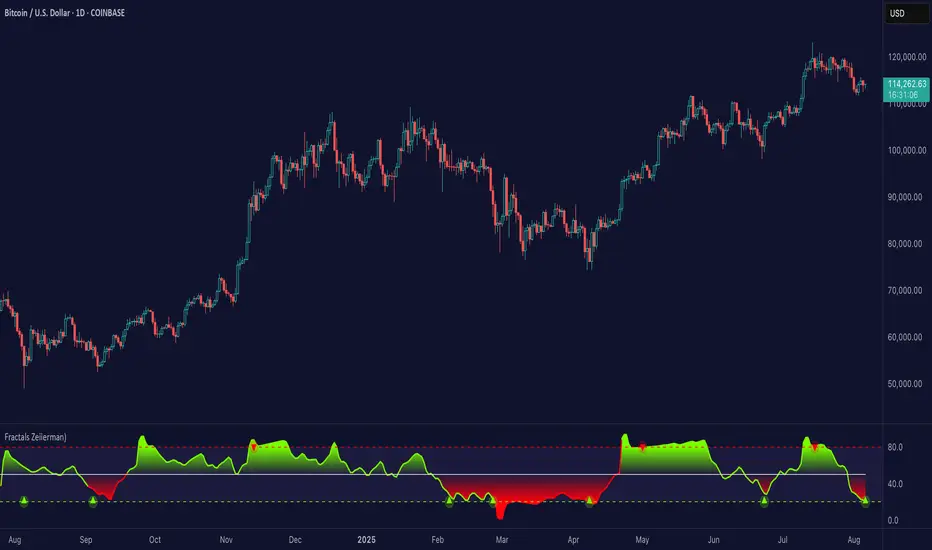
Fractals (Expo)
Fractals (Expo) make use of fractals to identify trends and reversals. The indicator is designed to adapt smoothly and quickly to significant price moves in order to identify trend reversals as well as filtering out noise in an established trend. The indicator is simple to use and understand therefore valuable to all trading styles.
The user has the ability to enable a custom input source which gives the user great flexibility and full control over what the calculations should be based on. The default input source is fractals from the swing points of the market.
Real-Time Trend Alerts
No Repainting
Works on any market and in any timeframe
HOW TO USE
Use the indicator to gain insights into trends and trend reversals.
Identify Trends
Identify Trend reversals
Use it as a Trend filter
INDICATOR IN ACTION
Daily Chart
I hope you find this indicator useful , and please comment or contact me if you like the script or have any questions/suggestions for future improvements. Thanks!
I will continually work on this indicator, so please share your experience and feedback as it will enable me to make even better improvements. Thanks to everyone that has already contacted me regarding my scripts. Your feedback is valuable for future developments!
-----------------
Disclaimer
Copyright by Zeiierman.
The information contained in my scripts/indicators/ideas does not constitute financial advice or a solicitation to buy or sell any securities of any type. I will not accept liability for any loss or damage, including without limitation any loss of profit, which may arise directly or indirectly from the use of or reliance on such information.
All investments involve risk, and the past performance of a security, industry, sector, market, financial product, trading strategy, or individual’s trading does not guarantee future results or returns. Investors are fully responsible for any investment decisions they make. Such decisions should be based solely on an evaluation of their financial circumstances, investment objectives, risk tolerance, and liquidity needs.
My scripts/indicators/strategies/ideas are only for educational purposes!
ACCESS THE INDICATOR
• Contact me on TradingView or use the links below
Trend LineBasic Trend Line base on fractals (v0.1)
Can not draw a line on the future X axis, So just a line segment but not a ray.
I don't have a better idea to upgrade...

Fractal SL OverlayThis Fractal Stop-Loss Overlay sets a trailing fractal top and bottom to help identify the support and resistances for the current candle.
Use the link below to obtain access to this indicator

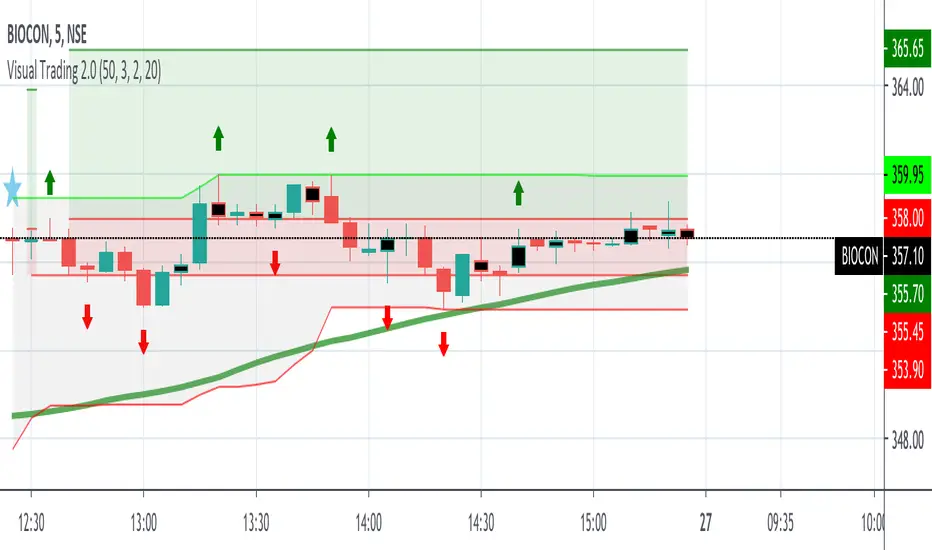
VT SMA 50 DC with FractalsBuying or Selling levels are identified with SMA 50 along with Fractals for breakouts and reversals.
SMA will be green when the trend is Bullish
SMA will be red when the trend is Bearish
The color is set GREEN and RED for Bullish and Bearish trend