Upgraded WatermarkThis mimics the built in watermark feature, but adds the ability to change location as well as see an equities sector and industry group. Pine Script® 인디케이터Amphibiantrading의업데이트됨 55483
Streamer WatermarkThis unique indicator doesn’t help you trade but it makes your charts look super clean and professional in images and live streams! This indicator works by displaying two tables. The first table has day of the week, date, and free form text. The second table has ticker symbol and timeframe of the current chart. Everything about the tables and the cells is completely controllable by the user! Here is a breakdown of how customizable the user can make this indicator: Table: Toggle each table to be displayed on or off Move each table into 9 different locations around the chart Move each table separately Table background color and transparency Table border color and transparency Table border width Table frame width Cells: Each cell can be individually toggled on or off (the table will resize dynamically) Cell text color and transparency Text size with 6 different options Date format with 12 different formats Input Text: Text Emoji Text & emojis ASCII characters Symbols Anything that can by copied and pasted Any combination of the above Notes Use text size “Auto” if viewing the same chart on desktop and on smart phone (Auto makes the text scale based upon screen size) Gallery Disclaimer Please read the TradingView House Rules carefully before using this indicator to add text, symbols, characters, or anything else to your charts and posting on TradingView Ideas or Scripts. This indicator and the author are not responsible for users not reading, fully understanding, and abiding by TradingView’s House Rules. Please watermark responsibly. Pine Script® 인디케이터Infinity_Trading_의11260
AG FX - WatermarkHi guys, If you are looking to add some watermark into your charts. You can use this indicator. You can add add a title and a subtitle, if you want to write in diferents lines, you can use \n as you can see in the script. All the features are customizable: position, text size, text color, background. Enjoy it.Pine Script® 인디케이터AGFXTRADING의업데이트됨 4141 5.9 K
WatermarkLook in the lower-left corner of this chart. If you load the script on your chart, you will see how the watermark animates. You can personalize it in the script's "Settings/Inputs" tab to use it in your chart snapshots. Do keep in mind that if you use it when publishing ideas, videos or scripts, House Rules prohibit advertising on your chart. For Pine coders This script uses our new table feature in Pine to position a watermark on the chart, and the new varip type of variable to animate it. Look first. Then leap. Pine Script® 인디케이터TradingView의업데이트됨 3737 2.1 K
watermarkA little indicator to show what pair your chart is presenting so people can easily see what they are dealing with you can also put your signature beside it so you can be easily recognizable.Pine Script® 인디케이터ashkanpower의업데이트됨 1717393
Watermark Indicator Overview The Custom Watermark Indicator is a versatile Pine Script tool designed to enhance your TradingView charts with personalized text elements. This indicator allows users to add custom quotes and symbol information directly onto their charts, providing a unique way to display motivational messages, trading information, or any other text-based content. Features Customizable Quote Display: Text Content: Users can input any desired text to be displayed as a quote on the chart. Positioning: The quote can be positioned at various locations on the chart (top, middle, bottom; left, center, right). Styling: Options to customize the text color, background color, and size. Borders around the text can also be toggled on or off. Symbol Information Display: Text Content: Users can input additional text to accompany the symbol information. Symbol Details: Options to display the ticker symbol, the timeframe, and the date. Positioning: Similar to the quote, the symbol information can be positioned at various locations on the chart. Styling: Customizable text color, background color, and size, with optional borders. How to Use Adding the Indicator: Add the indicator to your TradingView chart by selecting it from the indicators list or by pasting the script into the Pine Editor and adding it to the chart. Configuring the Quote: Show Quote: Toggle the visibility of the quote. Quote Text: Enter your desired quote in the provided text area. Positioning: Choose the vertical and horizontal positions for the quote. Styling: Adjust the text color, background color, and size. Optionally, hide the border around the text. Configuring the Symbol Information: Show Symbol Info: Toggle the visibility of the symbol information. Additional Text: Enter any additional text you want to display with the symbol information. Details to Display: Select which details to show (ticker symbol, timeframe, date). Positioning: Choose the vertical and horizontal positions for the symbol information. Styling: Adjust the text color, background color, and size. Optionally, hide the border around the text. Practical Applications Motivational Quotes: Keep yourself motivated by displaying your favorite trading quotes or personal affirmations. Trading Information: Display important trading details such as the symbol, timeframe, and date in a prominent location on your chart. Customization: Personalize your chart workspace to make it more engaging and tailored to your preferences. Conclusion The Custom Watermark Indicator is a powerful tool for traders looking to add a personal touch to their TradingView charts. With its flexible configuration options and easy-to-use interface, it allows for a high degree of customization to meet the unique needs of each trader. Whether for motivation, information, or aesthetics, this indicator enhances the charting experience by integrating valuable textual elements seamlessly.Pine Script® 인디케이터Skinwah의81
Watermark Light - JDThis is a "light" version of the built-in watermark on Tradingview. It allows you to quickly see the timeframes (and/or ticker symbol) of the various charts in a multichart environment, without having the watermark fill up your whole screen and obscuring your actual chart! ;-) Here's an example of the use case. If you would like to see more options added, please let me know. Enjoy! Gr, JD.Pine Script® 인디케이터Duyck의업데이트됨 1717442
Green13 - Watermark with Daily ATRWatermark with custom texts and with Daily ATR and the name of the weekPine Script® 인디케이터scorpion11133의업데이트됨 5
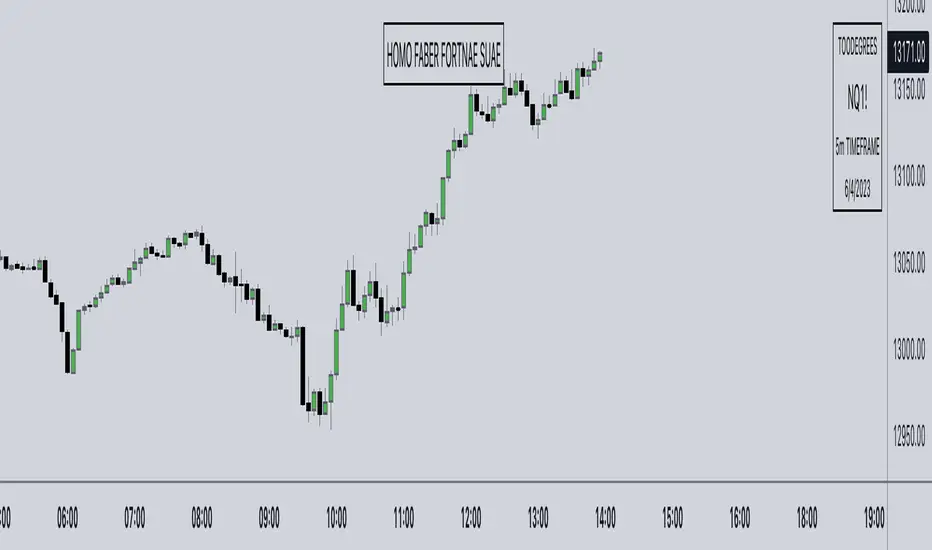
Watermark° (Quote, Name, Timeframe, Date)I have been asked for this a lot, so here it is! It's an easy script to read, and for all you aspiring Pinescript coders out there it might serve as a little introduction on Tables , switch operator, and a bit of UI/UX! Description: This is just a watermark, which follows my personal style an aesthetic when it comes to Pinescript tools. I like to keep my charts clean to focus on Time and price, and I love to have a reminder to remain disciplined. Homo Faber Fortunae Suae is a Latin maxim which loosely translates to: Humans Are The Makers Of Their Own Destiny. So make your own destiny, master yourself and the charts! Indicator Features: – Display symbol ticker, timeframe and date all in one place. – Make it look nice 🤗 – Protect your TV username ID, by having your chart show a custom username (if you are sharing charts outside of Tradingview, and are known under a different alias there) Note: no matter what, by exporting images from TV (copy image/copy link to chart) your TV username will appear in the top left corner of the image 👇👁 Pine Script® 인디케이터toodegrees의업데이트됨 1515 2 K
ICT Watermark | FluxxDescription: The watermark indicator is designed to enhance the visual presentation of your trading charts by adding customizable watermarks. This tool allows you to overlay essential information, such as ticker symbols, timeframes, dates, and custom text, directly onto your charts. While providing larger text options then all other watermarks currently available. Key Features: Customizable Watermarks: Users can enable up to two watermarks with adjustable text content, color, size, and position. Dynamic Information Display: Option to display real-time symbol and timeframe details, as well as the current date. Flexible Placement: Watermarks can be positioned at the top, middle, or bottom of the chart, and aligned to the left, center, or right. Multiple Size Options: Includes a variety of text sizes, making the text larger than any other watermark out there! Use Cases: Branding: Add your name or brand to your charts for a personalized touch. Clarity: Overlay important chart details without obstructing the main content, helping in presentations or shared analysis. This indicator is original and valuable for traders who seek to enhance the clarity and professionalism of their charts. It is particularly useful for those who create educational content or wish to maintain consistent chart branding.Pine Script® 인디케이터FluxxTrades의업데이트됨 11107
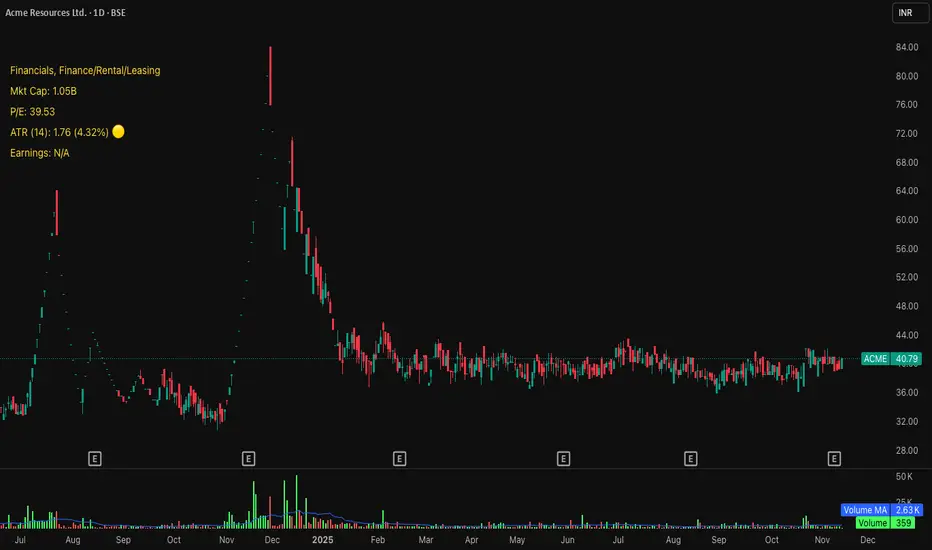
Tchwella Stocks Custom WatermarkThis Pine Script v5 indicator adds a customizable watermark to TradingView charts, displaying key stock information while allowing for flexible positioning and formatting. 📌 Features & Functionality: ✅ Custom Positioning: • Fixed to the top-left corner. • Adjustable spacing ensures the text is properly aligned. ✅ Displayed Information (Configurable): • Company Name & Market Cap (Optional: Shows dynamically calculated market cap) • Stock Ticker & Timeframe • Industry & Sector ✅ Customization Options: • Font Size: Huge, Large, Normal, Small • Text Color & Transparency: Adjustable • Proper Left Alignment for a clean, structured display • Vertical Offset Tweaks to move text down for better visibility ✅ Optimized Table Layout: • Uses table.new() for persistent placement. • Added an empty row to fine-tune positioning, ensuring the watermark doesn’t overlap key chart areas. 🔧 Use Case: Designed for traders who want a clear, customizable stock watermark to enhance their charting experience without obstructing price action. Feb 1 Release Notes Updated version: now you can decide your location for the watermark Micha Stocks Custom Watermark (MSWM) – TradingView Script This Pine Script v5 indicator adds a customizable watermark to TradingView charts, displaying key stock information while allowing for flexible positioning and formatting. 📌 Features & Functionality: ✅ Custom Positioning: • Fixed to the top-left corner. • Adjustable spacing ensures the text is properly aligned. ✅ Displayed Information (Configurable): • Company Name & Market Cap (Optional: Shows dynamically calculated market cap) • Stock Ticker & Timeframe • Industry & Sector ✅ Customization Options: • Font Size: Huge, Large, Normal, Small • Text Color & Transparency: Adjustable • Proper Left Alignment for a clean, structured display • Vertical Offset Tweaks to move text down for better visibility ✅ Optimized Table Layout: • Uses table.new() for persistent placement. • Added an empty row to fine-tune positioning, ensuring the watermark doesn’t overlap key chart areas. 🔧 Use Case: Designed for traders who want a clear, customizable stock watermark to enhance their charting experience without obstructing price action. Feb 7 Release Notes Micha Stocks Custom Watermark – Updated Version 🚀 This updated Micha Stocks Custom Watermark script enhances your TradingView experience by adding an ATR-based volatility signal alongside the existing customizable stock watermark. 🆕 New Features & Improvements: ✅ ATR (14-Day) with Dynamic Volatility Indicator • Displays the ATR value and its percentage relative to price. • Includes a color-coded volatility signal: • 🔴 High Volatility (Above user-defined Red Threshold) • 🟡 Moderate Volatility (Between Red & Yellow Thresholds) • 🟢 Low Volatility (Below user-defined Yellow Threshold) ✅ Fully Customizable ATR Thresholds • Users can set their own ATR % levels for Red, Yellow, and Green signals. ✅ Improved Watermark Customization • Users can still adjust the position, size, and color of the watermark. • Includes Company Name, Ticker, Market Cap, Industry, and Sector. • ATR can be turned on/off in settings for flexibility. 🔧 How to Use: 1️⃣ Go to Indicator Settings → Enable or Disable ATR Display 2️⃣ Adjust ATR % Thresholds to fit your volatility preference 3️⃣ Customize Text Position, Color, and Size to match your chart setup This update makes it easier to quickly assess market volatility while keeping a clean and professional chart layout. 💡 Why Use This Indicator? • Effortlessly track key stock info without cluttering your chart. • Quickly identify volatile conditions using ATR percentage signals. • Adjust settings on the fly to match your trading strategy. 📢 Update Now & Enjoy a Smarter Charting Experience! Pine Script® 인디케이터khoushy의8
NCI - Timeframe + WatermarkDeveloped by Jayce in June 2022 and later updated by Light in January 2024. Key Features: Customizable Watermark: Enhance your chart with a personalized watermark. Enter any text, like your trading mantra or brand name, to keep your focus aligned with your trading strategy. Adjustable Font Size: Tailor the appearance of your watermark and notes with adjustable font sizes, ranging from "Tiny" to "Huge," ensuring optimal visibility and integration with your chart setup. Timeframe Display: Stay informed of the current chart's timeframe, neatly displayed alongside your chosen watermark. Whether you're analyzing trends in minutes, hours, or days, this feature keeps you oriented without cluttering your workspace. Inspirational Note: Complement your watermark with an inspirational note or a quick reminder of your trading discipline and risk management strategies, keeping your principles front and center.Pine Script® 인디케이터LightNCI의1135
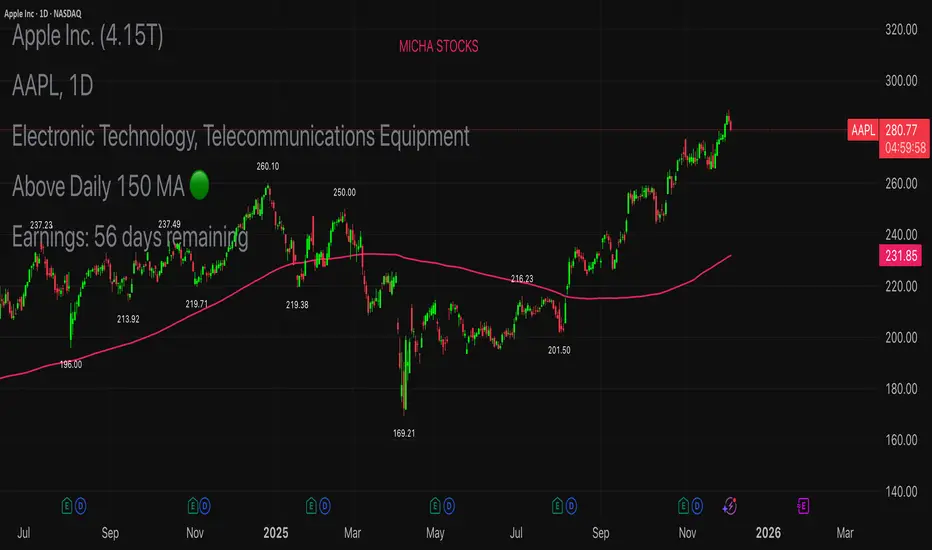
Michael's Custom Watermark🔷 MICHAEL'S CUSTOM WATERMARK INDICATOR ━━━━━━━━━━━━━━━━━━━━━━━━━━━━━━━━━━━━━━━ 📊 OVERVIEW A comprehensive chart watermark overlay that displays essential fundamental and technical information for stocks in a clean, customizable table format. Perfect for traders who want quick access to key metrics without cluttering their charts. ━━━━━━━━━━━━━━━━━━━━━━━━━━━━━━━━━━━━━━━ ✨ KEY FEATURES 📊 Fundamental Data Display — Shows Industry, Sector, Market Cap, and P/E Ratio 📅 Earnings Information — Displays next earnings date with countdown timer 📈 ATR Volatility Indicator — 14-day ATR with color-coded visual alerts (🔴🟡🟢) 🎨 Auto Theme Detection — Automatically adjusts text color based on chart background ⚙️ Fully Customizable — Position, colors, size, and displayed metrics all adjustable 🏢 GICS Sector Mapping — Heuristic-based sector classification aligned with industry standards ━━━━━━━━━━━━━━━━━━━━━━━━━━━━━━━━━━━━━━━ 🎯 WHAT MAKES THIS INDICATOR UNIQUE? Unlike basic watermarks, this indicator provides: Real-time fundamental data integration Smart theme-aware color adaptation for both light and dark charts Configurable volatility alerts using ATR thresholds Earnings countdown feature to never miss important dates Optimized display that only shows relevant data for the current symbol type ━━━━━━━━━━━━━━━━━━━━━━━━━━━━━━━━━━━━━━━ 📖 HOW TO USE 1. BASIC SETUP Add the indicator to your chart. By default, it displays in the top-left corner with all features enabled. 2. POSITIONING Vertical Location: Top, Middle, or Bottom Horizontal Location: Left, Center, or Right Vertical Offset: Fine-tune position with 0-50 pixel offset from top 3. CUSTOMIZATION OPTIONS TEXT APPEARANCE: Auto Text Color — Enable to automatically adapt text color to your chart theme Manual Color — Set a fixed text color if auto-color is disabled Text Size — Choose from Huge, Large, Normal, or Small Theme Colors — Customize text color for light and dark backgrounds separately DATA DISPLAY TOGGLES: Show Industry & Sector — Display heuristic-based GICS-aligned sector and industry classification Show Market Cap — View market capitalization in T/B/M format Show P/E Ratio — Display Price-to-Earnings ratio (stocks only) Show ATR (14-Day) — Display Average True Range with percentage and visual indicator Show Next Earnings — Display upcoming earnings information Show Earnings Countdown — Show days remaining until next earnings (requires earnings display) 4. ATR VOLATILITY ALERTS Configure custom thresholds to monitor volatility: Red Threshold — ATR percentage that triggers red alert 🔴 (default: 6%) Yellow Threshold — ATR percentage that triggers yellow alert 🟡 (default: 3%) Green — Shows automatically when ATR is below yellow threshold 🟢 ━━━━━━━━━━━━━━━━━━━━━━━━━━━━━━━━━━━━━━━ 📐 UNDERSTANDING THE DISPLAY 🏢 SECTOR & INDUSTRY Shows the GICS sector classification followed by the specific industry. The indicator uses heuristic-based mapping to align TradingView sectors with standard GICS classifications. Note that this mapping is based on keyword detection and industry analysis, so while generally accurate, it may not perfectly match official GICS classifications in all cases. 💰 MARKET CAP Displays market capitalization using standard abbreviations: T = Trillion B = Billion M = Million 📊 P/E RATIO Shows the trailing twelve-month Price-to-Earnings ratio. Only displayed for stocks when enabled. Shows "N/A" if data is unavailable. 📈 ATR (14-DAY) Displays the 14-period Average True Range in both absolute value and percentage terms, with a color-coded indicator: 🔴 Red: High volatility (above red threshold) 🟡 Yellow: Moderate volatility (between yellow and red thresholds) 🟢 Green: Low volatility (below yellow threshold) 📅 EARNINGS Shows earnings information in three formats: "X days remaining" — When countdown is enabled and earnings date is known "Upcoming" — When date is in the future but countdown is disabled "Recently Reported" — When earnings just occurred "N/A" — When no earnings data is available ━━━━━━━━━━━━━━━━━━━━━━━━━━━━━━━━━━━━━━━ ⚙️ TECHNICAL DETAILS SUPPORTED INSTRUMENTS: Optimized for stocks with full fundamental data Works with other instruments (crypto, forex, futures) but only displays applicable metrics Automatically suppresses irrelevant data (e.g., P/E for non-stocks) PERFORMANCE: Lightweight overlay with minimal resource usage Updates only on last bar for efficiency No historical recalculation needed COMPATIBILITY: Pine Script v6 Works on all timeframes Compatible with all chart types Auto-adapts to theme changes ━━━━━━━━━━━━━━━━━━━━━━━━━━━━━━━━━━━━━━━ 💡 TIPS & BEST PRACTICES Enable Auto Text Color for seamless theme switching between light and dark modes Adjust vertical offset to avoid overlap with price action in high-volatility periods Use ATR thresholds appropriate to your trading style and asset class Disable features you don't use to keep the watermark clean and focused Position in corners to maximize chart viewing space Use smaller text size for multi-panel layouts ━━━━━━━━━━━━━━━━━━━━━━━━━━━━━━━━━━━━━━━ 🔧 TROUBLESHOOTING "N/A" SHOWING FOR P/E RATIO: This is normal for non-stock instruments May occur for stocks with negative earnings Check if fundamental data is available for the symbol EARNINGS SHOWING "N/A": Earnings data may not be available for all stocks Check TradingView's data coverage for your symbol TEXT COLOR NOT VISIBLE: Enable Auto Text Color feature Manually set text color to contrast with your chart background Adjust custom light/dark text colors in settings ━━━━━━━━━━━━━━━━━━━━━━━━━━━━━━━━━━━━━━━ ⚠️ DISCLAIMER This indicator is for informational purposes only. The fundamental data displayed is sourced from TradingView's data providers. Always verify critical information before making trading decisions. Past performance is not indicative of future results. ━━━━━━━━━━━━━━━━━━━━━━━━━━━━━━━━━━━━━━━ If you find this indicator helpful, please give it a boost 🚀 and share your feedback in the comments! Version: 1.0 Pine Script Version: v6 Created by: Michael Pine Script® 인디케이터ehudm1의4
ICT Essentials [LDT]ICT Essentials Overview ICT Essentials is an all-in-one trading utility built to create a natural and efficient workflow for ICT-based traders. Every component has been designed to integrate seamlessly and update dynamically across timeframes. The indicator focuses on clarity, performance and customization, allowing traders to tailor every part of their trading experience. Equal Highs & Lows This feature automatically detects and marks Equal Highs (EQH) and Equal Lows (EQL) with full control over visuals and behavior. Users can customize line colors, widths, and styles, label size, color, background transparency and text offset. The logic uses an optimized scanning and caching system that maintains smooth performance even on higher timeframes. It provides a precise and adaptive way to identify structural liquidity points whilst keeping the chart clean and readable. Killzones & Session Pivots Plots the main trading sessions such as Asia, London and New York (AM, Lunch, PM) with full flexibility and styling options. Each session can be enabled or disabled individually, with its own color, transparency and label preferences. Session highs and lows are automatically tracked and plotted as pivots with extension modes like Until Mitigated or Past Mitigation. This system gives traders the ability to organize market sessions exactly how they prefer whilst keeping the chart consistent and efficient. Daily Pivots and Tier System Alongside session pivots, the script tracks daily highs and lows to provide a broader structural view of price. These pivots are stored and displayed on the chart with their appearance updating automatically when price interacts with them. The system includes a unique tier-based visibility filter that maintains a clean chart by preventing duplicate or overlapping pivots. Recent daily pivots are cached and compared to session pivots and when two levels fall within a defined proximity, the redundant one is automatically hidden. This creates a clear hierarchy of daily and session levels, keeping the most relevant structure visible whilst removing noise. All aspects of the daily pivot system are fully customizable, including the number of tracked pivots, color, style settings and how mitigated levels are handled. The caching and filtering logic ensures smooth performance and a visually organized workspace even as the data updates in real time. Key Times Allows up to five custom key time markers such as the Midnight Open, 6:00 AM or 10:00 AM. Each marker can be fully customized with its own text, color, line style and thickness. This makes it simple to visualize key reaction points that align with each traders timing model. Higher Timeframe Candles Displays higher timeframe candles such as 1H, 4H or Daily directly on the active chart to provide context without switching views. Users can customize body, wick and border colors, along with adding optional trace lines for the open, close, high and low and can also show the countdown timers for remaining candle time. Adjustable spacing, positioning and label visibility makes the display blend naturally with any trading setup. This module helps traders connect multiple timeframes visually in a clean and intuitive way. Watermark Adds a customizable watermark with title, subtitle and symbol or timeframe information. Every element can be adjusted for color, size, transparency, alignment and position. The result is a polished, professional chart layout that adapts to the user's personal style. Optimization and Design ICT Essentials is built for performance, using cached arrays and lightweight calculations to maintain responsiveness on all timeframes. Each feature can be toggled individually to suit the traders focus or system performance. The script delivers a fluid, customizable and highly optimized trading experience designed to feel natural and effortless in day-to-day use. Credits This script takes reference and inspiration from several open-source indicators: Equal Highs and Lows by jzstur ICT HTF Candles (fadi) by fadizeidan ICT Killzones + Pivots EP by tradeforopp AG FX - Watermark by AGFXTRADING All components have been refactored, optimized and unified into a single framework for a smoother and more efficient workflow.Pine Script® 인디케이터LeoDoesTrading의업데이트됨 1313565
One for AllOne for All (OFA) - Complete ICT Analysis Suite Version 3.3.0 by theCodeman 📊 Overview One for All (OFA) is a comprehensive TradingView indicator designed for traders who follow Inner Circle Trader (ICT) concepts. This all-in-one tool combines essential ICT analysis features—sessions, kill zones, previous period levels, and higher timeframe candles with Fair Value Gaps (FVGs) and Volume Imbalances (VIs)—into a single, highly customizable indicator. Whether you're a beginner learning ICT concepts or an experienced trader refining your edge, OFA provides the visual structure needed for precise market analysis and execution. ✨ Key Features - 🏷️ Customizable Watermark**: Display your trading identity with customizable titles, subtitles, symbol info, and full style control - 🌍 Trading Sessions**: Visualize Asian, London, and New York sessions with high/low lines, range boxes, and open/close markers - 🎯 Kill Zones**: Highlight 5 critical ICT kill zones with precise timing and visual boxes - 📈 Previous Period H/L**: Track Daily, Weekly, and Monthly highs/lows with customizable styles and lookback periods - 🕐 Higher Timeframe Candles**: Display up to 5 HTF timeframes with OHLC trace lines, timers, and interval labels - 🔍 FVG & VI Detection**: Automatically detect and visualize Fair Value Gaps and Volume Imbalances on HTF candles - ⚙️ Universal Timezone Support**: Works globally with GMT-12 to GMT+14 timezone selection - 🎨 Full Customization**: Control colors, styles, visibility, and layout for every feature 🚀 How to Use Watermark Setup The watermark overlay helps you identify your charts and maintain focus on your trading principles: 1. Enable/disable watermark via "Show Watermark" toggle 2. Customize the title (default: "Name") to display your trading name or account identifier 3. Set up to 3 subtitles (default: "Patience", "Confidence", "Execution") as trading reminders 4. Choose position (9 locations available), size, color, and transparency 5. Toggle symbol and timeframe display as needed Use Case: Display your trading principles or account name for multi-monitor setups or content creation. Trading Sessions Analysis Sessions define market character and liquidity availability: 1. Enable "Show All Sessions" to visualize all three sessions 2. Adjust timezone to match your local market (default: UTC-5 for EST) 3. Customize session times if needed (defaults cover standard hours) 4. Enable session range boxes to see consolidation zones 5. Use session high/low lines to identify key levels for the current session 6. Enable open/close markers to track session transitions Use Case: Identify which session you're trading in, track session highs/lows for liquidity, and anticipate session transition volatility. Kill Zones Trading Kill zones are ICT's high-probability trading windows: 1. Enable individual kill zones or use "Show All Kill Zones" 2. **Asian Kill Zone** (2000-0000 GMT): Early positioning and smart money accumulation 3. **London Kill Zone** (0300-0500 GMT): European market opening volatility 4. **NY AM Kill Zone** (0930-1100 EST): Post-NYSE open expansion 5. **NY Lunch Kill Zone** (1200-1300 EST): Midday consolidation or manipulation 6. **NY PM Kill Zone** (1330-1600 EST): Afternoon positioning and closes 7. Customize colors and times to match your trading style 8. Set max days display to control historical visibility (default: 30 days) Use Case: Focus entries during high-probability windows. Watch for liquidity sweeps at kill zone openings and institutional positioning. Previous Period High/Low Levels Previous period levels act as magnetic price targets and support/resistance: 1. Enable Daily (PDH/PDL), Weekly (PWH/PWL), or Monthly (PMH/PML) levels individually 2. Set lookback period (how many previous periods to display) 3. Choose line style: Solid (current emphasis), Dashed (standard), or Dotted (subtle) 4. Customize colors per timeframe for visual hierarchy 5. Adjust line width (1-5) for visibility preference 6. Enable gradient effect to fade older periods 7. Position labels left or right based on chart layout 8. Customize label text for your preferred notation Use Case: Identify key levels where price is likely to react. Daily levels work on intraday timeframes, Weekly on daily charts, Monthly for swing trading. Higher Timeframe (HTF) Candles HTF candles reveal the larger market context while trading lower timeframes: 1. Enable up to 5 HTF slots simultaneously (default: 5m, 15m, 1H, 4H, Daily) 2. Choose display mode: "Below Chart" (stacked rows) or "Right Side" (compact column) 3. Customize timeframe, colors (bull/bear), and titles for each slot 4. **OHLC Trace Lines**: Visual lines connecting HTF candle levels to chart bars 5. **HTF Timer**: Countdown showing time remaining until HTF candle close 6. **Interval Labels**: Display day of week (Daily+) or time (intraday) on each candle 7. For Daily candles: Choose open time (Midnight, 8:30, 9:30) to match your market structure preference Use Case: Trade lower timeframes while respecting higher timeframe structure. Watch for HTF candle closes to confirm directional bias. FVG & VI Detection Fair Value Gaps and Volume Imbalances highlight inefficiencies that price often revisits: 1. **Fair Value Gaps (FVGs)**: Detected when HTF candle wicks don't overlap between 3 consecutive candles - Bullish FVG: Gap between candle 1 high and candle 3 low (green box by default) - Bearish FVG: Gap between candle 1 low and candle 3 high (red box by default) 2. **Volume Imbalances (VIs)**: Similar detection but focuses on body gaps - Bullish VI: Gap between candle 1 close and candle 3 open - Bearish VI: Gap between candle 1 open and candle 3 close 3. Enable FVG/VI detection per HTF slot individually 4. Customize colors and transparency for each imbalance type 5. Boxes appear on chart at formation and remain visible as retracement targets **Use Case**: Identify high-probability retracement zones. Price often returns to fill FVGs and VIs before continuing the trend. Use as entry zones or profit targets. 🎨 Customization OFA is built for flexibility. Every feature includes extensive customization options: Visual Customization - **Colors**: Independent color control for every element (sessions, kill zones, lines, labels, FVGs, VIs) - **Transparency**: Adjust box and label transparency (0-100%) for clean charts - **Line Styles**: Choose Solid, Dashed, or Dotted for previous period lines - **Sizes**: Control text size, line width, and box borders - **Positions**: Place watermark in 9 positions, labels left/right Layout Control - **HTF Display Mode**: "Below Chart" for detailed analysis, "Right Side" for space efficiency - **Drawing Limits**: Set max days for sessions/kill zones to manage chart clutter - **Lookback Periods**: Control how many previous periods to display (1-10) - **Gradient Effects**: Enable fading for older previous period lines Timing Adjustments - **Timezone**: Universal GMT offset selector (-12 to +14) for global markets - **Session Times**: Customize each session's start/end times - **Kill Zone Times**: Adjust kill zone windows to match your market's characteristics - **Daily Open**: Choose Midnight, 8:30, or 9:30 for Daily HTF candle open time 💡 Best Practices 1. Start Simple: Enable one feature at a time to learn how each element affects your analysis 2. Match Your Timeframe: Use Daily levels on intraday charts, Weekly on daily charts, HTF candles one or two levels above your trading timeframe 3. Kill Zone Focus: Concentrate your trading activity during kill zones for higher probability setups 4. HTF Confirmation: Wait for HTF candle closes before committing to directional bias 5. FVG/VI Entries: Look for price to return to unfilled FVGs/VIs for entry opportunities with favorable risk/reward 6. Customize Colors: Use a consistent color scheme that matches your chart theme and reduces visual fatigue 7. Reduce Clutter: Disable features you're not actively using in your current trading plan 8. Session Context: Understand which session controls the market—trade with session direction or anticipate reversals at session transitions ⚙️ Settings Guide OFA organizes settings into logical groups for easy navigation: - **═══ WATERMARK ═══**: Title, subtitles, position, style, symbol/timeframe display - **═══ SESSIONS ═══**: Enable/disable sessions, times, colors, high/low lines, boxes, markers - **═══ KILL ZONES ═══**: Individual kill zone toggles, times, colors, max days display - **═══ PREVIOUS H/L - DAILY ═══**: Daily high/low lines, style, color, lookback, labels - **═══ PREVIOUS H/L - WEEKLY ═══**: Weekly high/low lines, style, color, lookback, labels - **═══ PREVIOUS H/L - MONTHLY ═══**: Monthly high/low lines, style, color, lookback, labels - **═══ HTF CANDLES ═══**: Global display mode, layout settings - **═══ HTF SLOT 1-5 ═══**: Individual HTF configuration (timeframe, colors, title, FVG/VI detection, trace lines, timer, interval labels) Each setting includes tooltips explaining its function. Hover over any input for detailed guidance. 📝 Final Notes One for All (OFA) represents a complete ICT analysis toolkit in a single indicator. By combining watermark customization, session visualization, kill zone highlighting, previous period levels, and higher timeframe candles with FVG/VI detection, OFA eliminates the need for multiple indicators cluttering your chart. **Version**: 3.3.0 **Author**: theCodeman **Pine Script**: v6 **License**: Mozilla Public License 2.0 Start with default settings to learn the indicator's structure, then customize extensively to match your personal trading style. Remember: tools provide information, but your edge comes from disciplined execution of a proven strategy. Happy Trading! 📈 Pine Script® 인디케이터Arslan_cs의92
Inspirational WatermarkPreface: I wanted code that could display a different string of text whenever the bar changed. Viewing a long string of text on the chart can look messy & crowded, so the string of text is displayed as a tooltip when hoving over the user-customizable watermark text/emoji. About the Indicator: This is a simple educational script where I hand-picked 60-ish quotes related to trading and included them as tooltips in a watermark indicator. The indicator includes a bank of preset quotes, and calls a random quote upon each bar change. Advantages of a watermark include claiming idea ownership as well as preventing simple copy-paste idea piracy/resale/repost. The trader can fully customize the on-screen watermark text. The trader has the option to display the watermark as either a table or a label. Tables are stationary but easy to crop out, while labels move around but are difficult to crop out. Choose the right watermark type depending on the level of idea ownership & protection you require. Features: Fully customizable watermark type, text, size, color, and position. ‼ IMPORTANT: Hover over the watermark to read a famous trading quote that changes every candle. Consider moving this indicator to the front of the visual order. ⚠ DISCLAIMER: Not financial advice. Not a trading system. DYOR. I am not in any way affiliated with any of the quoted authors.Pine Script® 인디케이터BarefootJoey의1177
EZ_Algo Copyright label This script overlays a fully adjustable watermark on your chart, featuring: A bold Main Title (e.g., your brand or name) and Subtitle (e.g., a tagline or ID). Optional extras like a copyright notice, logo symbol, warning message, and chart info (symbol, timeframe, timestamp, or close price). A subtle repeating overlay pattern to deter theft. Flexible positioning, sizing, and color options to match your vib e It’s built for traders who want to protect their charts and make them stand out, all in a few clicks. How to Use It Add to Chart: Click "Add to Chart" and watch the default watermark appear (e.g., "EZ ALGO" at the top). Customize It: Main Title: Set your brand (e.g., "EZ ALGO") under "Main Title". Tweak color, size, and alignment. Subtitle: Add a tagline (e.g., "Algo Trading") and trader ID (e.g., "@EZ_Algo ") with matching style options. Text Opacity: Adjust "Text Opacity" in "Appearance" to control title and subtitle transparency (0 = solid, 100 = invisible). Chart Info: Toggle "Show Chart Info" to display symbol and timestamp, or add "Show Close Price" for extra data. Extras: Enable "Show Copyright" for a © notice, "Show Logo" for a symbol (e.g., ★), or "Show Warning" to shout "DO NOT COPY". Overlay Pattern: Turn on "Show Overlay Pattern" to repeat a phrase (e.g., "EZ Algo") across the chart. Positioning: Pick vertical/horizontal spots (top, middle, bottom; left, center, right) or try "Randomize Main Position" for a surprise placement. Appearance: Set a "Background Color" and "Background Opacity" for the watermark’s backdrop. Cell Size: Adjust "Cell Width (%)" and "Cell Height (%)" to resize the watermark (0 = auto-fit). Apply & Share: Hit "OK" to save settings, then screenshot or share your branded chart with confidence! Tips Use a semi-transparent background (e.g., 50 opacity) to keep the chart readable. Experiment with "Randomize Main Position" for a dynamic look. Pair a bold logo with a faint overlay pattern for max branding power. Credits Inspired by @KristaKT thanks for the great ideas! Enjoy marking your charts with flair and protection! Questions? Drop a comment below. Pine Script® 인디케이터EZ_Algo의41
LFWD Watermark + ChecklistLFWD Watermark + Checklist is a simple but powerful trading overlay designed to keep you locked into discipline and execution. This indicator displays: ✅ A customizable motivational watermark at the top-center of your chart ✅ A clean LFWD execution checklist at the bottom-right ✅ Adjustable text sizing for both the watermark and checklist ✅ Fully customizable text and background colors to match your chart theme The goal is to keep traders focused on process over emotion, and to reinforce the key execution principles every time a setup appears. LFWD Checklist Includes: 1. Momentum & Intent 2. Liquidity Grab 3. Break of Structure 4. Supply or Demand 5. Time and Price This tool is best used as a daily reminder that consistency is built through repetition and discipline. LFWD — Discipline Builds Everything. Pine Script® 인디케이터lfwd의60
LFWD Watermark + ChecklistLFWD Watermark + Checklist is a simple but powerful trading overlay designed to keep you locked into discipline and execution. This indicator displays: ✅ A customizable motivational watermark at the top-center of your chart ✅ A clean LFWD execution checklist at the bottom-right ✅ Adjustable text sizing for both the watermark and checklist ✅ Fully customizable text and background colors to match your chart theme The goal is to keep traders focused on process over emotion, and to reinforce the key execution principles every time a setup appears. LFWD Checklist Includes: 1. Momentum & Intent 2. Liquidity Grab 3. Break of Structure 4. Supply or Demand 5. Time and Price This tool is best used as a daily reminder that consistency is built through repetition and discipline. LFWD — Discipline Builds Everything. Pine Script® 인디케이터lfwd의1
Micha Stocks Custom WatermarkThis Pine Script v5 indicator adds a customizable watermark to TradingView charts, displaying key stock information while allowing for flexible positioning and formatting. 📌 Features & Functionality: ✅ Custom Positioning: • Fixed to the top-left corner. • Adjustable spacing ensures the text is properly aligned. ✅ Displayed Information (Configurable): • Company Name & Market Cap (Optional: Shows dynamically calculated market cap) • Stock Ticker & Timeframe • Industry & Sector ✅ Customization Options: • Font Size: Huge, Large, Normal, Small • Text Color & Transparency: Adjustable • Proper Left Alignment for a clean, structured display • Vertical Offset Tweaks to move text down for better visibility ✅ Optimized Table Layout: • Uses table.new() for persistent placement. • Added an empty row to fine-tune positioning, ensuring the watermark doesn’t overlap key chart areas. 🔧 Use Case: Designed for traders who want a clear, customizable stock watermark to enhance their charting experience without obstructing price action.Pine Script® 인디케이터michacat의업데이트됨 1111 1.8 K
ATR Units + % (Watermark)A clean and simple indicator for displaying ATR (Average True Range) volatility directly on the chart, without any lines, panels, or visual clutter. The indicator shows: ATR in price units (how much the asset moves in absolute terms) ATR as a percentage (%) of the current price The values are displayed as a text watermark on the chart, allowing you to quickly see the volatility level at a glance without interfering with price analysis. Customization Options: Set ATR length Choose text size Choose text color Control transparency (for a true watermark look) Choose full chart position: Vertical: Top / Middle / Bottom Horizontal: Left / Center / Right Disclaimer This indicator is provided for educational and informational purposes only. It does not constitute financial advice, investment advice, or a recommendation to buy or sell any financial instrument. The ATR values shown (both units and percentage) reflect historical price volatility only and do not predict future market behavior. All trading decisions are the sole responsibility of the user. Trading involves risk. Always use proper risk management, and consult a licensed financial professional if needed before making trading decisions.Pine Script® 인디케이터ariecold의14
Timeframe WatermarkA clean, minimal watermark indicator that displays the current chart timeframe as a large, semi-transparent text overlay. Features: Automatically formats timeframes (1M, 15M, 1H, 4H, 1D, 1W, etc.) Fully customizable appearance 9 position options (corners, edges, center) Adjustable transparency for non-intrusive display Works on all chart types and timeframes Settings: Appearance Color : Watermark text color (default: gray) Transparency : 0 = solid, 100 = invisible (default: 85) Size : Tiny / Small / Normal / Large / Huge Position Vertical : Top / Middle / Bottom Horizontal : Left / Center / Right Use Cases: Quick timeframe reference when analyzing multiple charts Screenshot clarity for sharing chart analysis Multi-monitor setups where timeframe visibility matters Lightweight overlay indicator with zero impact on chart performance. Pine Script® 인디케이터Closingbell2020의1
YALGOS - Watermark What does the indicator do? The YALGOS - Watermark is a comprehensive visual dashboard that consolidates essential market data onto a single floating table on your chart. It tracks real-time metrics including volatility (ATR), Market Capitalization, daily percentage change, and Relative Volume (RVol). Additionally, it provides a countdown to upcoming earnings reports and identifies the specific sector and industry of the asset. Why is it needed? Centralized Information: It eliminates the need to toggle between different tabs or windows by providing a "birds-eye view" of both technical and fundamental data directly on the price action. Risk Awareness: Through color-coded ATR logic, it alerts traders to abnormal volatility levels, helping them decide if a setup is too risky or within normal parameters. Operational Efficiency: It ensures critical catalysts, such as earnings dates, are always visible, preventing costly mistakes. The built-in "Mobile Mode" also ensures that traders on the go have a clear, optimized view of their data.Pine Script® 인디케이터YS49의2