VIX Implied MovesKey Features:
Three Timeframe Bands:
Daily: Blue bands showing ±1σ expected move
Weekly: Green bands showing ±1σ expected move
30-Day: Red bands showing ±1σ expected move
Calculation Methodology:
Uses VIX's annualized volatility converted to specific timeframes using square root of time rule
Trading day convention (252 days/year)
Band width = Price × (VIX/100) ÷ √(number of periods)
Visual Features:
Colored semi-transparent backgrounds between bands
Progressive line thickness (thinner for shorter timeframes)
Real-time updates as VIX and ES prices change
Example Calculation (VIX=20, ES=5000):
Daily move = 5000 × (20/100)/√252 ≈ ±63 points
Weekly move = 5000 × (20/100)/√50 ≈ ±141 points
Monthly move = 5000 × (20/100)/√21 ≈ ±218 points
This indicator helps visualize expected price ranges based on current volatility conditions, with wider bands indicating higher market uncertainty. The probabilistic ranges represent 68% confidence levels (1 standard deviation) derived from options pricing.
스크립트에서 "vix"에 대해 찾기

VIX Term StructureThis script allows users to visualize the state of the VIX Futures Term Structure. The user is able to select from five CBOE VIX Indices; VIX, VIX9D, VIX3M, VIX6M, and VIX1Y and the script will color the candles based on the price relationship between selected indices. Visit the CBOE website for more info on how the various VIX indices are calculated.

VIX-VXV-Ratio-Buschi
English:
This script shows the ratio between the VIX (implied volatility of SPX options over the next month) and the VXV (implied volatility of SPX options over the next three months). Since in normal "Contango" mode, the VXV should be higher than the VIX, the crossing under 1.0 or maybe 0.95 after a volatility spike could be a sign for a calming market or at least a calming volatility.
Deutsch:
Dieses Skript zeigt das Verhältnis zwischen dem VIX (implizite Volatilität der SPX-Optionen über den nächsten Monat) und dem VXV (implizite Volatilität der SPX-Optionen über die nächsten drei Monate). Da im normalen "Contango"-Modus der VXV höher als der VIX liegen sollte, kann das Abfallen unter 1,0 oder 0,95 nach einer Volatilitätsspitze ein Anzeichen für einen ruhiger werdenden Markt oder zumindest eine ruhiger werdende Volatilität sein.

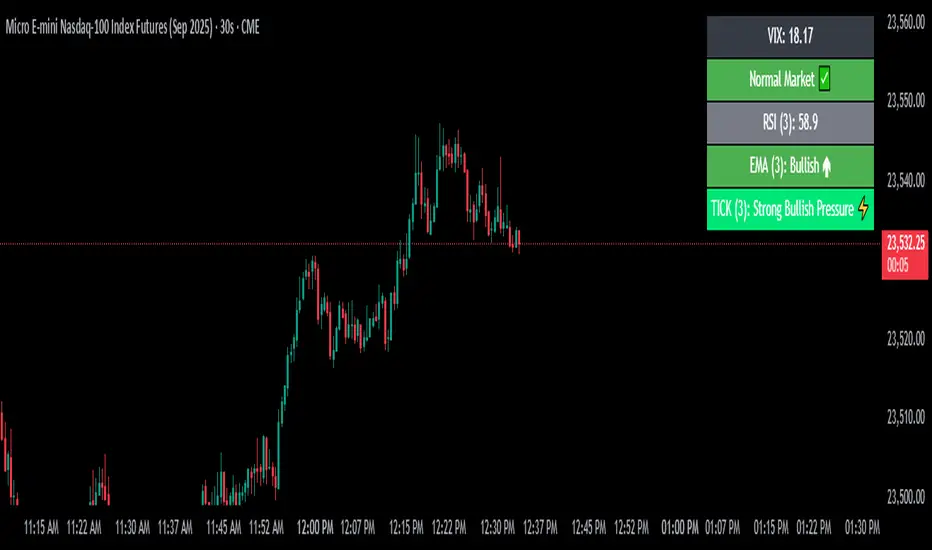
VIX Filter/RSI/EMA Bias/Cum-TICK w/ Exhaustion Zone DashboardThis all-in-one dashboard gives intraday traders a real-time visual read of market conditions, combining volatility regime, trend bias, momentum exhaustion, and internal strength — all in a fully customizable overlay that won’t clutter your chart.
📉 VIX Market Regime Detector
Identifies "Weak", "Normal", "Volatile", or "Danger" market states based on customizable VIX ranges and symbol (e.g., VXN or VIX).
📊 RSI Momentum Readout
Displays real-time RSI from any selected timeframe or symbol, with adjustable length, OB/OS thresholds, and color-coded exhaustion alerts.
📈 EMA Trend Bias Scanner
Compares fast and slow EMAs to define bullish or bearish bias, using your preferred timeframe, symbol, and EMA lengths — ideal for multi-timeframe setups.
🧠 Cumulative TICK Pressure & Exhaustion Engine
Analyzes internal market strength using cumulative TICK data to classify conditions as:
-Strong / Mild Bullish or Bearish Pressure
-Choppy / No Edge
-⚠️ Exhaustion Zones — when raw TICK values hit extreme highs/lows, a separate highlight box appears in the dashboard, warning of potential turning points
All logic is customizable, including TICK symbol, timeframes, thresholds, and lookback periods.
Scalpers and day traders who want fast, visual insight into market internals, exhaustion, and trend bias.
VIX/VOLI RatioWe all know TVC:VIX . But what is NASDAQ:VOLI ?
VOLI is basically a measure of expectations for market volatility over the next 30 calendar days as expressed by ATM options on AMEX:SPY
nations.com
So why is this VIX /VOLI ratio important? It's because it can give an important measure of options skew.
It can show the premium of OTM options (particularly puts) over ATM.
It can show if traders are interested in owning wings in AMEX:SPY
Not a lot of info can be taken by just looking at the ratio as a standalone nominal value. Plus, the ratio is noisy and spotting a clear trend can be hard.
For these reasons, I decided to code this indicator (which is best used on the Daily chart).
I added two EMA clouds, 7 and 12 and color code them with respect to their positions. If 7 > 12, cloud will be green. If 7 < 12, cloud will be red. This will give a better view of how the ratio is trending.
I then added a lookback period that can be changed from the indicator's setting (along with the fast and slow EMAs).
The lookback period will be used to get the following parameters:
- highest value
- lowest value
- 10th, 30th, 50th, 70th and 90th percentiles
- Percentile Rank
- Average, Median and Mode
Having all these values in a table will give a better idea of where the current ratio sits.

Bars Since VIX MedianBARS SINCE VIX17 Median by dime (v1.0 release) 04/02/2017
(Inspired by "Bars Since the last RSI Extreme" from DRodriguezFX)
This indicator is useful in tracking how many daily bars since the VIX was last at a historically 'normal' range.
Currently the VIX has been in a period of low volatility for a period of 98 daily bars since the VIX was last at the 17 historical median.

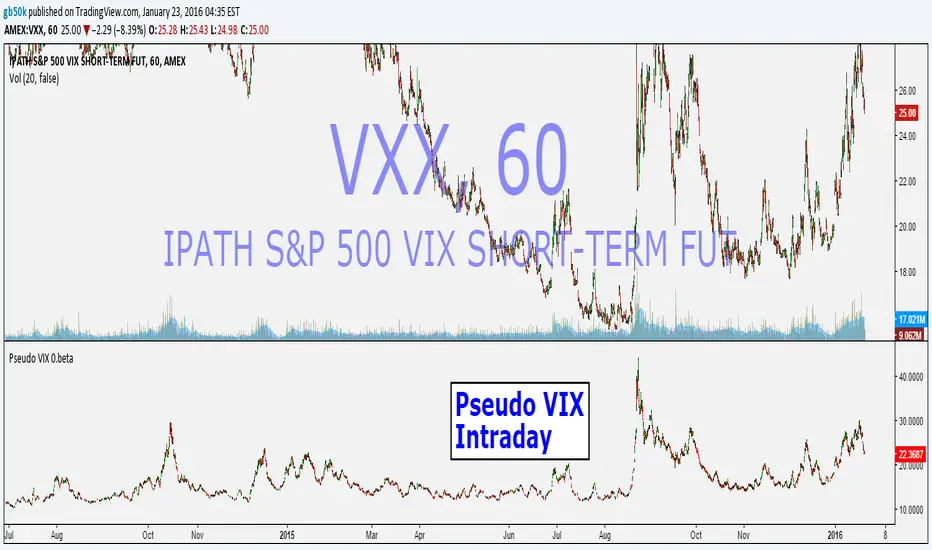
Pseudo VIX -Intraday -.betaFor Educational Purpose -
Intraday VIX estimation using yesterdays VIX, previous overnight roll , and intraday values for the VXX etf (scaled up to VIX)
Works in all intraday time frames.
First attempt...feedback welcome.
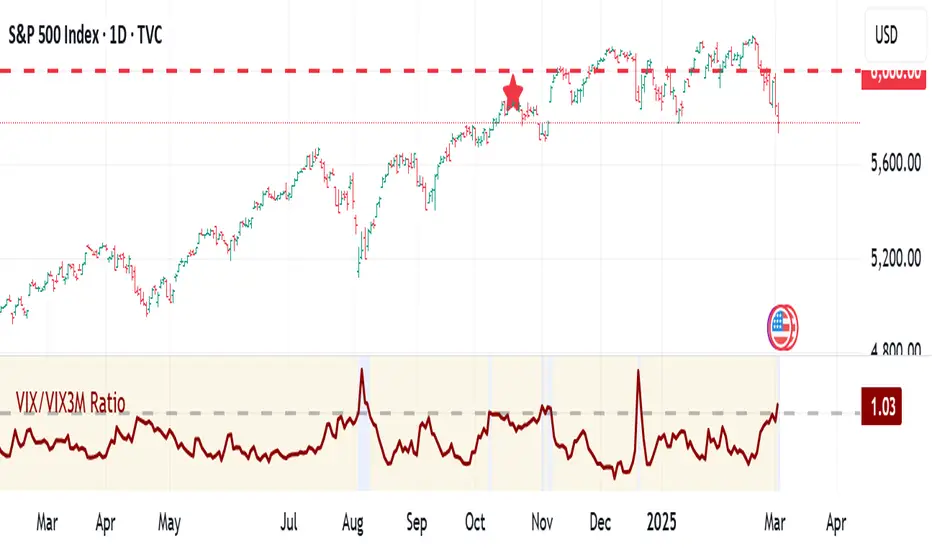
VIX:VIX3M RatioThe VIX/VIX3M Ratio indicator compares the short-term (1-month) volatility index (VIX) to the medium-term (3-month) volatility index (VIX3M). This ratio provides insights into the market's volatility expectations across different time horizons.
Key Interpretations:
Ratio > 1: Short-term volatility expectations are higher than 3-month expectations
Ratio = 1: Short-term and medium-term volatility expectations are aligned
Ratio < 1: Medium-term volatility expectations are higher than short-term expectations
Potential Trading Insights:
A rising ratio may indicate increasing near-term market uncertainty
Significant deviations from 1.0 can signal potential market stress or changing risk perceptions
Traders use this to gauge the term structure of market volatility
VIX FixSistema de trading hecho por Larry Williams, basado en VIX, optimizado para cualquier activo.
Formula:
(Highest (Close, 20) - Low) / (Highest (Close, 20)) * 100
Donde “Highest (Close, 20)” representa el cierre mas alto de los ultimos 20 periodos
Larry Williams Mechanical Trading System based on VIX.
The VIX Fix applies the same general formula that is used to calculate the stochastic indicator, so can be used for any asset:
(Highest (Close, 20) - Low) / (Highest (Close, 20)) * 100
Where “Highest (Close, 20)” means the highest closing value in the past 20 periods and the low refers
to the current period’s low. The formula can be applied to any timeframe.
VIX Cheat SheetHello!
This indicator - "VIX Cheat Sheet" - performs several calculations for $VIX against the asset on your chart. However, using $VIX as a risk proxy or volatility metric often fails beyond large-cap U.S equities. To remedy this, the VixFix indicator is included in the script; you can select whether the script performs calculations for an asset against $VIX or against VixFix (i.e. Forex, Crypto)
Measured are: $VIX correlation to an asset's price fluctuations, the average close-to-close gain/loss subsequent a $VIX/VixFix close above the upper Bollinger Band, the average 5-session gain/loss following the same occurrence in addition to the average 10-session gain/loss, all close-to-close, 5 session, and 10-session gains/losses are stored as tooltips for labels on the chart. The current close-to-close percentage gain/loss for $VIX and VixFix are displayed on the chart.
Displayed in the example image is a box incorporating $VIX price data alongside an upper Bollinger Band and lower Bollinger Band. The data isn't cast to its own price scale but is helpful for quick interpretation of $VIX fluctuations. You can select to plot VixFix data in the box in the user inputs table.
Displayed in the second example image is a semi-transparent blue box encompassing all price moves that occurred when $VIX measured above $40 for at least ten consecutive sessions. The largest percentage close-to-close loss is displayed below the box.
Also illustrated is a red label that appears when $VIX or VixFix closes above the upper Bollinger Band. The indicator will calculate and display the performance of the asset for the subsequent 10 sessions, to which the red label will disappear and all data stored as a tooltip in the blue labels stating "VIX Closed Above Upper Band" or "VixFix Closed Above Upper Band".
To reduce chart clutter, a label and line combination marking all $VIX closes above the upper Bollinger Band was not included. Instead, bar color changes were added. When "$VIX" is selected in the user inputs table the indicator will mark all sessions in which $VIX closed above the upper band as blue, in addition to plotting $VIX price data in the dynamic black box. When "VixFix" is selected, the indicator will mark all sessions where VixFix closed above the upper band as purple; the VixFix indicator will be plotted in the black box.
Be sure to hover over labels to access tooltip information; try the indicator with bar replay!

Vix Jump for Selling Puts or Buying CallsThis script aims to identify optimal times when to write Puts for premium, for example using the SPX Weeklies model or simply buying Calls. Not perfect but provides some additional confidence when playing Puts on SPX or the Wheel on SPY.
What it does:
We compare current VIX with a lookback VIX for X% delta. If there is a jump of say 20% over a defined period then that would indicate an opportunity to sell Puts, run a straddle or buy Calls. We use VVIX as a check to stop to many false positives ie VVIX falls of faster than VIX.
You can also use this loosely as a bottom finder.

VIX Near-Term Futures CurveThis indicator provides a 3 day smoothed histogram expressing whether the near term VIX futures curve is in a state of contango or backwardation. The solid red/green bars express the spot vs front-month vs next month curve with the value being the cumulative point spread between them. The shaded overlay bars express the spread between the VIX spot index and front-month futures contract only.
This indicator is to be used on a 1 DAY interval or higher.

VIX Implied Move Bands for ES/Emini futuresThis script uses the close of the VIX on a daily resolution to provide the 'implied move' for the E-mini SP500 futures. While it can be applied to any equity index, it's crucial to know that the VIX is calculated using SPX options, and may not reflect the implied volatility of other indices. The user can adjust the length of the moving average used to calculate the bands, the window of days used to calculate the implied move, and the multiplier that effects the width of the bands.

VIX TrendlineThis indicator helps to see the volatility index (VIX) trendline in all stock charts without opening the VIX chart explicitly.
Hope this helps many of you to be more efficient in your chart analysis - have fun!

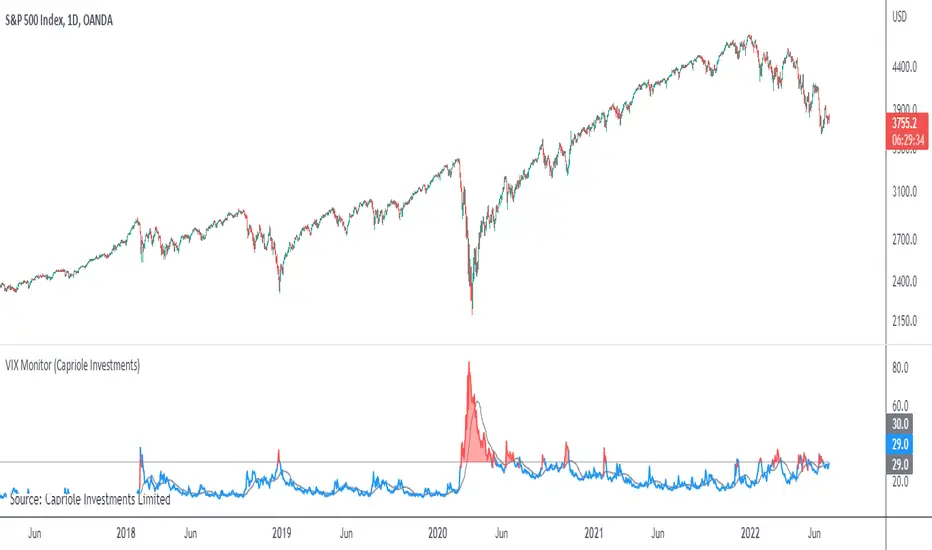
VIX MonitorSimple VIX Monitor to track spikes.
Spikes in VIX are often followed by big moves up in stocks.
Useful when paired with "Correlation & Beta" Indicator.
For Bitcoin Traders: when Bitcoin is highly correlated to Stocks (such as now) it could be a good opportunity for a short-term long trade.
VIX INDICATORWorks best as an intraday indicator
Background black & line green = Long VIX
Background black & red line = No trade
Background orange & line green = Consider selling
Background orange & line red = Short VIX

VIX based LevelsSupport and resistance levels for the day based on the volatility index.
Major - The Major support line where the day low, high or close can occur at that level
Minor - The second level of the Support/Resistance line , where we can expect some rejections or breakouts/breakdowns
Mild - The mid level between the Major and minor levels. The market may consolidate around that area.
The script will automatically get the previous day close value of the current scrip and the India vix.
India vix is calculated based on the annual percentage and hence the previous day close value of the scrip is divided by 19.1 ( square root of 365 )
The PDC values can be manually overridden for backtesting purposes.
Please note, there will be some slippages involved on the trend lines.

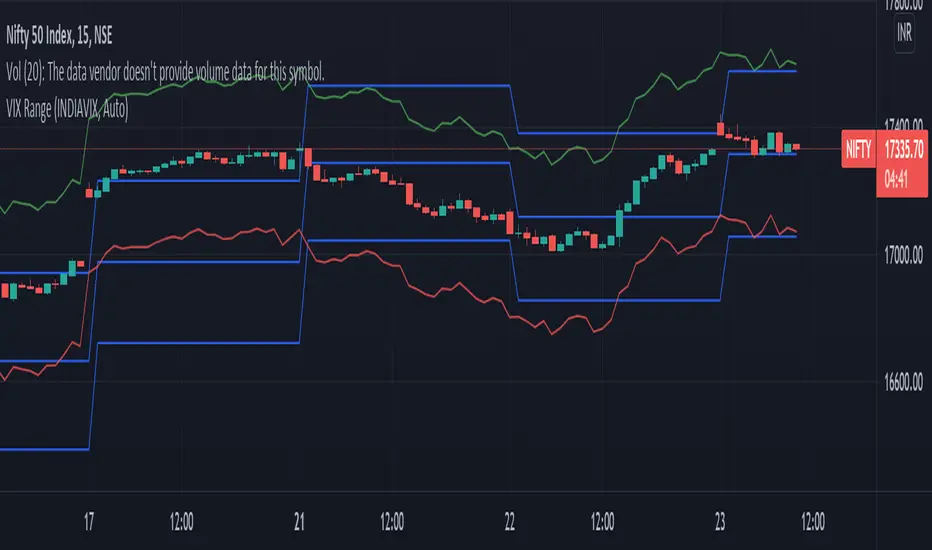
VIX RangeThis indicator shows the daily expected trading range of the instrument.
An upper and lower line denotes the range. It is calulated based on the volatility index selected (NSE:India VIX is used by default). Also it shows developing upper and lower line for the next trading day.
Non-directional option strategies (like straddle, strangle) can be performed based on the expected trading range.

VIX - Fast 30% gains in volatility - shorting Script is showing if volatility has risen 30% or more from the 10-day MA. Great opportunity for shorting when indicator gets close or above green 30% line. Red line is current MA average.

Cash VIX Term StructureLet’s first start with some definitions:
VIX9D: The CBOE S&P 500 9-Day Volatility Index estimates the expected 9-day volatility of S&P 500® stock returns.
www.cboe.com
VIX: The CBOE Volatility Index® (VIX® ) is considered by many to be the world's premier barometer of equity market volatility. The VIX Index is based on real-time prices of options on the S&P 500® Index (SPX) and is designed to reflect investors' consensus view of future (30-day) expected stock market volatility. The VIX Index is often referred to as the market's "fear gauge".
www.cboe.com
VIX3M: The CBOE 3-Month Volatility Index is designed to be a constant measure of 3-month implied volatility of the S&P 500® (SPX) Index options.
www.cboe.com
VIX6M: The CBOE S&P 500 6-Month Volatility Index is an estimate of the expected 6-month volatility of the S&P 500® Index.
www.cboe.com
VIX1Y: The CBOE S&P 500 1-Year Volatility Index is an estimate of the expected 1-Yeaer volatility of the S&P 500® Index.
www.cboe.com
This indicator visually displays the relationship between all the above products (short term vol vs long term vol). It also displays the current value and daily percentage change.
The shape of the term structure can tell us a lot about the market:
When the slope of the term structure is upward sloping (longer term VIX are higher than shorter term VIX), we say the term structure is in contango. This usually means that market is stable.
When the slope of the term structure is downward sloping (longer term VIX are lower than shorter term VIX), we say the term structure is in backwardation. This usually happens in periods of extreme market volatility.
Sometimes VIX9D will be higher than VIX but the rest of the curve is in contango. This means that there might be some event in the next 9 days that we need to pay attention to.
I also added a few ratios that I personally track like VIX9D/VIX, VIX/VIX3M and VIX/VIX6M.
When trading short term, I tend to focus on the front end of the curve. When trading long term, I tend to look at VIX/VIX6M.
In addition to the ratios, I added some historical parameters (lookback date can be set from the indicator’s settings) like Highest Value, Lowest Value, Percentile Rank, Average, Median and Mode.
Percentile ranks are displayed for both individual products and their ratios (that’s how I like to see them).
I hope you guys like this indicator.
Happy trading!

VIX Percentile Rank HistogramVIX Percentile Rank Histogram
The VIX Percentile Rank Histogram provides a visual representation of the CBOE Volatility Index (VIX) percentile rank over a customizable lookback period, helping traders gauge market sentiment and make informed trading decisions.
Overview:
This indicator calculates the percentile rank of the VIX over a specified lookback period and displays it as a histogram. The histogram helps traders understand whether the current VIX level is relatively high or low compared to its recent history. This information is particularly useful for timing entries and exits in the S&P 500 or related ETFs and Mega Caps.
How It Works:
VIX Data Integration: The script fetches daily VIX close prices, regardless of the chart you are viewing, to analyze market volatility.
Percentile Rank Calculation: The indicator calculates the rank percentile of the VIX over the chosen lookback period.
Histogram Visualization: The histogram plots the difference between the flipped VIX percentile rank and 50, showing green bars for ranks below 50 (indicating lower market volatility) and red bars for ranks above 50 (indicating higher market volatility).
Usage:
This indicator is most effective when trading the S&P 500 (SPX, SPY, ES1!) or ETFs and Mega Caps that closely follow the S&P 500. It provides insight into market sentiment, helping traders make more informed decisions.
Timing Entries and Exits: Green histogram readings suggest it's a good time to enter or hold long positions, while red readings suggest considering exits or short positions.
Market Sentiment: A high VIX percentile rank (red bars) indicates market fear and uncertainty, while a low percentile rank (green bars) suggests investor confidence and reduced volatility.
Key Features:
Customizable Lookback Period: The default lookback period is set to 20 days, but can be adjusted based on the trader's average trade duration. For example, if your trades typically last 20 days, a 20-day lookback period helps contextualize the VIX level relative to its recent history.
Histogram Visualization: The histogram provides a clear visual representation of market volatility.
Green Bars: Indicate a lower-than-median VIX percentile rank, suggesting reduced market volatility.
Red Bars: Indicate a higher-than-median VIX percentile rank, suggesting increased market volatility.
Threshold Line: A dashed gray line at the 0 level serves as a visual reference for the median VIX rank.
Important Note:
This indicator always shows readings from the VIX, regardless of the chart you are viewing. For example, if you are looking at Natural Gas futures, this indicator will provide no relevant data. It works best when trading the S&P 500 or related ETFs and Mega Caps.
