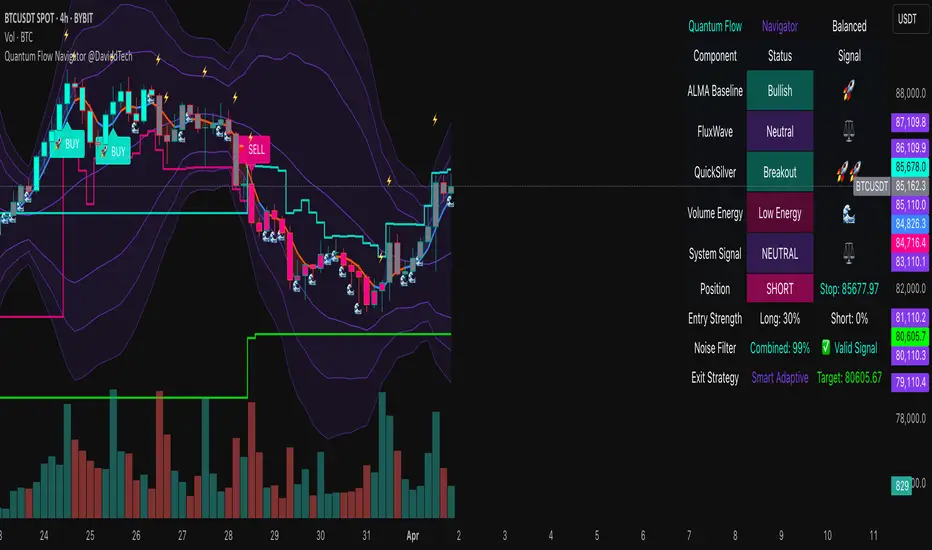
Quantum Flow Navigator @DaviddTechQuantum Flow Navigator – DaviddTech
Precision Strategy Builder Powered by Adaptive Filters, Statistical Noise Reduction & Multi-Modal Confirmation
🚀 Bullish Signal : Enter when ALMA, FluxWave, and QuickSilver all confirm bullish trend, with high volume and valid noise filter state.
🔻 Bearish Signal : Enter short when all components align bearishly and filters validate the signal.
🚪 Exit : Automatically managed by dynamic SL/TP or indicator-based reversal logic.
✅ Overview & DaviddTech Methodology
Quantum Flow Navigator is an advanced, multi-component trading system engineered around the strict modular logic of the DaviddTech methodology .
It integrates every core component required for a fully rule-based and signal-driven strategy—baseline, confirmations, volume filter, exit system, and noise filter.
Designed for traders who demand structure, clarity, and data-backed decision-making on 15M, 1H, and 4H charts.
🔍 Indicator Components
Baseline: Adaptive ALMA Filter
Smooth and responsive dynamic trend detection, with momentum validation and optional filled zones for enhanced visual feedback.
Confirmation #1: FluxWave Oscillator
Developed from an enhanced Trendlio concept by @dudeowns , FluxWave uses ALMA-smoothed rate-of-change logic with configurable signal behavior.
Confirmation #2: QuickSilver Band System
Custom breakout engine that maps volatility envelopes using multi-layered deviation bands for clear confirmation of structure breaks and trend direction.
Volume Filter: Normalized Volume Energy
Innovative volume filter inspired by @ceyhun 's work. Filters trades by classifying energy into High, Normal, or Low based on normalized volume context.
Exit System: Dynamic Momentum Stop Loss
Choose from Smart Adaptive, Trailing, Stepped, Percentage, ATR, or Volatility-adjusted logic. Supports TP via risk/reward, ATR multiples, or percentage targets.
Noise Filtration: Quantum Statistical Noise Reduction
Fuses Kalman smoothing with wavelet decomposition to eliminate non-signal noise and improve trade quality and confidence.
🎨 Visual System & Dashboard
🚀/🔻/🚪 Emoji Labels : Buy, sell, and exit trades clearly marked for instant recognition.
Color-Shifting Bars : Reflect FluxWave’s trend bias in real-time.
ALMA Fill Zone : Visual trend envelope between price and ALMA baseline.
QuickSilver Bands : Volatility envelopes with graduated depth for support/resistance awareness.
SL & TP Visuals : Dynamic stop-loss and take-profit zones plotted directly on chart.
Navigator Panel : In-chart dashboard displays real-time trend status, volume energy, noise filter state, signal strength, and active position tracking.
📈 How to Trade with It
Entry Mode Selection : Choose between Combined, ALMA, FluxWave, QuickSilver, or Custom scoring logic.
Final Signals : Trigger only when confirmations align, volume energy is valid, and noise is low.
Dashboard Summary : Use real-time signal display to validate entry strength.
Timeframes : 15M–1H recommended for swing/intraday setups; 5M–15M for automation.
💡 Advanced Features
Entry Strength Scoring: Composite weight of all active components + filters.
Cooldown System: Limits excessive signals in volatile periods.
Multiple Exit Strategies: SL & TP modes with optional indicator-based exits.
Statistical Filtering: Wavelet + Kalman combination optimizes entry confidence.
Full Alert Suite: Covers entries, exits, filter triggers, volume states, and more.
🧠 Suggested Strategy Usage
Wait for full confirmation from ALMA, FluxWave, and QuickSilver.
Ensure volume energy is High and noise filter confirms trend clarity.
Use adaptive SL/TP or indicator-based exits.
Monitor dashboard for live signal strength ≥ threshold.
Use “Balanced” mode for general use; switch to “Aggressive” for tighter signals.
📝 Credits & Originality
Concept based on DaviddTech’s component-driven methodology .
FluxWave Oscillator built as an evolved version of Trendlio with full signal customization — credit @dudeowns .
Volume Energy Filter adapted from the work of @ceyhun .
Noise filtration and system architecture developed independently using Pine Script v6.
All code and logic is original, non-rehashed, and completely refactored to ensure uniqueness.
Quantum Flow Navigator fuses adaptive baselines, confirmation logic, energy-based filters, and statistical refinement into a precision signal engine—optimized for traders who value structure, clarity, and control.
스크립트에서 "trigger"에 대해 찾기
Retirement Portfolio Dashboard1. Set It Up
Paste the script into the Pine Script editor in TradingView
Add to chart (use a daily chart for any TSX ticker)
Configure the inputs on the right panel:
Choose your ETF tickers (default: VFV, XAW, XIC)
Enter your target allocations (U.S., Global, Canada, Cash)
Set your current portfolio value and contribution plan
Adjust your expected return and rebalance trigger
📊 2. What It Tracks
💼 Allocation Overview
Target vs. actual % for each asset class
CAD value of each component
Performance YTD based on Jan 2nd start
Drift % to see how far each asset has deviated
📈 Growth Forecast
Future value projection with contributions
Weighted return (based on typical historical returns)
Inflation-adjusted real return (assuming 2% inflation)
⚠ Rebalancing
If any drift exceeds your set threshold (e.g., 5%), the script:
Highlights the issue in red
Displays "⚠ Rebalance Suggested"
Triggers a TradingView alert if you've activated it
🔔 3. Set Up Alerts
Go to Alerts > Create Alert
Choose your script from the dropdown
Under Condition, select "Rebalance Alert"
Choose your desired alert type (popup, email, webhook, etc.)
✅ 4. How to Use It Effectively
Task What to Do
Monitor allocations Check dashboard weekly or monthly
Spot imbalances Use Drift % and Status (green/red)
Forecast retirement growth Adjust contributions, return rate, and horizon
Prepare to rebalance Use alerts when drift > threshold
Tune assumptions Change expected returns or inflation rate as needed
💡 Tips
You can edit return assumptions (e.g., make Global equity more conservative)
Use this on a “blank” ticker (like TSX:XIC) so you don't overlay the chart
Copy values from your broker or retirement account to update real allocations

Sahid Strategy v2This script identifies potential buy/sell signals using:
Pivot Points - Detects swing highs/lows (price reversals)
Confirmation Filters - Reduces false signals using:
RSI (momentum)
Moving Average (trend direction)
Optional MACD (trend confirmation)
Key Features
Signal Type Trigger Conditions
BUY - Price makes a swing low (pivot)
Copy
- RSI ≤ 30 (oversold)
- Price above trend MA
- MACD bullish (optional) |
| SELL | - Price makes a swing high (pivot)
- RSI ≥ 70 (overbought)
- Price below trend MA
- MACD bearish (optional) |
Visual Signals
Green "BUY" labels below price bars
Red "SELL" labels above price bars
Purple trend line (20-period EMA/SMA)
Orange/blue circles showing raw pivot points
Optional Tools
Debug Table (top-right): Shows real-time:
RSI value
Price vs MA position
MACD status
Alerts - Triggers audible/visual notifications
Customization
Adjust in settings:
Pivot sensitivity (left/right bars)
RSI levels (30/70 by default)
MA type/length (20-period EMA/SMA)
Toggle MACD filter on/off
Best For: Swing trading in trending markets (1H-4H timeframes). Signals appear faster than classic pivot strategies but still require confirmation from other analysis tools.
Triple EMA + Volume/Price SignalsOverview
This script merges three exponential moving averages (EMA) with adaptive volume thresholds to identify high-confidence trends. Unlike basic volume indicators, it triggers signals only when volume exceeds both a user-defined absolute value (e.g., 500k) and a percentage increase (e.g., 5%) – reducing noise in volatile markets.
Key Features
Triple EMA System:
Short (9), Medium (21), and Long (50) EMAs for trend direction.
Bullish Signal: Short EMA > Medium EMA > Long EMA.
Bearish Signal: Short EMA < Medium EMA < Long EMA.
Dual-Threshold Volume Confirmation:
Absolute Volume: Highlight bars where volume exceeds X (e.g., 500,000).
Percentage Increase: Highlight bars where volume rises by Y% (e.g., 5%) vs. prior bar.
Users can enable/disable either threshold.
Customizable Alerts:
Trigger alerts only when both EMA alignment and volume conditions are met.
How It Works
Trend + Volume Synergy:
A bullish EMA crossover alone might be a false breakout. This script requires additional volume confirmation (e.g., 500k volume + 5% spike) to validate the move.
Flexibility: Adjust thresholds for different assets:
Stocks: Higher absolute volume (e.g., 1M shares).
Crypto: Smaller absolute volume but larger % spikes (e.g., 10%).
Usage Examples
Swing Trading:
Set EMA lengths to 20/50/200 and volume thresholds to 500k + 5% on daily charts.
Scalping:
Use 5/13/21 EMAs with 100k volume + 3% spikes on 5-minute charts.

LineReg Candles with Hma filterOverview
Purpose:
The indicator creates “LinReg Candles” by recalculating OHLC values using linear regression (to smooth out noise) and overlays additional features such as a customizable signal line and an HMA (Hull Moving Average) filter for trend detection. It also plots buy/sell signals and supports alerts.
Customization:
Users can adjust settings for signal smoothing (choosing SMA, EMA, or WMA), HMA periods (preset for Scalping/Intraday or custom values), linear regression length, colors, display options, and alert messages. Inputs are organized into groups for clarity.
Input Definitions
Signal Settings:
signal_length and smoothingType define the period and method used to smooth the close price, creating a signal line.
HMA Filter Settings:
A dropdown (t_type) lets you choose between Scalping, Intraday, or Custom. Based on this, three HMA periods (hma1, hma2, hma3) are set either to fixed values or user-defined custom inputs.
LinReg Settings:
Users can toggle linear regression for OHLC values (lin_reg) and set its period (linreg_length) to reduce price noise.
Color and Display Settings:
These control the colors for buy/sell candles, default bullish/bearish candles, markers, and background highlighting. Display toggles decide whether to show the background, signal line, HMA filter, and the recalculated candles.
Alert and Plot Customization:
Alerts can be enabled with custom messages. Additionally, line width and transparency for the plotted signal and HMA lines are adjustable.
Function Definitions
calcOHLC Function:
Computes OHLC values using linear regression if enabled. Otherwise, it returns the raw price values. This helps in reducing noise.
calcSignalLine Function:
Applies the chosen moving average (SMA, EMA, or WMA) to smooth the recalculated close values and generate a signal line.
getBaseCandleColor Function:
Determines the candle’s base color. It assigns buy/sell colors if specific crossover conditions are met; if not, it defaults to bullish (green) or bearish (red) based on the open/close relationship.
HMA Filter Calculations
HMA Computation:
The script calculates three HMAs (ma1, ma2, ma3) for different periods.
Trend Determination:
It sets a bullish condition (bcn) when ma3 is lower than both ma1 and ma2 with ma1 above ma2. Conversely, a bearish condition (scn) is set when ma3 is higher and the order of the HMAs indicates a downtrend.
Color Coding:
The HMA filter line color changes dynamically (green for bullish, red for bearish) based on these conditions.
Main Calculations
LinReg Candles:
Using the calcOHLC function, the script calculates the new open, high, low, and close values that reduce price noise.
Signal Line:
The signal line is computed on the basis of the smoothed close values using the selected moving average.
Buy/Sell Conditions:
Initial conditions are determined by checking if the recalculated close price crosses over (buy) or under (sell) the signal line.
The base candle color is then adjusted: if the HMA filter confirms the trend (bullish for buy or bearish for sell), the respective buy/sell colors are enforced.
A change in candle color compared to the previous bar triggers a buy or sell signal.
Plotting and Alerts
Visual Elements:
Background: Highlights the chart with a custom color when buy or sell conditions are met.
HMA Filter Line: Plotted (if enabled) with the dynamic color determined earlier.
Candles: The recalculated LinReg candles are drawn with colors based on the combined conditions.
Signal Line: Plotted over the candles with adjustable transparency and width.
Markers: Buy and sell markers are added to visually indicate signal points on the chart.
Alerts:
Alert conditions are set to trigger with predefined messages when a buy or sell signal is generated.
Modularity & Flexibility:
The code is structured with modular functions and clear grouping of inputs, making it highly customizable and user-friendly for open-source TradingView users.
Important how to track the real price on chart:
Locate the Chart Type Menu:
At the top of your TradingView chart, you’ll see a button showing the current chart type (likely a candlestick icon).
Select “Line” from the Dropdown:
Click that button and choose “Line” in the dropdown menu. This changes the main chart to a line chart of the real price.
Screenshots:

Cash And Carry Arbitrage BTC Compare Month 6 by SeoNo1Detailed Explanation of the BTC Cash and Carry Arbitrage Script
Script Title: BTC Cash And Carry Arbitrage Month 6 by SeoNo1
Short Title: BTC C&C ABT Month 6
Version: Pine Script v5
Overlay: True (The indicators are plotted directly on the price chart)
Purpose of the Script
This script is designed to help traders analyze and track arbitrage opportunities between the spot market and futures market for Bitcoin (BTC). Specifically, it calculates the spread and Annual Percentage Yield (APY) from a cash-and-carry arbitrage strategy until a specific expiry date (in this case, June 27, 2025).
The strategy helps identify profitable opportunities when the futures price of BTC is higher than the spot price. Traders can then buy BTC in the spot market and short BTC futures contracts to lock in a risk-free profit.
1. Input Settings
Spot Symbol: The real-time BTC spot price from Binance (BTCUSDT).
Futures Symbol: The BTC futures contract that expires in June 2025 (BTCUSDM2025).
Expiry Date: The expiration date of the futures contract, set to June 27, 2025.
These inputs allow users to adjust the symbols or expiry date according to their trading needs.
2. Price Data Retrieval
Spot Price: Fetches the latest closing price of BTC from the spot market.
Futures Price: Fetches the latest closing price of BTC futures.
Spread: The difference between the futures price and the spot price (futures_price - spot_price).
The spread indicates how much higher (or lower) the futures price is compared to the spot market.
3. Time to Maturity (TTM) and Annual Percentage Yield (APY) Calculation
Current Date: Gets the current timestamp.
Time to Maturity (TTM): The number of days left until the futures contract expires.
APY Calculation:
Formula:
APY = ( Spread / Spot Price ) x ( 365 / TTM Days ) x 100
This represents the annualized return from holding a cash-and-carry arbitrage position if the trader buys BTC at the spot price and sells BTC futures.
4. Display Information Table on the Chart
A table is created on the chart's top-right corner showing the following data:
Metric: Labels such as Spread and APY
Value: Displays the calculated spread and APY
The table automatically updates at the latest bar to display the most recent data.
5. Alert Condition
This sets an alert condition that triggers every time the script runs.
In practice, users can modify this alert to trigger based on specific conditions (e.g., APY exceeds a threshold).
6. Plotting the APY and Spread
APY Plot: Displays the annualized yield as a blue line on the chart.
Spread Plot: Visualizes the futures-spot spread as a red line.
This helps traders quickly identify arbitrage opportunities when the spread or APY reaches desirable levels.
How to Use the Script
Monitor Arbitrage Opportunities:
A positive spread indicates a potential cash-and-carry arbitrage opportunity.
The larger the APY, the more profitable the arbitrage opportunity could be.
Timing Trades:
Execute a buy on the BTC spot market and simultaneously sell BTC futures when the APY is attractive.
Close both positions upon futures contract expiry to realize profits.
Risk Management:
Ensure you have sufficient margin to hold both positions until expiry.
Monitor funding rates and volatility, which could affect returns.
Conclusion
This script is an essential tool for traders looking to exploit price discrepancies between the BTC spot market and futures market through a cash-and-carry arbitrage strategy. It provides real-time data on spreads, annualized returns (APY), and visual alerts, helping traders make informed decisions and maximize their profit potential.

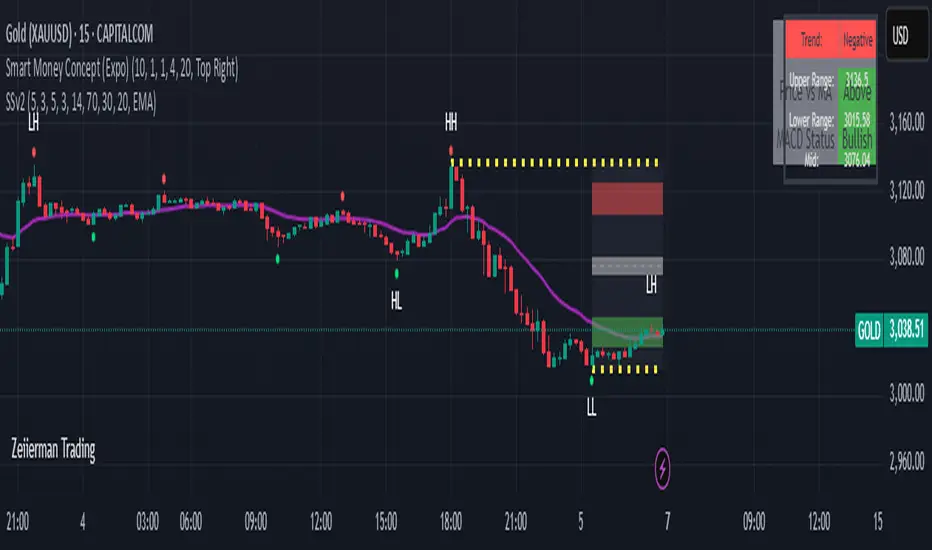
Auto-Length Moving Average + Trend Signals (Zeiierman)█ Overview
The Auto-Length Moving Average + Trend Signals (Zeiierman) is an easy-to-use indicator designed to help traders dynamically adjust their moving average length based on market conditions. This tool adapts in real-time, expanding and contracting the moving average based on trend strength and momentum shifts.
The indicator smooths out price fluctuations by modifying its length while ensuring responsiveness to new trends. In addition to its adaptive length algorithm, it incorporates trend confirmation signals, helping traders identify potential trend reversals and continuations with greater confidence.
This indicator suits scalpers, swing traders, and trend-following investors who want a self-adjusting moving average that adapts to volatility, momentum, and price action dynamics.
█ How It Works
⚪ Dynamic Moving Average Length
The core feature of this indicator is its ability to automatically adjust the length of the moving average based on trend persistence and market conditions:
Expands in strong trends to reduce noise.
Contracts in choppy or reversing markets for faster reaction.
This allows for a more accurate moving average that aligns with current price dynamics.
⚪ Trend Confirmation & Signals
The indicator includes built-in trend detection logic, classifying trends based on market structure. It evaluates trend strength based on consecutive bars and smooths out transitions between bullish, bearish, and neutral conditions.
Uptrend: Price is persistently above the adjusted moving average.
Downtrend: Price remains below the adjusted moving average.
Neutral: Price fluctuates around the moving average, indicating possible consolidation.
⚪ Adaptive Trend Smoothing
A smoothing factor is applied to enhance trend readability while minimizing excessive lag. This balances reactivity with stability, making it easier to follow longer-term trends while avoiding false signals.
█ How to Use
⚪ Trend Identification
Bullish Trend: The indicator confirms an uptrend when the price consistently stays above the dynamically adjusted moving average.
Bearish Trend: A downtrend is recognized when the price remains below the moving average.
⚪ Trade Entry & Exit
Enter long when the dynamic moving average is green and a trend signal occurs. Exit when the price crosses below the dynamic moving average.
Enter short when the dynamic moving average is red and a trend signal occurs. Exit when the price crosses above the dynamic moving average.
█ Slope-Based Reset
This mode resets the trend counter when the moving average slope changes direction.
⚪ Interpretation & Insights
Best for trend-following traders who want to filter out noise and only reset when a clear shift in momentum occurs.
Higher slope length (N): More stable trends, fewer resets.
Lower slope length (N): More reactive to small price swings, frequent resets.
Useful in swing trading to track significant trend reversals.
█ RSI-Based Reset
The counter resets when the Relative Strength Index (RSI) crosses predefined overbought or oversold levels.
⚪ Interpretation & Insights
Best for reversal traders who look for extreme overbought/oversold conditions.
High RSI threshold (e.g., 80/20): Fewer resets, only extreme conditions trigger adjustments.
Lower RSI threshold (e.g., 60/40): More frequent resets, detecting smaller corrections.
Great for detecting exhaustion in trends before potential reversals.
█ Volume-Based Reset
A reset occurs when current volume significantly exceeds its moving average, signaling a shift in market participation.
⚪ Interpretation & Insights
Best for traders who follow institutional activity (high volume often means large players are active).
Higher volume SMA length: More stable trends, only resets on massive volume spikes.
Lower volume SMA length: More reactive to short-term volume shifts.
Useful in identifying breakout conditions and trend acceleration points.
█ Bollinger Band-Based Reset
A reset occurs when price closes above the upper Bollinger Band or below the lower Bollinger Band, signaling potential overextension.
⚪ Interpretation & Insights
Best for traders looking for volatility-based trend shifts.
Higher Bollinger Band multiplier (k = 2.5+): Captures only major price extremes.
Lower Bollinger Band multiplier (k = 1.5): Resets on moderate volatility changes.
Useful for detecting overextensions in strong trends before potential retracements.
█ MACD-Based Reset
A reset occurs when the MACD line crosses the signal line, indicating a momentum shift.
⚪ Interpretation & Insights
Best for momentum traders looking for trend continuation vs. exhaustion signals.
Longer MACD lengths (260, 120, 90): Captures major trend shifts.
Shorter MACD lengths (10, 5, 3): Reacts quickly to momentum changes.
Useful for detecting strong divergences and market shifts.
█ Stochastic-Based Reset
A reset occurs when Stochastic %K crosses overbought or oversold levels.
⚪ Interpretation & Insights
Best for short-term traders looking for fast momentum shifts.
Longer Stochastic length: Filters out false signals.
Shorter Stochastic length: Captures quick intraday shifts.
█ CCI-Based Reset
A reset occurs when the Commodity Channel Index (CCI) crosses predefined overbought or oversold levels. The CCI measures the price deviation from its statistical mean, making it a useful tool for detecting overextensions in price action.
⚪ Interpretation & Insights
Best for cycle traders who aim to identify overextended price deviations in trending or ranging markets.
Higher CCI threshold (e.g., ±200): Detects extreme overbought/oversold conditions before reversals.
Lower CCI threshold (e.g., ±10): More sensitive to trend shifts, useful for early signal detection.
Ideal for detecting momentum shifts before price reverts to its mean or continues trending strongly.
█ Momentum-Based Reset
A reset occurs when Momentum (Rate of Change) crosses zero, indicating a potential shift in price direction.
⚪ Interpretation & Insights
Best for trend-following traders who want to track acceleration vs. deceleration.
Higher momentum length: Captures longer-term shifts.
Lower momentum length: More responsive to short-term trend changes.
█ How to Interpret the Trend Strength Table
The Trend Strength Table provides valuable insights into the current market conditions by tracking how the dynamic moving average is adjusting based on trend persistence. Each metric in the table plays a role in understanding the strength, longevity, and stability of a trend.
⚪ Counter Value
Represents the current length of trend persistence before a reset occurs.
The higher the counter, the longer the current trend has been in place without resetting.
When this value reaches the Counter Break Threshold, the moving average resets and contracts to become more reactive.
Example:
A low counter value (e.g., 10) suggests a recent trend reset, meaning the market might be changing directions frequently.
A high counter value (e.g., 495) means the trend has been ongoing for a long time, indicating strong trend persistence.
⚪ Trend Strength
Measures how strong the current trend is based on the trend confirmation logic.
Higher values indicate stronger trends, while lower values suggest weaker trends or consolidations.
This value is dynamic and updates based on price action.
Example:
Trend Strength of 760 → Indicates a high-confidence trend.
Trend Strength of 50 → Suggests weak price action, possibly a choppy market.
⚪ Highest Trend Score
Tracks the strongest trend score recorded during the session.
Helps traders identify the most dominant trend observed in the timeframe.
This metric is useful for analyzing historical trend strength and comparing it with current conditions.
Example:
Highest Trend Score = 760 → Suggests that at some point, there was a strong trend in play.
If the current trend strength is much lower than this value, it could indicate trend exhaustion.
⚪ Average Trend Score
This is a rolling average of trend strength across the session.
Provides a bigger picture of how the trend strength fluctuates over time.
If the average trend score is high, the market has had persistent trends.
If it's low, the market may have been choppy or sideways.
Example:
Average Trend Score of 147 vs. Current Trend Strength of 760 → Indicates that the current trend is significantly stronger than the historical average, meaning a breakout might be occurring.
Average Trend Score of 700+ → Suggests a strong trending market overall.
█ Settings
⚪ Dynamic MA Controls
Base MA Length – Sets the starting length of the moving average before dynamic adjustments.
Max Dynamic Length – Defines the upper limit for how much the moving average can expand.
Trend Confirmation Length – The number of bars required to validate an uptrend or downtrend.
⚪ Reset & Adaptive Conditions
Reset Condition Type – Choose what triggers the moving average reset (Slope, RSI, Volume, MACD, etc.).
Trend Smoothing Factor – Adjusts how smoothly the moving average responds to price changes.
-----------------
Disclaimer
The content provided in my scripts, indicators, ideas, algorithms, and systems is for educational and informational purposes only. It does not constitute financial advice, investment recommendations, or a solicitation to buy or sell any financial instruments. I will not accept liability for any loss or damage, including without limitation any loss of profit, which may arise directly or indirectly from the use of or reliance on such information.
All investments involve risk, and the past performance of a security, industry, sector, market, financial product, trading strategy, backtest, or individual's trading does not guarantee future results or returns. Investors are fully responsible for any investment decisions they make. Such decisions should be based solely on an evaluation of their financial circumstances, investment objectives, risk tolerance, and liquidity needs.

Exposure Oscillator (Cumulative 0 to ±100%)
Exposure Oscillator (Cumulative 0 to ±100%)
This Pine Script indicator plots an "Exposure Oscillator" on the chart, which tracks the cumulative market exposure from a range of technical buy and sell signals. The exposure is measured on a scale from -100% (maximum short exposure) to +100% (maximum long exposure), helping traders assess the strength of their position in the market. It provides an intuitive visual cue to aid decision-making for trend-following strategies.
Buy Signals (Increase Exposure Score by +10%)
Buy Signal 1 (Cross Above 21 EMA):
This signal is triggered when the price crosses above the 21-period Exponential Moving Average (EMA), where the current bar closes above the EMA21, and the previous bar closed below the EMA21. This indicates a potential upward price movement as the market shifts into a bullish trend.
buySignal1 = ta.crossover(close, ema21)
Buy Signal 2 (Trending Above 21 EMA):
This signal is triggered when the price closes above the 21-period EMA for each of the last 5 bars, indicating a sustained bullish trend. It confirms that the price is consistently above the EMA21 for a significant period.
buySignal2 = ta.barssince(close <= ema21) > 5
Buy Signal 3 (Living Above 21 EMA):
This signal is triggered when the price has closed above the 21-period EMA for each of the last 15 bars, demonstrating a strong, prolonged uptrend.
buySignal3 = ta.barssince(close <= ema21) > 15
Buy Signal 4 (Cross Above 50 SMA):
This signal is triggered when the price crosses above the 50-period Simple Moving Average (SMA), where the current bar closes above the 50 SMA, and the previous bar closed below it. It indicates a shift toward bullish momentum.
buySignal4 = ta.crossover(close, sma50)
Buy Signal 5 (Cross Above 200 SMA):
This signal is triggered when the price crosses above the 200-period Simple Moving Average (SMA), where the current bar closes above the 200 SMA, and the previous bar closed below it. This suggests a long-term bullish trend.
buySignal5 = ta.crossover(close, sma200)
Buy Signal 6 (Low Above 50 SMA):
This signal is true when the lowest price of the current bar is above the 50-period SMA, indicating strong bullish pressure as the price maintains itself above the moving average.
buySignal6 = low > sma50
Buy Signal 7 (Accumulation Day):
An accumulation day occurs when the closing price is in the upper half of the daily range (greater than 50%) and the volume is larger than the previous bar's volume, suggesting buying pressure and accumulation.
buySignal7 = (close - low) / (high - low) > 0.5 and volume > volume
Buy Signal 8 (Higher High):
This signal occurs when the current bar’s high exceeds the highest high of the previous 14 bars, indicating a breakout or strong upward momentum.
buySignal8 = high > ta.highest(high, 14)
Buy Signal 9 (Key Reversal Bar):
This signal is generated when the stock opens below the low of the previous bar but rallies to close above the previous bar’s high, signaling a potential reversal from bearish to bullish.
buySignal9 = open < low and close > high
Buy Signal 10 (Distribution Day Fall Off):
This signal is triggered when a distribution day (a day with high volume and a close near the low of the range) "falls off" the rolling 25-bar period, indicating the end of a bearish trend or selling pressure.
buySignal10 = ta.barssince(close < sma50 and close < sma50) > 25
Sell Signals (Decrease Exposure Score by -10%)
Sell Signal 1 (Cross Below 21 EMA):
This signal is triggered when the price crosses below the 21-period Exponential Moving Average (EMA), where the current bar closes below the EMA21, and the previous bar closed above it. It suggests that the market may be shifting from a bullish trend to a bearish trend.
sellSignal1 = ta.crossunder(close, ema21)
Sell Signal 2 (Trending Below 21 EMA):
This signal is triggered when the price closes below the 21-period EMA for each of the last 5 bars, indicating a sustained bearish trend.
sellSignal2 = ta.barssince(close >= ema21) > 5
Sell Signal 3 (Living Below 21 EMA):
This signal is triggered when the price has closed below the 21-period EMA for each of the last 15 bars, suggesting a strong downtrend.
sellSignal3 = ta.barssince(close >= ema21) > 15
Sell Signal 4 (Cross Below 50 SMA):
This signal is triggered when the price crosses below the 50-period Simple Moving Average (SMA), where the current bar closes below the 50 SMA, and the previous bar closed above it. It indicates the start of a bearish trend.
sellSignal4 = ta.crossunder(close, sma50)
Sell Signal 5 (Cross Below 200 SMA):
This signal is triggered when the price crosses below the 200-period Simple Moving Average (SMA), where the current bar closes below the 200 SMA, and the previous bar closed above it. It indicates a long-term bearish trend.
sellSignal5 = ta.crossunder(close, sma200)
Sell Signal 6 (High Below 50 SMA):
This signal is true when the highest price of the current bar is below the 50-period SMA, indicating weak bullishness or a potential bearish reversal.
sellSignal6 = high < sma50
Sell Signal 7 (Distribution Day):
A distribution day is identified when the closing range of a bar is less than 50% and the volume is larger than the previous bar's volume, suggesting that selling pressure is increasing.
sellSignal7 = (close - low) / (high - low) < 0.5 and volume > volume
Sell Signal 8 (Lower Low):
This signal occurs when the current bar's low is less than the lowest low of the previous 14 bars, indicating a breakdown or strong downward momentum.
sellSignal8 = low < ta.lowest(low, 14)
Sell Signal 9 (Downside Reversal Bar):
A downside reversal bar occurs when the stock opens above the previous bar's high but falls to close below the previous bar’s low, signaling a reversal from bullish to bearish.
sellSignal9 = open > high and close < low
Sell Signal 10 (Distribution Cluster):
This signal is triggered when a distribution day occurs three times in the rolling 7-bar period, indicating significant selling pressure.
sellSignal10 = ta.valuewhen((close < low) and volume > volume , 1, 7) >= 3
Theme Mode:
Users can select the theme mode (Auto, Dark, or Light) to match the chart's background or to manually choose a light or dark theme for the oscillator's appearance.
Exposure Score Calculation: The script calculates a cumulative exposure score based on a series of buy and sell signals.
Buy signals increase the exposure score, while sell signals decrease it. Each signal impacts the score by ±10%.
Signal Conditions: The buy and sell signals are derived from multiple conditions, including crossovers with moving averages (EMA21, SMA50, SMA200), trend behavior, and price/volume analysis.
Oscillator Visualization: The exposure score is visualized as a line on the chart, changing color based on whether the exposure is positive (long position) or negative (short position). It is limited to the range of -100% to +100%.
Position Type: The indicator also indicates the position type based on the exposure score, labeling it as "Long," "Short," or "Neutral."
Horizontal Lines: Reference lines at 0%, 100%, and -100% visually mark neutral, increasing long, and increasing short exposure levels.
Exposure Table: A table displays the current exposure level (in percentage) and position type ("Long," "Short," or "Neutral"), updated dynamically based on the oscillator’s value.
Inputs:
Theme Mode: Choose "Auto" to use the default chart theme, or manually select "Dark" or "Light."
Usage:
This oscillator is designed to help traders track market sentiment, gauge exposure levels, and manage risk. It can be used for long-term trend-following strategies or short-term trades based on moving average crossovers and volume analysis.
The oscillator operates in conjunction with the chart’s price action and provides a visual representation of the market’s current trend strength and exposure.
Important Considerations:
Risk Management: While the exposure score provides valuable insight, it should be combined with other risk management tools and analysis for optimal trading decisions.
Signal Sensitivity: The accuracy and effectiveness of the signals depend on market conditions and may require adjustments based on the user’s trading strategy or timeframe.
Disclaimer:
This script is for educational purposes only. Trading involves significant risk, and users should carefully evaluate all market conditions and apply appropriate risk management strategies before using this tool in live trading environments.

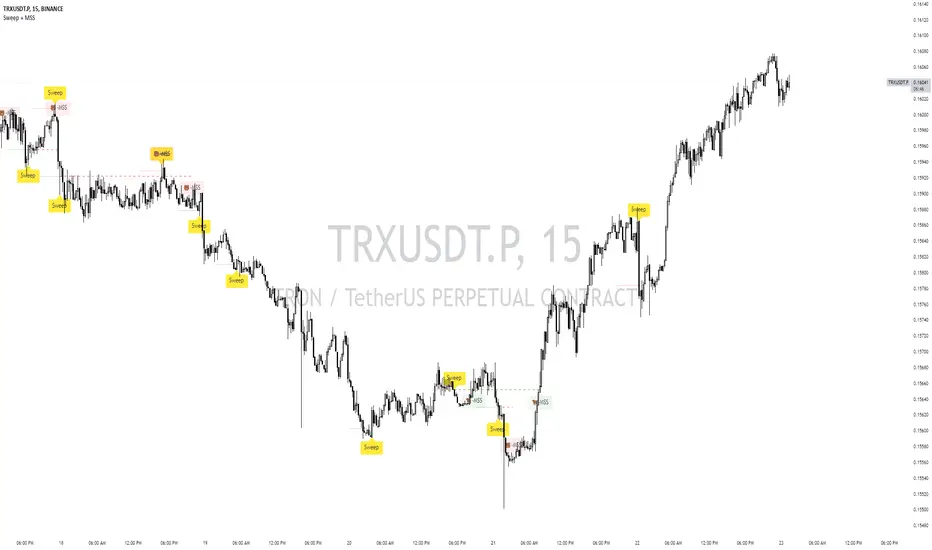
Sweep + MSS# Sweep + MSS Indicator
This indicator identifies market sweeps and Market Structure Shifts (MSS) to help traders recognize potential trend changes and market manipulations.
How it works:
1. Sweep Detection:
- Identifies when price briefly moves beyond a recent high/low (pivot point) and then reverses.
- Bullish sweep: Price drops below a recent low, then closes above it.
- Bearish sweep: Price rises above a recent high, then closes below it.
2. Market Structure Shift (MSS):
- Occurs when price action invalidates a previous sweep level.
- Bullish MSS: Price closes above a bearish sweep level.
- Bearish MSS: Price closes below a bullish sweep level.
Key Features:
- Customizable pivot lookback length for sweep detection
- Minimum bar requirement after a sweep before MSS can trigger
- One MSS per sweep level to avoid multiple signals
- Visual representation with lines connecting sweep points to MSS triggers
- Emoji labels for easy identification (🐂-MSS for bullish, 🐻-MSS for bearish)
Logic Behind MSS:
The MSS aims to identify potential trend changes by recognizing when the market invalidates a previous sweep level. This often indicates a shift in market structure, suggesting that the previous trend may be weakening or reversing.
- A bullish MSS occurs when the price closes above a bearish sweep level, potentially signaling a shift from bearish to bullish sentiment.
- A bearish MSS occurs when the price closes below a bullish sweep level, potentially signaling a shift from bullish to bearish sentiment.
By requiring a minimum number of bars between the sweep and the MSS, the indicator helps filter out noise and focuses on more significant structural changes in the market.
This indicator can be a valuable tool for traders looking to identify potential trend changes and entry/exit points based on market structure analysis.
Chandelier Exit Pro w/ExtensionsChandelier Exit Pro w/Extensions
The Chandelier Exit Pro w/Extensions indicator is designed to assist traders in managing risk and identifying trend reversals. The strategy is based on the Chandelier Exit concept, originally created by Charles Le Beau. It uses the Average True Range (ATR) to calculate dynamic stop levels that adjust based on market volatility. This script not only implements the standard Chandelier Exit, but also introduces extension levels and alerts to enhance decision-making.
Key Features:
➡️Dynamic Stop Levels: The indicator calculates stop levels for both long and short positions based on an ATR multiple. This allows traders to determine exit points by monitoring when the price crosses above or below these levels. These levels adapt in real-time based on price volatility, making them a versatile tool for trend-following strategies.
➡️Extension Levels: In addition to the primary stop levels, the script includes extension levels for more advanced stop-loss management. Traders can view active and extension levels separately, providing more flexibility in their exit strategies.
➡️Labels and Visual Cues: The indicator provides dynamic labels that automatically update and follow the plotted stop levels. Labels include the ATR multiplier value (e.g., "2.5" or "2.5ext"), clearly showing the significance of each level. When price crosses below or above a level, the corresponding label is highlighted, aiding traders in quickly identifying the most relevant stop level.
➡️Bar Confirmation and Alerts: The script includes an "await bar confirmation" option to ensure that the stop levels and alerts only trigger after the bar has closed. Alerts are customizable and will notify traders when price crosses critical levels, helping to make timely decisions without the need to constantly monitor charts.
➡️Multiple ATR Levels for Enhanced Precision: The indicator supports up to four different ATR levels, each with customizable multipliers. This allows traders to set different thresholds for exits based on varying degrees of volatility. For example, Level 1 (2.5x ATR) might represent a tighter stop, while Level 4 (10x ATR) could serve as a wider stop for long-term positions.
➡️Calc_bars_count: Improves efficiency of the indicator by reducing the on-chart calculations in to the past. This input can be found at the bottom of the INPUTS tab.
How it Helps Traders:
💥Trend Identification: By using the Chandelier Exit levels, traders can identify when the trend is likely to reverse. When the price crosses below the stop level in a long trade or above the stop level in a short trade, it signals a potential exit point.
💥Volatility-based Adjustments: Unlike static stop-loss methods, the ATR-based stop levels dynamically adjust based on the market’s volatility. This means tighter stops during low volatility periods and wider stops during high volatility periods, reducing the chance of being stopped out prematurely.
💥Risk Management: The dynamic stop levels and extension levels provide a structured way to manage risk. Traders can set tighter stops for short-term trades and wider stops for longer-term trades. The script's visual labels make it easy to track these levels in real-time.
💥Automation with Alerts: The built-in alert system ensures that traders are notified when key levels are crossed. This helps to avoid emotional decision-making and allows for better execution of trading strategies.
Confluence and Price Fluidity:
One of the powerful ways to enhance the effectiveness of the Chandelier Exit indicator is by using it in conjunction with other technical analysis tools to create confluence. Confluence occurs when multiple indicators or price action signals align, providing stronger confirmation for a trade decision. For example:
🎯Support and Resistance Levels: Traders can use the Chandelier Exit levels in combination with key support and resistance zones. If the price is nearing a support level and the Chandelier Exit signals a bullish reversal, this alignment strengthens the case for entering a long position.
🎯Moving Averages: When the Chandelier Exit signals a trend reversal and this is confirmed by a crossover in moving averages (such as a 50-day and 200-day moving average), traders gain additional confidence in the trade direction.
🎯Momentum Indicators: Traders can also look for momentum indicators like RSI or MACD to confirm the strength of a trend or potential reversal. For instance, if the Chandelier Exit triggers a short signal and the RSI also shows overbought conditions, this could provide stronger confirmation to exit a long trade or enter a short position.
🎯Candlestick Patterns: Price fluidity can be monitored using candlestick formations. For example, a bearish engulfing pattern near a Chandelier Exit resistance level offers confluence, adding confidence to the signal to close or short the trade.
By combining the Chandelier Exit with other tools, traders ensure that they are not relying on a single indicator. This layered approach can reduce the likelihood of false signals and improve overall trading accuracy.
Practical Use Case:
Imagine a trader enters a long position, and the price moves favorably. Using the Chandelier Exit, the trader sets the initial stop level at 2.5x ATR below the highest close. As the price continues to rise, the stop level follows the price, locking in profits. If the market suddenly turns, the price crossing below the stop level signals an exit, helping the trader preserve gains. With extension levels, the trader can further refine exits, adjusting based on their risk tolerance and market conditions.
Good luck and I hope that you can find a place in your tool bag to use this dynamic indicator 🙏

Uptrend & SMAThe "Uptrend and Close to SMA" indicator is designed to help traders identify when the price of a stock is in an uptrend and is trading near its Simple Moving Average (SMA) over a user-defined period. The indicator uses multi-timeframe analysis, allowing the user to select different timeframes for calculating the SMA.
Key Features:
SMA Calculation: The indicator calculates the SMA for a selected timeframe (e.g., daily, weekly, monthly) based on a user-specified period (default is 150 periods).
Multi-Timeframe Options: Users can choose between multiple timeframes (1 day, 1 week, 1 month, 3 months, 6 months, 12 months) to calculate the SMA, providing flexibility in trend analysis.
Proximity Threshold: The indicator includes a proximity threshold in percentage terms, allowing users to define how close the real-time price needs to be to the SMA to trigger a visual alert.
Uptrend Identification: The indicator identifies an uptrend when the real-time price is above the selected SMA.
Visual Alerts: If the price is above the SMA and within the defined proximity threshold, the background color of the chart will change to green, signaling that the stock is in an uptrend and close to the SMA.
Alert Condition: The indicator includes an alert condition that triggers when the price is in an uptrend and within the proximity threshold, allowing traders to be notified when their criteria are met.
Percentage Difference Display: A table displays the percentage difference between the real-time price and the SMA, providing a quick reference to see how far the price is from the SMA in percentage terms.
This indicator is especially useful for traders looking for potential buying opportunities when a stock is trending upwards but still near its moving average, indicating potential continuation or momentum.

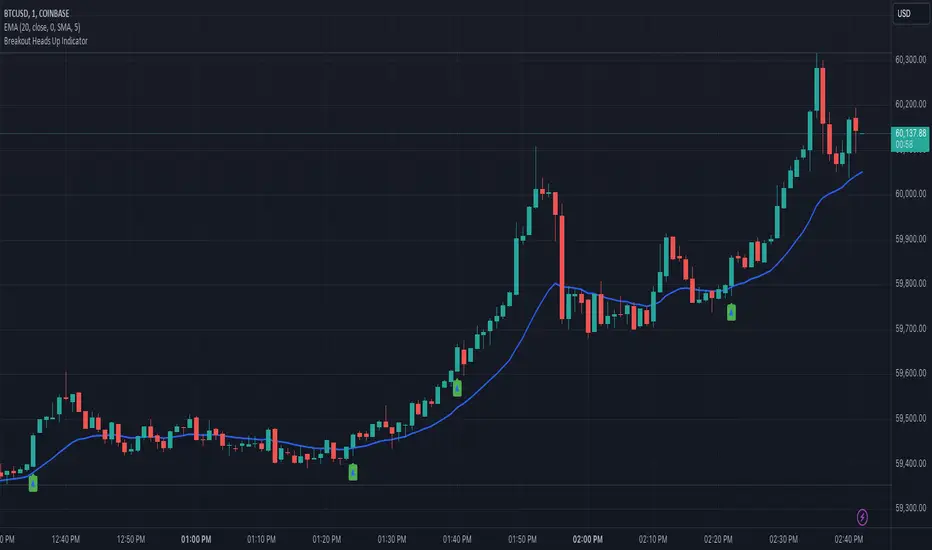
Heads UpAn indicator that gives you the "heads up" that that bullish/ bearish strength is increasing.
I wanted an indicator that could give me the "heads up" that bullish/ bearish strength is increasing. This would help me get into a breakout early or avoid entering a breakout that had a high probability of failure.
Here are my definitions for this indicator:
My bull bar definition:
- A green candle that closes above 75% of it's candle range.
- The candle's body does not overlap the previous candle's body. Tails/ wicks CAN overlap.
My bear bar definition:
- A red candle that closes below 75% of it's candle range.
- the candle's body does not overlap the previous candle's body. Tails/ ticks CAN overlap.
Bullish strength increasing (arrow up):
- Bull bars are increasing in size (the candle's range) compared to previous 5 bars.
- 2 consecutive bull bars.
Bearish strength increasing (arrow down):
- Bear bars are increasing in size (the candle's range) compared to previous 5 bars.
- 2 consecutive bear bars.
You will not see this indicator trigger very often but when it does - it's because there is a change in bullish bearish strength.
Things to be aware of:
Use the indicator in line with the context of the previous trend. You will get triggers that fail. These are usually because they appear counter trend. When in doubt zoom out.
It will not call every successful breakout. If you understand the definitions you'll understand why it appears.
This is my first indicator and used for my personal use. Feedback and other ideas are welcome.
[INVX] Post-Earnings Announcement DriftWhat does this strategy do?
This Pine Script strategy implements the Post-earnings announcement drift (PEAD) strategy, which is a financial market anomaly where a stock's price tends to drift in the direction of the firm's earnings surprise for an extended period of time.
Ref: en.wikipedia.org
An earnings announcement is an official public statement of a company's profitability for a specific time period, typically a quarter or a year. It includes various financial metrics but the most watched figure is the Earnings Per Share (EPS). Analysts estimate the EPS before the announcement, and the actual EPS is compared to this estimate to determine if there was an earnings surprise.
An earnings surprise occurs when the actual EPS is significantly different from the analysts' estimates. A positive earnings surprise indicates that the actual EPS is higher than the estimate, while a negative earnings surprise suggests the EPS is lower than anticipated.
The script takes the following inputs
" Holding periods (bar) " : This input defines the number of periods (or bars) the script will hold a position after the earnings announcement.
" Surprise threshold (%) ": This input sets the minimum percentage for an earnings surprise, which triggers the strategy to enter either a long or short position. In essence, it represents the minimum deviation between the estimated and actual Earnings Per Share (EPS) that will trigger a trade. A higher threshold may lead to fewer, potentially more significant trades, while a lower threshold might result in more frequent, possibly less impactful trades. This parameter allows you to adjust the sensitivity of the strategy to earnings surprises.
Positive earnings surprise
After the earnings announcement, the script compares the actual EPS with the estimated EPS to identify an earnings surprise. If there is a positive earnings surprise, the script will enter a long position. A long position is a bullish strategy where the investor expects the stock price to rise.
Negative earnings surprise
On the other hand, if there is a negative earnings surprise, the script will enter a short position. A short position is a bearish strategy where the investor expects the stock price to fall.
In both scenarios, the position (either long or short) is held for the number of periods specified in the "Holding periods (bar)" input. This strategy is based on the assumption that the stock price will continue to drift in the direction of the earnings surprise for the specified holding period.
Disclaimer: The script provided herein is for educational purposes only. It should not be considered as investment advice or a recommendation of any particular security, strategy or investment product. Past performance is not indicative of future results.
The results of the Pine Script backtesting are hypothetical and should not be considered as a true reflection of the results that might be achieved in a live trading environment. The backtest results are based on historical data and may not take into account certain factors such as actual transaction costs, taxes, or changes in market conditions.
Investors should consult with their financial advisor before making any investment decisions. All investments involve risk, including the potential loss of all invested capital.

Stochastic / Connectable [Azullian]Advance your market analysis with the Stochastic Oscillator. Identify potential price reversals with precision, aiding in the creation of flexible and accurate strategies.
This connectable Stochastic indicator is part of an indicator system designed to help test, visualize and build strategy configurations without coding. Like all connectable indicators , it interacts through the TradingView input source, which serves as a signal connector to link indicators to each other. All connectable indicators send signal weight to the next node in the system until it reaches either a connectable signal monitor, signal filter and/or strategy.
█ UNIFORM SETTINGS AND A WAY OF WORK
Although connectable indicators may have specific weight scoring conditions, they all aim to follow a standardized general approach to weight scoring settings, as outlined below.
■ Connectable indicators - Settings
• 🗲 Energy: Energy applies an ATR multiplier to the plotted shapes on the chart. A higher value plots shapes farther away from the candle, enhancing visibility.
• ☼ Brightness: Brightness determines the opacity of the shape plotted on the chart, aiding visibility. Indicator weight also influences opacity.
• → Input: Use the input setting to specify a data source for the indicator. Here you can connect the indicator to other indicators.
• ⌥ Flow: Determine where you want to receive signals from:
○ Both: Weights from this indicator and the connected indicator will apply
○ Indicator only: Only weights from this indicator will apply
○ Input only: Only weights from the connected indicator will apply
• ⥅ Weight multiplier: Multiply all weights in the entire indicator by a given factor, useful for quickly testing different indicators in a granular setup.
• ⥇ Threshold: Set a threshold to indicate the minimum amount of weight it should receive to pass it through to the next indicator.
• ⥱ Limiter: Set a hard limit to the maximum amount of weight that can be fed through the indicator.
■ Connectable indicators - Weight scoring settings
▢ Weight scoring conditions
• SM – Signal mode: Enable specific conditions for weight scoring
○ All: All signals will be scored.
○ Entries only: Only entries will score.
○ Exits only: Only exits will score.
○ Entries & exits: Both entries and exits will score.
○ Zone: Continuous scoring for each candle within the zone.
• SP – Signal period: Defines a range of candles within which a signal can score.
• SC - Signal count: Specifies the number of bars to retrospectively examine and score.
○ Single: Score for a single occurrence
○ All occurrences: Score for all occurrences
○ Single + Threshold: Score for single occurrences within the signal period (SP)
○ Every + Threshold: Score for all occurrences within the signal period (SP)
▢ Weight scoring direction
• ES: Enter Short weight
• XL: Exit long weight
• EL: Enter Long weight
• XS: Exit Short weight
▢ Weight scoring values
• Weights can hold either positive or negative scores. Positive weights enhance a particular trading direction, while negative weights diminish it.
█ STOCHASTIC - INDICATOR SETTINGS
■ Main settings
• Enable/Disable Indicator: Toggle the entire indicator on or off.
• S - Source: Choose an alternative data source for the Stochastic calculation.
• T - Timeframe: Select an alternative timeframe for the Stochastic calculation.
• KL - %K Length: Define the number of bars or periods used in the calculation of the %K value.
• OB - Overbought Level: Determine the Stochastic value at which overbought conditions are met.
• OS - Oversold Level: Specify the Stochastic value at which oversold conditions are met.
• %K - %K Smoothing: DDefine the number of bars or periods used to smooth the %K value.
• %D - %D Smoothing: Define the number of bars or periods used to calculate and smooth the %D
■ Scoring functionality
• The Stochastic scores long entries when the %K line crosses above the %D line within the OS (oversold) area.
• The Stochastic scores long exits when the %K line crosses below the %D line after being in the OS (oversold) area.
• The Stochastic scores long zones for the duration the %K is above the %D line within the OS (oversold) area.
• The Stochastic scores short entries when the %K line crosses below the %D line within the OB (overbought) area.
• The Stochastic scores short exits when the %K line crosses above the %D line after being in the OB (overbought) area.
• The Stochastic scores short zones for the duration the %K is below the %D line within the OB (overbought) area.
█ PLOTTING
• Standard: Symbols (EL, XS, ES, XL) appear relative to candles based on set conditions. Their opacity and position vary with weight.
• Conditional Settings: A larger icon appears if global conditions are met. For instance, with a Threshold(⥇) of 12, Signal Period (SP) of 3, and Scoring Condition (SC) set to "EVERY", a Stochastic signaling over two times in 3 candles (scoring 6 each) triggers a larger icon.
█ USAGE OF CONNECTABLE INDICATORS
■ Connectable chaining mechanism
Connectable indicators can be connected directly to the signal monitor, signal filter or strategy , or they can be daisy chained to each other while the last indicator in the chain connects to the signal monitor, signal filter or strategy. When using a signal filter you can chain the filter to the strategy input to make your chain complete.
• Direct chaining: Connect an indicator directly to the signal monitor, signal filter or strategy through the provided inputs (→).
• Daisy chaining: Connect indicators using the indicator input (→). The first in a daisy chain should have a flow (⌥) set to 'Indicator only'. Subsequent indicators use 'Both' to pass the previous weight. The final indicator connects to the signal monitor, signal filter, or strategy.
■ Set up this indicator with a signal filter and strategy
The indicator provides visual cues based on signal conditions. However, its weight system is best utilized when paired with a connectable signal filter, signal monitor, or strategy .
Let's connect the Stochastic to a connectable signal filter and a strategy :
1. Load all relevant indicators
• Load Stochastic / Connectable
• Load Signal filter / Connectable
• Load Strategy / Connectable
2. Signal Filter: Connect the Stochastic to the Signal Filter
• Open the signal filter settings
• Choose one of the three input dropdowns (1→, 2→, 3→) and choose : Stochastic / Connectable: Signal Connector
• Toggle the enable box before the connected input to enable the incoming signal
3. Signal Filter: Update the filter signals settings if needed
• The default settings of the filter enable EL (Enter Long), XL (Exit Long), ES (Enter Short) and XS (Exit Short).
4. Signal Filter: Update the weight threshold settings if needed
• All connectable indicators load by default with a score of 6 for each direction (EL, XL, ES, XS)
• By default, weight threshold (TH) is set at 5. This allows each occurrence to score, as the default score in each connectable indicator is 1 point above the threshold. Adjust to your liking.
5. Strategy: Connect the strategy to the signal filter in the strategy settings
• Select a strategy input → and select the Signal filter: Signal connector
6. Strategy: Enable filter compatible directions
• Set the signal mode of the strategy to a compatible direction with the signal filter.
Now that everything is connected, you'll notice green spikes in the signal filter representing long signals, and red spikes indicating short signals. Trades will also appear on the chart, complemented by a performance overview. Your journey is just beginning: delve into different scoring mechanisms, merge diverse connectable indicators, and craft unique chains. Instantly test your results and discover the potential of your configurations. Dive deep and enjoy the process!
█ BENEFITS
• Adaptable Modular Design: Arrange indicators in diverse structures via direct or daisy chaining, allowing tailored configurations to align with your analysis approach.
• Streamlined Backtesting: Simplify the iterative process of testing and adjusting combinations, facilitating a smoother exploration of potential setups.
• Intuitive Interface: Navigate TradingView with added ease. Integrate desired indicators, adjust settings, and establish alerts without delving into complex code.
• Signal Weight Precision: Leverage granular weight allocation among signals, offering a deeper layer of customization in strategy formulation.
• Advanced Signal Filtering: Define entry and exit conditions with more clarity, granting an added layer of strategy precision.
• Clear Visual Feedback: Distinct visual signals and cues enhance the readability of charts, promoting informed decision-making.
• Standardized Defaults: Indicators are equipped with universally recognized preset settings, ensuring consistency in initial setups across different types like momentum or volatility.
• Reliability: Our indicators are meticulously developed to prevent repainting. We strictly adhere to TradingView's coding conventions, ensuring our code is both performant and clean.
█ COMPATIBLE INDICATORS
Each indicator that incorporates our open-source 'azLibConnector' library and adheres to our conventions can be effortlessly integrated and used as detailed above.
For clarity and recognition within the TradingView platform, we append the suffix ' / Connectable' to every compatible indicator.
█ COMMON MISTAKES, CLARIFICATIONS AND TIPS
• Removing an indicator from a chain: Deleting a linked indicator and confirming the "remove study tree" alert will also remove all underlying indicators in the object tree. Before removing one, disconnect the adjacent indicators and move it to the object stack's bottom.
• Point systems: The azLibConnector provides 500 points for each direction (EL: Enter long, XL: Exit long, ES: Enter short, XS: Exit short) Remember this cap when devising a point structure.
• Flow misconfiguration: In daisy chains the first indicator should always have a flow (⌥) setting of 'indicator only' while other indicator should have a flow (⌥) setting of 'both'.
• Hide attributes: As connectable indicators send through quite some information you'll notice all the arguments are taking up some screenwidth and cause some visual clutter. You can disable arguments in Chart Settings / Status line.
• Layout and abbreviations: To maintain a consistent structure, we use abbreviations for each input. While this may initially seem complex, you'll quickly become familiar with them. Each abbreviation is also explained in the inline tooltips.
• Inputs: Connecting a connectable indicator directly to the strategy delivers the raw signal without a weight threshold, meaning every signal will trigger a trade.
█ A NOTE OF GRATITUDE
Through years of exploring TradingView and Pine Script, we've drawn immense inspiration from the community's knowledge and innovation. Thank you for being a constant source of motivation and insight.
█ RISK DISCLAIMER
Azullian's content, tools, scripts, articles, and educational offerings are presented purely for educational and informational uses. Please be aware that past performance should not be considered a predictor of future results.
RSI / Connectable [Azullian]Enhance your trading approach with the modular RSI indicator, skilled in identifying market extremes. Simplify pattern visualization and signal weighting for more efficient strategy formulation.
This connectable RSI indicator is part of an indicator system designed to help test, visualize and build strategy configurations without coding. Like all connectable indicators , it interacts through the TradingView input source, which serves as a signal connector to link indicators to each other. All connectable indicators send signal weight to the next node in the system until it reaches either a connectable signal monitor, signal filter and/or strategy.
█ UNIFORM SETTINGS AND A WAY OF WORK
Although connectable indicators may have specific weight scoring conditions, they all aim to follow a standardized general approach to weight scoring settings, as outlined below.
■ Connectable indicators - Settings
• 🗲 Energy: Energy applies an ATR multiplier to the plotted shapes on the chart. A higher value plots shapes farther away from the candle, enhancing visibility.
• ☼ Brightness: Brightness determines the opacity of the shape plotted on the chart, aiding visibility. Indicator weight also influences opacity.
• → Input: Use the input setting to specify a data source for the indicator. Here you can connect the indicator to other indicators.
• ⌥ Flow: Determine where you want to receive signals from:
○ Both: Weights from this indicator and the connected indicator will apply
○ Indicator only: Only weights from this indicator will apply
○ Input only: Only weights from the connected indicator will apply
• ⥅ Weight multiplier: Multiply all weights in the entire indicator by a given factor, useful for quickly testing different indicators in a granular setup.
• ⥇ Threshold: Set a threshold to indicate the minimum amount of weight it should receive to pass it through to the next indicator.
• ⥱ Limiter: Set a hard limit to the maximum amount of weight that can be fed through the indicator.
■ Connectable indicators - Weight scoring settings
▢ Weight scoring conditions
• SM – Signal mode: Enable specific conditions for weight scoring
○ All: All signals will be scored.
○ Entries only: Only entries will score.
○ Exits only: Only exits will score.
○ Entries & exits: Both entries and exits will score.
○ Zone: Continuous scoring for each candle within the zone.
• SP – Signal period: Defines a range of candles within which a signal can score.
• SC - Signal count: Specifies the number of bars to retrospectively examine and score.
○ Single: Score for a single occurrence
○ All occurrences: Score for all occurrences
○ Single + Threshold: Score for single occurrences within the signal period (SP)
○ Every + Threshold: Score for all occurrences within the signal period (SP)
▢ Weight scoring direction
• ES: Enter Short weight
• XL: Exit long weight
• EL: Enter Long weight
• XS: Exit Short weight
▢ Weight scoring values
• Weights can hold either positive or negative scores. Positive weights enhance a particular trading direction, while negative weights diminish it.
■ Entries, exits and zone illustrated on a standard RSI indicator when the RSI is overbought.
█ RSI - INDICATOR SETTINGS
■ Main settings
• Enable/Disable Indicator: Toggle the entire indicator on or off.
• S - Source: Choose an alternative data source for the RSI calculation.
• T - Timeframe: Select an alternative timeframe for the RSI calculation.
• LE - Length: Define the number of bars or periods used in the RSI calculation.
• OB - Overbought Level: Determine the RSI value at which overbought conditions are met.
• OS - Oversold Level: Specify the RSI value at which oversold conditions are met.
■ Scoring functionality
• The RSI scores long entries when the RSI enters OS: oversold area
• The RSI scores long exits when the RSI exits OS: oversold area
• The RSI scores long zones the entire time the RSI is in OS: oversold area
• The RSI scores short entries when the RSI enters OB: overbought area
• The RSI scores short exits when the RSI exits OB: overbought area
• The RSI scores short zones the entire time the RSI is in OB: overbought area
█ PLOTTING
• Standard: Symbols (EL, XS, ES, XL) appear relative to candles based on set conditions. Their opacity and position vary with weight.
• Conditional Settings: A larger icon appears if global conditions are met. For instance, with a Threshold(⥇) of 12, Signal Period (SP) of 3, and Scoring Condition (SC) set to "EVERY", an RSI signaling over two times in 3 candles (scoring 6 each) triggers a larger icon.
█ USAGE OF CONNECTABLE INDICATORS
■ Connectable chaining mechanism
Connectable indicators can be connected directly to the signal monitor, signal filter or strategy , or they can be daisy chained to each other while the last indicator in the chain connects to the signal monitor, signal filter or strategy. When using a signal filter you can chain the filter to the strategy input to make your chain complete.
• Direct chaining: Connect an indicator directly to the signal monitor, signal filter or strategy through the provided inputs (→).
• Daisy chaining: Connect indicators using the indicator input (→). The first in a daisy chain should have a flow (⌥) set to 'Indicator only'. Subsequent indicators use 'Both' to pass the previous weight. The final indicator connects to the signal monitor, signal filter, or strategy.
■ Set up this indicator with a signal filter and strategy
The indicator provides visual cues based on signal conditions. However, its weight system is best utilized when paired with a connectable signal filter, signal monitor, or strategy .
Let's connect the RSI to a connectable signal filter and a strategy :
1. Load all relevant indicators
• Load RSI / Connectable
• Load Signal filter / Connectable
• Load Strategy / Connectable
2. Signal Filter: Connect the RSI to the Signal Filter
• Open the signal filter settings
• Choose one of the three input dropdowns (1→, 2→, 3→) and choose : RSI / Connectable: Signal Connector
• Toggle the enable box before the connected input to enable the incoming signal
3. Signal Filter: Update the filter signals settings if needed
• The default settings of the filter enable EL (Enter Long), XL (Exit Long), ES (Enter Short) and XS (Exit Short).
4. Signal Filter: Update the weight threshold settings if needed
• All connectable indicators load by default with a score of 6 for each direction (EL, XL, ES, XS)
• By default, weight threshold (TH) is set at 5. This allows each occurrence to score, as the default score in each connectable indicator is 1 point above the threshold. Adjust to your liking.
5. Strategy: Connect the strategy to the signal filter in the strategy settings
• Select a strategy input → and select the Signal filter: Signal connector
6. Strategy: Enable filter compatible directions
• Set the signal mode of the strategy to a compatible direction with the signal filter.
Now that everything is connected, you'll notice green spikes in the signal filter representing long signals, and red spikes indicating short signals. Trades will also appear on the chart, complemented by a performance overview. Your journey is just beginning: delve into different scoring mechanisms, merge diverse connectable indicators, and craft unique chains. Instantly test your results and discover the potential of your configurations. Dive deep and enjoy the process!
█ BENEFITS
• Adaptable Modular Design: Arrange indicators in diverse structures via direct or daisy chaining, allowing tailored configurations to align with your analysis approach.
• Streamlined Backtesting: Simplify the iterative process of testing and adjusting combinations, facilitating a smoother exploration of potential setups.
• Intuitive Interface: Navigate TradingView with added ease. Integrate desired indicators, adjust settings, and establish alerts without delving into complex code.
• Signal Weight Precision: Leverage granular weight allocation among signals, offering a deeper layer of customization in strategy formulation.
• Advanced Signal Filtering: Define entry and exit conditions with more clarity, granting an added layer of strategy precision.
• Clear Visual Feedback: Distinct visual signals and cues enhance the readability of charts, promoting informed decision-making.
• Standardized Defaults: Indicators are equipped with universally recognized preset settings, ensuring consistency in initial setups across different types like momentum or volatility.
• Reliability: Our indicators are meticulously developed to prevent repainting. We strictly adhere to TradingView's coding conventions, ensuring our code is both performant and clean.
█ COMPATIBLE INDICATORS
Each indicator that incorporates our open-source 'azLibConnector' library and adheres to our conventions can be effortlessly integrated and used as detailed above.
For clarity and recognition within the TradingView platform, we append the suffix ' / Connectable' to every compatible indicator.
█ COMMON MISTAKES, CLARIFICATIONS AND TIPS
• Removing an indicator from a chain: Deleting a linked indicator and confirming the "remove study tree" alert will also remove all underlying indicators in the object tree. Before removing one, disconnect the adjacent indicators and move it to the object stack's bottom.
• Point systems: The azLibConnector provides 500 points for each direction (EL: Enter long, XL: Exit long, ES: Enter short, XS: Exit short) Remember this cap when devising a point structure.
• Flow misconfiguration: In daisy chains the first indicator should always have a flow (⌥) setting of 'indicator only' while other indicator should have a flow (⌥) setting of 'both'.
• Hide attributes: As connectable indicators send through quite some information you'll notice all the arguments are taking up some screenwidth and cause some visual clutter. You can disable arguments in Chart Settings / Status line.
• Layout and abbreviations: To maintain a consistent structure, we use abbreviations for each input. While this may initially seem complex, you'll quickly become familiar with them. Each abbreviation is also explained in the inline tooltips.
• Inputs: Connecting a connectable indicator directly to the strategy delivers the raw signal without a weight threshold, meaning every signal will trigger a trade.
█ A NOTE OF GRATITUDE
Through years of exploring TradingView and Pine Script, we've drawn immense inspiration from the community's knowledge and innovation. Thank you for being a constant source of motivation and insight.
█ RISK DISCLAIMER
Azullian's content, tools, scripts, articles, and educational offerings are presented purely for educational and informational uses. Please be aware that past performance should not be considered a predictor of future results.

MA / Connectable [Azullian]Streamline trend analysis with the Moving Average indicator. Filter out market noise, aiding in the clear identification of market directions for dynamic strategy development.
This connectable moving average indicator is part of an indicator system designed to help test, visualize and build strategy configurations without coding. Like all connectable indicators , it interacts through the TradingView input source, which serves as a signal connector to link indicators to each other. All connectable indicators send signal weight to the next node in the system until it reaches either a connectable signal monitor, signal filter and/or strategy.
█ UNIFORM SETTINGS AND A WAY OF WORK
Although connectable indicators may have specific weight scoring conditions, they all aim to follow a standardized general approach to weight scoring settings, as outlined below.
■ Connectable indicators - Settings
• 🗲 Energy: Energy applies an ATR multiplier to the plotted shapes on the chart. A higher value plots shapes farther away from the candle, enhancing visibility.
• ☼ Brightness: Brightness determines the opacity of the shape plotted on the chart, aiding visibility. Indicator weight also influences opacity.
• → Input: Use the input setting to specify a data source for the indicator. Here you can connect the indicator to other indicators.
• ⌥ Flow: Determine where you want to receive signals from:
○ Both: Weights from this indicator and the connected indicator will apply
○ Indicator only: Only weights from this indicator will apply
○ Input only: Only weights from the connected indicator will apply
• ⥅ Weight multiplier: Multiply all weights in the entire indicator by a given factor, useful for quickly testing different indicators in a granular setup.
• ⥇ Threshold: Set a threshold to indicate the minimum amount of weight it should receive to pass it through to the next indicator.
• ⥱ Limiter: Set a hard limit to the maximum amount of weight that can be fed through the indicator.
■ Connectable indicators - Weight scoring settings
▢ Weight scoring conditions
• SM – Signal mode: Enable specific conditions for weight scoring
○ Start: A new trend starting will score
○ End: A trend ending will score
○ Zone: Continuous scoring for each candle between the start and the end.
• SP – Signal period: Defines a range of candles within which a signal can score.
• SC - Signal count: Specifies the number of bars to retrospectively examine and score.
○ Single: Score for a single occurrence
○ All occurrences: Score for all occurrences
○ Single + Threshold: Score for single occurrences within the signal period (SP)
○ Every + Threshold: Score for all occurrences within the signal period (SP)
▢ Weight scoring direction
• ES: Enter Short weight
• XL: Exit long weight
• EL: Enter Long weight
• XS: Exit Short weight
▢ Weight scoring values
• Weights can hold either positive or negative scores. Positive weights enhance a particular trading direction, while negative weights diminish it.
█ MA - INDICATOR SETTINGS
■ Main settings
• Enable/Disable Indicator: Toggle the entire indicator on or off.
• T - Type: Choose a type of moving average. (ALMA, EMA, HMA, RMA, SMA, SWMA, VWMA, WMA)
• L - Length: Set a period on which the moving average is calculated.
• F - Filter: Set a conditional filter for scoring:
○ Line direction: Score bullish when the trend line is going up, score bearish when the trendline is going down.
○ Line candle position: Score bullish when the candles are above the current trendline, score bearish when the candles are below the current trendline
○ Any: Score if any of the previously mentioned conditions are true
○ All: Score if all of the previously mentioned conditions are true
• S - Source: Choose an alternative data source for the Moving average calculation.
• T - Timeframe: Select an alternative timeframe for the Moving average calculation.
• C - Candletype: Choose a candletype for the alternative source.
■ Scoring functionality
• For each moving average you'll be able to score Bullish, Bearish or Neutral for each of the conditions as mentioned in the filter above.
█ PLOTTING
• Standard: Symbols (EL, XS, ES, XL) Moving average lines are plotted with bearish, bullish and neutral zones, in the visuals section you can enable plotting by weight which will only show the parts of the moving average line to which weight is addressed.
• Conditional Settings: A larger icon appears if global conditions are met. For instance, with a Threshold(⥇) of 12, Signal Period (SP) of 3, and Scoring Condition (SC) set to "EVERY", a moving average signaling over two times in 3 candles (scoring 6 each) triggers a larger icon.
█ USAGE OF CONNECTABLE INDICATORS
■ Connectable chaining mechanism
Connectable indicators can be connected directly to the signal monitor, signal filter or strategy , or they can be daisy chained to each other while the last indicator in the chain connects to the signal monitor, signal filter or strategy. When using a signal filter you can chain the filter to the strategy input to make your chain complete.
• Direct chaining: Connect an indicator directly to the signal monitor, signal filter or strategy through the provided inputs (→).
• Daisy chaining: Connect indicators using the indicator input (→). The first in a daisy chain should have a flow (⌥) set to 'Indicator only'. Subsequent indicators use 'Both' to pass the previous weight. The final indicator connects to the signal monitor, signal filter, or strategy.
■ Set up this indicator with a signal filter and strategy
The indicator provides visual cues based on signal conditions. However, its weight system is best utilized when paired with a connectable signal filter, signal monitor, or strategy .
Let's connect the MA to a connectable signal filter and a strategy :
1. Load all relevant indicators
• Load MA / Connectable
• Load Signal filter / Connectable
• Load Strategy / Connectable
2. Signal Filter: Connect the MA to the Signal Filter
• Open the signal filter settings
• Choose one of the three input dropdowns (1→, 2→, 3→) and choose : MA / Connectable: Signal Connector
• Toggle the enable box before the connected input to enable the incoming signal
3. Signal Filter: Update the filter signals settings if needed
• The default settings of the filter enable EL (Enter Long), XL (Exit Long), ES (Enter Short) and XS (Exit Short).
4. Signal Filter: Update the weight threshold settings if needed
• All connectable indicators load by default with a score of 6 for each direction (EL, XL, ES, XS)
• By default, weight threshold (TH) is set at 5. This allows each occurrence to score, as the default score in each connectable indicator is 1 point above the threshold. Adjust to your liking.
5. Strategy: Connect the strategy to the signal filter in the strategy settings
• Select a strategy input → and select the Signal filter: Signal connector
6. Strategy: Enable filter compatible directions
• Set the signal mode of the strategy to a compatible direction with the signal filter.
Now that everything is connected, you'll notice green spikes in the signal filter representing long signals, and red spikes indicating short signals. Trades will also appear on the chart, complemented by a performance overview. Your journey is just beginning: delve into different scoring mechanisms, merge diverse connectable indicators, and craft unique chains. Instantly test your results and discover the potential of your configurations. Dive deep and enjoy the process!
█ BENEFITS
• Adaptable Modular Design: Arrange indicators in diverse structures via direct or daisy chaining, allowing tailored configurations to align with your analysis approach.
• Streamlined Backtesting: Simplify the iterative process of testing and adjusting combinations, facilitating a smoother exploration of potential setups.
• Intuitive Interface: Navigate TradingView with added ease. Integrate desired indicators, adjust settings, and establish alerts without delving into complex code.
• Signal Weight Precision: Leverage granular weight allocation among signals, offering a deeper layer of customization in strategy formulation.
• Advanced Signal Filtering: Define entry and exit conditions with more clarity, granting an added layer of strategy precision.
• Clear Visual Feedback: Distinct visual signals and cues enhance the readability of charts, promoting informed decision-making.
• Standardized Defaults: Indicators are equipped with universally recognized preset settings, ensuring consistency in initial setups across different types like momentum or volatility.
• Reliability: Our indicators are meticulously developed to prevent repainting. We strictly adhere to TradingView's coding conventions, ensuring our code is both performant and clean.
█ COMPATIBLE INDICATORS
Each indicator that incorporates our open-source 'azLibConnector' library and adheres to our conventions can be effortlessly integrated and used as detailed above.
For clarity and recognition within the TradingView platform, we append the suffix ' / Connectable' to every compatible indicator.
█ COMMON MISTAKES, CLARIFICATIONS AND TIPS
• Removing an indicator from a chain: Deleting a linked indicator and confirming the "remove study tree" alert will also remove all underlying indicators in the object tree. Before removing one, disconnect the adjacent indicators and move it to the object stack's bottom.
• Point systems: The azLibConnector provides 500 points for each direction (EL: Enter long, XL: Exit long, ES: Enter short, XS: Exit short) Remember this cap when devising a point structure.
• Flow misconfiguration: In daisy chains the first indicator should always have a flow (⌥) setting of 'indicator only' while other indicator should have a flow (⌥) setting of 'both'.
• Hide attributes: As connectable indicators send through quite some information you'll notice all the arguments are taking up some screenwidth and cause some visual clutter. You can disable arguments in Chart Settings / Status line.
• Layout and abbreviations: To maintain a consistent structure, we use abbreviations for each input. While this may initially seem complex, you'll quickly become familiar with them. Each abbreviation is also explained in the inline tooltips.
• Inputs: Connecting a connectable indicator directly to the strategy delivers the raw signal without a weight threshold, meaning every signal will trigger a trade.
█ A NOTE OF GRATITUDE
Through years of exploring TradingView and Pine Script, we've drawn immense inspiration from the community's knowledge and innovation. Thank you for being a constant source of motivation and insight.
█ RISK DISCLAIMER
Azullian's content, tools, scripts, articles, and educational offerings are presented purely for educational and informational uses. Please be aware that past performance should not be considered a predictor of future results.

KDJ / Connectable [Azullian]Enhance your analysis with our KDJ. Oscillate through buying and selling signals seamlessly, identifying potential reversals with accuracy.
This connectable KDJ indicator is part of an indicator system designed to help test, visualize and build strategy configurations without coding. Like all connectable indicators , it interacts through the TradingView input source, which serves as a signal connector to link indicators to each other. All connectable indicators send signal weight to the next node in the system until it reaches either a connectable signal monitor, signal filter and/or strategy.
█ UNIFORM SETTINGS AND A WAY OF WORK
Although connectable indicators may have specific weight scoring conditions, they all aim to follow a standardized general approach to weight scoring settings, as outlined below.
■ Connectable indicators - Settings
• 🗲 Energy: Energy applies an ATR multiplier to the plotted shapes on the chart. A higher value plots shapes farther away from the candle, enhancing visibility.
• ☼ Brightness: Brightness determines the opacity of the shape plotted on the chart, aiding visibility. Indicator weight also influences opacity.
• → Input: Use the input setting to specify a data source for the indicator. Here you can connect the indicator to other indicators.
• ⌥ Flow: Determine where you want to receive signals from:
○ Both: Weights from this indicator and the connected indicator will apply
○ Indicator only: Only weights from this indicator will apply
○ Input only: Only weights from the connected indicator will apply
• ⥅ Weight multiplier: Multiply all weights in the entire indicator by a given factor, useful for quickly testing different indicators in a granular setup.
• ⥇ Threshold: Set a threshold to indicate the minimum amount of weight it should receive to pass it through to the next indicator.
• ⥱ Limiter: Set a hard limit to the maximum amount of weight that can be fed through the indicator.
■ Connectable indicators - Weight scoring settings
▢ Weight scoring conditions
• SM – Signal mode: Enable specific conditions for weight scoring
○ All: All signals will be scored.
○ Entries only: Only entries will score.
○ Exits only: Only exits will score.
○ Entries & exits: Both entries and exits will score.
○ Zone: Continuous scoring for each candle within the zone.
• SP – Signal period: Defines a range of candles within which a signal can score.
• SC - Signal count: Specifies the number of bars to retrospectively examine and score.
○ Single: Score for a single occurrence
○ All occurrences: Score for all occurrences
○ Single + Threshold: Score for single occurrences within the signal period (SP)
○ Every + Threshold: Score for all occurrences within the signal period (SP)
▢ Weight scoring direction
• ES: Enter Short weight
• XL: Exit long weight
• EL: Enter Long weight
• XS: Exit Short weight
▢ Weight scoring values
• Weights can hold either positive or negative scores. Positive weights enhance a particular trading direction, while negative weights diminish it.
█ KDJ - INDICATOR SETTINGS
■ Main settings
• Enable/Disable Indicator: Toggle the entire indicator on or off.
• S - Source: Choose an alternative data source for the KDJ calculation.
• T - Timeframe: Select an alternative timeframe for the KDJ calculation.
• P - Period: Define the number of bars or periods used in the KDJ calculation.
• SL - Signal line: Adjust the smoothing factor for the KDJ's J line. This not only offers clearer buy/sell cues by reducing market noise but also determines the precise points for potential crossovers and crossunders.
■ Scoring functionality
• The KDJ scores long entries when the J line crosses over the signal (SL) line.
• The KDJ scores long exits when the J line crosses under the signal (SL) line after a prior crossover.
• The KDJ scores long zones the entire time the J line is above the signal (SL) line.
• The KDJ scores short entries when the J line crosses under the signal (SL) line.
• The KDJ scores short exits when the J line crosses over the signal (SL) line after a prior crossunder.
• The KDJ scores short zones the entire time the J line is below the signal (SL) line.
█ PLOTTING
• Standard: Symbols (EL, XS, ES, XL) appear relative to candles based on set conditions. Their opacity and position vary with weight.
• Conditional Settings: A larger icon appears if global conditions are met. For instance, with a Threshold(⥇) of 12, Signal Period (SP) of 3, and Scoring Condition (SC) set to "EVERY", an KDJ signaling over two times in 3 candles (scoring 6 each) triggers a larger icon.
█ USAGE OF CONNECTABLE INDICATORS
■ Connectable chaining mechanism
Connectable indicators can be connected directly to the signal monitor, signal filter or strategy , or they can be daisy chained to each other while the last indicator in the chain connects to the signal monitor, signal filter or strategy. When using a signal filter you can chain the filter to the strategy input to make your chain complete.
• Direct chaining: Connect an indicator directly to the signal monitor, signal filter or strategy through the provided inputs (→).
• Daisy chaining: Connect indicators using the indicator input (→). The first in a daisy chain should have a flow (⌥) set to 'Indicator only'. Subsequent indicators use 'Both' to pass the previous weight. The final indicator connects to the signal monitor, signal filter, or strategy.
■ Set up this indicator with a signal filter and strategy
The indicator provides visual cues based on signal conditions. However, its weight system is best utilized when paired with a connectable signal filter, signal monitor, or strategy .
Let's connect the KDJ to a connectable signal filter and a strategy :
1. Load all relevant indicators
• Load KDJ / Connectable
• Load Signal filter / Connectable
• Load Strategy / Connectable
2. Signal Filter: Connect the KDJ to the Signal Filter
• Open the signal filter settings
• Choose one of the three input dropdowns (1→, 2→, 3→) and choose : KDJ / Connectable: Signal Connector
• Toggle the enable box before the connected input to enable the incoming signal
3. Signal Filter: Update the filter signals settings if needed
• The default settings of the filter enable EL (Enter Long), XL (Exit Long), ES (Enter Short) and XS (Exit Short).
4. Signal Filter: Update the weight threshold settings if needed
• All connectable indicators load by default with a score of 6 for each direction (EL, XL, ES, XS)
• By default, weight threshold (TH) is set at 5. This allows each occurrence to score, as the default score in each connectable indicator is 1 point above the threshold. Adjust to your liking.
5. Strategy: Connect the strategy to the signal filter in the strategy settings
• Select a strategy input → and select the Signal filter: Signal connector
6. Strategy: Enable filter compatible directions
• Set the signal mode of the strategy to a compatible direction with the signal filter.
Now that everything is connected, you'll notice green spikes in the signal filter representing long signals, and red spikes indicating short signals. Trades will also appear on the chart, complemented by a performance overview. Your journey is just beginning: delve into different scoring mechanisms, merge diverse connectable indicators, and craft unique chains. Instantly test your results and discover the potential of your configurations. Dive deep and enjoy the process!
█ BENEFITS
• Adaptable Modular Design: Arrange indicators in diverse structures via direct or daisy chaining, allowing tailored configurations to align with your analysis approach.
• Streamlined Backtesting: Simplify the iterative process of testing and adjusting combinations, facilitating a smoother exploration of potential setups.
• Intuitive Interface: Navigate TradingView with added ease. Integrate desired indicators, adjust settings, and establish alerts without delving into complex code.
• Signal Weight Precision: Leverage granular weight allocation among signals, offering a deeper layer of customization in strategy formulation.
• Advanced Signal Filtering: Define entry and exit conditions with more clarity, granting an added layer of strategy precision.
• Clear Visual Feedback: Distinct visual signals and cues enhance the readability of charts, promoting informed decision-making.
• Standardized Defaults: Indicators are equipped with universally recognized preset settings, ensuring consistency in initial setups across different types like momentum or volatility.
• Reliability: Our indicators are meticulously developed to prevent repainting. We strictly adhere to TradingView's coding conventions, ensuring our code is both performant and clean.
█ COMPATIBLE INDICATORS
Each indicator that incorporates our open-source 'azLibConnector' library and adheres to our conventions can be effortlessly integrated and used as detailed above.
For clarity and recognition within the TradingView platform, we append the suffix ' / Connectable' to every compatible indicator.
█ COMMON MISTAKES, CLARIFICATIONS AND TIPS
• Removing an indicator from a chain: Deleting a linked indicator and confirming the "remove study tree" alert will also remove all underlying indicators in the object tree. Before removing one, disconnect the adjacent indicators and move it to the object stack's bottom.
• Point systems: The azLibConnector provides 500 points for each direction (EL: Enter long, XL: Exit long, ES: Enter short, XS: Exit short) Remember this cap when devising a point structure.
• Flow misconfiguration: In daisy chains the first indicator should always have a flow (⌥) setting of 'indicator only' while other indicator should have a flow (⌥) setting of 'both'.
• Hide attributes: As connectable indicators send through quite some information you'll notice all the arguments are taking up some screenwidth and cause some visual clutter. You can disable arguments in Chart Settings / Status line.
• Layout and abbreviations: To maintain a consistent structure, we use abbreviations for each input. While this may initially seem complex, you'll quickly become familiar with them. Each abbreviation is also explained in the inline tooltips.
• Inputs: Connecting a connectable indicator directly to the strategy delivers the raw signal without a weight threshold, meaning every signal will trigger a trade.
█ A NOTE OF GRATITUDE
Through years of exploring TradingView and Pine Script, we've drawn immense inspiration from the community's knowledge and innovation. Thank you for being a constant source of motivation and insight.
█ RISK DISCLAIMER
Azullian's content, tools, scripts, articles, and educational offerings are presented purely for educational and informational uses. Please be aware that past performance should not be considered a predictor of future results.

Donchian channels / Connectable [Azullian]Refine your breakout trading techniques with Donchian Channels. Accurately pinpoint significant highs and lows, enhancing your capacity to detect and react to key market movements.
This connectable Donchian channels indicator is part of an indicator system designed to help test, visualize and build strategy configurations without coding. Like all connectable indicators , it interacts through the TradingView input source, which serves as a signal connector to link indicators to each other. All connectable indicators send signal weight to the next node in the system until it reaches either a connectable signal monitor, signal filter and/or strategy.
█ UNIFORM SETTINGS AND A WAY OF WORK
Although connectable indicators may have specific weight scoring conditions, they all aim to follow a standardized general approach to weight scoring settings, as outlined below.
■ Connectable indicators - Settings
• 🗲 Energy: Energy applies an ATR multiplier to the plotted shapes on the chart. A higher value plots shapes farther away from the candle, enhancing visibility.
• ☼ Brightness: Brightness determines the opacity of the shape plotted on the chart, aiding visibility. Indicator weight also influences opacity.
• → Input: Use the input setting to specify a data source for the indicator. Here you can connect the indicator to other indicators.
• ⌥ Flow: Determine where you want to receive signals from:
○ Both: Weights from this indicator and the connected indicator will apply
○ Indicator only: Only weights from this indicator will apply
○ Input only: Only weights from the connected indicator will apply
• ⥅ Weight multiplier: Multiply all weights in the entire indicator by a given factor, useful for quickly testing different indicators in a granular setup.
• ⥇ Threshold: Set a threshold to indicate the minimum amount of weight it should receive to pass it through to the next indicator.
• ⥱ Limiter: Set a hard limit to the maximum amount of weight that can be fed through the indicator.
■ Connectable indicators - Weight scoring settings
▢ Weight scoring conditions
• SM – Signal mode: Enable specific conditions for weight scoring
○ All: All signals will be scored.
○ Entries only: Only entries will score
○ Exits only: Only exits will score.
○ Entries & exits: Both entries and exits will score.
○ Zone: Continuous scoring for each candle within the zone.
• SP – Signal period: Defines a range of candles within which a signal can score.
• SC - Signal count: Specifies the number of bars to retrospectively examine and score.
○ Single: Score for a single occurrence
○ All occurrences: Score for all occurrences
○ Single + Threshold: Score for single occurrences within the signal period (SP)
○ Every + Threshold: Score for all occurrences within the signal period (SP)
▢ Weight scoring direction
• ES: Enter Short weight
• XL: Exit long weight
• EL: Enter Long weight
• XS: Exit Short weight
▢ Weight scoring values
• Weights can hold either positive or negative scores. Positive weights enhance a particular trading direction, while negative weights diminish it.
█ Donchian channels - INDICATOR SETTINGS
■ Main settings
• Enable/Disable Indicator: Toggle the entire indicator on or off.
• S - Source: Choose an alternative data source for the Donchian channels calculation.
• T - Timeframe: Select an alternative timeframe for the Donchian channels calculation.
• LE - Length: Determine the period the Donchian channels are calculated on
• Enable/Disable plotting: Toggle the plotting of the Donchian channels
• U: Choose a color for the upper band
• B: Choose a color for the basis
• L: Choose a color for the lower band
• BG: Choose a color for Donchian channels background
■ Scoring functionality
• The Donchian channels score long entries when the current low price is equal to lower band.
• The Donchian channels score long exits when the current high price is equal to the upper band.
• The Donchian channels score long zones the entire time the current low price is equal to the lower band.
• The Donchian channels score short entries when the current high is equal to the upper band.
• The Donchian channels score short exits when the current low is equal to the lower band.
• The Donchian channels score short zones the entire time the current high price is equal to the upper band.
█ PLOTTING
• Standard: Symbols (EL, XS, ES, XL) appear relative to candles based on set conditions. Their opacity and position vary with weight.
• Conditional Settings: A larger icon appears if global conditions are met. For instance, with a Threshold(⥇) of 12, Signal Period (SP) of 3, and Scoring Condition (SC) set to "EVERY", a Donchian channels signaling over two times in 3 candles (scoring 6 each) triggers a larger icon.
█ USAGE OF CONNECTABLE INDICATORS
■ Connectable chaining mechanism
Connectable indicators can be connected directly to the signal monitor, signal filter or strategy , or they can be daisy chained to each other while the last indicator in the chain connects to the signal monitor, signal filter or strategy. When using a signal filter you can chain the filter to the strategy input to make your chain complete.
• Direct chaining: Connect an indicator directly to the signal monitor, signal filter or strategy through the provided inputs (→).
• Daisy chaining: Connect indicators using the indicator input (→). The first in a daisy chain should have a flow (⌥) set to 'Indicator only'. Subsequent indicators use 'Both' to pass the previous weight. The final indicator connects to the signal monitor, signal filter, or strategy.
■ Set up this indicator with a signal filter and strategy
The indicator provides visual cues based on signal conditions. However, its weight system is best utilized when paired with a connectable signal filter, signal monitor, or strategy .
Let's connect the Donchian channels to a connectable signal filter and a strategy :
1. Load all relevant indicators
• Load Donchian channels / Connectable
• Load Signal filter / Connectable
• Load Strategy / Connectable
2. Signal Filter: Connect the Donchian channels to the Signal Filter
• Open the signal filter settings
• Choose one of the three input dropdowns (1→, 2→, 3→) and choose : Donchian channels / Connectable: Signal Connector
• Toggle the enable box before the connected input to enable the incoming signal
3. Signal Filter: Update the filter signals settings if needed
• The default settings of the filter enable EL (Enter Long), XL (Exit Long), ES (Enter Short) and XS (Exit Short).
4. Signal Filter: Update the weight threshold settings if needed
• All connectable indicators load by default with a score of 6 for each direction (EL, XL, ES, XS)
• By default, weight threshold (TH) is set at 5. This allows each occurrence to score, as the default score in each connectable indicator is 1 point above the threshold. Adjust to your liking.
5. Strategy: Connect the strategy to the signal filter in the strategy settings
• Select a strategy input → and select the Signal filter: Signal connector
6. Strategy: Enable filter compatible directions
• Set the signal mode of the strategy to a compatible direction with the signal filter.
Now that everything is connected, you'll notice green spikes in the signal filter representing long signals, and red spikes indicating short signals. Trades will also appear on the chart, complemented by a performance overview. Your journey is just beginning: delve into different scoring mechanisms, merge diverse connectable indicators, and craft unique chains. Instantly test your results and discover the potential of your configurations. Dive deep and enjoy the process!
█ BENEFITS
• Adaptable Modular Design: Arrange indicators in diverse structures via direct or daisy chaining, allowing tailored configurations to align with your analysis approach.
• Streamlined Backtesting: Simplify the iterative process of testing and adjusting combinations, facilitating a smoother exploration of potential setups.
• Intuitive Interface: Navigate TradingView with added ease. Integrate desired indicators, adjust settings, and establish alerts without delving into complex code.
• Signal Weight Precision: Leverage granular weight allocation among signals, offering a deeper layer of customization in strategy formulation.
• Advanced Signal Filtering: Define entry and exit conditions with more clarity, granting an added layer of strategy precision.
• Clear Visual Feedback: Distinct visual signals and cues enhance the readability of charts, promoting informed decision-making.
• Standardized Defaults: Indicators are equipped with universally recognized preset settings, ensuring consistency in initial setups across different types like momentum or volatility.
• Reliability: Our indicators are meticulously developed to prevent repainting. We strictly adhere to TradingView's coding conventions, ensuring our code is both performant and clean.
█ COMPATIBLE INDICATORS
Each indicator that incorporates our open-source 'azLibConnector' library and adheres to our conventions can be effortlessly integrated and used as detailed above.
For clarity and recognition within the TradingView platform, we append the suffix ' / Connectable' to every compatible indicator.
█ COMMON MISTAKES, CLARIFICATIONS AND TIPS
• Removing an indicator from a chain: Deleting a linked indicator and confirming the "remove study tree" alert will also remove all underlying indicators in the object tree. Before removing one, disconnect the adjacent indicators and move it to the object stack's bottom.
• Point systems: The azLibConnector provides 500 points for each direction (EL: Enter long, XL: Exit long, ES: Enter short, XS: Exit short) Remember this cap when devising a point structure.
• Flow misconfiguration: In daisy chains the first indicator should always have a flow (⌥) setting of 'indicator only' while other indicator should have a flow (⌥) setting of 'both'.
• Hide attributes: As connectable indicators send through quite some information you'll notice all the arguments are taking up some screenwidth and cause some visual clutter. You can disable arguments in Chart Settings / Status line.
• Layout and abbreviations: To maintain a consistent structure, we use abbreviations for each input. While this may initially seem complex, you'll quickly become familiar with them. Each abbreviation is also explained in the inline tooltips.
• Inputs: Connecting a connectable indicator directly to the strategy delivers the raw signal without a weight threshold, meaning every signal will trigger a trade.
█ A NOTE OF GRATITUDE
Through years of exploring TradingView and Pine Script, we've drawn immense inspiration from the community's knowledge and innovation. Thank you for being a constant source of motivation and insight.
█ RISK DISCLAIMER
Azullian's content, tools, scripts, articles, and educational offerings are presented purely for educational and informational uses. Please be aware that past performance should not be considered a predictor of future results.
CCI / Connectable [Azullian]Sharpen your analysis of market trends with the CCI indicator. Effectively evaluate market cycles and identify potential reversals, enriching your strategic planning.
This connectable CCI indicator is part of an indicator system designed to help test, visualize and build strategy configurations without coding. Like all connectable indicators , it interacts through the TradingView input source, which serves as a signal connector to link indicators to each other. All connectable indicators send signal weight to the next node in the system until it reaches either a connectable signal monitor, signal filter and/or strategy.
█ UNIFORM SETTINGS AND A WAY OF WORK
Although connectable indicators may have specific weight scoring conditions, they all aim to follow a standardized general approach to weight scoring settings, as outlined below.
■ Connectable indicators - Settings
• 🗲 Energy: Energy applies an ATR multiplier to the plotted shapes on the chart. A higher value plots shapes farther away from the candle, enhancing visibility.
• ☼ Brightness: Brightness determines the opacity of the shape plotted on the chart, aiding visibility. Indicator weight also influences opacity.
• → Input: Use the input setting to specify a data source for the indicator. Here you can connect the indicator to other indicators.
• ⌥ Flow: Determine where you want to receive signals from:
○ Both: Weights from this indicator and the connected indicator will apply
○ Indicator only: Only weights from this indicator will apply
○ Input only: Only weights from the connected indicator will apply
• ⥅ Weight multiplier: Multiply all weights in the entire indicator by a given factor, useful for quickly testing different indicators in a granular setup.
• ⥇ Threshold: Set a threshold to indicate the minimum amount of weight it should receive to pass it through to the next indicator.
• ⥱ Limiter: Set a hard limit to the maximum amount of weight that can be fed through the indicator.
■ Connectable indicators - Weight scoring settings
▢ Weight scoring conditions
• SM – Signal mode: Enable specific conditions for weight scoring
○ All: All signals will be scored.
○ Entries only: Only entries will score.
○ Exits only: Only exits will score.
○ Entries & exits: Both entries and exits will score.
○ Zone: Continuous scoring for each candle within the zone.
• SP – Signal period: Defines a range of candles within which a signal can score.
• SC - Signal count: Specifies the number of bars to retrospectively examine and score.
○ Single: Score for a single occurrence
○ All occurrences: Score for all occurrences
○ Single + Threshold: Score for single occurrences within the signal period (SP)
○ Every + Threshold: Score for all occurrences within the signal period (SP)
▢ Weight scoring direction
• ES: Enter Short weight
• XL: Exit long weight
• EL: Enter Long weight
• XS: Exit Short weight
▢ Weight scoring values
• Weights can hold either positive or negative scores. Positive weights enhance a particular trading direction, while negative weights diminish it.
█ CCI - INDICATOR SETTINGS
■ Main settings
• Enable/Disable Indicator: Toggle the entire indicator on or off.
• S - Source: Choose an alternative data source for the CCI calculation.
• T - Timeframe: Select an alternative timeframe for the CCI calculation.
• LE - Length: Define the number of bars or periods used in the CCI calculation.
• OB - Overbought Level: Determine the CCI value at which overbought conditions are met.
• OS - Oversold Level: Specify the CCI value at which oversold conditions are met.
■ Scoring functionality
• The CCI scores long entries when the CCI enters OS: oversold area
• The CCI scores long exits when the CCI exits OS: oversold area
• The CCI scores long zones the entire time the CCI is in OS: oversold area
• The CCI scores short entries when the CCI enters OB: overbought area
• The CCI scores short exits when the CCI exits OB: overbought area
• The CCI scores short zones the entire time the CCI is in OB: overbought area
█ PLOTTING
• Standard: Symbols (EL, XS, ES, XL) appear relative to candles based on set conditions. Their opacity and position vary with weight.
• Conditional Settings: A larger icon appears if global conditions are met. For instance, with a Threshold(⥇) of 12, Signal Period (SP) of 3, and Scoring Condition (SC) set to "EVERY", an CCI signaling over two times in 3 candles (scoring 6 each) triggers a larger icon.
█ USAGE OF CONNECTABLE INDICATORS
■ Connectable chaining mechanism
Connectable indicators can be connected directly to the signal monitor, signal filter or strategy , or they can be daisy chained to each other while the last indicator in the chain connects to the signal monitor, signal filter or strategy. When using a signal filter you can chain the filter to the strategy input to make your chain complete.
• Direct chaining: Connect an indicator directly to the signal monitor, signal filter or strategy through the provided inputs (→).
• Daisy chaining: Connect indicators using the indicator input (→). The first in a daisy chain should have a flow (⌥) set to 'Indicator only'. Subsequent indicators use 'Both' to pass the previous weight. The final indicator connects to the signal monitor, signal filter, or strategy.
■ Set up this indicator with a signal filter and strategy
The indicator provides visual cues based on signal conditions. However, its weight system is best utilized when paired with a connectable signal filter, monitor, or strategy .
Let's connect the CCI to a connectable signal filter and a strategy :
1. Load all relevant indicators
• Load CCI / Connectable
• Load Signal filter / Connectable
• Load Strategy / Connectable
2. Signal Filter: Connect the CCI to the Signal Filter
• Open the signal filter settings
• Choose one of the three input dropdowns (1→, 2→, 3→) and choose : CCI / Connectable: Signal Connector
• Toggle the enable box before the connected input to enable the incoming signal
3. Signal Filter: Update the filter signals settings if needed
• The default settings of the filter enable EL (Enter Long), XL (Exit Long), ES (Enter Short) and XS (Exit Short).
4. Signal Filter: Update the weight threshold settings if needed
• All connectable indicators load by default with a score of 6 for each direction (EL, XL, ES, XS)
• By default, weight threshold (TH) is set at 5. This allows each occurrence to score, as the default score in each connectable indicator is 1 point above the threshold. Adjust to your liking.
5. Strategy: Connect the strategy to the signal filter in the strategy settings
• Select a strategy input → and select the Signal filter: Signal connector
6. Strategy: Enable filter compatible directions
• Set the signal mode of the strategy to a compatible direction with the signal filter.
Now that everything is connected, you'll notice green spikes in the signal filter representing long signals, and red spikes indicating short signals. Trades will also appear on the chart, complemented by a performance overview. Your journey is just beginning: delve into different scoring mechanisms, merge diverse connectable indicators, and craft unique chains. Instantly test your results and discover the potential of your configurations. Dive deep and enjoy the process!
█ BENEFITS
• Adaptable Modular Design: Arrange indicators in diverse structures via direct or daisy chaining, allowing tailored configurations to align with your analysis approach.
• Streamlined Backtesting: Simplify the iterative process of testing and adjusting combinations, facilitating a smoother exploration of potential setups.
• Intuitive Interface: Navigate TradingView with added ease. Integrate desired indicators, adjust settings, and establish alerts without delving into complex code.
• Signal Weight Precision: Leverage granular weight allocation among signals, offering a deeper layer of customization in strategy formulation.
• Advanced Signal Filtering: Define entry and exit conditions with more clarity, granting an added layer of strategy precision.
• Clear Visual Feedback: Distinct visual signals and cues enhance the readability of charts, promoting informed decision-making.
• Standardized Defaults: Indicators are equipped with universally recognized preset settings, ensuring consistency in initial setups across different types like momentum or volatility.
• Reliability: Our indicators are meticulously developed to prevent repainting. We strictly adhere to TradingView's coding conventions, ensuring our code is both performant and clean.
█ COMPATIBLE INDICATORS
Each indicator that incorporates our open-source 'azLibConnector' library and adheres to our conventions can be effortlessly integrated and used as detailed above.
For clarity and recognition within the TradingView platform, we append the suffix ' / Connectable' to every compatible indicator.
█ COMMON MISTAKES, CLARIFICATIONS AND TIPS
• Removing an indicator from a chain: Deleting a linked indicator and confirming the "remove study tree" alert will also remove all underlying indicators in the object tree. Before removing one, disconnect the adjacent indicators and move it to the object stack's bottom.
• Point systems: The azLibConnector provides 500 points for each direction (EL: Enter long, XL: Exit long, ES: Enter short, XS: Exit short) Remember this cap when devising a point structure.
• Flow misconfiguration: In daisy chains the first indicator should always have a flow (⌥) setting of 'indicator only' while other indicator should have a flow (⌥) setting of 'both'.
• Hide attributes: As connectable indicators send through quite some information you'll notice all the arguments are taking up some screenwidth and cause some visual clutter. You can disable arguments in Chart Settings / Status line.
• Layout and abbreviations: To maintain a consistent structure, we use abbreviations for each input. While this may initially seem complex, you'll quickly become familiar with them. Each abbreviation is also explained in the inline tooltips.
• Inputs: Connecting a connectable indicator directly to the strategy delivers the raw signal without a weight threshold, meaning every signal will trigger a trade.
█ A NOTE OF GRATITUDE
Through years of exploring TradingView and Pine Script, we've drawn immense inspiration from the community's knowledge and innovation. Thank you for being a constant source of motivation and insight.
█ RISK DISCLAIMER
Azullian's content, tools, scripts, articles, and educational offerings are presented purely for educational and informational uses. Please be aware that past performance should not be considered a predictor of future results.

Bollinger bands / Connectable [Azullian]Deepen your understanding of market volatility using Bollinger Bands. This tool helps in discerning price movements and volatility trends, essential for crafting effective strategies.
This connectable Bollinger bands indicator is part of an indicator system designed to help test, visualize and build strategy configurations without coding. Like all connectable indicators , it interacts through the TradingView input source, which serves as a signal connector to link indicators to each other. All connectable indicators send signal weight to the next node in the system until it reaches either a connectable signal monitor, signal filter and/or strategy.
█ UNIFORM SETTINGS AND A WAY OF WORK
Although connectable indicators may have specific weight scoring conditions, they all aim to follow a standardized general approach to weight scoring settings, as outlined below.
■ Connectable indicators - Settings
• 🗲 Energy: Energy applies an ATR multiplier to the plotted shapes on the chart. A higher value plots shapes farther away from the candle, enhancing visibility.
• ☼ Brightness: Brightness determines the opacity of the shape plotted on the chart, aiding visibility. Indicator weight also influences opacity.
• → Input: Use the input setting to specify a data source for the indicator. Here you can connect the indicator to other indicators.
• ⌥ Flow: Determine where you want to receive signals from:
○ Both: Weights from this indicator and the connected indicator will apply
○ Indicator only: Only weights from this indicator will apply
○ Input only: Only weights from the connected indicator will apply
• ⥅ Weight multiplier: Multiply all weights in the entire indicator by a given factor, useful for quickly testing different indicators in a granular setup.
• ⥇ Threshold: Set a threshold to indicate the minimum amount of weight it should receive to pass it through to the next indicator.
• ⥱ Limiter: Set a hard limit to the maximum amount of weight that can be fed through the indicator.
■ Connectable indicators - Weight scoring settings
▢ Weight scoring conditions
• SM – Signal mode: Enable specific conditions for weight scoring
○ All: All signals will be scored.
○ Entries only: Only entries will score
○ Exits only: Only exits will score.
○ Entries & exits: Both entries and exits will score.
○ Zone: Continuous scoring for each candle within the zone.
• SP – Signal period: Defines a range of candles within which a signal can score.
• SC - Signal count: Specifies the number of bars to retrospectively examine and score.
○ Single: Score for a single occurrence
○ All occurrences: Score for all occurrences
○ Single + Threshold: Score for single occurrences within the signal period (SP)
○ Every + Threshold: Score for all occurrences within the signal period (SP)
▢ Weight scoring direction
• ES: Enter Short weight
• XL: Exit long weight
• EL: Enter Long weight
• XS: Exit Short weight
▢ Weight scoring values
• Weights can hold either positive or negative scores. Positive weights enhance a particular trading direction, while negative weights diminish it.
█ Bollinger bands - INDICATOR SETTINGS
■ Main settings
• Enable/Disable Indicator: Toggle the entire indicator on or off.
• S - Source: Choose an alternative data source for the Bollinger bands calculation.
• T - Timeframe: Select an alternative timeframe for the Bollinger bands calculation.
• LE - Length: Determine the period the bollinger bands are calculated on
• SD - Standard deviation: Determine the standard deviation for the bollinger bands.
• Enable/Disable plotting: Toggle the plotting of the Bollinger bands
• U: Choose a color for the upper band
• B: Choose a color for the basis
• L: Choose a color for the lower band
• BG: Choose a color for Bollinger bands background
■ Scoring functionality
• The Bollinger bands score long entries when the current low price is smaller than the lower band.
• The Bollinger bands score long exits when the current high price is higher than the upper band.
• The Bollinger bands score long zones the entire time the current low price is smaller than the lower band.
• The Bollinger bands score short entries when the current high is higher than the upper band.
• The Bollinger bands score short exits when the current low is smaller than the lower band.
• The Bollinger bands score short zones the entire time the current high price is higher than the upper band.
█ PLOTTING
• Standard: Symbols (EL, XS, ES, XL) appear relative to candles based on set conditions. Their opacity and position vary with weight.
• Conditional Settings: A larger icon appears if global conditions are met. For instance, with a Threshold(⥇) of 12, Signal Period (SP) of 3, and Scoring Condition (SC) set to "EVERY", a Bollinger bands signaling over two times in 3 candles (scoring 6 each) triggers a larger icon.
█ USAGE OF CONNECTABLE INDICATORS
■ Connectable chaining mechanism
Connectable indicators can be connected directly to the signal monitor, signal filter or strategy , or they can be daisy chained to each other while the last indicator in the chain connects to the signal monitor, signal filter or strategy. When using a signal filter you can chain the filter to the strategy input to make your chain complete.
• Direct chaining: Connect an indicator directly to the signal monitor, signal filter or strategy through the provided inputs (→).
• Daisy chaining: Connect indicators using the indicator input (→). The first in a daisy chain should have a flow (⌥) set to 'Indicator only'. Subsequent indicators use 'Both' to pass the previous weight. The final indicator connects to the signal monitor, signal filter, or strategy.
■ Set up this indicator with a signal filter and strategy
The indicator provides visual cues based on signal conditions. However, its weight system is best utilized when paired with a connectable signal filter, signal monitor, and/or strategy .
Let's connect the Bollinger bands to a connectable signal filter and a strategy :
1. Load all relevant indicators
• Load Bollinger bands / Connectable
• Load Signal filter / Connectable
• Load Strategy / Connectable
2. Signal Filter: Connect the Bollinger bands to the Signal Filter
• Open the signal filter settings
• Choose one of the three input dropdowns (1→, 2→, 3→) and choose : Bollinger bands / Connectable: Signal Connector
• Toggle the enable box before the connected input to enable the incoming signal
3. Signal Filter: Update the filter signals settings if needed
• The default settings of the filter enable EL (Enter Long), XL (Exit Long), ES (Enter Short) and XS (Exit Short).
4. Signal Filter: Update the weight threshold settings if needed
• All connectable indicators load by default with a score of 6 for each direction (EL, XL, ES, XS)
• By default, weight threshold (TH) is set at 5. This allows each occurrence to score, as the default score in each connectable indicator is 1 point above the threshold. Adjust to your liking.
5. Strategy: Connect the strategy to the signal filter in the strategy settings
• Select a strategy input → and select the Signal filter: Signal connector
6. Strategy: Enable filter compatible directions
• Set the signal mode of the strategy to a compatible direction with the signal filter.
Now that everything is connected, you'll notice green spikes in the signal filter representing long signals, and red spikes indicating short signals. Trades will also appear on the chart, complemented by a performance overview. Your journey is just beginning: delve into different scoring mechanisms, merge diverse connectable indicators, and craft unique chains. Instantly test your results and discover the potential of your configurations. Dive deep and enjoy the process!
█ BENEFITS
• Adaptable Modular Design: Arrange indicators in diverse structures via direct or daisy chaining, allowing tailored configurations to align with your analysis approach.
• Streamlined Backtesting: Simplify the iterative process of testing and adjusting combinations, facilitating a smoother exploration of potential setups.
• Intuitive Interface: Navigate TradingView with added ease. Integrate desired indicators, adjust settings, and establish alerts without delving into complex code.
• Signal Weight Precision: Leverage granular weight allocation among signals, offering a deeper layer of customization in strategy formulation.
• Advanced Signal Filtering: Define entry and exit conditions with more clarity, granting an added layer of strategy precision.
• Clear Visual Feedback: Distinct visual signals and cues enhance the readability of charts, promoting informed decision-making.
• Standardized Defaults: Indicators are equipped with universally recognized preset settings, ensuring consistency in initial setups across different types like momentum or volatility.
• Reliability: Our indicators are meticulously developed to prevent repainting. We strictly adhere to TradingView's coding conventions, ensuring our code is both performant and clean.
█ COMPATIBLE INDICATORS
Each indicator that incorporates our open-source 'azLibConnector' library and adheres to our conventions can be effortlessly integrated and used as detailed above.
For clarity and recognition within the TradingView platform, we append the suffix ' / Connectable' to every compatible indicator.
█ COMMON MISTAKES, CLARIFICATIONS AND TIPS
• Removing an indicator from a chain: Deleting a linked indicator and confirming the "remove study tree" alert will also remove all underlying indicators in the object tree. Before removing one, disconnect the adjacent indicators and move it to the object stack's bottom.
• Point systems: The azLibConnector provides 500 points for each direction (EL: Enter long, XL: Exit long, ES: Enter short, XS: Exit short) Remember this cap when devising a point structure.
• Flow misconfiguration: In daisy chains the first indicator should always have a flow (⌥) setting of 'indicator only' while other indicator should have a flow (⌥) setting of 'both'.
• Hide attributes: As connectable indicators send through quite some information you'll notice all the arguments are taking up some screenwidth and cause some visual clutter. You can disable arguments in Chart Settings / Status line.
• Layout and abbreviations: To maintain a consistent structure, we use abbreviations for each input. While this may initially seem complex, you'll quickly become familiar with them. Each abbreviation is also explained in the inline tooltips.
• Inputs: Connecting a connectable indicator directly to the strategy delivers the raw signal without a weight threshold, meaning every signal will trigger a trade.
█ A NOTE OF GRATITUDE
Through years of exploring TradingView and Pine Script, we've drawn immense inspiration from the community's knowledge and innovation. Thank you for being a constant source of motivation and insight.
█ RISK DISCLAIMER
Azullian's content, tools, scripts, articles, and educational offerings are presented purely for educational and informational uses. Please be aware that past performance should not be considered a predictor of future results.

ADX / Connectable [Azullian]
Streamline your strategy with the ADX indicator. Precisely analyze market strength and direction, integrating these insights for more adaptable trading decisions.
This connectable ADX indicator is part of an indicator system designed to help test, visualize and build strategy configurations without coding. Like all connectable indicators , it interacts through the TradingView input source, which serves as a signal connector to link indicators to each other. All connectable indicators send signal weight to the next node in the system until it reaches either a connectable signal monitor, signal filter and/or strategy.
█ UNIFORM SETTINGS AND A WAY OF WORK
Although connectable indicators may have specific weight scoring conditions, they all aim to follow a standardized general approach to weight scoring settings, as outlined below.
■ Connectable indicators - Settings
• 🗲 Energy: Energy applies an ATR multiplier to the plotted shapes on the chart. A higher value plots shapes farther away from the candle, enhancing visibility.
• ☼ Brightness: Brightness determines the opacity of the shape plotted on the chart, aiding visibility. Indicator weight also influences opacity.
• → Input: Use the input setting to specify a data source for the indicator. Here you can connect the indicator to other indicators.
• ⌥ Flow: Determine where you want to receive signals from:
○ Both: Weights from this indicator and the connected indicator will apply
○ Indicator only: Only weights from this indicator will apply
○ Input only: Only weights from the connected indicator will apply
• ⥅ Weight multiplier: Multiply all weights in the entire indicator by a given factor, useful for quickly testing different indicators in a granular setup.
• ⥇ Threshold: Set a threshold to indicate the minimum amount of weight it should receive to pass it through to the next indicator.
• ⥱ Limiter: Set a hard limit to the maximum amount of weight that can be fed through the indicator.
■ Connectable indicators - Weight scoring settings
▢ Weight scoring conditions
• SM – Signal mode: Enable specific conditions for weight scoring
○ All: All signals will be scored.
○ Entries only: Only entries will score
○ Exits only: Only exits will score.
○ Entries & exits: Both entries and exits will score.
○ Zone: Continuous scoring for each candle within the zone.
• SP – Signal period: Defines a range of candles within which a signal can score.
• SC - Signal count: Specifies the number of bars to retrospectively examine and score.
○ Single: Score for a single occurrence
○ All occurrences: Score for all occurrences
○ Single + Threshold: Score for single occurrences within the signal period (SP)
○ Every + Threshold: Score for all occurrences within the signal period (SP)
▢ Weight scoring direction
• ES: Enter Short weight
• XL: Exit long weight
• EL: Enter Long weight
• XS: Exit Short weight
▢ Weight scoring values
• Weights can hold either positive or negative scores. Positive weights enhance a particular trading direction, while negative weights diminish it.
█ ADX - INDICATOR SETTINGS
■ Main settings
• Enable/Disable Indicator: Toggle the entire indicator on or off.
• S - Source: Choose an alternative data source for the ADX calculation.
• T - Timeframe: Select an alternative timeframe for the ADX calculation.
• SM - Smoothing: Smooth the length averages.
• LE - DI Length: Determine the DI: Directional indicator length.
• TH - Trend threshold: Specify the level the ADX has to cross
• EM - Entry signal mode: Determine entry mode
○ DI: Use only DI+ and DI- crossings
○ DI + ADX: Use DI with increasing ADX
○ DI + ADX + Invert: Use DI with increasing ADX and DI with decreasing ADX
• XM - Exit signal mode: Determine exit mode
○ DI: Use DI crossing to exit
○ ADX: Use decreasing ADX to signal exit
■ Scoring functionality
• The ADX scores long entries when the ADX crosses the TH: Trend threshold and +DM is greater than -DM
• The ADX scores long exits when the ADX falls back below the TH: Trend threshold and +DM is greater than -DM
• The ADX scores long zones the entire time the ADX is above the TH: Trend threshold and +DM is greater than -DM
• The ADX scores short entries when the ADX crosses the TH: Trend threshold and +DM is smaller than -DM
• The ADX scores short exits when the ADX falls back below the TH: Trend threshold and +DM is smaller than -DM
• The ADX scores short zones the entire time the ADX is above the TH: Trend threshold and +DM is smaller than -DM
█ PLOTTING
• Standard: Symbols (EL, XS, ES, XL) appear relative to candles based on set conditions. Their opacity and position vary with weight.
• Conditional Settings: A larger icon appears if global conditions are met. For instance, with a Threshold(⥇) of 12, Signal Period (SP) of 3, and Scoring Condition (SC) set to "EVERY", an ADX signaling over two times in 3 candles (scoring 6 each) triggers a larger icon.
█ USAGE OF CONNECTABLE INDICATORS
■ Connectable chaining mechanism
Connectable indicators can be connected directly to the signal monitor, signal filter or strategy , or they can be daisy chained to each other while the last indicator in the chain connects to the signal monitor, signal filter or strategy. When using a signal filter you can chain the filter to the strategy input to make your chain complete.
• Direct chaining: Connect an indicator directly to the signal monitor, signal filter or strategy through the provided inputs (→).
• Daisy chaining: Connect indicators using the indicator input (→). The first in a daisy chain should have a flow (⌥) set to 'Indicator only'. Subsequent indicators use 'Both' to pass the previous weight. The final indicator connects to the signal monitor, signal filter and/or strategy.
■ Set up this indicator with a signal filter and strategy
The indicator provides visual cues based on signal conditions. However, its weight system is best utilized when paired with a connectable signal filter, signal monitor, and/or strategy .
Let's connect the ADX to a connectable signal filter and a strategy :
1. Load all relevant indicators
• Load ADX / Connectable
• Load Signal filter / Connectable
• Load Strategy / Connectable
2. Signal Filter: Connect the ADX to the Signal Filter
• Open the signal filter settings
• Choose one of the three input dropdowns (1→, 2→, 3→) and choose : ADX / Connectable: Signal Connector
• Toggle the enable box before the connected input to enable the incoming signal
3. Signal Filter: Update the filter signals settings if needed
• The default settings of the filter enable EL (Enter Long), XL (Exit Long), ES (Enter Short) and XS (Exit Short).
4. Signal Filter: Update the weight threshold settings if needed
• All connectable indicators load by default with a score of 6 for each direction (EL, XL, ES, XS)
• By default, weight threshold (TH) is set at 5. This allows each occurrence to score, as the default score in each connectable indicator is 1 point above the threshold. Adjust to your liking.
5. Strategy: Connect the strategy to the signal filter in the strategy settings
• Select a strategy input → and select the Signal filter: Signal connector
6. Strategy: Enable filter compatible directions
• Set the signal mode of the strategy to a compatible direction with the signal filter.
Now that everything is connected, you'll notice green spikes in the signal filter representing long signals, and red spikes indicating short signals. Trades will also appear on the chart, complemented by a performance overview. Your journey is just beginning: delve into different scoring mechanisms, merge diverse connectable indicators, and craft unique chains. Instantly test your results and discover the potential of your configurations. Dive deep and enjoy the process!
█ BENEFITS
• Adaptable Modular Design: Arrange indicators in diverse structures via direct or daisy chaining, allowing tailored configurations to align with your analysis approach.
• Streamlined Backtesting: Simplify the iterative process of testing and adjusting combinations, facilitating a smoother exploration of potential setups.
• Intuitive Interface: Navigate TradingView with added ease. Integrate desired indicators, adjust settings, and establish alerts without delving into complex code.
• Signal Weight Precision: Leverage granular weight allocation among signals, offering a deeper layer of customization in strategy formulation.
• Signal Filtering: Define entry and exit conditions with more clarity, granting an added layer of strategy precision.
• Clear Visual Feedback: Distinct visual signals and cues enhance the readability of charts, promoting informed decision-making.
• Standardized Defaults: Indicators are equipped with universally recognized preset settings, ensuring consistency in initial setups across different types like momentum or volatility.
• Reliability: Our indicators are meticulously developed to prevent repainting. We strictly adhere to TradingView's coding conventions, ensuring our code is both performant and clean.
█ COMPATIBLE INDICATORS
Each indicator that incorporates our open-source 'azLibConnector' library and adheres to our conventions can be effortlessly integrated and used as detailed above.
For clarity and recognition within the TradingView platform, we append the suffix ' / Connectable' to every compatible indicator.
█ COMMON MISTAKES, CLARIFICATIONS AND TIPS
• Removing an indicator from a chain: Deleting a linked indicator and confirming the "remove study tree" alert will also remove all underlying indicators in the object tree. Before removing one, disconnect the adjacent indicators and move it to the object stack's bottom.
• Point systems: The azLibConnector provides 500 points for each direction (EL: Enter long, XL: Exit long, ES: Enter short, XS: Exit short) Remember this cap when devising a point structure.
• Flow misconfiguration: In daisy chains the first indicator should always have a flow (⌥) setting of 'indicator only' while other indicator should have a flow (⌥) setting of 'both'.
• Hide attributes: As connectable indicators send through quite some information you'll notice all the arguments are taking up some screenwidth and cause some visual clutter. You can disable arguments in Chart Settings / Status line.
• Layout and abbreviations: To maintain a consistent structure, we use abbreviations for each input. While this may initially seem complex, you'll quickly become familiar with them. Each abbreviation is also explained in the inline tooltips.
• Inputs: Connecting a connectable indicator directly to the strategy delivers the raw signal without a weight threshold, meaning every signal will trigger a trade.
█ A NOTE OF GRATITUDE
Through years of exploring TradingView and Pine Script, we've drawn immense inspiration from the community's knowledge and innovation. Thank you for being a constant source of motivation and insight.
█ RISK DISCLAIMER
Azullian's content, tools, scripts, articles, and educational offerings are presented purely for educational and informational uses. Please be aware that past performance should not be considered a predictor of future results.

Previous Day High Low Strategy only for LongWelcome to the "Previous Day High Low Strategy only for Long"!.
This strategy aims to identify potential long trading opportunities based on the previous day's high and low prices, along with certain market strength conditions.
Key Features:
Entry Conditions: The strategy triggers a long position when the current day's closing price crosses above the previous day's high or low.
Market Strength Filter: The strategy incorporates a market strength filter using the Average Directional Index (ADX). It only takes long positions when the ADX value is above a specific threshold and when there is a predominance of upward movement.
Trade Timing: The strategy operates within a specified trade window, starting at 09:30 and ending at 15:10. Positions are closed at 15:15 if still active.
Risk Management: The strategy employs dynamic stop-loss and profit-taking levels based on a user-defined Max Profit value. It has three profit targets (T1, T2, T3) and a stop-loss level to manage risk effectively.
Rules:
Ensure that the strategy idea is clearly understandable. Provide an easy-to-read title and a thoughtful description explaining the reasoning behind the strategy.
All content should be ad-free. Avoid any form of promotion, advertising, or solicitation.
No fundraising requests or money solicitation is allowed on TradingView.
Publish in the same language as the TradingView subdomain you're on, except for script titles, which must be in English.
Don't plagiarize. Create and share only unique content, and always give credit when using someone else's work.
Be respectful, kind, and constructive when engaging with others.
Zero tolerance for contentious political discourse, defamatory, threatening, or discriminatory remarks.
Avoid sharing harmful, misleading, or inappropriate content.
Respect the moderators' work and address complaints privately.
Use only your original account and avoid creating duplicate or fake accounts.
Do not attempt to manipulate the reputation system or engage in like-for-like schemes.
Explanation of how the strategy works
1. Previous Day's High and Low (HH, LL):
In this strategy, we start by obtaining the high and low prices of the previous day (not the current day) using the request.security function. This function allows us to access historical data for a specific time frame. The high and low prices are stored in the variables HH and LL, respectively.
2. Entry Conditions:
The strategy uses two conditions to trigger a long position:
Condition 1 (Long Condition 1): If the closing price of the current day crosses above the previous day's high (HH), it generates a long signal. This is achieved using the ta.crossover function, which detects when a crossover occurs.
Condition 2 (Long Condition 2): Similarly, if the closing price of the current day crosses above the previous day's low (LL), it also generates a long signal.
Combined Condition: To take long positions, the strategy combines both long conditions using the logical OR operator (or). This means that if either of the two conditions is met, a long position will be initiated.
3. Market Strength Filter:
The strategy also includes a filter based on the Average Directional Index (ADX) to gauge the market's strength before taking long positions. The ADX measures the strength of a trend in the market. The higher the ADX value, the stronger the trend.
Calculation of ADX: The ADX is calculated using the adx function, which takes two parameters: LWdilength (DMI Length) and LWadxlength (ADX period).
Strength Condition (strength_up): The strategy requires that the ADX value should be above a threshold (11 in this case) and that there is a predominance of upward movement (up > down) before initiating a long position. The LWADX value is multiplied by 2.5 and compared to the highest value of LWADX from the last 4 periods using ta.highest(LWADX , 4). If these conditions are met, the variable strength_up is set to true.
Combined Condition: The strength_up condition is then combined with the long conditions using the logical AND operator (and). This means that the strategy will only take a long position if both the long conditions and the market strength condition are met.
4. Trade Timing:
The strategy sets a specific trade window between 09:30 and 15:10. It will only execute trades within this time frame (TradeTime).
5. Risk Management:
The strategy implements dynamic stop-loss (SL) and profit-taking levels (T1, T2, T3) based on a user-defined Max Profit value. The stop-loss is set as a percentage of the Max Profit value. As the position moves in favor of the trader, the profit targets are adjusted accordingly.
6. Position Management:
The strategy uses the strategy.entry function to enter long positions based on the combined entry conditions. Once a position is open, the script uses strategy.exit to define the exit condition when either the profit target or stop-loss level is hit. The strategy.close function is used to close any open position at the end of the trade window (15:15).
7. Plotting:
The strategy uses the plot function to visualize the previous day's high and low prices, as well as the stop-loss (SL) and profit-taking (T1, T2, T3) levels on the chart.
Overall, the "Previous Day High Low Strategy only for Long" aims to identify potential long trading opportunities based on the previous day's price action and market strength conditions. However, as with any trading strategy, it's essential to thoroughly test it and consider risk management before applying it to real-world trading scenarios.
Disclaimer:
The information presented by this strategy is for educational purposes only and should not be considered as investment advice. The strategy is not designed for qualified investors. Always conduct your own research and consult with a financial advisor before making any trading decisions.
Remember, the success of any trading strategy depends on various factors, including market conditions, risk management, and individual trading skills. Past performance is not indicative of future results.

Opening Range & Daily and Weekly PivotsThis script is for a combination of two indicators: an Opening Range Breakout (ORB) indicator and a daily/weekly high/low pivot indicator. The ORB indicator displays the opening range (the high and low of the first X minutes of the trading day, where X is a user-defined parameter) as two lines on the chart. If the price closes above the ORB high, the script triggers an alert with the message "Price has broken above the opening range." Similarly, if the price closes below the ORB low, the script triggers an alert with the message "Price has broken below the opening range."
The daily/weekly high/low pivot indicator plots the previous day's high and low as well as the previous week's high and low. If the current price closes above yesterday's high or last week's high, the script triggers an alert with the messages "We are now trading higher than the previous daily high" and "We are now trading higher than the last week high", respectively. If the current price closes below yesterday's low or last week's low, the script triggers an alert with the messages "We are now trading lower than the previous daily low" and "We are now trading lower than the last week low", respectively.
In addition to the visual representation on the chart, the script also triggers alerts when the price crosses any of these levels. These alerts are intended to help traders make decisions about entering or exiting trades based on the price action relative to key levels of support and resistance.
