Historical Volatility EstimatorsHistorical volatility is a statistical measure of the dispersion of returns for a given security or market index over a given period. This indicator provides different historical volatility model estimators with percentile gradient coloring and volatility stats panel.
█ OVERVIEW There are multiple ways to estimate historical volatility. Other than the traditional close-to-close estimator. This indicator provides different range-based volatility estimators that take high low open into account for volatility calculation and volatility estimators that use other statistics measurements instead of standard deviation. The gradient coloring and stats panel provides an overview of how high or low the current volatility is compared to its historical values.
█ CONCEPTS We have mentioned the concepts of historical volatility in our previous indicators, Historical Volatility, Historical Volatility Rank, and Historical Volatility Percentile. You can check the definition of these scripts. The basic calculation is just the sample standard deviation of log return scaled with the square root of time. The main focus of this script is the difference between volatility models.
Close-to-Close HV Estimator: Close-to-Close is the traditional historical volatility calculation. It uses sample standard deviation. Note: the TradingView build in historical volatility value is a bit off because it uses population standard deviation instead of sample deviation. N – 1 should be used here to get rid of the sampling bias.
Pros:
• Close-to-Close HV estimators are the most commonly used estimators in finance. The calculation is straightforward and easy to understand. When people reference historical volatility, most of the time they are talking about the close to close estimator.
Cons:
• The Close-to-close estimator only calculates volatility based on the closing price. It does not take account into intraday volatility drift such as high, low. It also does not take account into the jump when open and close prices are not the same.
• Close-to-Close weights past volatility equally during the lookback period, while there are other ways to weight the historical data.
• Close-to-Close is calculated based on standard deviation so it is vulnerable to returns that are not normally distributed and have fat tails. Mean and Median absolute deviation makes the historical volatility more stable with extreme values.
Parkinson Hv Estimator:
• Parkinson was one of the first to come up with improvements to historical volatility calculation. • Parkinson suggests using the High and Low of each bar can represent volatility better as it takes into account intraday volatility. So Parkinson HV is also known as Parkinson High Low HV. • It is about 5.2 times more efficient than Close-to-Close estimator. But it does not take account into jumps and drift. Therefore, it underestimates volatility. Note: By Dividing the Parkinson Volatility by Close-to-Close volatility you can get a similar result to Variance Ratio Test. It is called the Parkinson number. It can be used to test if the market follows a random walk. (It is mentioned in Nassim Taleb's Dynamic Hedging book but it seems like he made a mistake and wrote the ratio wrongly.)
Garman-Klass Estimator:
• Garman Klass expanded on Parkinson’s Estimator. Instead of Parkinson’s estimator using high and low, Garman Klass’s method uses open, close, high, and low to find the minimum variance method.
• The estimator is about 7.4 more efficient than the traditional estimator. But like Parkinson HV, it ignores jumps and drifts. Therefore, it underestimates volatility.
Rogers-Satchell Estimator:
• Rogers and Satchell found some drawbacks in Garman-Klass’s estimator. The Garman-Klass assumes price as Brownian motion with zero drift.
• The Rogers Satchell Estimator calculates based on open, close, high, and low. And it can also handle drift in the financial series.
• Rogers-Satchell HV is more efficient than Garman-Klass HV when there’s drift in the data. However, it is a little bit less efficient when drift is zero. The estimator doesn’t handle jumps, therefore it still underestimates volatility.
Garman-Klass Yang-Zhang extension:
• Yang Zhang expanded Garman Klass HV so that it can handle jumps. However, unlike the Rogers-Satchell estimator, this estimator cannot handle drift. It is about 8 times more efficient than the traditional estimator.
• The Garman-Klass Yang-Zhang extension HV has the same value as Garman-Klass when there’s no gap in the data such as in cryptocurrencies.
Yang-Zhang Estimator:
• The Yang Zhang Estimator combines Garman-Klass and Rogers-Satchell Estimator so that it is based on Open, close, high, and low and it can also handle non-zero drift. It also expands the calculation so that the estimator can also handle overnight jumps in the data.
• This estimator is the most powerful estimator among the range-based estimators. It has the minimum variance error among them, and it is 14 times more efficient than the close-to-close estimator. When the overnight and daily volatility are correlated, it might underestimate volatility a little.
• 1.34 is the optimal value for alpha according to their paper. The alpha constant in the calculation can be adjusted in the settings. Note: There are already some volatility estimators coded on TradingView. Some of them are right, some of them are wrong. But for Yang Zhang Estimator I have not seen a correct version on TV.
EWMA Estimator:
• EWMA stands for Exponentially Weighted Moving Average. The Close-to-Close and all other estimators here are all equally weighted.
• EWMA weighs more recent volatility more and older volatility less. The benefit of this is that volatility is usually autocorrelated. The autocorrelation has close to exponential decay as you can see using an Autocorrelation Function indicator on absolute or squared returns. The autocorrelation causes volatility clustering which values the recent volatility more. Therefore, exponentially weighted volatility can suit the property of volatility well.
• RiskMetrics uses 0.94 for lambda which equals 30 lookback period. In this indicator Lambda is coded to adjust with the lookback. It's also easy for EWMA to forecast one period volatility ahead.
• However, EWMA volatility is not often used because there are better options to weight volatility such as ARCH and GARCH.
Adjusted Mean Absolute Deviation Estimator:
• This estimator does not use standard deviation to calculate volatility. It uses the distance log return is from its moving average as volatility.
• It’s a simple way to calculate volatility and it’s effective. The difference is the estimator does not have to square the log returns to get the volatility. The paper suggests this estimator has more predictive power.
• The mean absolute deviation here is adjusted to get rid of the bias. It scales the value so that it can be comparable to the other historical volatility estimators.
• In Nassim Taleb’s paper, he mentions people sometimes confuse MAD with standard deviation for volatility measurements. And he suggests people use mean absolute deviation instead of standard deviation when we talk about volatility.
Adjusted Median Absolute Deviation Estimator:
• This is another estimator that does not use standard deviation to measure volatility.
• Using the median gives a more robust estimator when there are extreme values in the returns. It works better in fat-tailed distribution.
• The median absolute deviation is adjusted by maximum likelihood estimation so that its value is scaled to be comparable to other volatility estimators.
█ FEATURES
• You can select the volatility estimator models in the Volatility Model input
• Historical Volatility is annualized. You can type in the numbers of trading days in a year in the Annual input based on the asset you are trading.
• Alpha is used to adjust the Yang Zhang volatility estimator value.
• Percentile Length is used to Adjust Percentile coloring lookbacks.
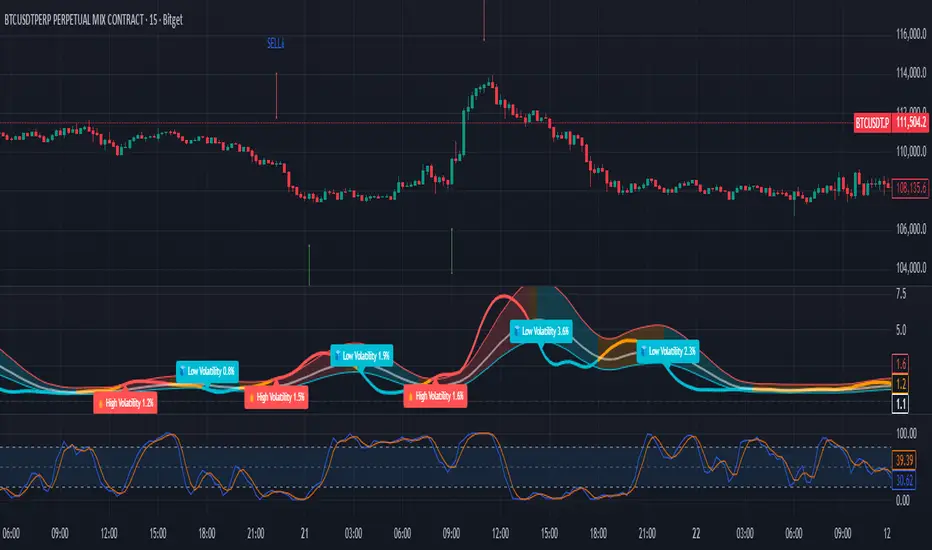
• The gradient coloring will be based on the percentile value (0- 100). The higher the percentile value, the warmer the color will be, which indicates high volatility. The lower the percentile value, the colder the color will be, which indicates low volatility.
• When percentile coloring is off, it won’t show the gradient color.
• You can also use invert color to make the high volatility a cold color and a low volatility high color. Volatility has some mean reversion properties. Therefore when volatility is very low, and color is close to aqua, you would expect it to expand soon. When volatility is very high, and close to red, you would it expect it to contract and cool down.
• When the background signal is on, it gives a signal when HVP is very low. Warning there might be a volatility expansion soon.
• You can choose the plot style, such as lines, columns, areas in the plotstyle input.
• When the show information panel is on, a small panel will display on the right.
• The information panel displays the historical volatility model name, the 50th percentile of HV, and HV percentile. 50 the percentile of HV also means the median of HV. You can compare the value with the current HV value to see how much it is above or below so that you can get an idea of how high or low HV is. HV Percentile value is from 0 to 100. It tells us the percentage of periods over the entire lookback that historical volatility traded below the current level. Higher HVP, higher HV compared to its historical data. The gradient color is also based on this value.
█ HOW TO USE If you haven’t used the hvp indicator, we suggest you use the HVP indicator first. This indicator is more like historical volatility with HVP coloring. So it displays HVP values in the color and panel, but it’s not range bound like the HVP and it displays HV values. The user can have a quick understanding of how high or low the current volatility is compared to its historical value based on the gradient color. They can also time the market better based on volatility mean reversion. High volatility means volatility contracts soon (Move about to End, Market will cooldown), low volatility means volatility expansion soon (Market About to Move).
█ FINAL THOUGHTS HV vs ATR The above volatility estimator concepts are a display of history in the quantitative finance realm of the research of historical volatility estimations. It's a timeline of range based from the Parkinson Volatility to Yang Zhang volatility. We hope these descriptions make more people know that even though ATR is the most popular volatility indicator in technical analysis, it's not the best estimator. Almost no one in quant finance uses ATR to measure volatility (otherwise these papers will be based on how to improve ATR measurements instead of HV). As you can see, there are much more advanced volatility estimators that also take account into open, close, high, and low. HV values are based on log returns with some calculation adjustment. It can also be scaled in terms of price just like ATR. And for profit-taking ranges, ATR is not based on probabilities. Historical volatility can be used in a probability distribution function to calculated the probability of the ranges such as the Expected Move indicator. Other Estimators There are also other more advanced historical volatility estimators. There are high frequency sampled HV that uses intraday data to calculate volatility. We will publish the high frequency volatility estimator in the future. There's also ARCH and GARCH models that takes volatility clustering into account. GARCH models require maximum likelihood estimation which needs a solver to find the best weights for each component. This is currently not possible on TV due to large computational power requirements. All the other indicators claims to be GARCH are all wrong.
스크립트에서 "tradingview+筹码结构"에 대해 찾기

ADX Forecast Colorful [DiFlip]ADX Forecast Colorful
Introducing one of the most advanced ADX indicators available — a fully customizable analytical tool that integrates forward-looking forecasting capabilities. ADX Forecast Colorful is a scientific evolution of the classic ADX, designed to anticipate future trend strength using linear regression. Instead of merely reacting to historical data, this indicator projects the future behavior of the ADX, giving traders a strategic edge in trend analysis.
⯁ Real-Time ADX Forecasting
For the first time, a public ADX indicator incorporates linear regression (least squares method) to forecast the future behavior of ADX. This breakthrough approach enables traders to anticipate trend strength changes based on historical momentum. By applying linear regression to the ADX, the indicator plots a projected trendline n periods ahead — helping users make more accurate and timely trading decisions.
⯁ Highly Customizable
The indicator adapts seamlessly to any trading style. It offers a total of 26 long entry conditions and 26 short entry conditions, making it one of the most configurable ADX tools on TradingView. Each condition is fully adjustable, enabling the creation of statistical, quantitative, and automated strategies. You maintain full control over the signals to align perfectly with your system.
⯁ Innovative and Science-Based
This is the first public ADX indicator to apply least-squares predictive modeling to ADX dynamics. Technically, it embeds machine learning logic into a traditional trend-strength indicator. Using linear regression as a predictive engine adds powerful statistical rigor to the ADX, turning it into an intelligent, forward-looking signal generator.
⯁ Scientific Foundation: Linear Regression
Linear regression is a fundamental method in statistics and machine learning used to model the relationship between a dependent variable y and one or more independent variables x. The basic formula for simple linear regression is:
y = β₀ + β₁x + ε
Where:
y = predicted value (e.g., future ADX)
x = explanatory variable (e.g., bar index or time)
β₀ = intercept
β₁ = slope (rate of change)
ε = random error term
The goal is to estimate β₀ and β₁ by minimizing the sum of squared errors. This is achieved using the least squares method, ensuring the best linear fit to historical data. Once the coefficients are calculated, the model extends the regression line forward, generating the ADX projection based on recent trends.
⯁ Least Squares Estimation
To minimize the error, the regression coefficients are calculated as:
β₁ = Σ((xᵢ - x̄)(yᵢ - ȳ)) / Σ((xᵢ - x̄)²)
β₀ = ȳ - β₁x̄
Where:
Σ = summation
x̄ and ȳ = means of x and y
i ranges from 1 to n (number of data points)
These formulas provide the best linear unbiased estimator under Gauss-Markov conditions — assuming constant variance and linearity.
⯁ Linear Regression in Machine Learning
Linear regression is a foundational algorithm in supervised learning. Its power in producing quantitative predictions makes it essential in AI systems, predictive analytics, time-series forecasting, and automated trading. Applying it to the ADX essentially places an intelligent forecasting engine inside a classic trend tool.
⯁ Visual Interpretation
Imagine an ADX time series like this:
Time →
ADX →
The regression line smooths these values and projects them n periods forward, creating a predictive trajectory. This forecasted ADX line can intersect with the actual ADX, offering smarter buy and sell signals.
⯁ Summary of Scientific Concepts
Linear Regression: Models variable relationships with a straight line.
Least Squares: Minimizes prediction errors for best fit.
Time-Series Forecasting: Predicts future values using historical data.
Supervised Learning: Trains models to predict outcomes from inputs.
Statistical Smoothing: Reduces noise and highlights underlying trends.
⯁ Why This Indicator Is Revolutionary
Scientifically grounded: Based on rigorous statistical theory.
Unprecedented: First public ADX using least-squares forecast modeling.
Smart: Uses machine learning logic.
Forward-Looking: Generates predictive, not just reactive, signals.
Customizable: Flexible for any strategy or timeframe.
⯁ Conclusion
By merging ADX and linear regression, this indicator enables traders to predict market momentum rather than merely follow it. ADX Forecast Colorful is not just another indicator — it’s a scientific leap forward in technical analysis. With 26 fully configurable entry conditions and smart forecasting, this open-source tool is built for creating cutting-edge quantitative strategies.
⯁ Example of simple linear regression with one independent variable
This example demonstrates how a basic linear regression works when there is only one independent variable influencing the dependent variable. This type of model is used to identify a direct relationship between two variables.
⯁ In linear regression, observations (red) are considered the result of random deviations (green) from an underlying relationship (blue) between a dependent variable (y) and an independent variable (x)
This concept illustrates that sampled data points rarely align perfectly with the true trend line. Instead, each observed point represents the combination of the true underlying relationship and a random error component.
⯁ Visualizing heteroscedasticity in a scatterplot with 100 random fitted values using Matlab
Heteroscedasticity occurs when the variance of the errors is not constant across the range of fitted values. This visualization highlights how the spread of data can change unpredictably, which is an important factor in evaluating the validity of regression models.
⯁ The datasets in Anscombe’s quartet were designed to have nearly the same linear regression line (as well as nearly identical means, standard deviations, and correlations) but look very different when plotted
This classic example shows that summary statistics alone can be misleading. Even with identical numerical metrics, the datasets display completely different patterns, emphasizing the importance of visual inspection when interpreting a model.
⯁ Result of fitting a set of data points with a quadratic function
This example illustrates how a second-degree polynomial model can better fit certain datasets that do not follow a linear trend. The resulting curve reflects the true shape of the data more accurately than a straight line.
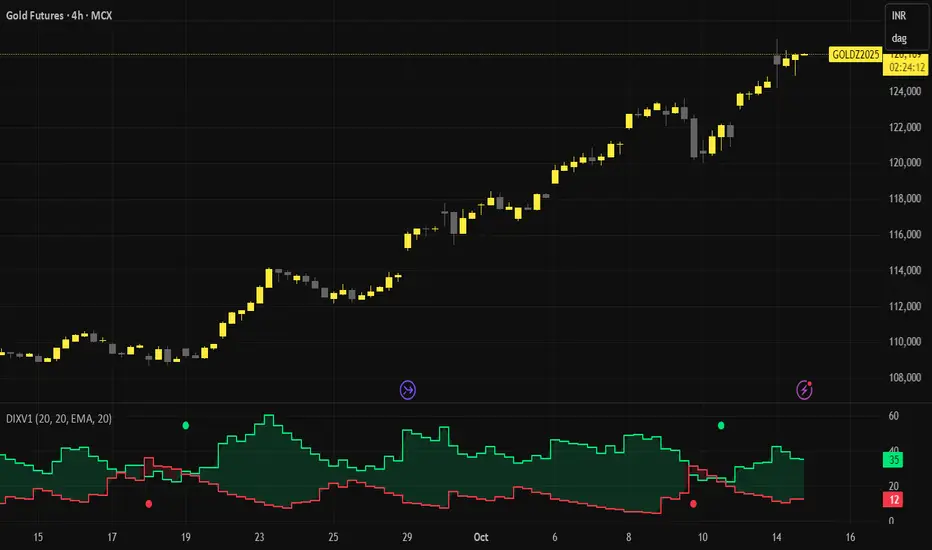
⯁ What is the ADX?
The Average Directional Index (ADX) is a technical analysis indicator developed by J. Welles Wilder. It measures the strength of a trend in a market, regardless of whether the trend is up or down.
The ADX is an integral part of the Directional Movement System, which also includes the Plus Directional Indicator (+DI) and the Minus Directional Indicator (-DI). By combining these components, the ADX provides a comprehensive view of market trend strength.
⯁ How to use the ADX?
The ADX is calculated based on the moving average of the price range expansion over a specified period (usually 14 periods). It is plotted on a scale from 0 to 100 and has three main zones:
Strong Trend: When the ADX is above 25, indicating a strong trend.
Weak Trend: When the ADX is below 20, indicating a weak or non-existent trend.
Neutral Zone: Between 20 and 25, where the trend strength is unclear.
⯁ Entry Conditions
Each condition below is fully configurable and can be combined to build precise trading logic.
📈 BUY
🅰️ Signal Validity: The signal will remain valid for X bars .
🅰️ Signal Sequence: Configurable as AND or OR .
🅰️ +DI > -DI
🅰️ +DI < -DI
🅰️ +DI > ADX
🅰️ +DI < ADX
🅰️ -DI > ADX
🅰️ -DI < ADX
🅰️ ADX > Threshold
🅰️ ADX < Threshold
🅰️ +DI > Threshold
🅰️ +DI < Threshold
🅰️ -DI > Threshold
🅰️ -DI < Threshold
🅰️ +DI (Crossover) -DI
🅰️ +DI (Crossunder) -DI
🅰️ +DI (Crossover) ADX
🅰️ +DI (Crossunder) ADX
🅰️ +DI (Crossover) Threshold
🅰️ +DI (Crossunder) Threshold
🅰️ -DI (Crossover) ADX
🅰️ -DI (Crossunder) ADX
🅰️ -DI (Crossover) Threshold
🅰️ -DI (Crossunder) Threshold
🔮 +DI (Crossover) -DI Forecast
🔮 +DI (Crossunder) -DI Forecast
🔮 ADX (Crossover) +DI Forecast
🔮 ADX (Crossunder) +DI Forecast
📉 SELL
🅰️ Signal Validity: The signal will remain valid for X bars .
🅰️ Signal Sequence: Configurable as AND or OR .
🅰️ +DI > -DI
🅰️ +DI < -DI
🅰️ +DI > ADX
🅰️ +DI < ADX
🅰️ -DI > ADX
🅰️ -DI < ADX
🅰️ ADX > Threshold
🅰️ ADX < Threshold
🅰️ +DI > Threshold
🅰️ +DI < Threshold
🅰️ -DI > Threshold
🅰️ -DI < Threshold
🅰️ +DI (Crossover) -DI
🅰️ +DI (Crossunder) -DI
🅰️ +DI (Crossover) ADX
🅰️ +DI (Crossunder) ADX
🅰️ +DI (Crossover) Threshold
🅰️ +DI (Crossunder) Threshold
🅰️ -DI (Crossover) ADX
🅰️ -DI (Crossunder) ADX
🅰️ -DI (Crossover) Threshold
🅰️ -DI (Crossunder) Threshold
🔮 +DI (Crossover) -DI Forecast
🔮 +DI (Crossunder) -DI Forecast
🔮 ADX (Crossover) +DI Forecast
🔮 ADX (Crossunder) +DI Forecast
🤖 Automation
All BUY and SELL conditions are compatible with TradingView alerts, making them ideal for fully or semi-automated systems.
⯁ Unique Features
Linear Regression: (Forecast)
Signal Validity: The signal will remain valid for X bars
Signal Sequence: Configurable as AND/OR
Condition Table: BUY/SELL
Condition Labels: BUY/SELL
Plot Labels in the Graph Above: BUY/SELL
Automate and Monitor Signals/Alerts: BUY/SELL
Background Colors: "bgcolor"
Background Colors: "fill"
Linear Regression (Forecast)
Signal Validity: The signal will remain valid for X bars
Signal Sequence: Configurable as AND/OR
Table of Conditions: BUY/SELL
Conditions Label: BUY/SELL
Plot Labels in the graph above: BUY/SELL
Automate & Monitor Signals/Alerts: BUY/SELL
Background Colors: "bgcolor"
Background Colors: "fill"

Hybrid Flow Master📊 Hybrid Flow Master - Professional Trading Indicator
Overview
Hybrid Flow Master is an advanced all-in-one trading indicator that combines Smart Money Concepts, institutional order flow analysis, and multi-timeframe confluence scoring to identify high-probability trade setups. Designed for both scalpers and swing traders across all markets (Forex, Crypto, Stocks, Indices).
🎯 Key Features
1. Intelligent Confluence System (0-100% Scoring) Proprietary scoring algorithm that weighs multiple factors Only signals when minimum confidence threshold is met
Real-time probability calculations for each setup Signal quality grading: A+, A, B, C ratings
2. Smart Money Concepts (SMC)
Automatic Order Block detection (bullish/bearish) Fair Value Gap (FVG) identification
Market structure analysis (Higher Highs, Lower Lows) Swing high/low tracking with visual markers
3. Multi-Timeframe Analysis
Higher timeframe trend filter for confluence Customizable HTF periods (1H, 4H, Daily, etc.)
Prevents counter-trend trades Aligns entries with major trends
4. Volume Flow Analysis
Volume spike detection with customizable thresholds Volume delta calculations (buying vs selling pressure) Institutional footprint identification Background highlighting for high-volume bars
5. Advanced Risk Management
ATR-based stop loss calculation Automatic take profit levels Customizable risk/reward ratios (1:1, 1:2, 1:3+) Visual SL/TP lines on chart Position sizing guidance
6. Professional Dashboard
Real-time HUD displaying:
Market bias (Bullish/Bearish/Neutral)
Higher timeframe trend status
Current confluence percentage
Volume status (Normal/High)
RSI reading with color coding
ATR volatility measure
Signal quality grade
7. Smart Alert System
Bullish confluence signals
Bearish confluence signals
Volume spike notifications
Customizable alert messages
Works with mobile app notifications
📈 What Makes It Unique?
✅ No Repainting - All signals are confirmed and final
✅ Probability-Based - Shows confidence level, not just binary signals
✅ Multi-Factor Confluence - Combines structure, volume, momentum, and HTF analysis
✅ Clean Interface - Toggle individual components on/off
✅ Works on All Timeframes - From 1-minute scalping to daily swing trading
✅ Universal Markets - Forex, Crypto, Stocks, Indices, Commodities
🎨 Customization Options
Adjustable swing detection length
Volume threshold settings
Minimum confluence score filter
Custom color schemes
Dashboard position (4 corners)
Show/hide individual components
Risk/reward ratio adjustment
ATR multiplier for stops
📊 Best Used For:
✔️ Scalping (1m - 15m charts)
✔️ Day Trading (15m - 1H charts)
✔️ Swing Trading (4H - Daily charts)
✔️ Trend Following
✔️ Reversal Trading
✔️ Breakout Trading
💡 How to Use:
Add indicator to chart - Works immediately with default settings Set your timeframe - Choose your trading style Wait for signals - Green BUY or Red SELL labels with confidence %
Check confluence score - Higher % = better quality setup Review dashboard - Confirm market bias and HTF trend Manage risk - Use provided SL/TP levels or adjust to your preference
Set alerts - Get notified of high-probability setups
⚙️ Recommended Settings:
For Scalping (1m-5m):
Swing Length: 5-7
Min Confluence: 70%
HTF: 15m or 1H
For Day Trading (15m-1H):
Swing Length: 10-15
Min Confluence: 60%
HTF: 4H or Daily
For Swing Trading (4H-Daily):
Swing Length: 15-20
Min Confluence: 50-60%
HTF: Weekly
📚 Indicator Components:
✦ Market Structure Detection
✦ Order Block Identification
✦ Fair Value Gaps (FVG)
✦ Volume Analysis
✦ RSI (14)
✦ MACD (12, 26, 9)
✦ ATR (14)
✦ Multi-Timeframe Trend
✦ Confluence Scoring Algorithm
🚀 Performance Notes:
Optimized for speed and efficiency Minimal CPU usage Clean chart presentation
Limited drawing objects (no chart clutter) Works on all TradingView plans
⚠️ Important Notes:
This indicator is a tool to assist trading decisions, not financial advice Always use proper risk management (1-2% per trade recommended) Backtest on your preferred market and timeframe
Combine with your own analysis and strategy Past performance does not guarantee future results
🔔 Alert Setup:
Right-click indicator name → "Add Alert" → Choose:
"Bullish Confluence Signal" for buy setups
"Bearish Confluence Signal" for sell setups
"Volume Spike Alert" for unusual activity
💬 Support:
For questions, suggestions, or custom modifications, feel free to message me directly through TradingView.

CVD – Visible Range Candles & Line (Cumulative Delta Volume)Disclaimer:
This indicator is provided for informational and educational purposes only. It does not constitute investment advice, trading advice, or a recommendation to buy or sell any financial instrument. The author assumes no liability for any losses, damages, or errors arising from use or misuse of this script. Please test thoroughly and use at your own risk.
________________________________________________________________________________
Purpose
This indicator provides a fast and clear visualization of Cumulative Delta Volume (CVD) for the currently visible chart range in TradingView. It helps traders identify buy/sell volume pressure and market sentiment over any custom timeframe, with full control over reset intervals and chart style.
Key Features
CVD by Visible Bars: Dynamically calculates CVD only for bars currently visible on the chart, so scrolling and zooming always rescale the line and candles to your view.
Style Selection: Choose line or candlestick display. Candles include both standard OHLC and optional Heikin Ashi smoothing.
Automatic Resets: Restart CVD accumulation at the beginning of every day, week, month, or quarter. Choose ‘None’ for ongoing accumulation.
Fully Custom Colors: Line color, candle body, wick, border – all optimized for clarity and customizable via the indicator’s Style tab.
Autoscale Support: Always fits your timeframe. No need to adjust scale manually.
Zero-Level Reference: Includes a horizontal zero line for quick reversal detection.
Input Parameters
Style: "Line" or "Candles" – controls visual type
Heikin Ashi candles: Enable smoothing for candle view
Show Line: Toggle CVD line visibility
Reset CVD: Options: None, Daily, Weekly, Monthly, Quarterly
How To Use
Add the indicator to your TradingView chart.
Select your preferred visual style (Line or Candles).
Choose reset frequency based on your trading timeframe.
Customize colors in the Style tab (line, candle up/down, wick, border).
Scroll or zoom on the chart – the indicator’s range always fits the currently visible bars.
Typical Use Cases
Intraday traders tracking open/close session volume delta
Swing traders identifying quarterly or monthly market accumulations
Visualizing buy/sell pressure divergence at reversal points
Comparing volume sentiment across flexible chart intervals
Formula
Delta calculation: Delta=volume×(sign(close−open))
Accumulation: Resets at user-chosen intervals, CVD plotted for only visible bars
Author
Created by Ronen Cohen

ATR Volatility AlertsOverview:
This is a dynamic alert tool based on the Average True Range (ATR), designed to help traders detect sudden price movements that exceed normal volatility levels. Whether you are trading breakouts or monitoring for abnormal spikes, this indicator visualizes these events on the chart and triggers system alerts when the price move exceeds your specified ATR multiplier.
Key Features:
Fully Customizable ATR Range:
You can adjust the ATR Length (Default: 14) and the Multiplier (Default: 1.5x).
Tip: Increase the multiplier (e.g., to 2.0 or 3.0) to catch only extreme volatility, or lower it for scalping smaller moves.
Visual Chart Signals:
Visual markers appear instantly when a bar's movement exceeds the ATR threshold.
Green Triangle: Indicates an Upward Spike.
Red Triangle: Indicates a Downward Spike.
Flexible System Alerts:
Designed to integrate seamlessly with TradingView's alert system. You can choose from three specific alert directions based on your strategy:
1.Price Spike Up: Triggers only on sharp upward moves.
2.Price Spike Down: Triggers only on sharp downward moves.
3.Bidirectional Volatility Alert: Triggers on BOTH huge pumps and dumps.
How to Set Alerts:
Click the "Create Alert" button in TradingView.
Select ATR Volatility Alerts in the "Condition" dropdown.
Choose the specific logic you need:
· Select Price Spike Up for bullish monitoring.
· Select Price Spike Down for bearish monitoring.
· Select Bidirectional Volatility Alert to watch for any volatility expansion.

FVG ATRFVG ATR — Fair Value Gap Size Measured in ATR Units
This Pine Script v6 indicator detects Fair Value Gaps and displays their size as a ratio of the Average True Range, providing traders with a normalized measurement of gap significance across different market conditions and timeframes.
Key Features
Automatic FVG Detection
The indicator identifies bullish and bearish Fair Value Gaps using the standard three-candle pattern. Bullish FVGs occur when the current low exceeds the high from two bars ago, while bearish FVGs occur when the current high falls below the low from two bars ago.
ATR Ratio Calculation
Each detected FVG is measured against the current Average True Range at the moment of detection. The ratio is displayed as a compact label next to the gap, showing values like "ATR: 0.75" or "ATR: 1.41". This normalization allows comparison of gap significance across volatile and calm market periods.
Minimal Visual Footprint
Labels are displayed directly on the chart without boxes or lines, using customizable text sizes from tiny to large. The default tiny size ensures the chart remains uncluttered while providing essential information at a glance.
Highly Customizable Display
All visual aspects are configurable through input parameters, including label position (top, middle, or bottom of gap), text size, text color, optional background, and horizontal offset from the detection candle.
Customizable Parameters
Detection Settings
Detect Bullish FVG: Enable or disable detection of bullish gaps. Default is enabled.
Detect Bearish FVG: Enable or disable detection of bearish gaps. Default is enabled.
Min Size (pips): Filter out small gaps below the specified threshold. One pip equals 10 ticks for most Forex pairs. Default is 10 pips.
ATR Calculation
ATR Period: Period length for Average True Range calculation. Default is 14, adjustable to match your trading strategy.
Label Settings
Label Position: Vertical placement of the text label relative to the FVG zone. Options are Top, Middle, or Bottom. Default is Middle.
Label Size: Text size from Tiny (smallest), Small, Normal, to Large. Default is Tiny for minimal chart clutter.
Text Color: Custom color for label text. Default is white for visibility on dark themes.
Show Background: Toggle to display labels with a colored background box or as transparent text only. Default is disabled for cleaner appearance.
Background Color: Custom color for label background when enabled. Default is semi-transparent gray.
Label Offset (bars): Horizontal distance in bars between the detection candle and the label. Set to 0 for labels directly on the candle, or increase for separation. Default is 0.
Recommended Use Cases
Multi-Timeframe Analysis
Compare FVG significance across different timeframes by observing ATR ratios. A 1.5 ATR gap on the 1-hour chart may indicate different significance than the same ratio on the daily chart.
Volatility-Adjusted Trading
Use ATR ratios to filter for only the most significant gaps. For example, only trade FVGs with ratios above 1.0 to focus on gaps larger than typical price movement.
Risk Management
Size positions based on gap magnitude relative to current volatility. Larger ATR ratios may warrant tighter stops or smaller position sizes.
Market Efficiency Analysis
Track how quickly and completely different-sized gaps get filled. Gaps with higher ATR ratios may take longer to fill or act as stronger support and resistance zones.
Technical Details
This indicator is written in Pine Script v6 and follows all recommended coding standards including strict 4-space indentation, lazy boolean evaluation, and proper type declarations. The script uses array-based storage to maintain up to 500 labels simultaneously.
The ATR ratio is calculated at the moment of FVG detection and remains fixed, never repainting. The calculation divides the FVG height (distance between gap boundaries) by the current ATR value using the specified period. Division by zero is protected with conditional logic.
Label positioning uses the xloc.bar_index and yloc.price system for precise placement. The horizontal offset parameter allows traders to adjust label spacing based on chart zoom level and personal preference. Text formatting uses str.tostring with two decimal places for clear ratio display.
Important Notes
The indicator never repaints as all FVG detections and ATR calculations are fixed upon bar confirmation. Labels persist on the chart until the maximum label count is reached, at which point the oldest labels are automatically removed by TradingView.
For optimal performance on charts with many FVGs, consider increasing the minimum pip size filter or using smaller label sizes. The tiny size option provides the smallest possible text for maximum chart clarity.
Installation and Usage
Copy the source code into the TradingView Pine Editor and add the indicator to your chart. The overlay parameter is set to true, allowing labels to display directly on price candles. Configure all parameters through the indicator settings panel to match your trading style and visual preferences.
100% Pine Script v6 indicator — No repaint — Open source

TrendMaster V2TrendMaster V2 is a comprehensive Pine Script indicator designed for TradingView. It combines multiple technical indicators and an advanced scoring logic to provide actionable trading signals. The script is highly customizable, allowing users to adjust trading modes, color themes, and signal filters according to their preferences and risk tolerance.
Key Features
Composite Scoring System:
The script calculates a composite score based on trend, momentum, pattern recognition, volume, volatility, divergence, Pearson correlation, and the CCI index. This score helps identify the best buy or sell opportunities.
Customizable Parameters:
Users can choose between “Aggressive,” “Balanced,” or “Conservative” trading modes, adjust indicator periods, and customize the color scheme of all visual elements.
Confluence Analysis:
The script evaluates the number of matching bullish or bearish signals, providing a confluence summary for higher-confidence trades.
Visual Signals:
Clear visual cues (triangles, circles, crosses) are displayed on the chart for strong buy/sell signals, confluences, and divergences.
Information Panels:
Two panels display real-time data such as score, RSI, volume, volatility, Pearson, CCI, trend, signal, and mode, along with the confluence status for quick reference.
Alert Conditions:
The script supports alerts for strong buy/sell signals, confluences, and divergences.
How It Works
Main Configuration:
Users select a trading mode (Aggressive, Balanced, or Conservative) and a color theme (Dark or Light).
Custom colors can also be set for bullish, bearish, strong, neutral, and signal elements.
Technical Indicators
Moving Averages (SMA/EMA) for trend analysis.
RSI to assess momentum and overbought/oversold conditions.
MACD for trend confirmation.
Volume and Volatility (ATR) for market activity evaluation.
Advanced Indicators
Pearson Correlation to measure trend strength.
CCI for cyclic momentum analysis.
Pattern Recognition
The script identifies common bullish and bearish reversal patterns (e.g., engulfing, hammer, morning/evening star) and continuation patterns (e.g., three white soldiers/black crows).
Composite Score
Each indicator contributes to a composite score, weighted according to the selected trading mode.
The score determines the strength of buy/sell signals.
Confluence Analysis
The script counts the number of matching bullish or bearish signals, providing a confluence summary for higher-confidence trades.
Visual Signals and Alerts
Strong buy/sell signals: triangles
Confluence signals: circles
Divergences: crosses
Alerts are triggered for strong buy/sell signals, confluences, and divergences.
Usage Instructions
Add the script to your TradingView chart.
Adjust the settings in the configuration panel to match your trading style.
Monitor the information panels and visual signals to spot trading opportunities.
Set up alerts for your preferred signal types.

Average Price Calculator / VisualizerDCA Average Price Calculator - Visualize Your Breakeven & TP!
Ever wished you could visualize your trades and instantly see your average entry price right here on TradingView? Especially if you're a DCA (Dollar-Cost Averaging) trader like me, tracking multiple entries can be a hassle. You're constantly switching to a spreadsheet or calculator to figure out your breakeven and take-profit levels. Well I've developed this DCA Average Price Calculator to solve exactly that problem, bringing all your position planning directly onto your chart.
What It Does
This indicator is a interactive tool designed to calculate the weighted average price of up to 10 separate trade entries. It then plots your crucial breakeven (average price) and a customizable take-profit target directly on your chart, giving you a clear visual of your position.
Key Features
Up to 10 Order Entries: Plan complex DCA strategies with support for up to ten individual buys.
Flexible Size Input: Enter your position size in either USD Amount or Number of Shares/Contracts. The script is smart enough to know which one you're using.
Instant Average Price Calculation: Your weighted average price (your breakeven point) is calculated and plotted in real-time as a clean yellow line.
Customizable Take-Profit Target: Set your desired profit percentage and see your take-profit level instantly plotted as a green line.
Detailed On-Chart Labels: Each order you plot is marked with a detailed label showing the entry price, the number of shares purchased, and the total USD value of that entry.
Clean & Uncluttered UI: The main Average and TP labels are intelligently shifted to the right, ensuring they don't overlap with your entry markers, keeping your chart readable.
How to Use It - Simple Steps
Add the indicator to your chart.
Open the script's 'Settings' menu.
In the 'Take Profit' section, set your desired profit percentage (e.g., 1 for 1%).
Under the 'Orders' section, begin filling in your entries. For each 'Order #', enter the Price.
Next, enter the size. You can either fill in the 'Size (USD)' box OR the '/ Shares' box. Leave the one you're not using at 0.
As you add orders, the 'Avg' (yellow) and 'TP' (green) lines, along with the blue order labels, will automatically appear and adjust on your chart!
Who Is This For?
DCA Traders: This is the ultimate tool for you!
Position Traders: Keep track of scaling into a larger position over time.
Manual Backtesters: Quickly simulate and visualize how a series of buys would have played out.
Any Trader who wants a quick and easy way to calculate their average entry without leaving TradingView.
I built this tool to improve my own trading workflow, and I hope it helps you as much as it has helped me. If you find it useful, please consider giving it a 'Like' and feel free to leave any feedback or suggestions in the comments!
Happy trading

Pivot Points High Low Multi Time Frame + AlertsThis script is a modified version of “Pivot Points High Low Multi Time Frame” for TradingView, enhanced with price alerts when the market reaches or crosses recent pivot levels.
What it does:
Detects Pivot Highs and Pivot Lows based on your chosen timeframe and bar settings.
Draws visual lines and labels at each pivot level for clear identification.
Keeps track of the latest pivot high and low values.
Triggers an alert condition when the price crosses either of those pivots.
Alert conditions included:
🔔 Price Crossed Pivot High — notifies when the price touches or moves above the last pivot high.
🔔 Price Crossed Pivot Low — notifies when the price touches or moves below the last pivot low.
How to use:
Add the script to your chart in TradingView.
Click the Alarm (🔔) icon → choose Add Alert.
Under Condition, select this indicator and pick one of the two alert types.
Choose your preferred alert frequency (Once per bar, Every time, etc.).
Tip: You can also visually see when alerts are triggered — small green and red triangles will appear above or below the bars where the price crosses a pivot.

Stablecoin to BTC Market Cap RatioThis indicator calculates the ratio of the combined market capitalization of USDT and USDC stablecoins to the market capitalization of BTC. Data is updated daily from TradingView's CRYPTOCAP sources. It is displayed as a line in a separate panel, allowing analysis of stablecoin liquidity dynamics relative to BTC.
How to Use
Add the indicator to any asset chart in TradingView. It is useful for assessing the potential buying power of stablecoins in the cryptocurrency market. High ratio values may signal accumulation of liquidity in stablecoins, often preceding growth in BTC or altcoins (bullish signal). Low values indicate a decrease in the role of stablecoins, which may be bearish. It is recommended to combine with other indicators, such as RSI or volumes, to confirm trends.

X Tail that Wagsintraday session-framework and ETH-anchored VWAP tool for TradingView. It draws today’s OVN (ETH) high/mid/low, today’s RTH-day open, previous day open/high/low, and a carried ETH VWAP handle (yesterday’s 4:00 PM NY VWAP, projected forward) to give you a clean, non-repainting scaffold for bias, structure, and execution. All timestamps are New York–local with DST handled explicitly, so historical sessions align correctly across time changes.
Key Capabilities
ETH OVN Range (18:00 → 09:30 NY)
Captures the rolling overnight high/low and computes the mid; at 09:30 NY it locks those levels and extends them to 16:00 NY (same day).
Optional labels (size/color configurable) placed slightly to the right of the 4 PM timestamp for readability.
Daily Handles (Today & Previous Day)
Today’s open line starts at the ETH open (anchor preserved) and extends toward 4 PM NY (or up to the “current bar + 5 bars” cap), with label control.
Previous day open/high/low plotted as discrete reference lines for carry-over structure.
ETH-Anchored VWAP (Live) + Bands
ETH-anchored VWAP runs only during the active ETH session (DST-aware).
Optional VWAP bands (0.5×, 1.0×, 2.0× multipliers) plotted as line-break series.
Carried ETH VWAP Handle (PD 4 PM Snapshot)
At 16:00 NY, the script snapshots the final ETH VWAP value.
On the next ETH open, it projects that value as a static dashed line through the session (non-mutating, non-repainting), with optional label.
Labeling & Styling
Single-toggle label system with color and five sizes.
Per-line color/width controls for quick visual hierarchy.
Internal “tail” logic keeps right endpoints near price (open-anchored lines extend to min(4 PM, now + 5 bars)), avoiding chart-wide overdraw.
Robust Session Logic
All session boundaries computed in NY local time; DST rules applied for historical bars.
Cross-midnight windows handled safely (no gaps or misalignment around day rolls).
Primary Use Cases
Session Bias & Context
Use OVN H/M/L and today’s open to define structural bias zones before RTH begins. A break-and-hold above OVN mid, for example, can filter long ideas; conversely, rejection at OVN high can warn of mean reversion.
Carry-Forward Mean/Value Reference
The carried ETH VWAP (PD 4 PM) acts as a “value memory” line for the next day. Traders can:
Fade tests away from it in balanced conditions,
Use it as a pullback/acceptance gauge during trends,
Track liquidity grabs when price spikes through and reclaims.
Execution Planning & Risk
Anchor stops/targets around PD H/L and OVN H/M/L for well-defined invalidation.
Combine with your entry model (order-flow, momentum, or pattern) to time fades at range extremes or momentum breaks from OVN mid.
Confluence Mapping
Layer the tool with opening range tools, HTF zones, or profile/VWAPs (weekly/daily) to spot high-quality confluence where multiple references cluster.
Regime & Day-Type Read
Quickly see whether RTH accepts/rejects the OVN range or gravitates to PD VWAP handle, helping classify the day (trend, balanced, double-distribution, etc.).
Quick Start
Apply to your intraday chart (any instrument supported by TradingView; best on ≤15m for live intraday context).
In Current Day group, keep Open and OVN HL on; optionally display the mid.
In Previous Day group, enable PD Open/HL for carry-over levels.
Enable AVWAP if you want live ETH-anchored VWAP and its Bands for distance context.
Keep PD VWAP on to project yesterday’s 4 PM ETH VWAP as a static dashed line into today.
Use the Label group to size/color the on-chart tags.
Settings Overview (Plain-English)
Label: Toggle labels on/off; choose label text color and size.
Current Day:
Open (color/width) — daily open line anchored at ETH open.
OVN HL (and Mid) — overnight high/low and midpoint, locked at 09:30 and extended to 16:00.
AVWAP + Bands — ETH-anchored VWAP with optional 0.5×/1×/2× bands.
Previous Day:
PD Open/HL — yesterday’s daily handles.
PD VWAP — the carried snapshot of yesterday’s 4 PM ETH VWAP projected forward (dashed).
Notes & Best Practices
Time Zone: All session logic is hard-coded to America/New_York and DST-robust. No manual DST tweaks required.
Non-Repainting: The carried PD VWAP line is a snapshot; once drawn, it does not back-fill or mutate.
Intraday Use: Designed for intraday execution. It will display on higher TFs, but the session granularity is most informative at ≤15m.
Performance: Script caps lines/labels (500) and uses short “tails” to keep charts responsive.
Compatibility: Uses request.security(..., "D", series, lookahead_on) intentionally to lock daily handles early for planning; this is by design.
Typical Playbook Examples
Fade Extremes in Balance: As RTH opens inside OVN, look for rejection wicks at OVN High with confluence from PD VWAP handle overhead; risk above OVN High.
Trend Continuation: In directional sessions, acceptances above OVN Mid with price pulling back to the live ETH VWAP can offer continuation entries.
Reversion to Value: Sharp extensions away from the carried PD VWAP that quickly stall often revert to that handle; use it as a target or as an acceptance test.

AlfaBitcoin Dashboard – Estrategia Combinada (Juan + Gael)Integrate the TradingView (TV) indicators with the sessions from October 16 and 21 (Gael Sánchez Smith and Juan Rodríguez). We can build an alert system or dashboard that combines what was discussed in both sessions with your custom indicators on TradingView.

Multi-Condition Alert Builder⚡ Multi-Condition Alert Builder — Modular Alert Framework
The Multi-Condition Alert Builder is a powerful, code-free alert engine for TradingView. It allows traders to build complex multi-condition Buy/Sell alerts using simple dropdown menus — no Pine Script experience required.
Combine up to five separate conditions per side and trigger alerts based on your own custom logic.
🧠 How It Works
Each “Buy” and “Sell” side includes up to five configurable slots, where you can define:
Two data sources (indicators, price, or custom inputs)
A comparison or crossover condition
A static value (optional)
Once your slots are defined, the script combines these individual conditions according to your chosen mode:
Any – triggers when any enabled condition is true
All – same bar – triggers only when all enabled conditions occur on the same bar
All – within bars – allows conditions to complete within a user-defined lookback window
This gives traders fine-grained control to design powerful, adaptive alert logic directly in the chart — no coding required.
⚙️ Key Features
🧩 Up to 5 Buy and 5 Sell Slots – Fully customizable condition slots
🧠 Combine Logic Modes – Any / All / Within Bars flexibility
🔔 Custom Alerts – Generates separate Buy, Sell, or combined alert events
⏱️ Close-Bar Confirmation Option – Avoids premature signals on open candles
💡 Visual Signals – Plots arrows on chart for clear alert visualization
🔄 Indicator-Agnostic – Works with any sources or indicators available in your chart
🧮 Combine Logic Modes Explained
Mode Description
Any Triggers an alert if any active condition is met
All – same bar Requires all active slots to confirm on the same candle
All – within bars Conditions may complete within a set lookback window
🧭 Example Use Cases
Combine RSI, MACD, and MA crossovers for precision entries
Create alert triggers for momentum confluence setups
Build “stacked signal” logic (e.g., RSI < 30 and MACD crossover within 3 bars)
Quickly prototype and test multi-factor alert conditions
🧠 Usage Tip
Once your conditions are set, simply add TradingView alerts tied to:
“BUY↟” for long signals
“SELL↡” for short signals
“ANY ALERT” to trigger on either event
The Alert Builder becomes especially powerful when combined with your favorite custom indicators — enabling smart, automated alerts without extra coding.
⚡ In Short
Build. Combine. Alert.
The Multi-Condition Alert Builder gives you total flexibility to design complex alert logic — visually, intuitively, and efficiently — right on your chart.
RSI VWAP v1 [JopAlgo]RSI VWAP v1.1 made stronger by volume-aware!
We know there's nothing new and the original RSI already does an excellent job. We're just working on small, practical improvements – here's our take: The same basic idea, clearer display, and a single, specially developed rolling line: a VWAP of the RSI that incorporates volume (participation) into the calculation.
Do you prefer the pure classic?
You can still use Wilder or Cutler engines –
but the star here is the VW-RSI + rolling line.
This RSI also offers the possibility of illustrating a possible
POC (Point of Control - or the HAL or VAL) level.
However, the indicator does NOT plot any of these levels itself.
We have included an illustration in the chart for this!
We hope this version makes your decision-making easier.
What you’ll see
The RSI line with a 50 midline and optional bands: either static 70/30 or adaptive μ±k·σ of the Rolling Line.
One smoothing concept only: the Rolling Line (light blue) = VWAP of RSI.
Shadow shading between RSI and the Rolling Line (green when RSI > line, red when RSI < line).
A lighter tint only on the parts of that shadow that sit above the upper band or below the lower band (quick overbought/oversold context).
Simple divergence lines drawn from RSI pivots (green for regular bullish, red for regular bearish). No labels, no buy/sell text—kept deliberately clean.
What’s new, and why it helps
VW-RSI engine (default):
RSI can be computed from volume-weighted up/down moves, so momentum reflects how much traded when price moved—not just the direction.
Rolling Line (VWAP of RSI) with pure VWAP adaptation:
Low volume: blends toward a faster VWAP so early, thin starts aren’t missed.
Volume spikes: blends toward a slower VWAP so a single heavy bar doesn’t whip the curve.
You can reveal the Base Rolling (pre-adaptation) line to see exactly how much adaptation is happening.
Adaptive bands (optional):
Instead of fixed 70/30, use mean ± k·stdev of the Rolling Line over a lookback. Levels breathe with the market—useful in strong trends where static bounds stay pinned.
Minimal, readable panel:
One smoothing, one story. The shadow tells you who’s in control; the lighter highlight shows stretch beyond your lines.
How to read it (fast)
Bias: RSI above 50 (and a rising Rolling Line) → bullish bias; below 50 → bearish bias.
Trigger: RSI crossing the Rolling Line with the bias (e.g., above 50 and crossing up).
Stretch: Near/above the upper band, avoid chasing; near/below the lower band, avoid panic—prefer a cross back through the line.
Divergence lines: Use as context, not as standalone signals. They often help you wait for the next cross or avoid late entries into exhaustion.
Settings that actually matter
RSI Engine: VW-RSI (default), Wilder, or Cutler.
Rolling Line Length: the VWAP length on RSI (higher = calmer, lower = earlier).
Adaptive behavior (pure VWAP):
Speed-up on Low Volume → blends toward fast VWAP (factor of your length).
Dampen Spikes (volume z-score) → blends toward slow VWAP.
Fast/Slow Factors → how far those fast/slow variants sit from the base length.
Bands: choose Static 70/30 or Adaptive μ±k·σ (set the lookback and k).
Visuals: show/hide Base Rolling (ref), main shadow, and highlight beyond bands.
Signal gating: optional “ignore first bars” per day/session if you dislike open noise.
Starter presets
Scalp (1–5m): RSI 9–12, Rolling 12–18, FastFactor ~0.5, SlowFactor ~2.0, Adaptive on.
Intraday (15m–1H): RSI 10–14, Rolling 18–26, Bands k = 1.0–1.4.
Swing (4H–1D): RSI 14–20, Rolling 26–40, Bands k = 1.2–1.8, Adaptive on.
Where it shines (and limits)
Best: liquid markets where volume structure matters (majors, indices, large caps).
Works elsewhere: even with imperfect volume, the shadow + bands remain useful.
Limits: very thin/illiquid assets reduce the benefit of volume-weighting—lengthen settings if needed.
Attribution & License
Based on the concept and baseline implementation of the “Relative Strength Index” by TradingView (Pine v6 built-in).
Released as Open-source (MPL-2.0). Please keep the license header and attribution intact.
Disclaimer
For educational purposes only; not financial advice. Markets carry risk. Test first, use clear levels, and manage risk. This project is independent and not affiliated with or endorsed by TradingView.

Directional Indicator Crossovers v1[JopAlgo]Directional Indicator Crossovers v1 — the classic DMI, made clearer and easier to act on
We'd like to introduce you to a more relaxed, streamlined version of DI. While it may not seem like it at first glance, we've taken the D+/D- method as a starting point and developed our own version of this indicator: two lines, a smooth green/red field indicating who's in control, and clear crossover alerts for a flip. We deliberately chose the step line representation because it closely matches the candlestick patterns on the chart. Designed to help you react faster—without clutter.
What you’ll see
+DI (green) and −DI (red) using classic Wilder smoothing.
A soft control zone between the lines: green when +DI dominates, red when −DI dominates.
Crossover alerts (no labels, no background flooding)—just the turning points.
Why this helps
Instant bias: the shaded field tells you who’s in control without reading values.
Cleaner execution: minimal visuals keep focus on the handoff (+DI↔−DI) and your price levels.
Actionable by design: built-in alerts fire right at the flip to route into your workflow.
How to read it
Bias: Green zone → buyers lead. Red zone → sellers lead.
Trigger: Consider entries on the DI crossover that aligns with your higher-timeframe context (trend, S/R, OB).
Patience in chop: If flips are frequent in tight ranges, wait for sustained zone dominance or confirm on a higher TF.
Exit/flip: Opposite crossover or a clear loss of dominance.
Settings that matter
DI Length (default 14): Higher = calmer, fewer flips. Lower = faster, more signals.
Visuals: Keep the control zone on for quick reads; hide crossover marks if you prefer pure lines.
Alerts: Enable bullish and bearish DI cross alerts; connect to notifications or webhooks as needed.
Starter presets
Intraday (15m–1H): DI Length 12–14 for quicker handoffs.
Swing (4H–1D): DI Length 14–20 for cleaner signals.
Choppy assets: Nudge length higher to dampen noise.
Where it shines (and limits)
Best: Liquid markets (crypto majors, indices, large caps) where handoffs matter.
Works elsewhere: Still useful on slower pairs; extend length for stability.
Limit: Frequent flips in low-range sessions—pair with HTF bias or structure.
Alerts included
Bullish DI Crossover: +DI crosses above −DI.
Bearish DI Crossover: −DI crosses above +DI.
Attribution & License
Built on the Directional Movement Index concept by J. Welles Wilder Jr. (1978).
Independent Pine v6 implementation (not derived from TradingView’s built-in source).
Released as Open Source (MPL-2.0)—please keep the license header intact.
Disclaimer
For educational purposes only; not financial advice. Trading involves risk. Test first, use clear levels, and manage risk. This project is independent and not affiliated with or endorsed by TradingView.
Cycle VTLs – with Scaled Channels "Cycle VTLs – with Scaled Channels" for TradingView plots Valid Trend Lines (VTLs) based on Hurst's Cyclic Theory, connecting consecutive price peaks (downward VTLs) or troughs (upward VTLs) for specific cycles. It uses up to eight Simple Moving Averages (SMAs) (default lengths: 25, 50, 100, 200, 400, 800, 1600, 1600 bars) with customizable envelope bands to detect pivots and draw VTLs, enhanced by optional parallel channels scaled to envelope widths.
Key Features:
Valid Trend Lines (VTLs):
Upward VTLs: Connect consecutive cycle troughs, sloping upward.
Downward VTLs: Connect consecutive cycle peaks, sloping downward.
Hurst’s Rules:
Connects consecutive cycle peaks/troughs.
Must not cross price between points.
Downward VTLs:
No longer-cycle trough between peaks.
Invalid if slope is incorrect (upward VTL not up, downward VTL not down).
Expired VTLs: Historical VTLs (crossed by price) from up to three prior cycle waves.
SMA Cycles:
Eight customizable SMAs with envelope bands (offset × multiplier) for pivot detection.
Channels:
Optional parallel lines around VTLs, width set by channelFactor × envelope half-width.
Pivot Detection:
Fractal-based (pivotPeriod) on envelopes or price (usePriceFallback).
Customization:
Toggle cycles, VTLs, and channels.
Adjust SMA lengths, offsets, colors, line styles, and widths.
Enable centered envelopes, slope filtering, and limit stored lines (maxStoredLines).
Usage in Hurst’s Cyclic TheoryAnalysis:
VTLs identify cycle trends; upward VTLs suggest bullish momentum, downward VTLs bearish.
Price crossing below an upward VTL confirms a peak in the next longer cycle; crossing above a downward VTL confirms a trough.
Trading:
Buy: Price bounces off upward VTL or breaks above downward VTL.
Sell: Price rejects downward VTL or breaks below upward VTL.
Use channels for support/resistance, breakouts, or stop-loss/take-profit levels.
Workflow:
Add indicator on TradingView.
Enable desired cycles (e.g., 50-bar, 1600-bar), adjust pivotPeriod, channelFactor, and showOnlyCorrectSlope.
Monitor VTL crossings and channels for trade signals.
NotesOptimized for performance with line limits.
Ideal for cycle-based trend analysis across markets (stocks, forex, crypto).
Debug labels show pivot counts and VTL status.
This indicator supports Hurst’s Cyclic Theory for trend identification and trading decisions with flexible, cycle-based VTLs and channels.
Use global variable to scale to chart. best results use factors of 2 and double. try 2, 4, 8, 16...128, 256, etc until price action fits 95% in smallest cycle.
LA - MACD EMA BandsOverview of the "LA - MACD EMA Bands" Indicator
For Better view, use this indicator along with "LA - EMA Bands with MTF Dashboard"
The "LA - MACD EMA Bands" is a custom technical indicator written in Pine Script v6 for TradingView. It builds on the traditional Moving Average Convergence Divergence (MACD) oscillator by incorporating additional smoothing via Exponential Moving Averages (EMAs) and Bollinger Bands (BB) applied directly to the MACD line. This creates a multi-layered momentum and volatility tool displayed in a separate pane below the price chart (not overlaid on the price itself).
The indicator allows for customization, such as selecting a different timeframe (for multi-timeframe analysis) and adjusting period lengths. It fetches data from the specified timeframe using request.security with lookahead enabled to avoid repainting issues. The core idea is to provide insights into momentum trends, crossovers, and volatility expansions/contractions in the MACD's behavior, making it suitable for identifying potential trend reversals, continuations, or ranging markets.
Unlike a standard MACD, which focuses primarily on momentum via a single line, signal line, and histogram, this version emphasizes longer-term smoothing and volatility boundaries. It uses visual fills between lines to highlight bullish/bearish conditions, aiding quick interpretation. Below, I'll break down each component, its calculation, visual representation, and practical uses.
Detailed Breakdown of Each Component and Its Uses
MACD Line (Blue Line, Labeled 'MACD Line')
Calculation: This is the core MACD value, computed as the difference between a fast EMA (default length 12) and a slow EMA (default length 144) of the input source (default: close price). The EMAs are calculated on data from the selected timeframe.
Visuals: Plotted as a solid blue line.
Uses:
Measures momentum: When above zero, it indicates bullish momentum (prices rising faster in the short term); below zero, bearish momentum.
Trend identification: Rising MACD suggests strengthening uptrends; falling suggests downtrends.
Divergence spotting: Compare with price action—e.g., if price makes higher highs but MACD makes lower highs, it signals potential bearish reversal (and vice versa for bullish divergence).
In trading: Often used for entry/exit signals when crossing the zero line or other lines in the indicator.
MACD EMA (Red Line, Labeled 'MACD EMA')
Calculation: A 12-period EMA applied to the MACD Line itself.
Visuals: Plotted as a solid red line.
Uses:
Acts as a signal line for the MACD, smoothing out short-term noise.
Crossover signals: When the MACD Line crosses above the MACD EMA, it can signal a bullish buy opportunity; crossing below suggests a bearish sell.
Trend confirmation: Helps filter false signals in choppy markets by requiring confirmation from this slower-moving average.
In trading: Useful for momentum-based strategies, like entering trades on crossovers in alignment with the overall trend.
Fill Between MACD Line and MACD EMA (Green/Red Shaded Area, Titled 'MACD Fill')
Calculation: The area between the MACD Line and MACD EMA is filled with color based on their relative positions.
Color Logic: Green (with 57% transparency) if MACD Line > MACD EMA (bullish); red if MACD Line < MACD EMA (bearish).
Visuals: Semi-transparent fill for easy visibility without overwhelming the lines.
Uses:
Quick visual cue for momentum shifts: Green areas highlight bullish phases; red for bearish.
Enhances readability: Makes crossovers more apparent at a glance, especially in fast-moving markets.
In trading: Can be used to time entries/exits or as a filter (e.g., only take long trades in green zones).
Bollinger Bands on MACD (BB Upper: Black Dotted, BB Basis: Maroon Dotted, BB Lower: Black Dotted)
Calculation: Bollinger Bands applied to the MACD Line.
BB Basis: 144-period EMA of the MACD Line.
BB Standard Deviation: 144-period stdev of the MACD Line.
BB Upper: BB Basis + (2.0 * BB Stdev)
BB Lower: BB Basis - (2.0 * BB Stdev)
Visuals: Upper and lower bands as black dotted lines; basis as maroon dotted
Uses:
Volatility measurement: Bands expand during high momentum volatility (strong trends) and contract during low volatility (ranging or consolidation).
Mean reversion: When MACD Line touches or exceeds the upper band, it may signal overbought conditions (potential sell); lower band for oversold (potential buy).
Squeeze detection: Narrow bands (squeeze) often precede big moves—watch for breakouts.
In trading: Combines momentum with volatility; e.g., a MACD Line breakout above the upper band could confirm a strong uptrend.
BB Basis EMA (Green Line, Labeled 'BB Basis EMA')
Calculation: A 72-period EMA applied to the BB Basis (which is already a 144-period EMA of the MACD Line).
Visuals: Solid green line.
Uses:
Further smoothing: Provides a longer-term view of the MACD's average behavior, reducing noise from the BB Basis.
Trend direction: Acts as a baseline for the BB system—above it suggests bullish bias in momentum volatility; below, bearish.
Crossover with BB Basis: Can signal shifts in volatility trends (e.g., BB Basis crossing above BB Basis EMA indicates increasing bullish volatility).
In trading: Useful for confirming longer-term trends or as a filter for BB-based signals.
Fill Between BB Basis and BB Basis EMA (Gray Shaded Area, Titled 'BB Basis Fill')
Calculation: The area between BB Basis and BB Basis EMA is filled.
Color Logic: Currently set to a constant semi-transparent gray regardless of position.
Visuals: Semi-transparent gray fill.
Uses:
Highlights divergence: Shows when the shorter-term BB Basis deviates from its longer-term EMA, indicating potential volatility shifts.
Visual aid for crossovers: Makes it easier to spot when BB Basis crosses its EMA.
In trading: Could be used to identify overextensions in volatility (e.g., wide gray areas might signal impending mean reversion).
Zero Line (Black Horizontal Line)
Calculation: A simple horizontal line at y=0.
Visuals: Solid black line.
Uses:
Reference point: Divides bullish (above) from bearish (below) territory for all MACD-related lines.
In trading: Crossovers of the zero line by the MACD Line or BB Basis can signal major trend changes.
How It Differs from a Normal MACD
A standard MACD (e.g., the built-in TradingView MACD with defaults 12/26/9) consists of:
MACD Line: EMA(12) - EMA(26).
Signal Line: EMA(MACD Line, 9).
Histogram: MACD Line - Signal Line (bars showing convergence/divergence).
Key differences in "LA - MACD EMA Bands":
Periods: Uses a much longer slow EMA (144 vs. 26), making it more sensitive to long-term trends but less reactive to short-term price action. The MACD EMA is 12 periods (vs. 9), further emphasizing smoothing.
No Histogram: Replaces the histogram with fills and bands for visual emphasis on crossovers and volatility.
Added Bollinger Bands: Applies BB directly to the MACD Line (with a long 144-period basis), introducing volatility analysis absent in standard MACD. This helps detect "squeezes" or expansions in momentum.
Additional EMA Layer: The BB Basis EMA (72-period) adds a secondary smoothing level to the BB system, providing a hierarchical view of momentum (short-term MACD → mid-term BB → long-term EMA).
Multi-Timeframe Support: Built-in option for higher timeframes, unlike basic MACD.
Focus: Standard MACD is purely momentum-focused; this version integrates volatility (via BB) and multi-layer smoothing, making it better for trend-following in volatile markets but potentially overwhelming for beginners.
Overall, this indicator transforms the MACD from a simple oscillator into a comprehensive momentum-volatility hybrid, reducing false signals in trending markets but introducing lag.
Overall Pros and Cons
Pros:
Enhanced Visualization: Fills and bands make trends, crossovers, and volatility easier to spot without needing multiple indicators.
Reduced Noise: Longer periods (144, 72) smooth out whipsaws, ideal for swing or position trading in trending assets like stocks or forex.
Volatility Integration: BB adds a dimension not in standard MACD, helping identify breakouts or consolidations.
Customizable: Inputs for timeframes and lengths allow adaptation to different assets/timeframes.
Multi-Layered Insights: Combines short-term signals (MACD crossovers) with long-term confirmation (BB EMA), improving signal reliability.
Cons:
Lagging Nature: Long periods (e.g., 144) delay signals, missing early entries in fast markets or leading to late exits.
Complexity: Multiple lines and fills can clutter the pane, requiring experience to interpret; beginners might misread it.
Potential Overfitting: Custom periods (12/144/12/144/72) may work well on historical data but underperform in live trading without backtesting.
No Built-in Alerts/Signals: Relies on visual interpretation; users must manually set alerts for crossovers.
Resource Intensive: On lower timeframes or with lookahead, it might slow chart loading on Trading View.
This indicator shines in strategies combining momentum and volatility, like trend-following with BB squeezes, but test it on your assets (e.g., via backtesting) to ensure it fits your style.
For Better view, use this indicator along with "LA - EMA Bands with MTF Dashboard"

Normalized Portfolio TrackerThis script lets you create, visualize, and track a custom portfolio of up to 15 assets directly on TradingView.
It calculates a synthetic "portfolio index" by combining multiple tickers with user-defined weights, automatically normalizing them so the total allocation always equals 100%.
All assets are scaled to a common starting point, allowing you to compare your portfolio’s performance versus any benchmark like SPY, QQQ, or BTC.
🚀 Goal
This script helps traders and investors:
• Understand the combined performance of their portfolio.
• Normalize diverse assets into a single synthetic chart .
• Make portfolio-level insights without relying on external spreadsheets.
🎯 Use Cases
• Backtest your portfolio allocations directly on the chart.
• Compare your portfolio vs. benchmarks like SPY, QQQ, BTC.
• Track thematic baskets (commodities, EV supply chain, regional ETFs).
• Visualize how each component contributes to overall performance.
📊 Features
• Weighted Portfolio Performance : Combines selected assets into a synthetic value series.
• Base Price Alignment : Each asset is normalized to its starting price at the chosen date.
• Dynamic Portfolio Table : Displays symbols, normalized weights (%), equivalent shares (based on each asset’s start price, sums to 100 shares), and a total row that always sums to 100%.
• Multi-Asset Support : Works with stocks, ETFs, indices, crypto, or any TradingView-compatible symbol.
⚙️ Configuration
Flexible Portfolio Setup
• Add up to 15 assets with custom weight inputs.
• You can enter any arbitrary numbers (e.g. 30, 15, 55).
• The script automatically normalizes all weights so the total allocation always equals 100%.
Start Date Selection
• Choose any custom start date to normalize all assets.
• The portfolio value is then scaled relative to the main chart symbol, so you can directly compare portfolio performance against benchmarks like SPY or QQQ.
Chart Styles
• Candlestick chart
• Heikin Ashi chart
• Line chart
Custom Display
• Adjustable colors and line widths
• Optionally display asset list, normalized weights, and equivalent shares
⚙️ How It Works
• Fetch OHLC data for each asset.
• Normalizes weights internally so totals = 100%.
• Stores each asset’s base price at the selected start date.
• Calculates equivalent “shares” for each allocation.
• Builds a synthetic portfolio value series by summing weighted contributions.
• Renders as Candlestick, Heikin Ashi, or Line chart.
• Adds a portfolio info table for clarity.
⚠️ Notes
• This script is for visualization only . It does not place trades or auto-rebalance.
• Weight inputs are automatically normalized, so you don’t need to enter exact percentages.

Fiery River### Description of the "Fiery River" (FR) Indicator
**Overview of the Indicator**
"Fiery River" (abbreviated as FR) is a technical indicator for TradingView, written in Pine Script version 6. It's designed for traders who incorporate Fibonacci levels with moving averages to analyze support and resistance zones. The indicator dynamically plots levels based on a selected moving average (MA) and Fibonacci multipliers, displaying them on the current timeframe and an additional secondary timeframe. This helps visualize potential reversal or continuation points, making analysis more comprehensive. The name "Fiery River" evokes a "fiery" flow of levels that "stream" across the chart, adapting to price movements. 🔥
**Key Features**
- **Level Construction**: The indicator calculates a moving average (EMA, SMA, WMA, RMA, or HMA) from the closing price and multiplies it by specified Fibonacci coefficients (0.618, 0.5, 0.382, 0.27, 0.18 for "long" levels and 1.618, 1.5, 1.382 for "short" levels). This creates 10 lines: 5 for the current timeframe (fully visible) and 5 for the secondary timeframe (with semi-transparency for distinction).
- **Color Scheme**: Levels are colored in gray, red, orange, and green, with additional "short" variants for extensions.
- **Fills**: Green fills are added between level pairs to highlight areas of interest, making the chart more visually intuitive.
- **Alerts**: Automatic notifications when the price touches levels (e.g., "Price touches Red line"), helping you stay on top of key moments.
- **Multi-Timeframe Support**: Incorporates a secondary timeframe (e.g., daily if the main is hourly) for comparing levels across different scales.
**How to Use**
1. Add the indicator to your chart in TradingView.
2. Customize settings in the panel: Select MA type, period (default 89), secondary timeframe, and Fibonacci coefficients.
3. Analyze levels as potential entry/exit points: Gray and red for stronger zones, green for weaker ones. Use fills to identify ranges.
4. Enable alerts for real-time signals.
It's ideal for strategies based on Fibonacci and trends, but always combine with other tools for confirmation. 📈
**Advantages and Limitations**
- **Pros**: Highly customizable, visually clear, supports multiple MA types and timeframes. Great for scalping and swing trading.
- **Cons**: Can create a lot of lines on the chart, potentially overwhelming if not managed. May require testing for optimal settings on volatile assets.
If you need any adjustments, more details, or help with the code, just let me know! 😊
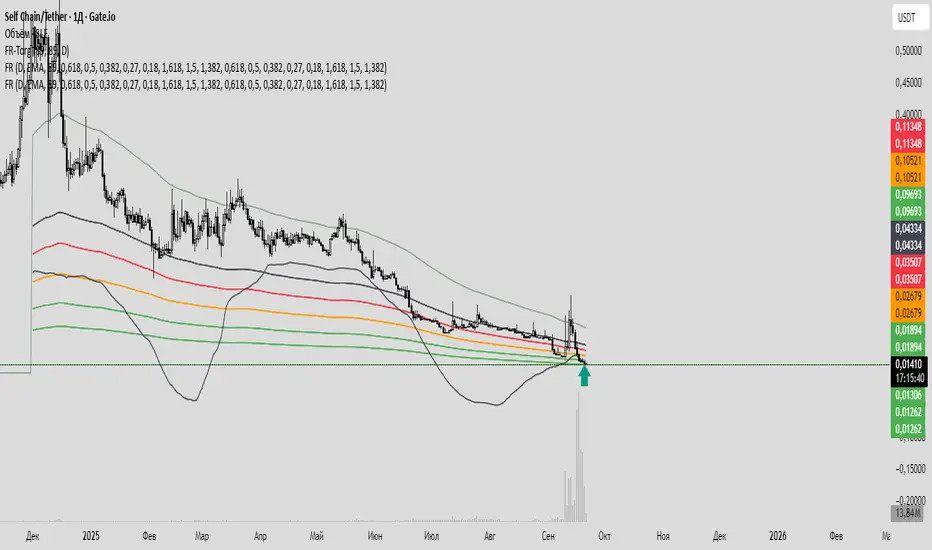
MEMEC - Meme Coin Market Cap [Da_Prof]For this indicator, the meme coin market cap of the top meme coins are added together to get an estimate of the total meme coin market cap back to the first meme coin, DOGE. Meme.C does this natively on TradingView, but its data only goes back to 19 May 2025. For the indicator, MEME.C supersedes the addition of all the individual meme coins (i.e., from 19 May 2025 to present). The start of MEME.C is labeled on the chart by default, but can be removed by deselecting the label in the settings.
After the creation of DOGE, but before data is available for Meme.C, the highest market cap meme coins are added together to estimate the meme coin market cap. The meme coins used by default are DOGE, SHIB, PEPE, BONK, FLOKI, PENGU, TRUMP, SPX6900, FARTCOIN, WIF, M, BRETT, B, MOG, APE, TURBO, DOG, and POPCAT. Users can select if they wish to disregard any or all of these coins. As of the creation of the indicator, DOGE, SHIB, and PEPE have CRYPTOCAP symbols on TradingView. Therefore, the true market cap of these coins is integrated into this indicator. The other meme coin market caps are estimated using price and the circulating supply as of 09/16/2025. I make no claims as to the indicator's exact accuracy. In fact, it isn't exactly accurate since I utilized the circulating supply on the day it was created, so for meme coins that have a changing supply, the market cap will be at least slightly inaccurate. Use this indicator at your own risk.
To use the indicator, it is best to plot overlayed on the CRYPTOCAP:DOGE chart. You can decide whether or not to hide the DOGE market cap.
Expected Value Monte CarloI created this indicator after noticing that there was no Expected Value indicator here on TradingView.
The EVMC provides statistical Expected Value to what might happen in the future regarding the asset you are analyzing.
It uses 2 quantitative methods:
Historical Backtest to ground your analysis in long-term, factual data.
Monte Carlo Simulation to project a cone of probable future outcomes based on recent market behavior.
This gives you a data-driven edge to quantify risk, and make more informed trading decisions.
The indicator includes:
Dual analysis: Combines historical probability with forward-looking simulation.
Quantified projections: Provides the Expected Value ($ and %), Win Rate, and Sharpe Ratio for both methods.
Asset-aware: Automatically adjusts its calculations for Stocks (252 trading days) and Crypto (365 days) for mathematical accuracy.
The projection cone shows the mean expected path and the +/- 1 standard deviation range of outcomes.
No repainting
Calculation:
1. Historical Expected Value:
This is a systematic backtest over thousands of bars. It calculates the return Rᵢ for N past trades (buy-and-hold). The Historical EV is the simple average of these returns, giving a baseline performance measure.
Historical EV % = (Σ Rᵢ) / N
2. Monte Carlo Projection:
This projection uses the Geometric Brownian Motion (GBM) model to simulate thousands of future price paths based on the market's recent behavior.
It first measures the drift (μ), or recent trend, and volatility (σ), or recent risk, from the Projection Lookback period. It then projects a final return for each simulation using the core GBM formula:
Projected Return = exp( (μ - σ²/2)T + σ√T * Z ) - 1
(Where T is the time horizon and Z is a random variable for the simulation.)
The purple line on the chart is the average of all simulated outcomes (the Monte Carlo EV). The cone represents one standard deviation of those outcomes.
The dashed lines represent one standard deviation (+/- 1σ) from the average, forming a cone of probable outcomes. Roughly 68% of the simulated paths ended within this cone.
This projection answers the question: "If the recent trend and volatility continue, where is the price most likely to go?"
Here's how to read the indicator
Expected Value ($/%): Is my average trade profitable?
Win Rate: How often can I expect to be right?
Sharpe Ratio: Am I being adequately compensated for the risk I'm taking?
User Guide
Max trade duration (bars): This is your analysis timeframe. Are you interested in the probable outcome over the next month (21 bars), quarter (63 bars), or year (252 bars)?
Position size ($): Set this to your typical trade size to see the Expected Value in real dollar terms.
Projection lookback (bars): This is the most important input for the Monte Carlo model. A short lookback (e.g., 50) makes the projection highly sensitive to recent momentum. Use this to identify potential recency bias. A long lookback (e.g., 252) provides a more stable, long-term projection of trend and volatility.
Historical Lookback (bars): For the historical backtest, more data is always better. Use the maximum that your TradingView plan allows for the most statistically significant results.
Use TP/SL for Historical EV: Check this box to see how the historical performance would have changed if you had used a simple Take Profit and Stop Loss, rather than just holding for the full duration.
I hope you find this indicator useful and please let me know if you have any suggestions. 😊

IV Rank (tasty-style) — VIXFix / HV ProxyIV Rank (tasty-style) — VIXFix / HV Proxy
Overview
This indicator replicates tastytrade’s IV Rank calculation—but built entirely inside TradingView.
Because TradingView does not expose live option-chain implied volatility, the script lets you choose between two widely used price-based IV proxies:
VIXFix (Williams VIX Fix): a fast-reacting volatility estimate derived from price extremes.
HV(30): 30-day annualized historical volatility of daily log returns.
The goal is to approximate the “rich vs. cheap” option volatility environment that traders use to decide whether to sell or buy premium.
Formula
IV Rank answers the question: Where is current implied volatility relative to its own 1-year range?
𝐼
𝑉
𝑅
=
𝐼
𝑉
𝑐
𝑢
𝑟
𝑟
𝑒
𝑛
𝑡
−
𝐼
𝑉
1
𝑦
𝐿
𝑜
𝑤
𝐼
𝑉
1
𝑦
𝐻
𝑖
𝑔
ℎ
−
𝐼
𝑉
1
𝑦
𝐿
𝑜
𝑤
×
100
IVR=
IV
1yHigh
−IV
1yLow
IV
current
−IV
1yLow
×100
IVcurrent: Current value of the chosen IV proxy.
IV1yHigh/Low: Highest and lowest proxy values over the user-defined lookback (default 252 trading days ≈ 1 year).
IVR = 0 → Current IV equals its 1-year low
IVR = 100 → Current IV equals its 1-year high
IVR ≈ 50 → Current IV sits mid-range
How to Use
High IV Rank (≥50–60%)
Options are relatively expensive → short-premium strategies (credit spreads, iron condors, straddles) may be more attractive.
Low IV Rank (≤20%)
Options are relatively cheap → long-premium strategies (debit spreads, calendars, diagonals) may offer better risk/reward.
Combine with your own analysis, liquidity checks, and risk management.
Inputs & Customization
IV Source: Choose “VIXFix” or “HV(30)” as the volatility proxy.
IVR Lookback: Rolling window for 1-year high/low (default 252 trading days).
VIXFix Parameters: Length and stdev multiplier to fine-tune sensitivity.
Info Label: Optional on-chart label displays current IV proxy, 1-year high/low, and IV Rank.
Alerts: Optional alerts when IVR crosses 50, falls below 20, or rises above 80.
Notes & Limitations
This indicator does not pull real option-chain IV.
It provides a close structural analogue to tastytrade’s IV Rank using price-derived proxies for markets where options data is not directly available.
For live option IV, use broker platforms or third-party data feeds alongside this script.
Tags: IV Rank, Implied Volatility, Tastytrade, VIXFix, Historical Volatility, Options, Premium Selling, Debit Spreads, Market Volatility

Intelligent Currency Breakout ChannelIndicator: Intelligent Currency Breakout Channel
This document provides a detailed explanation of the "Intelligent Currency Breakout Channel" indicator for TradingView.
1. Overview
The Intelligent Currency Breakout Channel is an advanced technical analysis tool designed to identify periods of price consolidation and signal potential breakouts. It automatically draws channels around ranging price action and utilizes sophisticated volume analysis to provide deeper insights into market sentiment. The indicator also includes a built-in logarithmic regression screener to help traders align their breakout signals with the broader market trend.
2. Key Features
Automatic Channel Detection: The indicator identifies periods of low volatility and automatically draws a containing channel (box) around the price action.
Breakout Signals: It generates clear visual alerts (▲ for bullish, ▼ for bearish) when the price closes decisively outside of a channel.
In-Depth Volume Analysis: Within each channel, the indicator plots volume as candlestick-like bars, offering three distinct modes: Total Volume, Buy/Sell Comparison, and Volume Delta. This helps traders gauge the strength and conviction behind price movements.
Real-time Sentiment Gauge: When a channel is active, a dynamic color-graded gauge appears on the right side of the chart. It visualizes the current volume delta momentum relative to its recent range, offering an at-a-glance sentiment reading.
Integrated Trend Screener: A secondary analysis tool based on logarithmic regression is included to determine the underlying trend direction (Up, Down, or Neutral), which can be used to filter breakout signals.
Fully Customizable: Users can extensively customize all parameters, from calculation lengths and breakout sensitivity to the visual appearance of every component.
3. How to Use
Channel Formation: Watch for the indicator to draw a new channel. This signifies that the market is in a consolidation or ranging phase. The formation of a channel itself can be an alertable event.
Volume Interpretation: Observe the volume bars inside the channel. An increase in volume as the price approaches the channel's upper or lower boundary can foreshadow a potential breakout. Use the Volume Display Mode to analyze if buying pressure (Comparison, Delta) or selling pressure is building.
Breakout Confirmation: A bullish breakout signal (▲) appears when the price closes above the channel's upper boundary. A bearish breakout signal (▼) appears when the price closes below the lower boundary. For higher-quality signals, enable the Strong Closes Only option.
Trend Confirmation (Screener): Use the screener's plot and background color to confirm the broader trend. For instance, you might choose to only take bullish breakout signals when the screener indicates an uptrend (green background) and bearish signals when it indicates a downtrend (red background).
Sentiment Gauge: The pointer on the gauge indicates current momentum. A pointer in the upper (green) section suggests bullish pressure, while a pointer in the lower (red) section suggests bearish pressure. This can provide additional confluence for a trade decision.
4. Settings and Inputs
Main Settings
Overlap Channels: If enabled, allows multiple channels to be drawn on the chart simultaneously, even if they overlap. When disabled, a new channel will only form if it doesn't intersect with an existing one.
Strong Closes Only: If enabled, a breakout is only triggered if the midpoint of the candle's body (average of open and close) is outside the channel. This helps filter out false signals caused by long wicks. If disabled, any close outside the channel triggers a breakout.
Normalization Length: The lookback period (in bars) used for price normalization. A higher value creates a more stable normalization but may be slower to react to recent price changes.
Box Detection Length: The lookback period used to detect the channel formation pattern. A lower value will result in more frequent channels but may be more sensitive to noise. A higher value will result in fewer, but potentially more significant, channels.
Volume Analysis
Show Volume Analysis: Toggles the visibility of the candlestick-like volume bars inside the channel.
Volume Display Mode:
Volume: Displays total volume as symmetrical bars around the channel's midline.
Comparison: Shows buying volume (green) above the midline and selling volume (red) below it.
Delta: Shows the net difference between buying and selling volume. Positive delta is shown above the midline, and negative delta is shown below.
Volume Delta Timeframe Source: The timeframe from which to source volume data for calculations. Using a lower timeframe can provide a more granular view of volume dynamics.
Volume Scaling: A multiplier that adjusts the vertical size of the volume bars relative to the channel's height.
Appearance
Volume Text Size: Sets the size of the volume data text displayed in the corners of the channel. Options: Tiny, Small, Medium, Large.
Bullish Color: The primary color for all bullish visual elements, including breakout signals and positive volume bars.
Bearish Color: The primary color for all bearish visual elements, including breakout signals and negative volume bars.
Screener Settings
Lookback Period: The number of bars used for the logarithmic regression calculation to determine the trend.
Screener Type:
Log Regression Channel: The signal is based on the slope of the entire regression channel over the lookback period. An upward sloping channel is bullish (1), and a downward sloping one is bearish (-1).
Logarithmic Regression: The signal is based on the most recent value of the regression line compared to its value 3 bars ago. This provides a more responsive measure of the immediate trend.
5. Alerts
You can set up the following alerts through the TradingView alerts panel:
New Channel Formed: Triggers when a new price consolidation channel is detected and drawn on the chart.
Bullish Breakout: Triggers when the price breaks out and closes above the upper boundary of a channel.
Bearish Breakout: Triggers when the price breaks out and closes below the lower boundary of a channel.
Is In Channel: Triggers on every bar that the price is currently trading inside an active channel.
Signal UP: Triggers when the Screener's signal turns bullish (1).
Signal DOWN: Triggers when the Screener's signal turns bearish (-1).
