Moving 50% Level TrackerIntroducing the Moving 50% Midpoint Indicator – A Game-Changer for Your Trading Strategy!
Are you looking for a simple yet powerful tool to enhance your trading? The Moving 50% Midpoint Indicator is designed to dynamically track the fair value of the market, giving you an edge in identifying key areas of support and resistance.
🔹 How It Works:
- This indicator calculates the midpoint between the daily high and low and only updates when a new high or low is formed.
- It resets at the start of each trading day, ensuring fresh and relevant levels.
- The line acts as a dynamic equilibrium, showing where buyers and sellers agree on price.
🔹 Why Use It?
Identify Premium & Discount Zones – When price is above the line, the market is in premium, indicating a potential sell zone. When price is below, it's in discount, signaling a potential buy zone.
Reliable Support & Resistance – The midpoint naturally serves as strong support/resistance, helping traders anticipate reversals and trend continuations.
Works in Any Market – Whether you trade stocks, forex, crypto, or futures, this indicator is a must-have for price action traders.
💡 Stop guessing where the market is balanced! Use the Moving 50% Midpoint Indicator to refine your entries, exits, and overall market bias.
스크립트에서 "track"에 대해 찾기

HTF FVG and Wick Fill trackingImbalances in the charts are some of the clearest and most traded price areas. Two of the best and most used are fair value gaps FVGs and large candle wicks. In both of these price appears to move in such a way that most are left behind having 'missed' the move. But in reality price will often come back to these price points to re-balance and absorb the liquidity that was left behind.
This indicator takes these areas and makes viewing and tracking them clearer than ever. It does this, by first allowing the user to overlay a higher timeframe candle on the current chart. This in itself provides an in depth look at a higher timeframe candle both as it forms and in its final form.
Next the indicator identifies either the FVG or large wicks, on the chosen higher timeframe, all while the chart remains on a lower timeframe. As seen here the fair value gaps are clearly highlighted, taken from a 4 hour timeframe, while the actual chart is on 15 minutes. This allows the user even greater accuracy in identifying their key trading areas.
Utilizing the indicators unique feature, these areas can optionally be extended forward to the current timeframe and 'filled' in realtime. Areas that are filled to the users defined level, will be removed from the chart.
With supplementary settings for how much history to show, how large of a wick should be highlighted and complete control over the colour scheme, users will be able to track and understand the filling of imbalances like never before.

Multi-Timeframe RSI Tracker by Ox_kaliThis script, is trend Tracker that serves as an analytical tool for assessing market trends through the lens of the Relative Strength Index (RSI) across multiple timeframes. It caters to individuals who require a detailed examination of market dynamics, leveraging the RSI to gauge the strength and direction of market momentum.
Functionality Overview:
Multi-Timeframe Analysis: The script evaluates the RSI across an array of timeframes, from 1 minute up to 1 week. This diverse range allows for a comprehensive view of market trends, accommodating strategies that span from intraday to long-term analysis.
RSI Trend Interpretation: It utilizes the RSI to determine market trends. Specifically, an RSI value above 50 signals a bullish trend, indicating that positive momentum is prevailing. Conversely, an RSI below 50 suggests a bearish trend, marking a period of negative momentum. This simple yet effective method provides a quick way to assess the market’s direction.
Customization and Flexibility: Users can customize the appearance of trend lines with different colors to distinguish between bullish and bearish trends easily. Furthermore, the script includes options to select which timeframes are displayed, allowing users to tailor the analysis to their specific needs.
Average Trend Indicator: A important feature is the calculation of an average trend across all selected timeframes. This aggregated trend gives a summarized view of the overall market direction, offering an additional layer of insight.
Adjustments and Enhancements:
User-Controlled Settings: Beyond the pre-defined color themes (Normal, Modern, Classic, Robust, Accented, Monochrome), the script introduces a user-defined option for maximum customization. This feature empowers users to set their preferred colors for various trend conditions.
Label Positioning and RSI Period Customization: The script provides inputs for adjusting label positions and setting the RSI period, enabling a personalized and clear charting experience.
Detailed Timeframe Analysis: The inclusion of a wide range of timeframes ensures that users can conduct a detailed examination of market behaviors, facilitating informed decision-making.
Operational Note:
The Multi-Timeframe RSI Tracker is a tool designed to supplement market analysis within a comprehensive trading strategy. It is crucial for users to integrate this tool within a framework that includes risk management and to familiarize themselves with its functionalities through testing and practice. By offering a detailed perspective on market trends through RSI analysis, this script by Ox_kali provides valuable insights, aiding users in navigating the complexities of the financial markets with an informed approach.
Please note that the MTEMA-Tracker is not a guarantee of future market performance and should be used in conjunction with proper risk management. Always ensure that you have a thorough understanding of the indicator’s methodology and its limitations before making any investment decisions. Additionally, past performance is not indicative of future results.

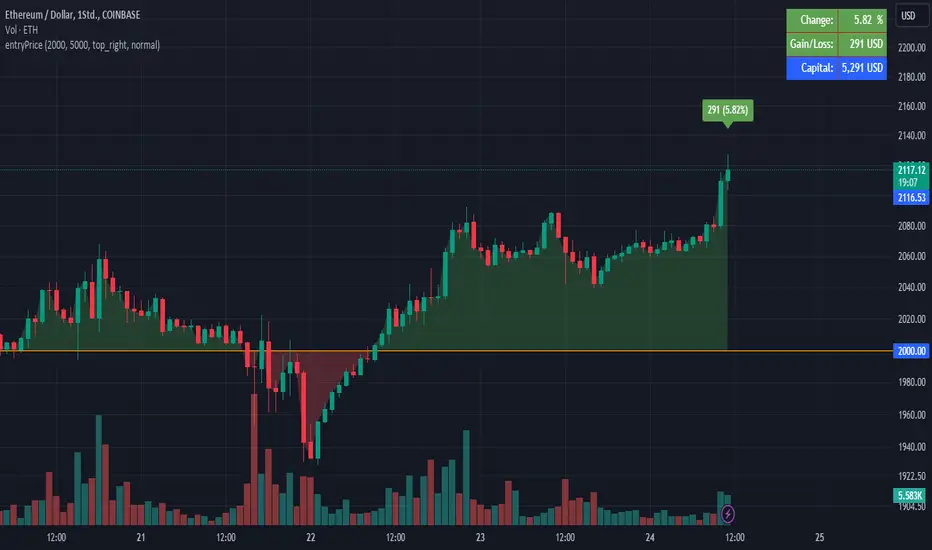
EntryPrice Gain&Loss IndicatorThis indicator takes (1) an entry price or average position price and (2) position size (denominator) to calculate current gain or loss and returns those as well as the position change in percent. It will also draw into the Chart and show relevant data in a table.
It is mainly supposed to help tracking an (average) spot position easily.
It is recommended to switch it to invisible when switching to other charts.
You can also use several instances of the indicator to track your positions in different assets.
Features:
- table position and text size can be adjusted
- colors can be changed
(recommending 25% opacity for plot backgrounds)
- several instances possible
(recommended to tuen indicator invisible when switching to other charts or analyzing
Version 1.0
Pivot TrackerThis script finds swing lows and swing highs based on input criteria for lookback and lookforward periods, and plots letters accordingly.
Helps identify trend or lacktherof
HH = higher high
LH = lower high
HL = higher low
LL = lower low

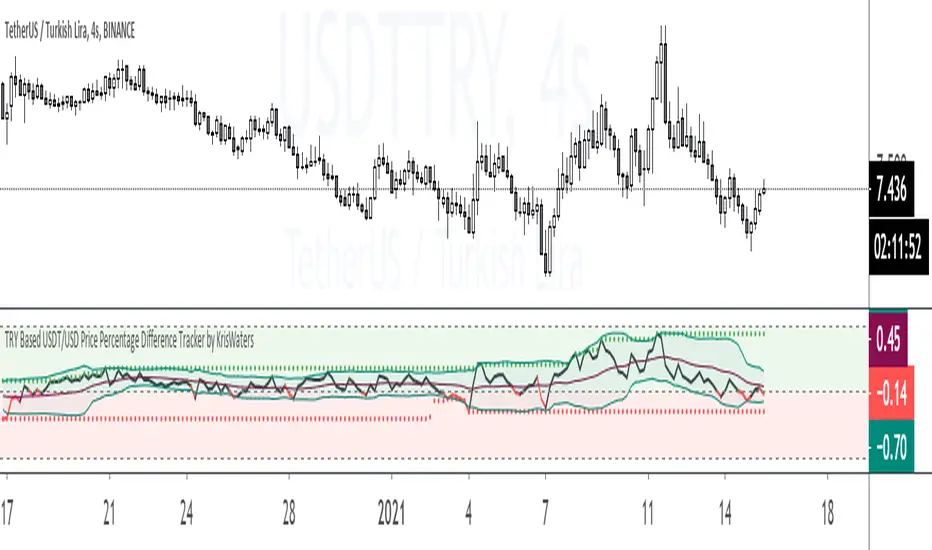
TRY Based USDT/USD Price Percentage Difference TrackerIndicator helps you that track the price percentage difference between USDT/TRY and USD/TRY market pairs.
Tether Market Cap - {Cross-Exchange} Tether Market Cap Indicator
Keep track of tether movements cross exchange & total market cap in real-time.
Never miss a movement in the Tether market.
How it works
Starts by selecting the security "CRYPTOCAP:USDT" with, period, close,
The script will then call on each exchange listed to get the usdt_supply from each exchange.
It will then print the data to the indicator as such:
Yellow = Total Tether Market Cap
Orange = Kraken Supply USDT
Red = Poloniex Supply USDT
Green = Bitfinex Supply USDT

Volume Price ROC Tracker and Shadow CandlesWhen price goes up on negative volume, then market is telling there is doubts in investors mind.
The SPX upside recent month was a on. Lower volume so, the rally in my view will not last. Read my articles on current market.
This very simple scripts shows if price drop or gain was on a upside volume or down side. It is a visual track on the candle reflecting the volume ROC overlapped as a price movement on the actual candle. So don't mistake it with a moving average. Red means volume was down even if price has gone up. Basically if a price goes up on a increase ROC volume then you can trust it. Otherwise it is likely that it won't last.
If you can improve on this idea, it would be great. I think there is not enough volume related scripts that diggs a bit deeper to describe the market behaviour in the future. After all all technical analysis are supposed to tell us about future price not just how it was in the past.

ICT Macro Tracker - Study Version (Original by toodegrees)This indicator is a modified study version of the ICT Algorithmic Macro Tracker by toodegrees, based on the original open-source script available at The original indicator plots ICT Macro windows on the chart, corresponding to specific time [ periods when the Interbank Price Delivery Algorithm undergoes checks/instructions (aka "macros") for the price engine to reprice to an area of liquidity or inefficiency.
This study version adds functionality to hide bars outside macro periods. When enabled, the indicator draws boxes that cover the full chart height during non-macro periods, obscuring those bars so only macro periods are visible. This helps focus on macro-only price action. The feature is configurable, allowing users to enable or disable it and customize the box color. All original functionality remains intact.

Red to Green / Green to Red Tracker# Red to Green / Green to Red Tracker - Quick Reference
## Core Concept
```
PRIOR CLOSE = Yesterday's closing price = The "zero line" for today
Above Prior Close = 🟢 GREEN (profitable for yesterday's buyers)
Below Prior Close = 🔴 RED (losing for yesterday's buyers)
```
---
## The Two Key Moves
### 🟢 Red to Green (R2G)
```
OPEN: Below prior close (RED)
↓
CROSS: Price moves above prior close
↓
RESULT: Now GREEN - Bullish signal
```
**Why it matters:**
- Bears who shorted get squeezed
- Creates FOMO buying
- Momentum often continues
---
### 🔴 Green to Red (G2R)
```
OPEN: Above prior close (GREEN)
↓
CROSS: Price moves below prior close
↓
RESULT: Now RED - Bearish signal
```
**Why it matters:**
- Longs who bought get trapped
- Triggers stop losses
- Panic selling follows
---
## Signals Explained
| Signal | Shape | Location | Meaning |
|--------|-------|----------|---------|
| R2G | ▲ Green Triangle | Below bar | Crossed to green |
| G2R | ▼ Red Triangle | Above bar | Crossed to red |
---
## Level Lines
| Line | Color | Style | What It Is |
|------|-------|-------|------------|
| Prior Close | Orange | Solid | KEY R2G/G2R level |
| Prior High | Green | Dashed | Yesterday's high |
| Prior Low | Red | Dashed | Yesterday's low |
| Today Open | White | Dotted | Gap reference |
---
## Info Table Reference
| Field | What It Shows |
|-------|---------------|
| Status | 🟢 GREEN / 🔴 RED / ⚪ FLAT |
| Day Change | % change from prior close |
| Prior Close | The key level price |
| Distance | How far from prior close |
| Opened | Did today open green or red |
| R2G | R2G status + price if triggered |
| G2R | G2R status + price if triggered |
| Rel Vol | Current relative volume |
| Prior High | Yesterday's high + distance |
| Prior Low | Yesterday's low + distance |
---
## Trading R2G (Long Setup)
### Entry Checklist
- Stock opened RED (below prior close)
- R2G cross signal triggered (green triangle)
- Volume confirmation (1.5x+ preferred, 2x+ ideal)
- Price holding above prior close
- Overall market not tanking
### Entry Method
1. **Aggressive:** Enter immediately on R2G cross
2. **Conservative:** Wait for pullback to prior close (now support)
### Stop Loss
- Below the R2G cross candle low
- OR below prior close (tighter)
### Target
- Prior day high (first target)
- 2:1 risk-reward minimum
---
## Trading G2R (Short Setup)
### Entry Checklist
- Stock opened GREEN (above prior close)
- G2R cross signal triggered (red triangle)
- Volume confirmation
- Price staying below prior close
- Overall market not ripping
### Entry Method
1. **Aggressive:** Enter immediately on G2R cross
2. **Conservative:** Wait for bounce to prior close (now resistance)
### Stop Loss
- Above the G2R cross candle high
- OR above prior close (tighter)
### Target
- Prior day low (first target)
- Gap fill (if gapped up)
---
## Signal Quality
### High Quality R2G ✓
- Opened significantly red (-2% or more)
- Strong volume on cross (2x+)
- First R2G of the day
- Market trending up
- News catalyst present
### Low Quality R2G ✗
- Opened barely red (-0.5%)
- Low volume cross
- Multiple R2G/G2R already today (choppy)
- Fighting market direction
- No clear catalyst
---
## Common Patterns
### Clean R2G (Best)
```
Open red → Steady climb → Cross prior close → Continue higher
```
### Failed R2G (Avoid/Exit)
```
Open red → Cross to green → Immediately fail back to red
```
### Choppy R2G/G2R (Avoid)
```
Multiple crosses back and forth = Indecision, no clear direction
```
---
## First Cross Rule
**The FIRST R2G or G2R of the day is usually the most significant.**
Why?
- Catches traders off guard
- Largest reaction from market
- Sets tone for rest of day
If you miss the first cross, be more selective on subsequent crosses.
---
## Volume Guide
| Rel Volume | Quality | Action |
|------------|---------|--------|
| < 1.0x | Weak | Skip or small size |
| 1.0-1.5x | Average | Standard position |
| 1.5-2.0x | Good | Full position |
| 2.0x+ | Strong | High conviction |
---
## Settings Recommendations
### Default (Balanced)
```
Require Opposite Open: ON
Require Volume: ON (1.5x)
Candle Close Confirm: OFF
Min Cross %: 0
```
### Conservative (Fewer, Better Signals)
```
Require Opposite Open: ON
Require Volume: ON (2.0x)
Candle Close Confirm: ON
Min Cross %: 0.5
```
### Aggressive (More Signals)
```
Require Opposite Open: OFF
Require Volume: OFF
Candle Close Confirm: OFF
Min Cross %: 0
```
---
## Alert Setup
### Essential Alerts
1. **First R2G of Day** - Highest value alert
2. **R2G with Strong Volume** - High conviction
### How to Set
1. Right-click chart → Add Alert
2. Condition: R2G/G2R Tracker
3. Select alert type
4. Set notification method
---
## Combining with Other Indicators
| Indicator | How to Use |
|-----------|------------|
| **Gap & Go** | R2G on gap-down stock = strong reversal |
| **Bull Flag** | Look for bull flag after R2G confirmation |
| **Float Rotation** | R2G + high rotation = explosive potential |
| **VWAP** | R2G above VWAP = strongest setup |
---
## Common Mistakes
❌ **Chasing late R2G**
- If price is already 3-5% green, you missed the move
- Wait for pullback or next setup
❌ **Ignoring volume**
- Low volume R2G often fails
- Always check relative volume
❌ **Fighting the market**
- R2G in a tanking market often fails
- G2R in a ripping market often fails
❌ **No stop loss**
- Failed R2G can reverse hard
- Always have a defined stop
❌ **Overtrading choppy stocks**
- Multiple R2G/G2R = no clear direction
- Skip stocks that keep crossing back and forth
---
## Quick Decision Framework
```
1. Did it open opposite color? (Red for R2G, Green for G2R)
- NO → Lower probability, be cautious
- YES → Continue
2. Is volume confirming? (1.5x+ relative volume)
- NO → Skip or small size
- YES → Continue
3. Is this the first cross of the day?
- YES → Higher probability
- NO → Be more selective
4. Is market direction supportive?
- NO → Skip
- YES → Take the trade
5. Can you define risk? (Clear stop level)
- NO → Skip
- YES → Execute
```
---
## Key Takeaways
1. **Prior close is THE key level** - everyone watches it
2. **First cross matters most** - sets daily tone
3. **Volume confirms** - low volume crosses often fail
4. **Failed crosses reverse hard** - always use stops
5. **Don't overtrade choppy action** - multiple crosses = stay out
---
Happy Trading! 🟢🔴

Volume Delta Pressure Tracker by GSK-VIZAG-AP-INDIA📢 Title:
Volume Delta Pressure Tracker by GSK-VIZAG-AP-INDIA
📝 Short Description (for script title box):
Real-time volume pressure tracker with estimated Buy/Sell volumes and Delta visualization in an Indian-friendly format (K, L, Cr).
📃 Full Description
🔍 Overview:
This indicator estimates buy and sell volumes using candle structure (OHLC) and displays a real-time delta table for the last N candles. It provides traders with a quick view of volume imbalance (pressure) — often indicating strength behind price moves.
📊 Features:
📈 Buy/Sell Volume Estimation using the candle’s OHLC and Volume.
⚖️ Delta Calculation (Buy Vol - Sell Vol) to detect pressure zones.
📅 Time-stamped Table displaying:
Time (HH:MM)
Buy Volume (Green)
Sell Volume (Red)
Delta (Color-coded)
🔢 Indian Number Format (K = Thousands, L = Lakhs, Cr = Crores).
🧠 Fully auto-calculated — no need for tick-by-tick bid/ask feed.
📍 Neatly placed bottom-right table, customizable number of rows.
🛠️ Inputs:
Show Table: Toggle the table on/off
Number of Bars to Show: Choose how many recent candles to include (5–50)
🎯 Use Cases:
Identify hidden buyer/seller strength
Detect volume absorption or exhaustion
✅ Compatibility:
Works on any timeframe
Ideal for intraday instruments like NIFTY, BANKNIFTY, etc.
Ideal for volume-based strategy confirmation.
🖋️ Developed by:
GSK-VIZAG-AP-INDIA

Trend Tracker ProTrend Tracker Pro - Advanced Trend Following Indicator
Overview
Trend Tracker Pro is a sophisticated trend-following indicator that combines the power of Exponential Moving Average (EMA) and Average True Range (ATR) to identify market trends and generate precise buy/sell signals. This indicator is designed to help traders capture trending moves while filtering out market noise.
🎯 Key Features
✅ Dynamic Trend Detection
Uses EMA and ATR-based bands to identify trend direction
Automatically adjusts to market volatility
Clear visual trend line that changes color based on market direction
✅ Precise Signal Generation
Buy signals when trend changes to bullish
Sell signals when trend changes to bearish
Reduces false signals by requiring actual trend changes
✅ Visual Clarity
Green trend line: Bullish trend
Red trend line: Bearish trend
Gray trend line: Sideways/neutral trend
Triangle arrows for buy/sell signals
Clear BUY/SELL text labels
✅ Customizable Settings
Trend Length: Adjustable period for EMA and ATR calculation (default: 14)
ATR Multiplier: Controls sensitivity of trend bands (default: 2.0)
Show/Hide Signals: Toggle signal arrows on/off
Show/Hide Labels: Toggle text labels on/off
✅ Built-in Information Panel
Real-time trend direction display
Current trend level value
ATR value for volatility reference
Last signal information
✅ TradingView Alerts
Buy signal alerts
Sell signal alerts
Customizable alert messages
🔧 How It Works
Algorithm Logic:
1.
Calculate EMA: Uses exponential moving average for trend baseline
2.
Calculate ATR: Measures market volatility
3.
Create Bands: Upper band = EMA + (ATR × Multiplier), Lower band = EMA - (ATR × Multiplier)
4.
Determine Trend:
Price above upper band → Bullish trend (trend line = lower band)
Price below lower band → Bearish trend (trend line = upper band)
Price between bands → Continue previous trend
5.
Generate Signals: Signal occurs when trend direction changes
📊 Best Use Cases
✅ Trending Markets
Excellent for capturing strong directional moves
Works well in both bull and bear markets
Ideal for swing trading and position trading
✅ Multiple Timeframes
Effective on all timeframes from 15 minutes to daily
Higher timeframes provide more reliable signals
Can be used for both scalping and long-term investing
✅ Various Asset Classes
Stocks, Forex, Cryptocurrencies, Commodities
Particularly effective in volatile markets
Adapts automatically to different volatility levels
⚙️ Recommended Settings
Conservative Trading (Lower Risk)
Trend Length: 20
ATR Multiplier: 2.5
Best for: Long-term positions, lower frequency signals
Balanced Trading (Default)
Trend Length: 14
ATR Multiplier: 2.0
Best for: Swing trading, moderate frequency signals
Aggressive Trading (Higher Risk)
Trend Length: 10
ATR Multiplier: 1.5
Best for: Day trading, higher frequency signals
🎨 Visual Elements
Trend Line: Main indicator line that follows the trend
Signal Arrows: Triangle shapes indicating buy/sell points
Text Labels: Clear "BUY" and "SELL" text markers
Information Table: Real-time status panel in top-right corner
Color Coding: Intuitive green/red color scheme
⚠️ Important Notes
Risk Management
Always use proper position sizing
Set stop-losses based on ATR values
Consider market conditions and volatility
Not recommended for ranging/sideways markets
Signal Confirmation
Consider using with other indicators for confirmation
Pay attention to volume and market structure
Be aware of major news events and market sessions
Backtesting Recommended
Test the indicator on historical data
Optimize parameters for your specific trading style
Consider transaction costs in your analysis

IU Liquidity Flow TrackerDESCRIPTION
The IU Liquidity Flow Tracker is a powerful market analysis tool designed to visualize hidden buying and selling activity by analyzing price action, volume behavior, market pressure, and depth. It provides a composite view of liquidity dynamics to help traders identify accumulation, distribution, and neutral phases with high clarity.
This indicator is ideal for traders who want to gauge the flow of market participants and make informed entry/exit decisions based on the underlying liquidity structure.
USER INPUTS:
* Flow Analysis Period: Length used for analyzing price spread and volume flow.
* Pressure Sensitivity: Adjusts the sensitivity of threshold detection for flow classification.
* Flow Smoothing: Controls the smoothing applied to raw flow data.
* Market Depth Analysis: Sets the depth range for rejection and wick analysis.
* Colors: Customize colors for accumulation, distribution, neutral zones, and pressure visualization.
INDICATOR LOGIC:
The IU Liquidity Flow Tracker uses a multi-factor model to evaluate market behavior:
1. Liquidity Pressure: Combines price spread, price efficiency, and volume imbalance.
2. Flow Direction: Weighted momentum using short, medium, and long-term price changes adjusted for volume.
3. Market Depth: Wick-based rejection scoring to estimate buying/selling aggressiveness at price extremes.
4. Composite Flow Index: Blended value of flow direction, pressure, and depth—smoothed for clarity.
5. Dynamic Thresholds: Automatically adjusts based on volatility to classify the market into:
* Accumulation: Strong buying signals.
* Distribution: Strong selling signals.
* Neutral: No significant flow dominance.
6. Entry Signals: Long/Short signals are generated when flow state shifts, supported by momentum, volume surge, and depth strength.
WHY IT IS UNIQUE:
Unlike typical indicators that rely solely on price or volume, this tool combines spread behavior, volume polarity, momentum weighting, and price rejection zones into a single visual interface. It dynamically adjusts sensitivity based on market volatility, helping avoid false signals during sideways or low-volume periods.
It is not based on any traditional indicator (RSI, MACD, etc.), making it ideal for traders looking for an original and data-driven market read.
HOW USER CAN BENEFIT FROM IT:
* Understand Market Context: Know whether the market is being accumulated, distributed, or ranging.
* Improve Entries/Exits: Use flow transitions combined with volume confirmation for high-probability setups.
* Spot Institutional Activity: Detect subtle shifts in liquidity that precede major price moves.
* Reduce Whipsaws: Dynamic thresholds and multi-factor confirmation help filter noise.
* Use with Any Style: Whether you're a swing trader, day trader, or scalper, this tool adapts to different timeframes and strategies.
DISCLAIMER:
This indicator is created for educational and informational purposes only. It does not constitute financial advice or a recommendation to buy or sell any asset. All trading involves risk, and users should conduct their own analysis or consult with a qualified financial advisor before making any trading decisions. The creator is not responsible for any losses incurred through the use of this tool. Use at your own discretion.

[blackcat] L2 Angle Trend TrackerOVERVIEW
The " L2 Angle Trend Tracker" is a sophisticated technical analysis tool designed to monitor trend direction and momentum using multiple Exponential Moving Averages (EMAs) with different periods. 📈 This script calculates the angles of 5 EMAs (5, 8, 10, 12, and 15 periods) and displays them with gradient colors, providing a comprehensive view of market momentum. When all EMAs cross above or below specified threshold levels, it generates Buy or Sell signals with visual alerts. The indicator helps traders identify trend reversals, potential entry/exit points, and market sentiment shifts with precision. 🚀 This powerful tool is particularly useful for traders who want to combine multiple timeframe analysis with angle-based momentum confirmation.
FEATURES
Calculates angles for 5 EMAs with customizable periods (5, 8, 10, 12, and 15)
Displays angle values with distinct colors for each EMA (Green, Blue, Purple, Orange, and Red)
Generates Buy signals when all EMAs cross above the lower threshold
Generates Sell signals when all EMAs cross below the upper threshold
Shows a zero line and threshold lines for easy reference
Customizable threshold levels for Buy/Sell signals
Visual alerts with "Buy" and "Sell" labels at the point of signal generation
The script uses a mathematical formula to calculate the angle of each EMA relative to its position 11 bars ago
Angle values are converted from radians to degrees for easier interpretation
The zero line represents no change in the EMA angle
The indicator is not overlayed on the price chart by default, but can be adjusted in the script settings 📊
HOW TO USE
Adjust the EMA periods to match your trading strategy 🛠️
Shorter periods (5, 8) are more sensitive to price changes
Longer periods (10, 12, 15) provide smoother trend confirmation
Set appropriate threshold values for Buy/Sell signals based on your risk tolerance
Default thresholds are 70 for upper threshold and -70 for lower threshold
Consider adjusting thresholds based on market volatility
Watch for Buy signals when all EMAs cross above the lower threshold (default: -70)
The signal appears as a green "Buy" label on the chart
This indicates a potential trend reversal to the upside
Watch for Sell signals when all EMAs cross below the upper threshold (default: 70)
The signal appears as a red "Sell" label on the chart
This indicates a potential trend reversal to the downside
Combine with other indicators for confirmation before making trading decisions 🧠
Consider using volume confirmation, support/resistance levels, or other oscillators
The angle tracker works well with trend-following strategies
Use the angle values to gauge momentum strength
Steeper angles indicate stronger momentum
Flatter angles suggest weakening momentum or consolidation
CONFIGURATION
EMA Periods: The script uses five different EMA periods that can be customized:
EMA Period 5: Short-term trend indicator
EMA Period 8: Medium-short term trend indicator
EMA Period 10: Medium-term trend indicator
EMA Period 12: Medium-long term trend indicator
EMA Period 15: Long-term trend indicator
Threshold Settings:
Threshold Top: Sets the upper boundary for Sell signals (default: 70)
Threshold Bot: Sets the lower boundary for Buy signals (default: -70)
These thresholds can be adjusted based on market conditions and trading style
LIMITATIONS
The script may generate false signals in ranging markets or during periods of high volatility
All EMAs must cross the threshold for a signal to appear, which may filter some valid signals
The angle calculation uses a 11-bar lookback period, which may not be suitable for all timeframes
Works best in trending markets and may produce whipsaws in choppy conditions ⚠️
The indicator is more effective on higher timeframes (4H, 1D) than on very short timeframes (1M, 5M)
Signal generation requires confirmation from multiple EMAs, which may delay entry/exit points
The angle calculation method may not be suitable for all financial instruments
ADVANCED TIPS
Use multiple instances of this indicator with different EMA settings for multi-timeframe analysis
Combine with volume analysis to confirm the strength of signals
Look for confluence with support and resistance levels for more reliable signals
Consider using the angle values as a filter for other trading strategies
The indicator can be used to identify momentum exhaustion points when angles flatten
For swing trading, consider using the Buy and Sell signals as potential entry/exit points
For day trading, you may want to use shorter EMA periods and adjust threshold values accordingly
NOTES
The script uses a mathematical formula to calculate the angle of each EMA relative to its position 11 bars ago
The angle values are converted from radians to degrees for easier interpretation
The zero line represents no change in the EMA angle
The indicator is not overlayed on the price chart by default, but can be adjusted in the script settings 📊
The angle calculation provides a dynamic view of momentum that traditional moving averages don't offer
The threshold values are based on empirical testing and can be fine-tuned for specific instruments
THANKS
Special thanks to the TradingView community for their support and feedback on this indicator. If you find this script helpful, please consider leaving a comment or sharing your experiences with it. Your feedback helps improve the tool for everyone. 🙏
Also, a nod to the original concept developers who pioneered angle-based trend analysis. This script builds upon those foundational ideas to provide a more comprehensive view of market momentum. 🌟

Custom Session Tracker (KN)**Custom Session Tracker (KN)**
Visually highlight any intraday session’s high, low, and midpoint on your chart with full styling control.
**Description**
Custom Session Tracker (KN) lets you define any trading session (e.g. 09:30–16:00 NY time) and automatically draws:
* A translucent box spanning the session’s High and Low
* A horizontal line marking the session midpoint
All elements update in real time and persist after session close.
**Features**
* **Session Range Box**: Plots from session open through close
* **Mid-Price Line**: Marks the exact midpoint of High/Low
* **Timezone Input**: Aligns session to any GMT offset
* **Custom Colors**: Fill, border, and mid-line colors
* **Line & Border Styles**: Choose solid or dashed
**Inputs**
* **Timezone** – GMT offset for your market
* **Session** – Hours in `HHMM-HHMM` format
* **Fill Color** – Box interior transparency
* **Border Color** – Box outline
* **Box Border Style** – Solid or dashed
* **Midline Color** – Mid-price line color
* **Mid Price Line Style** – Solid or dashed
**How to Use**
1. Add the script to your chart.
2. Set your session hours and timezone.
3. Customize colors and styles.
4. Watch each session’s high, low, and midpoint appear automatically.
Perfect for session-overlap strategies, mean-reversion signals, or simply keeping key levels in view.

NY Trading Session TrackerNY Trading Session Tracker
This indicator highlights the New York trading session (14:30–21:00 UTC) directly on your chart. It visually identifies the session with a customizable background color and optional labels marking the session’s open and close. For added clarity, the labels can display the precise open and close prices, formatted with commas and up to 4 decimal places. Perfect for intraday traders looking to focus on one of the most active market periods.
Features:
• Highlight the NY session with a customizable background.
• Optional session open/close labels.
• Display open/close prices with professional formatting.
• Fully customizable settings for labels and colors.
Streamline your trading workflow and focus on what matters with the NY Trading Session Tracker!

Dynamic Support & Resistance Tracker with MTFDynamic Support & Resistance Tracker with Weekly, Monthly & Daily Levels
The Dynamic Support & Resistance Tracker is designed to help traders identify key support and resistance levels across multiple timeframes, enhancing market analysis and decision-making. This indicator calculates and plots support and resistance levels for daily, weekly, and monthly periods, along with extension lines that provide insights into potential price targets.
Key Features:
Multi-Timeframe Analysis:
Daily Levels: Identifies the high, low, and midpoint for each trading day. These levels help traders recognize important price points for short-term trading strategies.
Weekly Levels: Plots the high, low, and midpoint for each week. This feature is valuable for swing traders who need to understand broader market trends.
Monthly Levels: Displays the high, low, and midpoint for each month, which is essential for long-term investors.
Extension Lines:
Calculates extension lines beyond the standard support and resistance levels to help anticipate potential price targets and reversals. These extensions are based on the distance between the high/low and midpoint levels.
Real-Time Updates:
Automatically updates the levels based on the most recent market data, ensuring traders have the most current information for their analysis.
Clear Visuals:
The indicator provides clearly labeled and color-coded lines for easy identification of key levels, improving the visual clarity of market analysis.
How It Works:
Daily, Weekly, and Monthly Levels: The indicator calculates the high, low, and midpoint levels for daily, weekly, and monthly timeframes and plots them on the chart. These levels serve as potential areas of support and resistance where price action may react.
Extension Lines: The extension lines are calculated based on the distance between the high/low and midpoint levels, projecting potential areas where price may find support or resistance beyond the standard levels.
Automatic Updates: The indicator continuously updates the plotted levels based on the latest market data, providing real-time insights.
Benefits:
Improved Market Analysis: By providing a clear view of support and resistance levels across multiple timeframes, this indicator helps traders understand market trends and price movements more effectively.
Informed Trading Decisions: The detailed plotting of levels and extensions allows traders to make more informed decisions, enhancing their trading strategies.
Versatility: Suitable for various trading styles, including intraday trading, swing trading, and long-term investing.
Instructions for Use:
Analyze the Levels: Observe the plotted high, low, and mid-levels for daily, weekly, and monthly timeframes.
Plan Your Trades: Use the identified support and resistance levels to set your entry and exit points, stop-losses, and profit targets.
Monitor the Market: Stay updated with real-time adjustments of the levels, ensuring you always have the latest market information.
Note: This indicator is designed to enhance your trading analysis by providing clear and reliable support and resistance levels. However, it should be used as part of a comprehensive trading strategy and not as the sole basis for trading decisions.

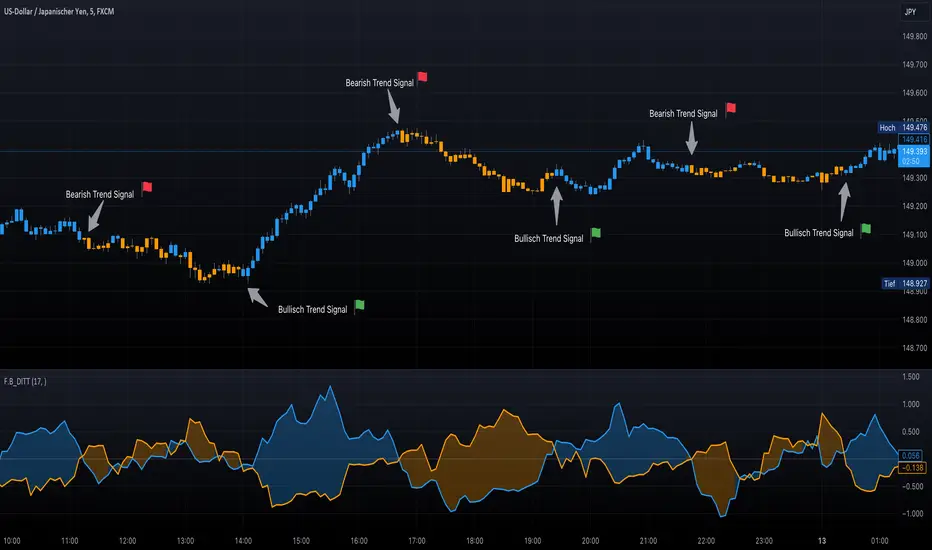
F.B_DI+ DI- Trend TrackerThe F.B_DI+ DI- Trend Tracker is an indicator developed based on Directional Movement and True Range to identify trends in the market and assess their strength. Here is the logic behind the indicator and how to use it for trading:
Direction Determination
Unlike traditional DI+ and DI- based on simple calculations, this indicator utilizes derived versions of these directional indicators. These derived versions offer a more precise measurement of price directional movements by specifically tailoring to market conditions and the chosen time frame.
Trend Strength
The derived directional indicators are generated by dividing smoothed Directional Movements by smoothed True Range and converting them into percentages. These values provide insights into the strength of the trend by considering directional movements relative to market volatility.
Identifying Trend Reversals
To capture changes in trend strength more accurately, the first derivative of DI+ and DI- is computed. A crossover of these derived versions could indicate a potential trend reversal, with a crossover of DI+ over DI- suggesting a possible uptrend and a crossover of DI- over DI+ indicating a potential downtrend.
Making Trading Decisions
Traders can use crossovers between the derived DI+ and DI- to receive signals for potential trend reversals. Additionally, changes in the color of candlesticks or background can be used as confirmation of the trend direction and its strength.
By utilizing these derived directional indicators, the F.B_DI+ DI- Trend Tracker indicator offers more precise trading signals and improved trend analysis, enabling traders to make informed trading decisions.
Optimized Trend Tracker STRATEGY & SCREENEROptimized Trend Tracker - OTT STRATEGY & SCREENER screens the BUY and SELL signals (trend reversals) for 20 user defined different tickers in Tradingview charts.
Simply input the name of the ticker in Tradingview that you want to screen.
Terminology explanation:
Confirmed Reversal: OTT reversal that happened in the last bar and cannot be repainted.
Potential Reversal: OTT reversal that might happen in the current bar but can also not happen depending upon the timeframe closing price.
Downtrend: Tickers that are currently in the sell zone
Uptrend: Tickers that are currently in the buy zone
Screener has also got a built in OTT indicator which users can confirm the reversals on graphs.
Screener explores the 20 tickers in current graph's time frame and also in desired parameters of the OTT indicator.
Also you can optimize the parameters manually with the built in STRATEGY version.
Optimized Trend Tracker indicator :
Built in Moving Average type defaultly set as VAR but users can choose from 8 different Moving Average types like:
SMA : Simple Moving Average
EMA : Exponential Movin Average
WMA : Weighted Moving Average
TMA : Triangular Moving Average
VAR : Variable Index Dynamic Moving Average aka VIDYA
WWMA : Welles Wilder's Moving Average
ZLEMA : Zero Lag Exponential Moving Average
TSF : True Strength Force
Tip: In sideways VAR would be a good choice
You can use OTT default alarms and Buy Sell signals like:
1-
BUY when Prices are above OTT
SELL when Prices are below OTT
2-
BUY when OTT support Line crosses over OTT line.
SELL when OTT support Line crosses under OTT line.
3-
BUY when OTT line is Green and makes higher highs.
SELL when OTT line is Red and makes lower lows.
IMPORTANT: SCREENER ONLY EXPLORES AND SCREENS FOR THE 2nd SIGNAL TYPE:
BUY when OTT support Line crosses over OTT line.
SELL when OTT support Line crosses under OTT line.

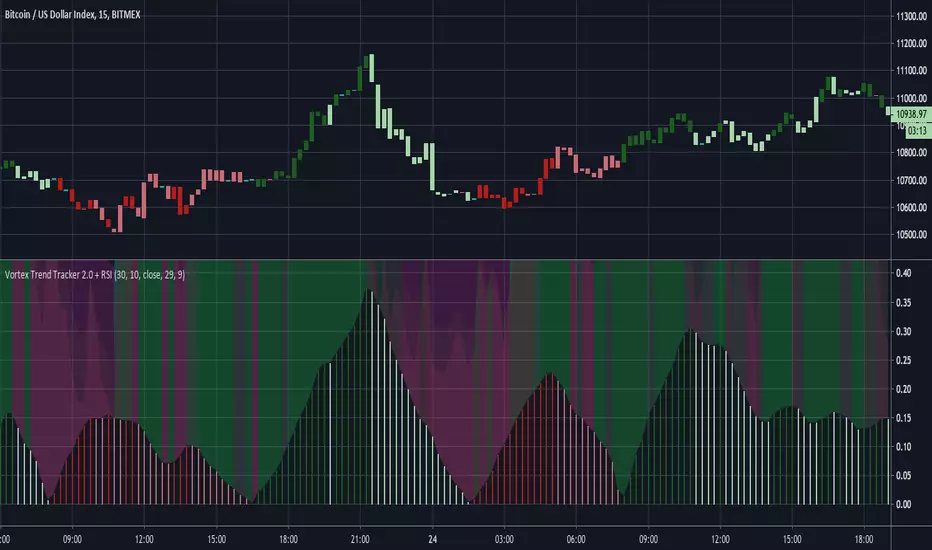
Vortex Trend Tracker 2.0 + RSIHere's an updated version of our Vortex Trend Tracker indicator.
Here's the link to the original if anyone wants to read more about the Vortex or see the first version:
We've added in 4 rsi's of varying lengths for this second version(2 fast and 2 slow) that create the background color effect.
Trend tracker (Gabriel Freitas)The Trend Tracker indicator is a trend tracker, as the name itself says. It indicates possible buying and selling points for traders. Based on setups of trader Oliver Velez and widely used in Brazil by André Machado.
I added a mother moving average (200 periods) and another to assist in the entries (20 periods)
[Azmath]_[Track]_[Day_High]_[Day_Low]
This indicators Tracks the Day's high and low as the day progresses and has the ability to alert when a new high or new low is detected
