Honest Volatility Grid [Honestcowboy]The Honest Volatility Grid is an attempt at creating a robust grid trading strategy but without standard levels.
Normal grid systems use price levels like 1.01;1.02;1.03;1.04... and place an order at each of these levels. In this program instead we create a grid using keltner channels using a long term moving average.
🟦 IS THIS EVEN USEFUL?
The idea is to have a more fluid style of trading where levels expand and follow price and do not stick to precreated levels. This however also makes each closed trade different instead of using fixed take profit levels. In this strategy a take profit level can even be a loss. It is useful as a strategy because it works in a different way than most strategies, making it a good tool to diversify a portfolio of trading strategies.
🟦 STRATEGY
There are 10 levels below the moving average and 10 above the moving average. For each side of the moving average the strategy uses 1 to 3 orders maximum (3 shorts at top, 3 longs at bottom). For instance you buy at level 2 below moving average and you increase position size when level 6 is reached (a cheaper price) in order to spread risks.
By default the strategy exits all trades when the moving average is reached, this makes it a mean reversion strategy. It is specifically designed for the forex market as these in my experience exhibit a lot of ranging behaviour on all the timeframes below daily.
There is also a stop loss at the outer band by default, in case price moves too far from the mean.
What are the risks?
In case price decides to stay below the moving average and never reaches the outer band one trade can create a very substantial loss, as the bands will keep following price and are not at a fixed level.
Explanation of default parameters
By default the strategy uses a starting capital of 25000$, this is realistic for retail traders.
Lot sizes at each level are set to minimum lot size 0.01, there is no reason for the default to be risky, if you want to risk more or increase equity curve increase the number at your own risk.
Slippage set to 20 points: that's a normal 2 pip slippage you will find on brokers.
Fill limit assumtion 20 points: so it takes 2 pips to confirm a fill, normal forex spread.
Commission is set to 0.00005 per contract: this means that for each contract traded there is a 5$ or whatever base currency pair has as commission. The number is set to 0.00005 because pinescript does not know that 1 contract is 100000 units. So we divide the number by 100000 to get a realistic commission.
The script will also multiply lot size by 100000 because pinescript does not know that lots are 100000 units in forex.
Extra safety limit
Normally the script uses strategy.exit() to exit trades at TP or SL. But because these are created 1 bar after a limit or stop order is filled in pinescript. There are strategy.orders set at the outer boundaries of the script to hedge against that risk. These get deleted bar after the first order is filled. Purely to counteract news bars or huge spikes in price messing up backtest.
🟦 VISUAL GOODIES
I've added a market profile feature to the edge of the grid. This so you can see in which grid zone market has been the most over X bars in the past. Some traders may wish to only turn on the strategy whenever the market profile displays specific characteristics (ranging market for instance).
These simply count how many times a high, low, or close price has been in each zone for X bars in the past. it's these purple boxes at the right side of the chart.
🟦 Script can be fully automated to MT5
There are risk settings in lot sizes or % for alerts and symbol settings provided at the bottom of the indicator. The script will send alert to MT5 broker trying to mimic the execution that happens on tradingview. There are always delays when using a bridge to MT5 broker and there could be errors so be mindful of that. This script sends alerts in format so they can be read by tradingview.to which is a bridge between the platforms.
Use the all alert function calls feature when setting up alerts and make sure you provide the right webhook if you want to use this approach.
Almost every setting in this indicator has a tooltip added to it. So if any setting is not clear hover over the (?) icon on the right of the setting.
스크립트에서 "tp"에 대해 찾기

Trade Manager 2Hi Traders,
this manager will make it easier for you to enter lots into your trading platform. Just go to the indicator settings, set your trading account amount, RRR, % risk and then give ok. If you then know where you want to put the stop loss then reopen, enter the value and hit ok again. The chart will show you exactly the stop loss and take profit as you wanted. The stop loss will always stay where you enter it and the take profit will move with the lot size as the price goes further or closer to the stop loss.
This should help when entering the number of lots, TP, SL into the platform.

Atr Target TP & Protecion Zone [Pinescriptlabs]This indicator provides an adaptive trailing stop system with dynamic price targets and protection zones, ideal for position management.
Main Features:
🚦 ADAPTIVE TRAILING STOP:
Automatically adjusts based on volatility (ATR) and volume
Two modes: "Modified" and "UnModified" for true range calculation
Displayed as a line with colored background (green for longs, red for shorts)
🎯 TARGET ZONES (T1 & T2):
Calculates two target zones (T1 and T2) based on:
Market strength (combination of RSI, volume, MFI, ADX, MACD)
Current volatility (ATR)
Distance from current price
Visualized with blue boxes (T1) and purple boxes (T2)
🛡️ PROTECTION ZONE:
Automatically activates in sideways markets
Provides an additional buffer to the trailing stop
Helps avoid premature exits in volatile markets
📊 INFORMATION PANELS:
Top Right Panel displays:
Current trend direction
Target status (T1 & T2)
Market strength
Current ATR
RSI level
Bottom Right Panel displays:
Trailing status (WIDE/NORMAL)
Volume impact
Directional strength
Protection zone status
Español:
Este indicador proporciona un sistema de trailing stop adaptativo con objetivos de precio dinámicos y zonas de protección, ideal para la gestión de posiciones.
**Características Principales**:
🚦 **TRAILING STOP ADAPTATIVO**:
- Se ajusta automáticamente según la volatilidad (ATR) y el volumen
- Dos modos: "Modified" y "UnModified" para el cálculo del rango verdadero
- Se visualiza como una línea con fondo coloreado (verde para largos, rojo para cortos)
🎯 **ZONAS OBJETIVO (T1 y T2)**:
- Calcula dos zonas objetivo (T1 y T2) basadas en:
- Fuerza del mercado (combinación de RSI, volumen, MFI, ADX, MACD)
- Volatilidad actual (ATR)
- Distancia al precio actual
- Visualización mediante cajas azules (T1) y moradas (T2)
🛡️ **ZONA DE PROTECCIÓN**:
- Se activa automáticamente en mercados laterales
- Proporciona un buffer adicional al trailing stop
- Ayuda a evitar salidas prematuras en mercados volátiles
📊 **PANELES INFORMATIVOS**:
*Panel Superior Derecho* muestra:
- Dirección de la tendencia actual
- Estado de los objetivos (T1 y T2)
- Fuerza del mercado
- ATR actual
- Nivel de RSI
*Panel Inferior Derecho* muestra:
- Estado del trailing (WIDE/NORMAL)
- Impacto del volumen
- Fuerza direccional
- Estado de la zona de protección

VIDYA ProTrend Multi-Tier ProfitHello! This time is about a trend-following system.
VIDYA is quite an interesting indicator that adjusts dynamically to market volatility, making it more responsive to price changes compared to traditional moving averages. Balancing adaptability and precision, especially with the more aggressive short trade settings, challenged me to fine-tune the strategy for a variety of market conditions.
█ Introduction and How it is Different
The "VIDYA ProTrend Multi-Tier Profit" strategy is a trend-following system that combines the VIDYA (Variable Index Dynamic Average) indicator with Bollinger Bands and a multi-step take-profit mechanism.
Unlike traditional trend strategies, this system allows for more adaptive profit-taking, adjusting for long and short positions through distinct ATR-based and percentage-based targets. The innovation lies in its dynamic multi-tier approach to profit-taking, especially for short trades, where more aggressive percentages are applied using a multiplier. This flexibility helps adapt to various market conditions by optimizing trade management and profit allocation based on market volatility and trend strength.
BTCUSD 6hr performance
█ Strategy, How it Works: Detailed Explanation
The core of the "VIDYA ProTrend Multi-Tier Profit" strategy lies in the dual VIDYA indicators (fast and slow) that analyze price trends while accounting for market volatility. These indicators work alongside Bollinger Bands to filter trade entries and exits.
🔶 VIDYA Calculation
The VIDYA indicator is calculated using the following formula:
Smoothing factor (𝛼):
alpha = 2 / (Length + 1)
VIDYA formula:
VIDYA(t) = alpha * k * Price(t) + (1 - alpha * k) * VIDYA(t-1)
Where:
k = |Chande Momentum Oscillator (MO)| / 100
🔶 Bollinger Bands as a Volatility Filter
Bollinger Bands are calculated using a rolling mean and standard deviation of price over a specified period:
Upper Band:
BB_upper = MA + (K * stddev)
Lower Band:
BB_lower = MA - (K * stddev)
Where:
MA is the moving average,
K is the multiplier (typically 2), and
stddev is the standard deviation of price over the Bollinger Bands length.
These bands serve as volatility filters to identify potential overbought or oversold conditions, aiding in the entry and exit logic.
🔶 Slope Calculation for VIDYA
The slopes of both fast and slow VIDYAs are computed to assess the momentum and direction of the trend. The slope for a given VIDYA over its length is:
Slope = (VIDYA(t) - VIDYA(t-n)) / n
Where:
n is the length of the lookback period. Positive slope indicates bullish momentum, while negative slope signals bearish momentum.
LOCAL picture
🔶 Entry and Exit Conditions
- Long Entry: Occurs when the price moves above the slow VIDYA and the fast VIDYA is trending upward. Bollinger Bands confirm the signal when the price crosses the upper band, indicating bullish strength.
- Short Entry: Happens when the price drops below the slow VIDYA and the fast VIDYA trends downward. The signal is confirmed when the price crosses the lower Bollinger Band, showing bearish momentum.
- Exit: Based on VIDYA slopes flattening or reversing, or when the price hits specific ATR or percentage-based profit targets.
🔶 Multi-Step Take Profit Mechanism
The strategy incorporates three levels of take profit for both long and short trades:
- ATR-based Take Profit: Each step applies a multiple of the ATR (Average True Range) to the entry price to define the exit point.
The first level of take profit (long):
TP_ATR1_long = Entry Price + (2.618 * ATR)
etc.
█ Trade Direction
The strategy offers flexibility in defining the trading direction:
- Long: Only long trades are considered based on the criteria for upward trends.
- Short: Only short trades are initiated in bearish trends.
- Both: The strategy can take both long and short trades depending on the market conditions.
█ Usage
To use the strategy effectively:
- Adjust the VIDYA lengths (fast and slow) based on your preference for trend sensitivity.
- Use Bollinger Bands as a filter for identifying potential breakout or reversal scenarios.
- Enable the multi-step take profit feature to manage positions dynamically, allowing for partial exits as the price reaches specified ATR or percentage levels.
- Leverage the short trade multiplier for more aggressive take profit levels in bearish markets.
This strategy can be applied to different asset classes, including equities, forex, and cryptocurrencies. Adjust the input parameters to suit the volatility and characteristics of the asset being traded.
█ Default Settings
The default settings for this strategy have been designed for moderate to trending markets:
- Fast VIDYA Length (10): A shorter length for quick responsiveness to price changes. Increasing this length will reduce noise but may delay signals.
- Slow VIDYA Length (30): The slow VIDYA is set longer to capture broader market trends. Shortening this value will make the system more reactive to smaller price swings.
- Minimum Slope Threshold (0.05): This threshold helps filter out weak trends. Lowering the threshold will result in more trades, while raising it will restrict trades to stronger trends.
Multi-Step Take Profit Settings
- ATR Multipliers (2.618, 5.0, 10.0): These values define how far the price should move before taking profit. Larger multipliers widen the profit-taking levels, aiming for larger trend moves. In higher volatility markets, these values might be adjusted downwards.
- Percentage Levels (3%, 8%, 17%): These percentage levels define how much the price must move before taking profit. Increasing the percentages will capture larger moves, while smaller percentages offer quicker exits.
- Short TP Multiplier (1.5): This multiplier applies more aggressive take profit levels for short trades. Adjust this value based on the aggressiveness of your short trade management.
Each of these settings directly impacts the performance and risk profile of the strategy. Shorter VIDYA lengths and lower slope thresholds will generate more trades but may result in more whipsaws. Higher ATR multipliers or percentage levels can delay profit-taking, aiming for larger trends but risking partial gains if the trend reverses too early.

Bitcoin Cycle Master [InvestorUnknown]The "Bitcoin Cycle Master" indicator is designed for in-depth, long-term analysis of Bitcoin's price cycles, using several key metrics to track market behavior and forecast potential price tops and bottoms. The indicator integrates multiple moving averages and on-chain metrics, offering a comprehensive view of Bitcoin’s historical and projected performance. Each of its components plays a crucial role in identifying critical cycle points:
Top Cap: This is a multiple of the Average Cap, which is calculated as the cumulative sum of Bitcoin’s price (price has a longer history than Market Cap) divided by its age in days. Top Cap serves as an upper boundary for speculative price peaks, multiplied by a factor of 35.
Time_dif() =>
date = ta.valuewhen(bar_index == 0, time, 0)
sec_r = math.floor(date / 1000)
min_r = math.floor(sec_r / 60)
h_r = math.floor(min_r / 60)
d_r = math.floor(h_r / 24)
// Launch of BTC
start = timestamp(2009, 1, 3, 00, 00)
sec_rb = math.floor(start / 1000)
min_rb = math.floor(sec_rb / 60)
h_rb = math.floor(min_rb / 60)
d_rb = math.floor(h_rb / 24)
difference = d_r - d_rb
AverageCap() =>
ta.cum(btc_price) / (Time_dif() + btc_age)
TopCap() =>
// To calculate Top Cap, it is first necessary to calculate Average Cap, which is the cumulative sum of Market Cap divided by the age of the market in days.
// This creates a constant time-based moving average of market cap.
// Once Average cap is calculated, those values are multiplied by 35. The result is Top Cap.
// For AverageCap the BTC price was used instead of the MC because it has more history
// (the result should have minimal if any deviation since MC would have to be divided by Supply)
AverageCap() * 35
Delta Top: Defined as the difference between the Realized Cap and the Average Cap, this metric is further multiplied by a factor of 7. Delta Top provides a historically reliable signal for Bitcoin market cycle tops.
DeltaTop() =>
// Delta Cap = Realized Cap - Average Cap
// Average Cap is explained in the Top Cap section above.
// Once Delta Cap is calculated, its values over time are then multiplied by 7. The result is Delta Top.
(RealizedPrice() - AverageCap()) * 7
Terminal Price: Derived from Coin Days Destroyed, Terminal Price normalizes Bitcoin’s historical price behavior by its finite supply (21 million bitcoins), offering an adjusted price forecast as all bitcoins approach being mined. The original formula for Terminal Price didn’t produce expected results, hence the calculation was adjusted slightly.
CVDD() =>
// CVDD stands for Cumulative Value Coin Days Destroyed.
// Coin Days Destroyed is a term used for bitcoin to identify a value of sorts to UTXO’s (unspent transaction outputs). They can be thought of as coins moving between wallets.
(MCR - TV) / 21000000
TerminalPrice() =>
// Theory:
// Before Terminal price is calculated, it is first necessary to calculate Transferred Price.
// Transferred price takes the sum of > Coin Days Destroyed and divides it by the existing supply of bitcoin and the time it has been in circulation.
// The value of Transferred Price is then multiplied by 21. Remember that there can only ever be 21 million bitcoin mined.
// This creates a 'terminal' value as the supply is all mined, a kind of reverse supply adjustment.
// Instead of heavily weighting later behavior, it normalizes historical behavior to today. By normalizing by 21, a terminal value is created
// Unfortunately the theoretical calculation didn't produce results it should, in pinescript.
// Therefore the calculation was slightly adjusted/improvised
TransferredPrice = CVDD() / (Supply * math.log(btc_age))
tp = TransferredPrice * 210000000 * 3
Realized Price: Calculated as the Market Cap Realized divided by the current supply of Bitcoin, this metric shows the average value of Bitcoin based on the price at which coins last moved, giving a market consensus price for long-term holders.
CVDD (Cumulative Value Coin Days Destroyed): This on-chain metric analyzes Bitcoin’s UTXOs (unspent transaction outputs) and the velocity of coins moving between wallets. It highlights key market dynamics during prolonged accumulation or distribution phases.
Balanced Price: The Balanced Price is the difference between the Realized Price and the Terminal Price, adjusted by Bitcoin's supply constraints. This metric provides a useful signal for identifying oversold market conditions during bear markets.
BalancedPrice() =>
// It is calculated by subtracting Transferred Price from Realized Price
RealizedPrice() - (TerminalPrice() / (21 * 3))
Each component can be toggled individually, allowing users to focus on specific aspects of Bitcoin’s price cycle and derive meaningful insights from its long-term behavior. The combination of these models provides a well-rounded view of both speculative peaks and long-term value trends.
Important consideration:
Top Cap did historically provide reliable signals for cycle peaks, however it may not be a relevant indication of peaks in the future.

Intramarket Difference Index StrategyHi Traders !!
The IDI Strategy:
In layman’s terms this strategy compares two indicators across markets and exploits their differences.
note: it is best the two markets are correlated as then we know we are trading a short to long term deviation from both markets' general trend with the assumption both markets will trend again sometime in the future thereby exhausting our trading opportunity.
📍 Import Notes:
This Strategy calculates trade position size independently (i.e. risk per trade is controlled in the user inputs tab), this means that the ‘Order size’ input in the ‘Properties’ tab will have no effect on the strategy. Why ? because this allows us to define custom position size algorithms which we can use to improve our risk management and equity growth over time. Here we have the option to have fixed quantity or fixed percentage of equity ATR (Average True Range) based stops in addition to the turtle trading position size algorithm.
‘Pyramiding’ does not work for this strategy’, similar to the order size input togeling this input will have no effect on the strategy as the strategy explicitly defines the maximum order size to be 1.
This strategy is not perfect, and as of writing of this post I have not traded this algo.
Always take your time to backtests and debug the strategy.
🔷 The IDI Strategy:
By default this strategy pulls data from your current TV chart and then compares it to the base market, be default BINANCE:BTCUSD . The strategy pulls SMA and RSI data from either market (we call this the difference data), standardizes the data (solving the different unit problem across markets) such that it is comparable and then differentiates the data, calling the result of this transformation and difference the Intramarket Difference (ID). The formula for the the ID is
ID = market1_diff_data - market2_diff_data (1)
Where
market(i)_diff_data = diff_data / ATR(j)_market(i)^0.5,
where i = {1, 2} and j = the natural numbers excluding 0
Formula (1) interpretation is the following
When ID > 0: this means the current market outperforms the base market
When ID = 0: Markets are at long run equilibrium
When ID < 0: this means the current market underperforms the base market
To form the strategy we define one of two strategy type’s which are Trend and Mean Revesion respectively.
🔸 Trend Case:
Given the ‘‘Strategy Type’’ is equal to TREND we define a threshold for which if the ID crosses over we go long and if the ID crosses under the negative of the threshold we go short.
The motivating idea is that the ID is an indicator of the two symbols being out of sync, and given we know volatility clustering, momentum and mean reversion of anomalies to be a stylised fact of financial data we can construct a trading premise. Let's first talk more about this premise.
For some markets (cryptocurrency markets - synthetic symbols in TV) the stylised fact of momentum is true, this means that higher momentum is followed by higher momentum, and given we know momentum to be a vector quantity (with magnitude and direction) this momentum can be both positive and negative i.e. when the ID crosses above some threshold we make an assumption it will continue in that direction for some time before executing back to its long run equilibrium of 0 which is a reasonable assumption to make if the market are correlated. For example for the BTCUSD - ETHUSD pair, if the ID > +threshold (inputs for MA and RSI based ID thresholds are found under the ‘‘INTRAMARKET DIFFERENCE INDEX’’ group’), ETHUSD outperforms BTCUSD, we assume the momentum to continue so we go long ETHUSD.
In the standard case we would exit the market when the IDI returns to its long run equilibrium of 0 (for the positive case the ID may return to 0 because ETH’s difference data may have decreased or BTC’s difference data may have increased). However in this strategy we will not define this as our exit condition, why ?
This is because we want to ‘‘let our winners run’’, to achieve this we define a trailing Donchian Channel stop loss (along with a fixed ATR based stop as our volatility proxy). If we were too use the 0 exit the strategy may print a buy signal (ID > +threshold in the simple case, market regimes may be used), return to 0 and then print another buy signal, and this process can loop may times, this high trade frequency means we fail capture the entire market move lowering our profit, furthermore on lower time frames this high trade frequencies mean we pay more transaction costs (due to price slippage, commission and big-ask spread) which means less profit.
By capturing the sum of many momentum moves we are essentially following the trend hence the trend following strategy type.
Here we also print the IDI (with default strategy settings with the MA difference type), we can see that by letting our winners run we may catch many valid momentum moves, that results in a larger final pnl that if we would otherwise exit based on the equilibrium condition(Valid trades are denoted by solid green and red arrows respectively and all other valid trades which occur within the original signal are light green and red small arrows).
another example...
Note: if you would like to plot the IDI separately copy and paste the following code in a new Pine Script indicator template.
indicator("IDI")
// INTRAMARKET INDEX
var string g_idi = "intramarket diffirence index"
ui_index_1 = input.symbol("BINANCE:BTCUSD", title = "Base market", group = g_idi)
// ui_index_2 = input.symbol("BINANCE:ETHUSD", title = "Quote Market", group = g_idi)
type = input.string("MA", title = "Differrencing Series", options = , group = g_idi)
ui_ma_lkb = input.int(24, title = "lookback of ma and volatility scaling constant", group = g_idi)
ui_rsi_lkb = input.int(14, title = "Lookback of RSI", group = g_idi)
ui_atr_lkb = input.int(300, title = "ATR lookback - Normalising value", group = g_idi)
ui_ma_threshold = input.float(5, title = "Threshold of Upward/Downward Trend (MA)", group = g_idi)
ui_rsi_threshold = input.float(20, title = "Threshold of Upward/Downward Trend (RSI)", group = g_idi)
//>>+----------------------------------------------------------------+}
// CUSTOM FUNCTIONS |
//<<+----------------------------------------------------------------+{
// construct UDT (User defined type) containing the IDI (Intramarket Difference Index) source values
// UDT will hold many variables / functions grouped under the UDT
type functions
float Close // close price
float ma // ma of symbol
float rsi // rsi of the asset
float atr // atr of the asset
// the security data
getUDTdata(symbol, malookback, rsilookback, atrlookback) =>
indexHighTF = barstate.isrealtime ? 1 : 0
= request.security(symbol, timeframe = timeframe.period,
expression = [close , // Instentiate UDT variables
ta.sma(close, malookback) ,
ta.rsi(close, rsilookback) ,
ta.atr(atrlookback) ])
data = functions.new(close_, ma_, rsi_, atr_)
data
// Intramerket Difference Index
idi(type, symbol1, malookback, rsilookback, atrlookback, mathreshold, rsithreshold) =>
threshold = float(na)
index1 = getUDTdata(symbol1, malookback, rsilookback, atrlookback)
index2 = getUDTdata(syminfo.tickerid, malookback, rsilookback, atrlookback)
// declare difference variables for both base and quote symbols, conditional on which difference type is selected
var diffindex1 = 0.0, var diffindex2 = 0.0,
// declare Intramarket Difference Index based on series type, note
// if > 0, index 2 outpreforms index 1, buy index 2 (momentum based) until equalibrium
// if < 0, index 2 underpreforms index 1, sell index 1 (momentum based) until equalibrium
// for idi to be valid both series must be stationary and normalised so both series hae he same scale
intramarket_difference = 0.0
if type == "MA"
threshold := mathreshold
diffindex1 := (index1.Close - index1.ma) / math.pow(index1.atr*malookback, 0.5)
diffindex2 := (index2.Close - index2.ma) / math.pow(index2.atr*malookback, 0.5)
intramarket_difference := diffindex2 - diffindex1
else if type == "RSI"
threshold := rsilookback
diffindex1 := index1.rsi
diffindex2 := index2.rsi
intramarket_difference := diffindex2 - diffindex1
//>>+----------------------------------------------------------------+}
// STRATEGY FUNCTIONS CALLS |
//<<+----------------------------------------------------------------+{
// plot the intramarket difference
= idi(type,
ui_index_1,
ui_ma_lkb,
ui_rsi_lkb,
ui_atr_lkb,
ui_ma_threshold,
ui_rsi_threshold)
//>>+----------------------------------------------------------------+}
plot(intramarket_difference, color = color.orange)
hline(type == "MA" ? ui_ma_threshold : ui_rsi_threshold, color = color.green)
hline(type == "MA" ? -ui_ma_threshold : -ui_rsi_threshold, color = color.red)
hline(0)
Note it is possible that after printing a buy the strategy then prints many sell signals before returning to a buy, which again has the same implication (less profit. Potentially because we exit early only for price to continue upwards hence missing the larger "trend"). The image below showcases this cenario and again, by allowing our winner to run we may capture more profit (theoretically).
This should be clear...
🔸 Mean Reversion Case:
We stated prior that mean reversion of anomalies is an standerdies fact of financial data, how can we exploit this ?
We exploit this by normalizing the ID by applying the Ehlers fisher transformation. The transformed data is then assumed to be approximately normally distributed. To form the strategy we employ the same logic as for the z score, if the FT normalized ID > 2.5 (< -2.5) we buy (short). Our exit conditions remain unchanged (fixed ATR stop and trailing Donchian Trailing stop)
🔷 Position Sizing:
If ‘‘Fixed Risk From Initial Balance’’ is toggled true this means we risk a fixed percentage of our initial balance, if false we risk a fixed percentage of our equity (current balance).
Note we also employ a volatility adjusted position sizing formula, the turtle training method which is defined as follows.
Turtle position size = (1/ r * ATR * DV) * C
Where,
r = risk factor coefficient (default is 20)
ATR(j) = risk proxy, over j times steps
DV = Dollar Volatility, where DV = (1/Asset Price) * Capital at Risk
🔷 Risk Management:
Correct money management means we can limit risk and increase reward (theoretically). Here we employ
Max loss and gain per day
Max loss per trade
Max number of consecutive losing trades until trade skip
To read more see the tooltips (info circle).
🔷 Take Profit:
By defualt the script uses a Donchain Channel as a trailing stop and take profit, In addition to this the script defines a fixed ATR stop losses (by defualt, this covers cases where the DC range may be to wide making a fixed ATR stop usefull), ATR take profits however are defined but optional.
ATR SL and TP defined for all trades
🔷 Hurst Regime (Regime Filter):
The Hurst Exponent (H) aims to segment the market into three different states, Trending (H > 0.5), Random Geometric Brownian Motion (H = 0.5) and Mean Reverting / Contrarian (H < 0.5). In my interpretation this can be used as a trend filter that eliminates market noise.
We utilize the trending and mean reverting based states, as extra conditions required for valid trades for both strategy types respectively, in the process increasing our trade entry quality.
🔷 Example model Architecture:
Here is an example of one configuration of this strategy, combining all aspects discussed in this post.
Future Updates
- Automation integration (next update)

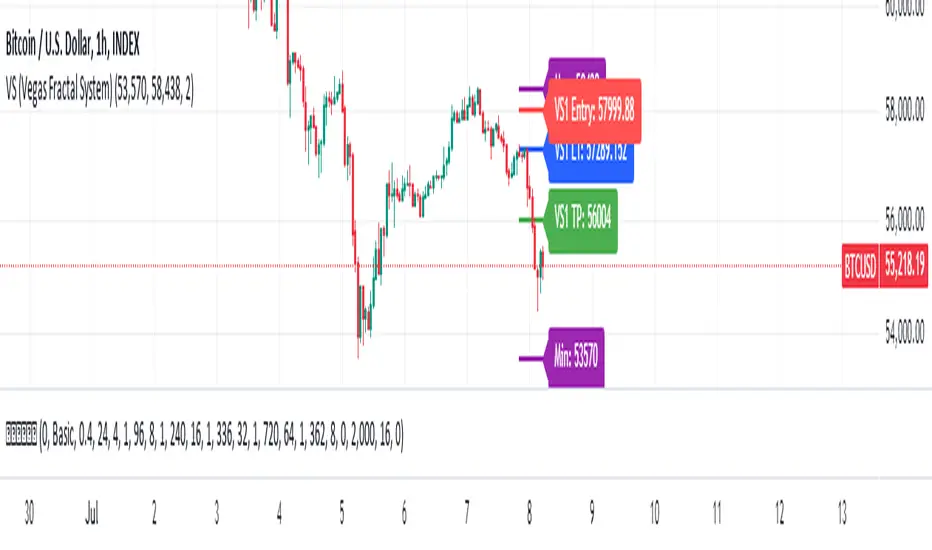
VS (Vegas Fractal System)VS is a trading system based on the identification of fractal reaction zones within a larger, carefully identified movement. It is internally made up of 4 sub-systems.
The indicator is composed of the following parameters: Max and Min, are the largest area identified and will act as the STOPLOSS point. L1, is the price reaction level. Entry, is where to place a pending market entry order. TP, is the place to place a 100% sell order.
A valid area must be identified through the Fibonacci levels that join Highs and Lows or vice versa depending on the bullish or bearish movement. To be usable, this movement must not have a sub-movement that has already hit the 0.618 level.
Always manage Risk and Money Management in an adequate, technical and sustainable manner in relation to your capital. A fair exposure per transaction is between 1% and 2% of the capital.
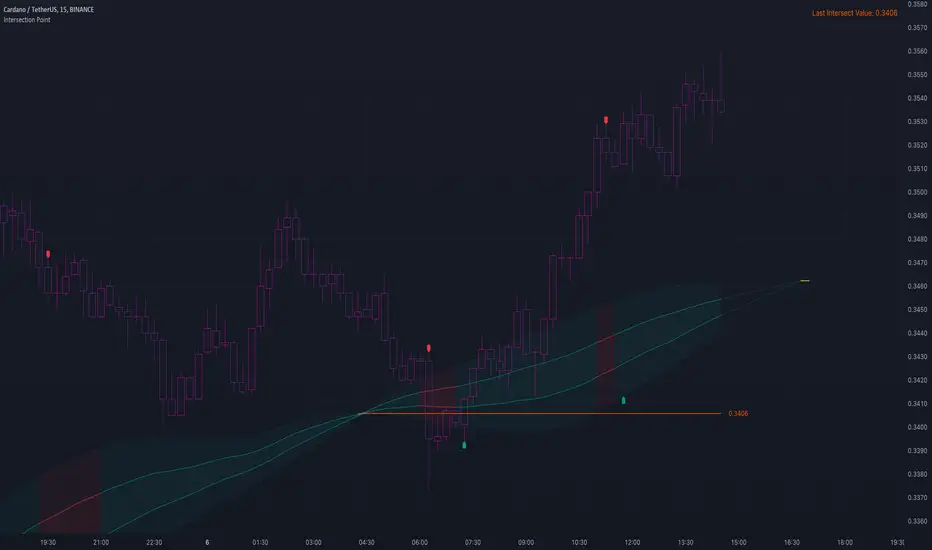
Innocent Heikin Ashi Ethereum StrategyHello there, im back!
If you are familiar with my previous scripts, this one will seem like the future's nostalgia!
Functionality:
As you can see, all candles are randomly colored. This has no deeper meaning, it should remind you to switch to Heikin Ashi. The Strategy works on standard candle stick charts, but should be used with Heikin Ashi to see the actual results. (Regular OHLC calculations are included.)
Same as in my previous scripts we import our PVSRA Data from @TradersReality open source Indicator.
With this data and the help of moving averages, we have got an edge in the market.
Signal Logic:
When a "violently green" candle appears (high buy volume + tick speed) above the 50 EMA indicates a change in trend and sudden higher prices. Depending on OHLC of the candle itself and volume, Take Profit and Stop Loss is calculated. (The price margin is the only adjustable setting). Additionally, to make this script as simple and easily useable as possible, all other adjustable variables have been already set to the best suitable value and the chart was kept plain, except for the actual entries and exits.
Basic Settings and Adjustables:
Main Input 1: TP and SL combined price range. (Double, Triple R:R equally.)
Trade Inputs: All standard trade size and contract settings for testing available.
Special Settings:
Checkbox 1: Calculate Signal in Heikin Ashi chart, including regular candle OHLC („Open, High, Low, Close“)
Checkbox 2/3: Calculate by order fill or every tick.
Checkbox 4: Possible to fill orders on bar close.
Timeframe and practical usage:
Made for the 5 Minute to 1 hour timeframe.
Literally ONLY works on Ethereum and more or less on Bitcoin.
EVERY other asset has absolute 0% profitability.
Have fun and share with your friends!
Thanks for using!
Example Chart:

Quatro SMA Strategy [4h]Hello, I would like to present to you The "Quatro SMA" strategy
Strategy is based on four simple moving averages of different lengths and monitoring trading volume. The key idea is to identify strong market trends by comparing short-term moving averages with the long-term SMA. The strategy generates buy signals when all short-term SMAs are above the SMA(200) and the volume confirms the strength of the move. Similarly, sell signals are generated when all short-term SMAs are below the SMA(200), and the volume is sufficiently high.
The strategy manages risk by applying a stop loss and three different Take Profit levels (TP1, TP2, TP3), with varying percentages of the position closed at each level.
Each Take Profit level is triggered at a specific percentage gain, with the position being closed gradually depending on the achieved targets. The percentage of the position closed at each TP level is also defined by the user.
Indicators and Parameters:
Simple Moving Averages (SMA):
The script utilizes four simple moving averages with different lengths (4, 16, 32, 200). The first three SMAs (SMA1, SMA2, SMA3) are used to determine the trend direction, while the fourth SMA (with a length of 200) serves as a support/resistance line.
Volume:
The script monitors trading volume and checks if the current volume exceeds 2.5 times the average volume of the last 40 candles. High volume is considered as confirmation of trend strength.
Entry Conditions:
- Long Position: Triggered when SMA1 > SMA2 > SMA3, the closing price is above SMA(200), and the volume condition is met.
- Short Position: Triggered when SMA1 < SMA2 < SMA3, the closing price is below SMA(200), and the volume condition is met.
Exit Conditions:
- Long Position: Closed when SMA1 < SMA2 < SMA3 and the closing price is above SMA(200).
- Short Position: Closed when SMA1 > SMA2 > SMA3 and the closing price is below SMA(200).
to determine the level of stop loss and target point I used a piece of code by RafaelZioni, here is the script from which a piece of code was taken
I hope the strategy will be helpful, as always, best regards and safe trades
;)

Double CCI Confirmed Hull Moving Average Reversal StrategyOverview
The Double CCI Confirmed Hull Moving Average Strategy utilizes hull moving average (HMA) in conjunction with two commodity channel index (CCI) indicators: the slow and fast to increase the probability of entering when the short and mid-term uptrend confirmed. The main idea is to wait until the price breaks the HMA while both CCI are showing that the uptrend has likely been already started. Moreover, strategy uses exponential moving average (EMA) to trail the price when it reaches the specific level. The strategy opens only long trades.
Unique Features
Dynamic stop-loss system: Instead of fixed stop-loss level strategy utilizes average true range (ATR) multiplied by user given number subtracted from the position entry price as a dynamic stop loss level.
Configurable Trading Periods: Users can tailor the strategy to specific market windows, adapting to different market conditions.
Double trade setup confirmation: Strategy utilizes two different period CCI indicators to confirm the breakouts of HMA.
Trailing take profit level: After reaching the trailing profit activation level scrip activate the trailing of long trade using EMA. More information in methodology.
Methodology
The strategy opens long trade when the following price met the conditions:
Short-term period CCI indicator shall be above 0.
Long-term period CCI indicator shall be above 0.
Price shall cross the HMA and candle close above it with the same candle
When long trade is executed, strategy set the stop-loss level at the price ATR multiplied by user-given value below the entry price. This level is recalculated on every next candle close, adjusting to the current market volatility.
At the same time strategy set up the trailing stop validation level. When the price crosses the level equals entry price plus ATR multiplied by user-given value script starts to trail the price with EMA. If price closes below EMA long trade is closed. When the trailing starts, script prints the label “Trailing Activated”.
Strategy settings
In the inputs window user can setup the following strategy settings:
ATR Stop Loss (by default = 1.75)
ATR Trailing Profit Activation Level (by default = 2.25)
CCI Fast Length (by default = 25, used for calculation short term period CCI
CCI Slow Length (by default = 50, used for calculation long term period CCI)
Hull MA Length (by default = 34, period of HMA, which shall be broken to open trade)
Trailing EMA Length (by default = 20)
User can choose the optimal parameters during backtesting on certain price chart.
Justification of Methodology
Before understanding why this particular combination of indicator has been chosen let's briefly explain what is CCI and HMA.
The Commodity Channel Index (CCI) is a momentum-based technical indicator used in trading to measure a security's price relative to its average price over a given period. Developed by Donald Lambert in 1980, the CCI is primarily used to identify cyclical trends in a security, helping traders to spot potential buying or selling opportunities.
The CCI formula is:
CCI = (Typical Price − SMA) / (0.015 × Mean Deviation)
Typical Price (TP): This is calculated as the average of the high, low, and closing prices for the period.
Simple Moving Average (SMA): This is the average of the Typical Prices over a specific number of periods.
Mean Deviation: This is the average of the absolute differences between the Typical Price and the SMA.
The result is a value that typically fluctuates between +100 and -100, though it is not bounded and can go higher or lower depending on the price movement.
The Hull Moving Average (HMA) is a type of moving average that was developed by Alan Hull to improve upon the traditional moving averages by reducing lag while maintaining smoothness. The goal of the HMA is to create an indicator that is both quick to respond to price changes and less prone to whipsaws (false signals).
How the Hull Moving Average is Calculated?
The Hull Moving Average is calculated using the following steps:
Weighted Moving Average (WMA): The HMA starts by calculating the Weighted Moving Average (WMA) of the price data over a period square root of n (sqrt(n))
Speed Adjustment: A WMA is then calculated for half of the period n/2, and this is multiplied by 2 to give more weight to recent prices.
Lag Reduction: The WMA of the full period n is subtracted from the doubled n/2 WMA.
Final Smoothing: To smooth the result and reduce noise, a WMA is calculated for the square root of the period n.
The formula can be represented as:
HMA(n) = WMA(WMA(n/2) × 2 − WMA(n), sqrt(n))
The Weighted Moving Average (WMA) is a type of moving average that gives more weight to recent data points, making it more responsive to recent price changes than a Simple Moving Average (SMA). In a WMA, each data point within the selected period is multiplied by a weight, with the most recent data receiving the highest weight. The sum of these weighted values is then divided by the sum of the weights to produce the WMA.
This strategy leverages HMA of user given period as a critical level which shall be broken to say that probability of trend change to the upside increased. HMA reacts faster than EMA or SMA to the price change, that’s why it increases chances to enter new trade earlier. Long-term period CCI helps to have an approximation of mid-term trend. If it’s above 0 the probability of uptrend increases. Short-period CCI allows to have an approximation of short-term trend reversal from down to uptrend. This approach increases chances to have a long trade setup in the direction of mid-term trend when the short-term trend starts to reverse.
ATR is used to adjust the strategy risk management to the current market volatility. If volatility is low, we don’t need the large stop loss to understand the there is a high probability that we made a mistake opening the trade. User can setup the settings ATR Stop Loss and ATR Trailing Profit Activation Level to realize his own risk to reward preferences, but the unique feature of a strategy is that after reaching trailing profit activation level strategy is trying to follow the trend until it is likely to be finished instead of using fixed risk management settings. It allows sometimes to be involved in the large movements. It’s also important to make a note, that script uses HMA to enter the trade, but for trailing it leverages EMA. It’s used because EMA has no such fast reaction to price move which increases probability not to be stopped out from any significant uptrend move.
Backtest Results
Operating window: Date range of backtests is 2022.07.01 - 2024.08.01. It is chosen to let the strategy to close all opened positions.
Commission and Slippage: Includes a standard Binance commission of 0.1% and accounts for possible slippage over 5 ticks.
Initial capital: 10000 USDT
Percent of capital used in every trade: 100%
Maximum Single Position Loss: -4.67%
Maximum Single Profit: +19.66%
Net Profit: +14897.94 USDT (+148.98%)
Total Trades: 104 (36.54% win rate)
Profit Factor: 2.312
Maximum Accumulated Loss: 1302.66 USDT (-9.58%)
Average Profit per Trade: 143.25 USDT (+0.96%)
Average Trade Duration: 34 hours
These results are obtained with realistic parameters representing trading conditions observed at major exchanges such as Binance and with realistic trading portfolio usage parameters.
How to Use
Add the script to favorites for easy access.
Apply to the desired timeframe and chart (optimal performance observed on 2h BTC/USDT).
Configure settings using the dropdown choice list in the built-in menu.
Set up alerts to automate strategy positions through web hook with the text: {{strategy.order.alert_message}}
Disclaimer:
Educational and informational tool reflecting Skyrex commitment to informed trading. Past performance does not guarantee future results. Test strategies in a simulated environment before live implementation

Gann Swing Strategy [1 Bar - Multi Layer]Use this Strategy to Fine-tune inputs for your Gann swing strategy.
Strategy allows you to fine-tune the indicator for 1 TimeFrame at a time; cross Timeframe Input fine-tuning is done manually after exporting the chart data.
MEANINGFUL DESCRIPTION:
The Gann Swing Chart using the One-Bar type, also known as the Minor Trend Chart, is designed to follow single-bar movements in the market. It helps identify trends by tracking price movements. When the market makes a higher high than the previous bar from a low price, the One-Bar trend line moves up, indicating a new high and establishing the previous low as a One-Bar bottom. Conversely, when the market makes a lower low than the previous bar from a high price, the One-Bar swing line moves down, marking a new low and setting the previous high as a One-Bar top. The crossing of these swing tops and bottoms indicates a change in trend direction.
HOW TO USE THE INDICATOR / Gann-swing Strategy:
The indicator shows 1, 2, and 3-bar swings. The strategy triggers a buy when the price crosses the previously determined high.
HOW TO USE THE STRATEGY:
Strategy to Fine-Tune Inputs for Your Gann Swing Strategy
This strategy allows for the fine-tuning of indicators for one timeframe at a time. Cross-timeframe input fine-tuning is done manually after exporting the chart data.
Meaningful Description:
The Gann Swing Chart using the One-Bar type, also known as the Minor Trend Chart, is designed to follow single-bar movements in the market. It helps identify trends by tracking price movements. When the market makes a higher high than the previous bar from a low price, the One-Bar trend line moves up, indicating a new high and establishing the previous low as a One-Bar bottom. Conversely, when the market makes a lower low than the previous bar from a high price, the One-Bar swing line moves down, marking a new low and setting the previous high as a One-Bar top. The crossing of these swing tops and bottoms indicates a change in trend direction.
How to Use the Indicator / Gann-Swing Strategy:
The indicator shows 1, 2, and 3-bar swings. The strategy triggers a buy when the price crosses the previously determined high.
How to Use the Strategy:
The strategy initiates a buy if the price breaks 1, 2, or 3-bar highs, or any combination thereof. Use the inputs to determine which highs or lows need to be crossed for the strategy to go long or short.
ORIGINALITY & USEFULNESS:
The One-Bar Swing Chart stands out for its simplicity and effectiveness in capturing minor market trends. Developed by meomeo105, this Gann high and low algorithm forms the basis of the strategy. I used my approach to creating strategy out of Gann swing indicator.
DETAILED DESCRIPTION:
What is a Swing Chart?
Swing charts help traders visualize price movements and identify trends by focusing on price highs and lows. They are instrumental in spotting trend reversals and continuations.
What is the One-Bar Swing Chart?
The One-Bar Swing Chart, also known as the Minor Trend Chart, follows single-bar price movements. It plots upward swings from a low price when a higher high is made, and downward swings from a high price when a lower low is made.
Key Features:
Trend Identification : Highlights minor trends by plotting swing highs and lows based on one-bar movements.
Simple Interpretation : Crossing a swing top indicates an uptrend, while crossing a swing bottom signals a downtrend.
Customizable Periods : Users can adjust the period to fine-tune the sensitivity of the swing chart to market movements.
Practical Application:
Bullish Trend : When the One-Bar Swing line moves above a previous swing top, it indicates a bullish trend.
Bearish Trend : When the One-Bar Swing line moves below a previous swing bottom, it signals a bearish trend.
Trend Reversal : Watch for crossings of swing tops and bottoms to detect potential trend reversals.
The One-Bar Swing Chart is a powerful tool for traders looking to capture and understand market trends. By following the simple rules of swing highs and lows, it provides clear and actionable insights into market direction.
Why the Strategy Uses 100% Allocation of a Portfolio:
This strategy allocates 100% of the portfolio to trading this specific pair, which does not mean 100% of all capital but 100% of the allocated trading capital for this pair. The strategy is swing-based and does not use take profit (TP) or stop losses.

ATR Gerchik LightAverage True Range ( ATR ) is a technical analysis indicator that measures volatility in the market. ATR is a moving average of the true range over a period of time.
ATR calculation procedure:
1. Determine the true maximum - this is the highest of the current maximum and yesterday's closing price of the day.
2. Determine the true minimum - this is the smallest of the current minimum and yesterday's closing price.
3. Determine the true range - this is the distance between the true maximum and minimum.
4. We exclude extremely large candles (> x2 ATR) and extremely small ones (< 0.5 ATR) from the obtained true ranges.
5. We calculate the average for the selected period based on the remaining range.
6. We calculate the percentage of the current True Range relative to the average ATR value for the previous period.
Description:
If you analyze it yourself, you will see that 75-80% of the time, the instrument moves only 1 ATR per day. You must understand that if an instrument has, for example, moved 80% of its daily range, it is not advisable to purchase it. This is comparable to a car's fuel tank: if the tank is almost empty, the car won't go far. Most indicators that calculate ATR include anomalous candles, which give unreliable results and lead to incorrect decisions. Because of this, many traders prefer to calculate ATR on their own.
However, the Gerchik ATR indicator accounts for anomalous candles and filters out extremely large candles (> 2x ATR) and extremely small ones (< 0.5x ATR). Additionally, this indicator immediately shows the consumed “fuel” of the instrument as a percentage, so you don't have to calculate the distance traveled yourself. This allows you to make quick, informed decisions. If we see that the tank is almost empty, it is logical not to get into that car today. When building any strategy, you must rely on the average movement.
Key Features:
Anomalous Candle Filtering: Excludes extremely large and small candles to provide more reliable ATR values.
Consumed Fuel Indicator: Shows the percentage of the ATR consumed, helping traders quickly assess the remaining potential movement.
Daily Timeframe Focus: Designed specifically for use on daily charts for accurate long-term analysis.
Practical Applications:
Entry and Exit Points: Use the ATR to determine optimal entry and exit points by assessing market volatility and potential price movement.
Stop-Loss Placement: Calculate stop-loss levels based on ATR to ensure they are placed at appropriate distances, accounting for current market volatility.
Trend Confirmation: Use the percentage of ATR consumed to confirm the strength of a trend and decide whether to enter or exit trades.
Examples of Use:
Trend Following: During strong trends, ATR helps identify periods of increased volatility, signaling potential breakouts or reversals.
Range Trading: In ranging markets, ATR can highlight periods of low volatility, indicating consolidation and potential breakout zones.
Note: The indicator is displayed and works only on the daily timeframe!
The indicator was created according to the instructions, description of the functionality, and strategy of Mr. Gerchik. Thank you so much, Chief!
________________________
Average True Range ( ATR , средний истинный диапазон) – это индикатор технического анализа, который измеряет волатильность на рынке. ATR представляет собой скользящее среднее истинного диапазона за определенный период времени.
Порядок расчета ATR:
1. Определяем истинный максимум – это наивысшее из текущего максимума и вчерашней цены закрытия дня.
2. Определяем истинный минимум – это наименьшее из текущего минимума и вчерашней цены закрытия.
3. Определяем истинный диапазон – это расстояние между истинным максимумом и минимумом.
4. Исключаем из полученных истинных диапазонов экстремально большие свечи (> x2 ATR) и экстремально маленькие (< 0.5 ATR).
5. Рассчитываем среднее за выбранный период исходя из оставшегося диапазона.
6 . Рассчитываем процент текущего истинного диапазона (True Range) относительно среднего значения ATR за предыдущий период.
Описание:
Если вы сами проанализируете, то увидите, что 75-80% времени инструмент ходит только 1 ATR. И вы должны понимать, что если инструмент внутри дня прошел, к примеру, 80% своего движения, то этот инструмент больше нельзя покупать. Это можно сравнить с баком машины: если бак почти пустой, машина далеко не уедет. Большинство индикаторов, которые рассчитывают ATR, производят расчет с паранормальными свечами. Это дает недостоверный результат и приводит к неверным решениям. Многие трейдеры из-за этого не используют готовые индикаторы и предпочитают считать ATR самостоятельно. Но индикатор ATR Gerchik учитывает паранормальные свечи и фильтрует экстремально большие свечи (> x2 ATR) и экстремально маленькие (< 0.5 ATR). Также этот индикатор сразу показывает израсходованный "бензин" инструмента в процентах. И вам не надо самостоятельно высчитывать пройденный путь. Вы можете быстро принимать правильные решения. Если мы видим, что бак почти пустой, логично не садиться в эту машину сегодня. Когда вы строите какую-то стратегию, вы должны обязательно полагаться на среднестатистическое движение.
Существует много стратегий, завязанных на ATR, которые учитывают волатильность инструмента, запас хода, точки разворота, места выставления стоп-лоссов (SL) и тейк-профитов (TP) и другие факторы. Я не буду останавливаться на них, так как каждый может найти описание этих стратегий и использовать их на свой выбор.
Индикатор отображается и работает только на дневном таймфрейме!
Индикатор создан по наставлениям, описанию функционала и стратегии господина Герчика. Огромное спасибо, Шеф!

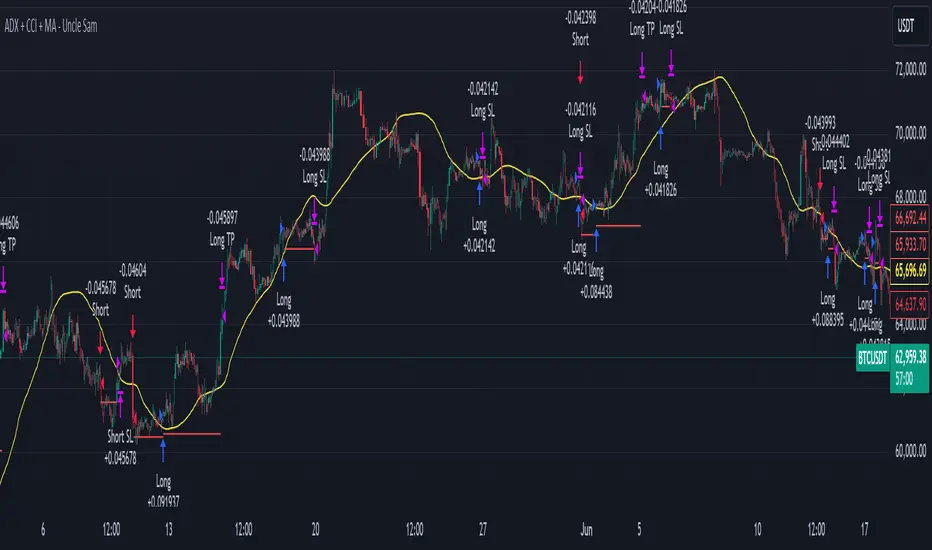
ADX + CCI + MA - Uncle SamStrategy Name: ADX + CCI + MA - Uncle Sam
Overview
This strategy aims to capitalize on trending markets by combining the Average Directional Index (ADX), Commodity Channel Index (CCI), and a customizable Moving Average (MA). It's designed for traders seeking a balanced approach to both long (buy) and short (sell) opportunities. Special thanks to the creators of the ADX and CCI indicators for their invaluable contributions to technical analysis.
Strategy Concept
The core idea is to identify strong trends with the ADX, confirm potential entry points with the CCI, and use the MA to filter trades in the direction of the broader trend. This approach seeks to avoid entering positions during periods of consolidation or when the trend is weak.
Indicator Logic
ADX (Average Directional Index): The ADX measures the strength of a trend, regardless of its direction. A value above the customizable adx_threshold (default 20) signals a strong trend, making it a prime environment for this strategy.
CCI (Commodity Channel Index): The CCI is a momentum oscillator that helps identify overbought (above 100) and oversold (below -100) conditions. We use CCI crossovers to time entries in the direction of the prevailing trend.
MA (Moving Average): The MA acts as a trend filter, ensuring we only enter trades aligned with the overall market direction. You have flexibility in choosing the MA type (SMA, EMA, etc.) and its length to suit your trading style and timeframe.
Entry Conditions
Long (Buy):
ADX is above the adx_threshold.
CCI crosses above 100.
Price is above the chosen Moving Average (if MA trend filtering is enabled).
Short (Sell):
ADX is above the adx_threshold.
CCI crosses below -100.
Price is below the chosen Moving Average (if MA trend filtering is enabled).
Exit Conditions
Stop Loss (SL): Each position has a customizable stop-loss percentage to manage risk. The default setting is 1%.
Take Profit (TP): Each position has a customizable take-profit percentage to secure gains. The default setting is 5%.
MA-Based Risk Management (Optional): This feature allows for early exits if the price closes against the MA trend for a specified number of candles. The default setting is 2 candles.
Default Settings
CCI Period: 15
ADX Length: 10
ADX Threshold: 20
MA Type: HMA
MA Length: 200
MA Source: Close
Commission Fee: $0.0
A commission fee is not added, add your trading/platform commission for realistic trading costs.
Backtest Results
The strategy has been backtested on with the default settings and a starting capital of $1000, with 0.0% commission fee. It shows promising results.
Disclaimer: Backtesting is hypothetical and does not guarantee future performance.
Important Considerations:
Customization: The strategy offers extensive customization to tailor it to your preferences. Experiment with different parameters and settings to find what works best for your trading style.
Risk Management: Always use proper risk management techniques, including position sizing and stop losses, to protect your capital.
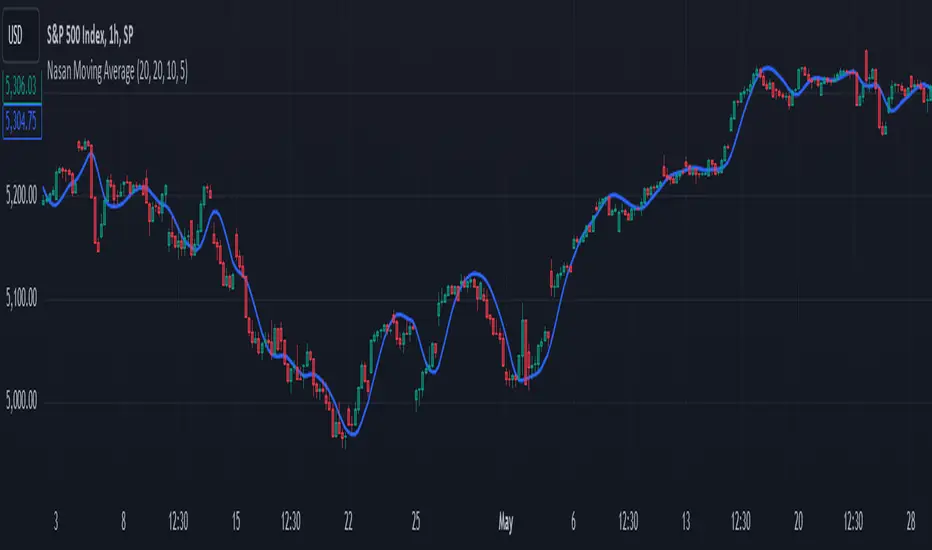
Nasan Moving AverageNasan Moving Average belong to the group of moving average which provides a high degree of smoothness with very low lag.
The calculation process involves several steps to analyze the typical price of a financial asset over specific periods. It starts by computing a simple moving average and standard deviation of the typical price. Then, it standardizes (differencing TP - Average Typical price over previous n periods) the price and applies an inverse hyperbolic sine transformation to the standardized value. The transformed values are summed cumulatively, and various weighted moving averages are calculated to adjust and smooth the data. The final output is a smoothed signal with reduced lag.
Input Parameters:
len: Differencing length (default 21, Use a minimum of 5 and for lower time frames less than 15 min use values between 300 -3000)
len1: Correction Factor Length 1 (default 21, this determines the length of the MA you want , eg. 10 MA, 50 MA, 100 MA, )
len2: Correction Factor Length 2 (default 9, this works best if it is ~ </=1/2 of len1 )
len3: Smoothing Length (default 5, I would not change this and only use if I want to introduce lag where you want to use it for cross over strategies).
Differencing and Standardization:
The code calculates the standardized price a by differencing the typical price and normalizing it using the mean and standard deviation. This step standardizes the price changes.
Transformation:
The transformation using logarithms and square roots (b) aim to stabilize the variance and make the distribution more normal-like, improving the robustness of the cumulative sum c.
Cumulative Sum:
The cumulative sum c of the transformed series helps in integrating the series over time, capturing the overall trend and movement.
Correction Factors:
Correction factors c1 and c4 adjust the cumulative sum based on weighted averages, to correct any biases or to align it with the typical price.
Smoothing:
The final result c6 is smoothed using a weighted moving average, reducing noise and making it easier to interpret trends.
BBTrend w SuperTrend decision - Strategy [presentTrading]This strategy aims to improve upon the performance of Traidngview's newly published "BB Trend" indicator by incorporating the SuperTrend for better trade execution and risk management. Enjoy :)
█Introduction and How it is Different
The "BBTrend w SuperTrend decision - Strategy " is a trading strategy designed to identify market trends using Bollinger Bands and SuperTrend indicators. What sets this strategy apart is its use of two Bollinger Bands with different lengths to capture both short-term and long-term market trends, providing a more comprehensive view of market dynamics. Additionally, the strategy includes customizable take profit (TP) and stop loss (SL) settings, allowing traders to tailor their risk management according to their preferences.
BTCUSD 4h Long Performance
█ Strategy, How It Works: Detailed Explanation
The BBTrend strategy employs two key indicators: Bollinger Bands and SuperTrend.
🔶 Bollinger Bands Calculation:
- Short Bollinger Bands**: Calculated using a shorter period (default 20).
- Long Bollinger Bands**: Calculated using a longer period (default 50).
- Bollinger Bands use the standard deviation of price data to create upper and lower bands around a moving average.
Upper Band = Middle Band + (k * Standard Deviation)
Lower Band = Middle Band - (k * Standard Deviation)
🔶 BBTrend Indicator:
- The BBTrend indicator is derived from the absolute differences between the short and long Bollinger Bands' lower and upper values.
BBTrend = (|Short Lower - Long Lower| - |Short Upper - Long Upper|) / Short Middle * 100
🔶 SuperTrend Indicator:
- The SuperTrend indicator is calculated using the average true range (ATR) and a multiplier. It helps identify the market trend direction by plotting levels above and below the price, which act as dynamic support and resistance levels. * @EliCobra makes the SuperTrend Toolkit. He is GOAT.
SuperTrend Upper = HL2 + (Factor * ATR)
SuperTrend Lower = HL2 - (Factor * ATR)
The strategy determines market trends by checking if the close price is above or below the SuperTrend values:
- Uptrend: Close price is above the SuperTrend lower band.
- Downtrend: Close price is below the SuperTrend upper band.
Short: 10 Long: 20 std 2
Short: 20 Long: 40 std 2
Short: 20 Long: 40 std 4
█ Trade Direction
The strategy allows traders to choose their trading direction:
- Long: Enter long positions only.
- Short: Enter short positions only.
- Both: Enter both long and short positions based on market conditions.
█ Usage
To use the "BBTrend - Strategy " effectively:
1. Configure Inputs: Adjust the Bollinger Bands lengths, standard deviation multiplier, and SuperTrend settings.
2. Set TPSL Conditions: Choose the take profit and stop loss percentages to manage risk.
3. Choose Trade Direction: Decide whether to trade long, short, or both directions.
4. Apply Strategy: Apply the strategy to your chart and monitor the signals for potential trades.
█ Default Settings
The default settings are designed to provide a balance between sensitivity and stability:
- Short BB Length (20): Captures short-term market trends.
- Long BB Length (50): Captures long-term market trends.
- StdDev (2.0): Determines the width of the Bollinger Bands.
- SuperTrend Length (10): Period for calculating the ATR.
- SuperTrend Factor (12): Multiplier for the ATR to adjust the SuperTrend sensitivity.
- Take Profit (30%): Sets the level at which profits are taken.
- Stop Loss (20%): Sets the level at which losses are cut to manage risk.
Effect on Performance
- Short BB Length: A shorter length makes the strategy more responsive to recent price changes but can generate more false signals.
- Long BB Length: A longer length provides smoother trend signals but may be slower to react to price changes.
- StdDev: Higher values create wider bands, reducing the frequency of signals but increasing their reliability.
- SuperTrend Length and Factor: Shorter lengths and higher factors make the SuperTrend more sensitive, providing quicker signals but potentially more noise.
- Take Profit and Stop Loss: Adjusting these levels affects the risk-reward ratio. Higher take profit percentages can increase gains but may result in fewer closed trades, while higher stop loss percentages can decrease the likelihood of being stopped out but increase potential losses.

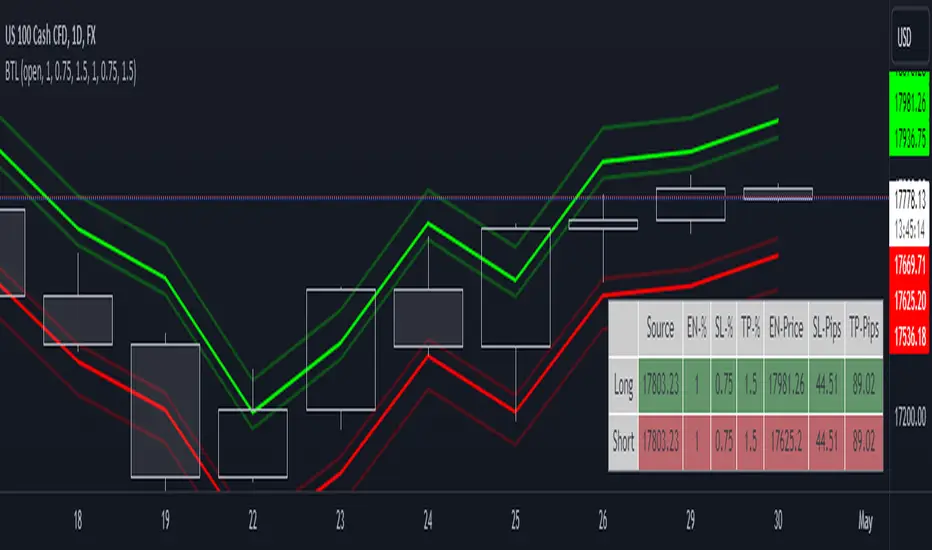
[MAD] Entrytool / Bybit-LinearThis indicator, "Entry Tool," was coded at request for Sandmann .
It is designed to provide traders with real-time feedback for strategizing entries, exits, and liquidation levels for trades initiated at that given moment.
The tool visualizes average entry prices, stop-loss levels, multiple take-profit targets, and potential liquidation prices, offering a comprehensive overview of possible trade outcomes. It aids traders in pre-planning their trades by visually simulating the impact of different trading decisions directly on the live chart. Each setting and parameter can be customized to align with individual trading strategies and risk tolerances, making this tool versatile for various trading styles, including day trading, swing trading, and position trading.
------------------------------
Steps to Use the Indicator:
1. Basic Setup:
Setup Type: Choose between "Long" or "Short" to set the direction of the trade.
Leverage: Adjust the leverage to understand its impact on your potential returns and liquidation price.
Tracking follows the close price, alternative you can enter a specific price.
2. Position Setup:
Initial Entry Amount: Set the starting amount for the trade.
Distance: First Increment Percentage from Entry price
Amount: Define the increase for the first incremental addition to the position and specify the amount to be added.
Distance: Second Increment Percentage from Entry
Amount: Set the increase for the second incremental addition and the corresponding amount.
3. Risk Management:
Stop-Loss (SL) Percentage: Set the percentage below or above the average entry price at which the position should be closed to minimize losses.
Take-Profit (TP) Percentages: Define up to four different profit target levels by specifying the percentage above or below the average entry price.
4. Visual Settings:
Box Colors: Customize the colors of the boxes that represent long and short positions to differentiate easily on the chart.
Box Extension: Determine the length by which the box extends beyond the current bar, which helps in visualizing the potential price movement.
Line Colors and Extensions: Select colors for various lines such as the Average Entry Line, Stop-Loss Line, Take-Profit Lines, and Liquidations Line. Adjust the length of these lines for better visibility.
Label Settings: Configure the distance of labels from their corresponding lines and set the font size for better readability.
5. Additional Features:
Liquidation Price Visualization: This new feature calculates and displays the liquidation price based on the current leverage and margin settings, giving traders a critical insight into their risk exposure.
Interactive Drag Point: Adjust the start price manually by dragging the point on the chart, which dynamically updates entry and exit levels as well as risk metrics.
Detailed Leverage Data Array: Input different scenarios with specific leverage, initial margin, and maintenance rates to see how these factors impact potential liquidation points.
6. Informations about leverage calculation
The data used are fetched from Bybit for Linear pairs to calculate the liquidations like in their documentation.
Keep in mind that other exchanges may calulate based on another formular.

Breakout Trade LevelsThis indicator is designed for trading CFD indices, focusing specifically on breakout strategies.
For instance, utilize this indicator to set up a bracket order at the beginning of the trading day, anticipating a breakout in NAS100 with a movement of 1% in either direction. Utilizing the Open Price, it calculates the Entry Price, Stop Loss (SL), and Take Profit (TP) based on percentage movements.
Movement based on Buying/Selling VolumeDescription:
The "Buying Selling Volume" indicator calculates buying and selling volumes based on price movements within a specified lookback period. It then computes exponential moving averages (EMAs) of these volumes to determine trend direction. The indicator visually represents trend direction on the chart.
Volume Calculation and Normalization (Lines #1 - #12):
The indicator first computes the buying volume (BV) and selling volume (SV) based on price movements within the specified lookback period. These volumes are calculated proportionally to the distance between the closing price and the high and low of each candle.
To ensure consistent behavior and prevent division by zero, the volumes are normalized using a conditional statement to handle cases where the high and low are equal, which implies a lack of price movement.
Additionally, the volume (vol) is normalized to ensure non-zero division in subsequent calculations.
Total Volume and Proportional Volume Calculation (Lines #13 - #20):
The total volume (TP) is computed by summing the buying and selling volumes.
The proportional buying volume (BPV) and selling volume (SPV) are then calculated based on their respective contributions to the total volume.
These proportional volumes are scaled by the total volume to ensure accurate representation relative to market activity.
Evaluating Buying and Selling Pressure (Lines #21 - #24):
The code segment assigns positive or negative values to represent buying and selling pressure, respectively, based on the comparison between BPV and SPV. This step involves determining whether the buying pressure exceeds the selling pressure or vice versa.
The calculated values, denoted as BPc1 and SPc1, encapsulate the relative strength of buying and selling forces within the market.
EMA Calculation and Trend Identification (Lines #25 - #32):
The BPc1 and SPc1 values are subjected to exponential moving average (EMA) calculations using the specified lookback period (LookbackL). This process involves smoothing out the buying and selling pressure data to reveal underlying trends.
The resulting EMAs, represented by ema1B and ema1S, serve as crucial indicators of trend direction. A bullish trend is indicated when ema1B exceeds ema1S, while a bearish trend is signaled when ema1B falls below ema1S.
Secondary Volume Analysis and Trend Confirmation (Lines #33 - #42):
A similar volume analysis and EMA calculation process is repeated in this segment, using a different lookback period (LookbackL2). This allows for a secondary assessment of market dynamics and trend direction.
The resulting EMAs, denoted as ema1B2 and ema1S2, are compared to validate the trend direction identified in the primary analysis.
Visual Representation and Trend Display (Lines #43 - #46):
Finally, the indicator visualizes the identified trends on the chart by plotting colored shapes based on the comparison between the primary and secondary trend directions.
A green color indicates alignment in bullish trends, a red color signifies alignment in bearish trends, while a neutral color (gray) represents no clear consensus between the primary and secondary analyses.
Ideal Usage:
1. **Trend Confirmation:** Traders can use this indicator to confirm trend direction before entering trades.
2. **Reversal Signals:** Changes in trend direction, indicated by shifts in plotted shape colors, can signal potential market reversals.
Warnings:
1. **False Signals:** Like any technical indicator, false signals may occur, especially during low-volume or choppy market conditions. Additional analysis and risk management techniques are essential to mitigate potential losses.
2. **Parameter Sensitivity:** Adjusting lookback periods can impact the indicator's sensitivity to price movements. Traders should test different parameter settings and consider market conditions when using the indicator.

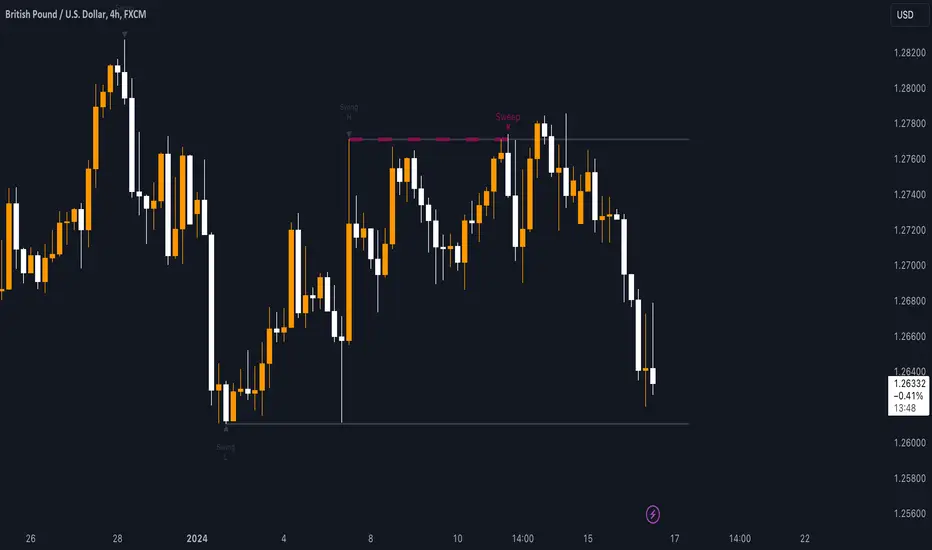
Sweep institutionalThis indicator focuses on identifying "SWEEPs" based on taking liquidity at highs and lows. The application of the SWEEP strategy is highly determinant in the Swing points, as they serve as the target of our operations.
ALERTS INCLUDED
🔹Example of Strategy Application
1.-Create the BULLISH SWEEP.
2.-You can enter LONG.
3.-If it is a BULLISH SWEEP, take a long with a SWING HIGH target (2-3 pips up).
4.-If it is a BULLISH SWEEP, place your SL behind the SWEEP (2-3 pips).
(This example is bullish, but it would be the same in a bearish setup, applying everything in the opposite way)
t's very crucial for the strategy to reference SWING POINTS, as these points will be our take profit and stop loss points.
The strategy is based on identifying a SWEEP. After this, we can look for trading opportunities with targets on the opposite side of the fractal. Remember, if you decide to enter, the Stop Loss should be placed protected by the Sweep, and the Take Profit should be set at the opposite Swing, as seen in the example.
Use this STRATEGY IN TIMEFRAMES GREATER THAN 30M. If you decide to use it in timeframes <30M, there's a higher probability of encountering false SWEEPs (the most optimal are 1h & 4h)
🔹Use
The Sweep strategy involves identifying potential trades based on the creation of a "SWEEP" (liquidity grab) at the Swing High or Swing Low. Below is an example of a bearish opportunity after taking liquidity from a Swing High with a wick and no candle body closing above it.
🔹Details
As you have seen, it indicates the surpassing of a high without the candle body, this is called a “SWEEP.” Each time this occurs, the price is likely to surpass the opposite SWING High/Low. The following example will show more clearly how it works in both bullish and bearish scenarios.
🔹Configuration
-Cooldown period: is the length of the operating Range line
-Swing detection: determines the points to be used as SL and TP protection
Bullish/Berish Sweep
-Line Width: size of the line
-Line Style: design type
-Color
Megabar Breakout (Range & Volume & RSI)Hey there,
This strategy is based on the idea that certain events lead to what are called Megabars. Megabars are bars that have a very large range and volume. I wanted to verify whether these bars indicate the start of a trend and whether one should follow the trend.
Summary of the Code:
The code is based on three indicators: the range of the bar, the volume of the bar, and the RSI. When certain values of these indicators are met, a Megabar is identified. The direction of the Megabar indicates the direction in which we should trade.
Why do I combine these indicators?
I want to identify special bars that have the potential to mark the beginning of a breakout. Therefore, a bar needs to exhibit high volume, have a large range (huge price movement), and we also use the Relative Strength Index (RSI) to assess potential momentum. Only if all three criteria are met within one candle, do we use this as an identifier for a megabar.
Explanation of Drawings on the Chart:
As you can see, there is a green background on my chart. The green background symbolizes the time when I'm entering a trade. Only if a Megabar happens during that time, I'm ready to enter a trade. The time is between 6 AM and 4 PM CET. It's just because I prefer that time. Also, the strategy draws an error every time a Megabar happens based on VOL and Range only (not on the RSI). That makes it pretty easy to go through your chart and check the biggest bars manually. You can activate or deactivate these settings via the input data of the strategy.
When Do We Enter a Trade?
We wait for a Megabar to happen during our trading session. If the Megabar is bullish, we open a LONG trade at the opening price of the next candle. If the Megabar is bearish, we open a SHORT trade at the opening price of the next candle.
Where Do We Put Our Take Profit & Stop Loss?
The default setting is TP = 40 Pips and SL = 30 Pips. In that case, we are always trading with a risk-reward ratio of 1.33 by default. You can easily change these settings via the input data of the strategy.
Strategy Results
The criteria for Megabars were chosen by me in a way that makes Megabars something special. They are not intended to occur too frequently, as the fundamental idea of this strategy would otherwise not hold. This results in only 37 closed trades within the last 12 months. If you change the criterias for a megabar to a milder one, you will create more Megabars and therefore more trades. It's up to you. I have adapted this strategy to the 30-minute chart of the EURUSD. In the evaluation, we consider a period of 12 months, which I believe is sufficient.
My default settings for the indicators look like this:
Avg Length Vol 20
Avg Multiplier Vol 3
Avg Length Range 20
Avg Multiplier Range 4
Value SMA RSI for Long Trades 50
Value SMA RSI for Short Trades 70
IMPORTANT: The current performance overview does not display the results of these settings. Please change the settings to my default ones so that you can see how I use this strategy.
I do not recommend trading this strategy without further testing. The script is meant to reflect a basic idea and be used as a tool to identify Megabars. I have made this strategy completely public so that it can be further developed. One can take this framework and test it on different timeframes and different markets.

Dynamic Volume-Volatility Adjusted MomentumThis Indicator in a refinement of my earlier script PC*VC Moving average Old with easier to follow color codes, overbought and oversold zones. This script has converted the previous script into a standardized measure by converting it into Z-scores and also incorporated a volatility based dynamic length option. Below is a detailed Explanation.
The "Dynamic Volume-Volatility Adjusted Momentum" or "Nasan Momentum Oscillator" is designed to capture market momentum while accounting for volume and volatility fluctuations. It leverages the Typical Price (TP), calculated as the average of high, low, and close prices, and introduces the Price Coefficient (PC) based on deviations from the simple moving average (SMA) across various time frames. Additionally, the Volume Coefficient (VC) compares current volume to SMA, and calculates Intraday Volatility (IDV) which gauges the daily price range relative to the close. Then intraday volatility ratio is calculated ( IDV Ratio) as the ratio of current Intraday Volatility (IDV) to the average of IDV for three different length periods, which provides a relative measure of current intraday volatility compared to its recent historical average. An inter-day ATR based Relative Volatility (RV) is calculated to adjusts for changing market volatility based on which the dynamic length adjustment adapts the moving average (standard length is 14). The PC *VC/IDV Ratio integrates price, volume, and volatility information which provides a volume and volatility adjusted momentum. This volume and volatility adjusted momentum is converted into a standardized Z-Score. The Z-Score measures deviations from the mean. Color-coded plots visually represent momentum, and thresholds aid in identifying overbought or oversold conditions.
The indicator incorporates a nuanced approach to emphasize the joint impact of price and volume while considering the stabilizing effect of lower intraday volatility. Placing the volume ratio (VC) in the numerator means that higher volume positively contributes to the overall ratio, aligning with the observation that increased volumes often accompany robust price movements. Simultaneously, the decision to include the inverse of intraday volatility (1/IDV) in the denominator acts as a dampener, reducing the impact of extreme intraday volatility on the momentum indicator. This design choice aims to filter out noise, giving more weight to significant price changes supported by substantial trading activity. In essence, the indicator's design seeks to provide a more robust momentum measure that balances the influence of price, volume, and volatility in the analysis of market dynamics.
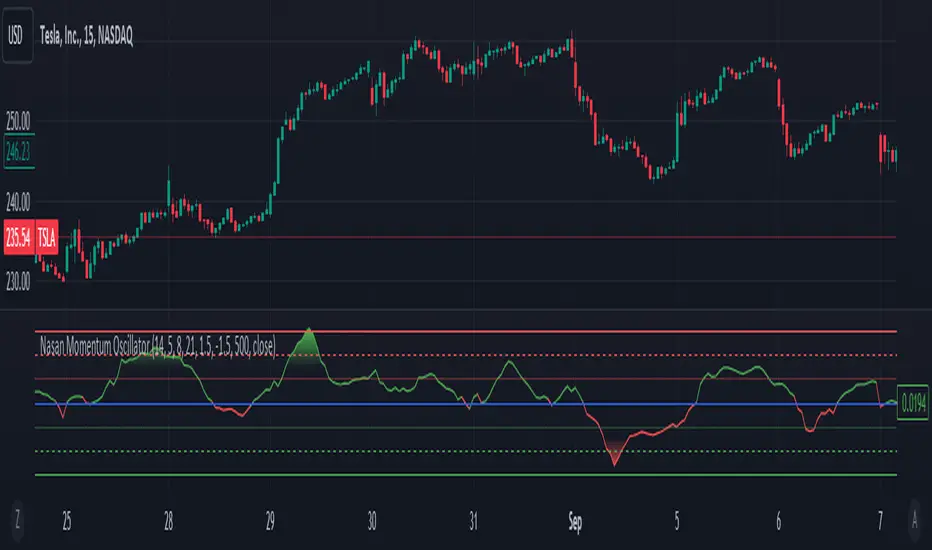
Ranges With Targets [ChartPrime]The Ranges With Targets indicator is a tool designed to assist traders in identifying potential trading opportunities on a chart derived from breakout trading. It dynamically outlines ranges with boxes in real-time, providing a visual representation of price movements. When a breakout occurs from a range, the indicator will begin coloring the candles. A green candle signals a long breakout, suggesting a potential upward movement, while a red candle indicates a short breakout, suggesting a potential downward movement. Grey candles indicate periods with no active trade. Ranges are derived from daily changes in price action.
This indicator builds upon the common breakout theory in trading whereby when price breaks out of a range; it may indicate continuation in a trend.
Additionally, users have the ability to customize their risk-reward settings through a multiplier referred to as the Target input. This allows traders to set their Take Profit (TP) and Stop Loss (SL) levels according to their specific risk tolerance and trading strategy.
Furthermore, the indicator offers an optional stop loss setting that can automatically exit losing trades, providing an additional layer of risk management for users who choose to utilize this feature.
A dashboard is provided in the top right showing the statistics and performance of the indicator; winning trades; losing trades, gross profit and loss and PNL. This can be useful when analyzing the success of breakout trading on a particular asset or timeframe.

Intersection PointThis publication focusses at the intersection of 2 lines, and a trend estimation derived from a comparison of Intersection Point value against current price value.
The formula to calculate the Intersection Point (IP) is:
change1 = ta.change (valueLine1)
change2 = ta.change (valueLine2)
sf = (valueLine2 - valueLine1 ) / (change1 - change2)
I = valueLine1 + change1 * sf
🔶 USAGE
🔹 Future / Past Intersection
The position where 2 lines would intersect in the future is shown here by extending both lines and a yellow small line to indicate its location:
Of course this can change easily when price changes.
If "Back" is enabled, the IP in history can be seen:
The yellow line which indicates the IP is only visible when it is not further located then +/- 500 bars from current bar.
If this point is further away, lines towards the IP still will be visible (max 500 bars further) without the IP.
🔹 Trend
The calculated intersection price is compared with the latest close and used for estimating the trend direction.
When close is above the intersection price (I), this is an indication the market is trending up, if close is below I, this would indicate the market is trending down.
The included bands can be useful for entry/SL/TP,...
🔶 DETAILS
🔹 Map.new()
All values are put in a map.new() with the function value()
The latest Intersection is also placed in this map with the function addLastIntersectValue() and retrieved at the last bar (right top)
🔹 Intersection Point Line
The intersection price can be made visible by enabling "Intersection Price" in SETTINGS -> STYLE. To ensure lines aren't drawn all over the place, this value is limited to maximum high + 200 days-ATR and minimum low - 200 days-ATR.
🔶 SETTINGS
🔹 Choose the value for both lines :
Type : choose between
• open, high, low, close,
• SMA, EMA, HullMA, WMA, VWMA, DEMA, TEMA
• The Length setting sets 1 of these Moving Averages when chosen
• src 1 -> You can pick an external source here
🔹 Length Intersection Line : Max length of line:
Intersection Line will update untillthe amount of bars reach the "Length Intersection Line"
💜 PURPLE BARS 😈
• Since TradingView has chosen to give away our precious Purple coloured Wizard Badge, bars are coloured purple 😊😉