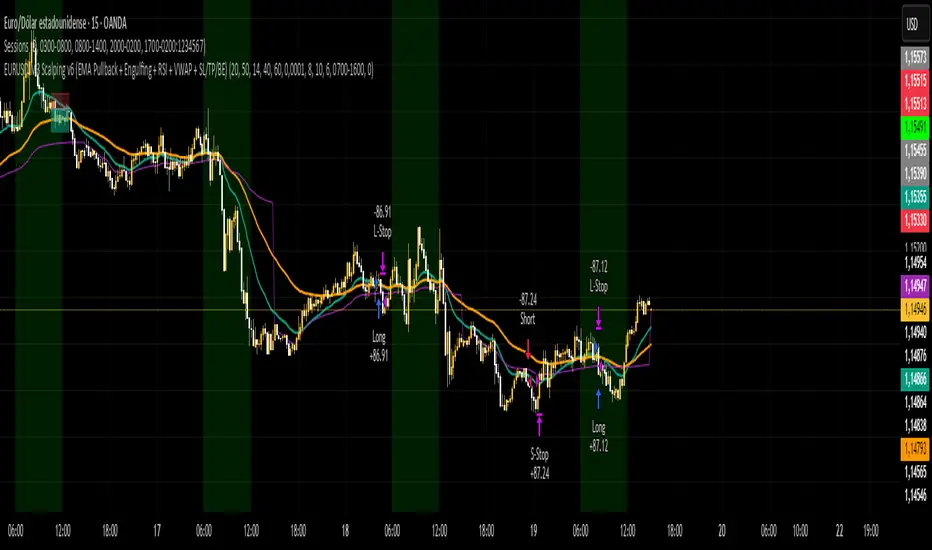
Estrategy EURUSD M3 Scalping Estrategia para operar el EURUSD en temp de 3 min, indica sl y tp 6 pips sl y 10 pips tp
스크립트에서 "tp"에 대해 찾기
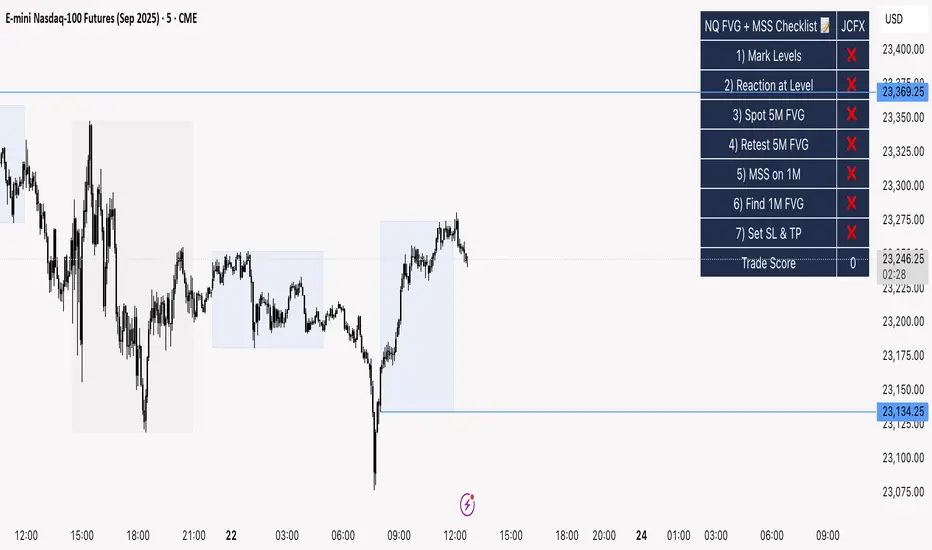
NQ FVG + MSS ChecklistThe NQ FVG + MSS Quick Checklist is a simple yet powerful visual tool for traders focusing on the Nasdaq 100 (NQ) futures. It provides a step-by-step checklist to assess trade setups based on key market concepts like Fair Value Gaps (FVG), Market Structure Shifts (MSS), session highs/lows, and previous day levels.
This indicator helps you quickly see which elements of your trading plan are met before entering a trade. Each checklist item can be manually toggled, and a cumulative Trade Score provides a quick visual guide to setup strength.
Key Features:
Step-by-step checklist for NQ trading setups
Track levels: Session highs/lows & Previous Day High/Low
Spot 5M FVG and Retests
Identify MSS on 1M and find 1M FVG inside MSS
Manual SL & TP guidance
Trade Score for quick setup strength assessment
Fully visible table overlay on top of the chart
How to Use:
Mark session & previous day levels
Observe reaction at key levels (Sweep or Continue)
Identify 5M FVG and any retests
Spot 1M MSS and 1M FVG inside MSS
Set SL/TP based on FVG extremes and next session levels
Check the cumulative Trade Score for setup confirmation
Note: This indicator is manual input-based, letting traders tick off items as they analyze the chart, making it a lightweight trading checklist HUD that stays on top of all chart elements.
GrayZone Sniper [CHE] — Breakout Validation System GrayZone Sniper — Breakout Validation System
Trade only the clean breakouts. Detect the sideways “gray zone,” wait for a confirmed breach, and act only when momentum (TFRSI) and range expansion (Mean Deviation) align. Clear long/short triggers, one-shot exit signals, and persistent levels keep your manual trading disciplined and repeatable.
Why it boosts manual trading
* No guesswork: Grey box marks consolidation; you trade the validated break.
* Fewer fakeouts: Triggers require momentum + volatility—not just a wick through a level.
* Rules > bias: Optional close-only signals stop intrabar noise.
* Built-in exits: One-shot LS/SS (Long/Short Stop) when conditions degrade.
* Actionable visuals: Gray-zone boxes, persistent highs/lows, and a smooth T3 trendline.
What it does (short + precise)
1. Maps consolidation as a gray box (running high/low while state is neutral).
2. Validates breakouts only when:
* Mean Deviation filter says current range expands vs. its own baseline, and
* TFRSI momentum is above 50 + deadzone (long) or below 50 − deadzone (short), and
* Price closes beyond the last gray high/low (optional close-only).
→ You get L (long) or S (short).
3. Manages exits with a smooth T3 trendline plus MD trend: when MD weakens and T3 turns against the prior side, you get a single LS/SS stop signal.
4. Extends structure: Last gray-zone H/L can persist as right-extended levels for retests/targets.
5. Ready for alerts: Prebuilt alert conditions for L, S, LS, SS.
Signals at a glance
* L – Long Trigger (validated breakout up)
* S – Short Trigger (validated breakout down)
* LS – Long Stop (exit hint for open long)
* SS – Short Stop (exit hint for open short)
Why TFRSI + Mean Deviation is a killer combo
They measure different, complementary things—and that reduces correlated errors.
* Mean Deviation (MD) = range expansion filter. It checks whether current absolute deviation of Typical Price from its SMA (|TP − SMA(TP)|) is greater than its own historical mean deviation baseline. In plain English: *is the market actually moving beyond its usual wiggle?* If not, most breakouts are noise.
* TFRSI = directional momentum around a 50 baseline, normalized and smoothed to react fast while avoiding raw RSI twitchiness.
* Synergy:
* MD confirms there’s energy (volatility regime has expanded).
* TFRSI confirms where that energy points (bull or bear).
* Requiring both gives you high-quality, directional expansion—the exact condition that tends to produce follow-through, while filtering the classic “thin break, immediate snap-back.”
Result: Fewer trades, better quality. You skip most range breaks without momentum or momentum pops without real expansion.
Inputs & Functions (clean overview)
Core: TFRSI & MD
* TFRSI Length (`tfrsiLen`, default 6): Longer = smoother, slower.
* TFRSI Smoothing (`tfrsiSignalLen`, default 2): SMA on TFRSI for cleaner signals.
* Mean Deviation Period (`mdLen`, default 20): Baseline for expansion filter.
* Use classical MD (`useTaDev`, default off):
* Off: MD vs current SMA (warning-free internal baseline).
* On: Classical `ta.dev` implementation.
* TFRSI Deadzone ± around 50 (`tfrsiDeadzone`, default 1.0): Wider deadzone = stricter momentum confirmation (less chop).
Triggers & Logic
* Trigger only on bar close (`fireOnCloseOnly`, default on): Confirmed signals only; no intrabar flicker.
* Reset gray bounds after trigger (`resetGrayBoundsAfterTrigger`, default on): Clears last gray H/L once a trade triggers.
* Auto-deactivate on neutral (`autoDeactivateOnNeutral`, default off): Strict disarm when state flips back to neutral.
Gray-Zone Boxes
* Show boxes (`showGrayBoxes`, default on): Draws the neutral consolidation box.
* Max boxes (`maxGrayBoxes`, default 10): How many historic boxes to keep.
* Transparency (`boxFillTransp`/`boxBorderTransp`, defaults 85/30): Visual tuning.
Trendline (T3)
* T3 Length (`t3Length`, default 3): Smoothing depth (higher = smoother).
* T3 Volume Factor (`t3VolumeFactor`, default 0.7): Controls responsiveness of the T3 curve.
Persistent Levels
* Persist gray H/L (`saveGrayLevels`, default on): Extend last gray high/low to the right.
* Max saved level pairs (`maxSavedGrayLvls`, default 1): How many H/L pairs to keep.
* Reset levels on trigger (`resetLevelsOnTrig`, default off): Clean slate after new trigger.
Debug & Visuals
* Show debug markers (`showDebugMarkers`, default on): Display L/S/LS/SS in the pane.
* Show legend (`showLegend`, default on): Compact legend (top-right).
How to trade it (practical)
1. Keep close-only on. Let the market finish the candle.
2. Wait for a clean gray box. Let the range define itself.
3. Take only L/S triggers where MD filter passes and TFRSI confirms.
4. Use persistent levels for retests/partials/targets.
5. Respect LS/SS. When expansion fades and T3 turns, exit without debate.
Tuning tips:
* More chop? Increase `tfrsiDeadzone` or `mdLen`.
* Want faster entries? Slightly reduce `t3Length` or deadzone, but expect more noise.
* Works across assets/timeframes (crypto/FX/indices/equities).
Bottom line
GrayZone Sniper enforces a simple, robust rule: Don’t touch the market until it breaks a defined range with real expansion and aligned momentum. That’s why TFRSI + Mean Deviation is hard to beat—and why your manual breakout trades get cleaner, calmer, and more consistent.
Disclaimer:
The content provided, including all code and materials, is strictly for educational and informational purposes only. It is not intended as, and should not be interpreted as, financial advice, a recommendation to buy or sell any financial instrument, or an offer of any financial product or service. All strategies, tools, and examples discussed are provided for illustrative purposes to demonstrate coding techniques and the functionality of Pine Script within a trading context.
Any results from strategies or tools provided are hypothetical, and past performance is not indicative of future results. Trading and investing involve high risk, including the potential loss of principal, and may not be suitable for all individuals. Before making any trading decisions, please consult with a qualified financial professional to understand the risks involved.
By using this script, you acknowledge and agree that any trading decisions are made solely at your discretion and risk.
Enhance your trading precision and confidence with Triple Power Stop (CHE)! 🚀
Happy trading
Chervolino
Wickless Tap Signals Wickless Tap Signals — TradingView Indicator (v6)
A precision signal-only tool that marks BUY/SELL events when price “retests” the base of a very strong impulse candle (no wick on the retest side) in the direction of trend.
What it does (in plain English)
Finds powerful impulse candles:
Bull case: a green candle with no lower wick (its open ≈ low).
Bear case: a red candle with no upper wick (its open ≈ high).
Confirms trend with an EMA filter:
Only looks for bullish bases while price is above the EMA.
Only looks for bearish bases while price is below the EMA.
Waits for the retest (“tap”):
Later, if price revisits the base of that wickless candle
Bullish: taps the candle’s low/open → BUY signal
Bearish: taps the candle’s high/open → SELL signal
Optional level “consumption” so each base can trigger one signal, not many.
The idea: a wickless impulse often marks strong initiative order flow. The first retest of that base frequently acts as a springboard (bull) or ceiling (bear).
Exact rules (formal)
Let tick = syminfo.mintick, tol = tapTicks * tick.
Trend filter
inUp = close > EMA(lenEMA)
inDn = close < EMA(lenEMA)
Wickless impulse candles (confirmed on bar close)
Bullish wickless: close > open and abs(low - open) ≤ tol
Bearish wickless: close < open and abs(high - open) ≤ tol
When such a candle closes with trend alignment:
Store bullTapLevel = low (for bull case) and its bar index.
Store bearTapLevel = high (for bear case) and its bar index.
Signals (must happen on a later bar than the origin)
BUY: low ≤ bullTapLevel + tol and inUp and bar_index > bullBarIdx
SELL: high ≥ bearTapLevel - tol and inDn and bar_index > bearBarIdx
One-shot option
If enabled, once a signal fires, the stored level is cleared so it won’t trigger again.
Inputs (Settings)
Trend EMA Length (lenEMA): Default 200.
Use 50–100 for intraday, 200 for swing/position.
Tap Tolerance (ticks) (tapTicks): Default 1.
Helps account for tiny feed discrepancies. Set 0 for strict equality.
One Signal per Level (oneShot): Default ON.
If OFF, multiple taps can create multiple signals.
Plot Tap Levels (plotLevels): Draws horizontal lines at active bases.
Show Pattern Labels (showLabels): Marks the origin wickless candles.
Plots & Visuals
EMA trend line for context.
Tap Levels:
Green line at bullish base (origin candle’s low/open).
Red line at bearish base (origin candle’s high/open).
Signals:
BUY: triangle-up below the bar on the tap.
SELL: triangle-down above the bar on the tap.
Labels (optional):
Marks the original wickless impulse candle that created each level.
Alerts
Two alert conditions are built in:
“BUY Signal” — fires when a bullish tap occurs.
“SELL Signal” — fires when a bearish tap occurs.
How to set:
Add the indicator to your chart.
Click Alerts (⏰) → Condition = this indicator.
Choose BUY Signal or SELL Signal.
Set your alert frequency and delivery method.
Recommended usage
Timeframes: Works on any; start with 5–15m intraday, or 1H–1D for swing.
Markets: Equities, futures, FX, crypto. For thin/illiquid assets, consider a slightly larger Tap Tolerance.
Confluence ideas (optional, but helpful):
Higher-timeframe trend agreeing with your chart timeframe.
Volume surge on the origin wickless candle.
S/R, order blocks, or SMC structures near the tap level.
Avoid major news moments when slippage is high.
No-repaint behavior
Origin patterns are detected only on bar close (barstate.isconfirmed), so bases are created with confirmed data.
Signals come after the origin bar, on subsequent taps.
There is no lookahead; lines and shapes reflect information known at the time.
(As with all real-time indicators, an intrabar tap can trigger an alert during the live bar; the signal then remains if that condition held at bar close.)
Known limitations & design choices
Single active level per side: The script tracks only the most recent bullish base and most recent bearish base.
Want a queue of multiple simultaneous bases? That’s possible with arrays; ask and we’ll extend it.
Heikin Ashi / non-standard candles: Wick definitions change; for consistent behavior use regular OHLC candles.
Gaps: On large gaps, taps can occur instantly at the open. Consider one-shot ON to avoid rapid repeats.
This is an indicator, not a strategy: It does not place trades or compute PnL. For backtesting, we can convert it into a strategy with SL/TP logic (ATR or structure-based).
Practical tips
Tap Tolerance:
If you miss obvious taps by a hair, increase to 1–2 ticks.
For FX/crypto with tiny ticks, even 0 or 1 is often enough.
EMA length:
Shorten for faster signals; lengthen for cleaner trend selection.
Risk management (manual suggestion):
For BUY signals, consider a stop slightly below the tap level (or ATR-based).
For SELL signals, consider a stop slightly above the tap level.
Scale out or trail using structure or ATR.
Quick checklist
✅ Price above EMA → watch for a green no-lower-wick candle → store its low → BUY on tap.
✅ Price below EMA → watch for a red no-upper-wick candle → store its high → SELL on tap.
✅ Use Tap Tolerance to avoid missing precise touches by one tick.
✅ Consider One Signal per Level to keep trades uncluttered.
FAQ
Q: Why did I not get a signal even though price touched the level?
A: Check Tap Tolerance (maybe too strict), trend alignment at the tap bar, and that the tap happened after the origin candle. Also confirm you’re on regular candles.
Q: Can I see multiple bases at once?
A: This version tracks the latest bull and bear bases. We can extend to arrays to keep N recent bases per side.
Q: Will it repaint?
A: No. Bases form on confirmed closes, and signals only on later bars.
Q: Can I backtest it?
A: This is a study. Ask for the strategy variant and we’ll add entries, exits, SL/TP, and stats.

Breakout asia USD/CHF1 — Customizable Parameters
sess1 & sess2: The two time ranges that define the Asian session (e.g., 20:00–23:59 and 00:00–08:00).
Important: format is HHMM-HHMM.
rr: The risk/reward ratio (default = 3.0, meaning TP = 3× risk size).
onePerSess: Toggle to allow only one trade per Asian session or multiple.
bufTicks: Extra margin for the SL beyond the signal candle.
2 — Detecting the Asian Session
The script checks if the candle’s time is inside the first range (sess1) or inside the second range (sess2).
While inside the Asian session, it updates the current high and low.
When the session ends, it locks in these levels as rangeHigh and rangeLow.
3 — Step 1: Detecting the Initial Breakout
Bullish breakout → close above rangeHigh → flag breakoutUp is set to true.
Bearish breakout → close below rangeLow → flag breakoutDown is set to true.
No trade yet — this is just the breakout signal.
4 — Step 2: Waiting for the Retest
If a bullish breakout occurred, wait for the price to return to or slightly below rangeHigh and then close back above it.
If a bearish breakout occurred, wait for the price to return to or slightly above rangeLow and then close back below it.
5 — Entry & Exit
When the retest is confirmed:
strategy.entry() is triggered.
SL = behind the retest confirmation candle (with optional bufTicks margin).
TP = entry price ± RR × risk size.
If onePerSess is enabled, no further trades happen until the next Asian session.
6 — Chart Display
Green line = locked Asian session high.
Red line = locked Asian session low.
Light blue background = active Asian session hours.
Trade entries are shown on the chart when retests occur.

Hassi XAUUSD STRATEGY BOTGold (XAUUSD) 15m trend+momentum based signals with EMA(9/21/200), RSI, custom ADX, ATR-based SL/TP & alerts
Works on XAUUSD 15m.
Entry: EMA9/21 cross + price relative to EMA200 + RSI filter + custom ADX trend strength.
Risk: default SL=1.5×ATR, TP=2×ATR (editable).
Notes: No financial advice. Backtest before live use. Avoid high-impact news whipsaws.

Mutanabby_AI | Ultimate Algo | Remastered+Overview
The Mutanabby_AI Ultimate Algo Remastered+ represents a sophisticated trend-following system that combines Supertrend analysis with multiple moving average confirmations. This comprehensive indicator is designed specifically for identifying high-probability trend continuation and reversal opportunities across various market conditions.
Core Algorithm Components
**Supertrend Foundation**: The primary signal generation relies on a customizable Supertrend indicator with adjustable sensitivity (1-20 range). This adaptive trend-following tool uses Average True Range calculations to establish dynamic support and resistance levels that respond to market volatility.
**SMA Confirmation Matrix**: Multiple Simple Moving Averages (SMA 4, 5, 9, 13) provide layered confirmation for signal strength. The algorithm distinguishes between regular signals and "Strong" signals based on SMA 4 vs SMA 5 relationship, offering traders different conviction levels for position sizing.
**Trend Ribbon Visualization**: SMA 21 and SMA 34 create a visual trend ribbon that changes color based on their relationship. Green ribbon indicates bullish momentum while red signals bearish conditions, providing immediate visual trend context.
**RSI-Based Candle Coloring**: Advanced 61-tier RSI system colors candles with gradient precision from deep red (RSI ≤20) through purple transitions to bright green (RSI ≥79). This visual enhancement helps traders instantly assess momentum strength and overbought/oversold conditions.
Signal Generation Logic
**Buy Signal Criteria**:
- Price crosses above Supertrend line
- Close price must be above SMA 9 (trend confirmation)
- Signal strength determined by SMA 4 vs SMA 5 relationship
- "Strong Buy" when SMA 4 ≥ SMA 5
- Regular "Buy" when SMA 4 < SMA 5
**Sell Signal Criteria**:
- Price crosses below Supertrend line
- Close price must be below SMA 9 (trend confirmation)
- Signal strength based on SMA relationship
- "Strong Sell" when SMA 4 ≤ SMA 5
- Regular "Sell" when SMA 4 > SMA 5
Advanced Risk Management System
**Automated TP/SL Calculation**: The indicator automatically calculates stop loss and take profit levels using ATR-based measurements. Risk percentage and ATR length are fully customizable, allowing traders to adapt to different market conditions and personal risk tolerance.
**Multiple Take Profit Targets**:
- 1:1 Risk-Reward ratio for conservative profit taking
- 2:1 Risk-Reward for balanced trade management
- 3:1 Risk-Reward for maximum profit potential
**Visual Risk Display**: All risk management levels appear as both labels and optional trend lines on the chart. Customizable line styles (solid, dashed, dotted) and positioning ensure clear visualization without chart clutter.
**Dynamic Level Updates**: Risk levels automatically recalculate with each new signal, maintaining current market relevance throughout position lifecycles.
Visual Enhancement Features
**Customizable Display Options**: Toggle trend ribbon, TP/SL levels, and risk lines independently. Decimal precision adjustments (1-8 decimal places) accommodate different instrument price formats and personal preferences.
**Professional Label System**: Clean, informative labels show entry points, stop losses, and take profit targets with precise price levels. Labels automatically position themselves for optimal chart readability.
**Color-Coded Momentum**: The gradient RSI candle coloring system provides instant visual feedback on momentum strength, helping traders assess market energy and potential reversal zones.
Implementation Strategy
**Timeframe Optimization**: The algorithm performs effectively across multiple timeframes, with higher timeframes (4H, Daily) providing more reliable signals for swing trading. Lower timeframes work well for day trading with appropriate risk adjustments.
**Sensitivity Adjustment**: Lower sensitivity values (1-5) generate fewer but higher-quality signals, ideal for conservative approaches. Higher sensitivity (15-20) increases signal frequency for active trading styles.
**Risk Management Integration**: Use the automated risk calculations as baseline parameters, adjusting risk percentage based on account size and market conditions. The 1:1, 2:1, 3:1 targets enable systematic profit-taking strategies.
Market Application
**Trend Following Excellence**: Primary strength lies in capturing significant trend movements through the Supertrend foundation with SMA confirmation. The dual-layer approach reduces false signals common in single-indicator systems.
**Momentum Assessment**: RSI-based candle coloring provides immediate momentum context, helping traders assess signal strength and potential continuation probability.
**Range Detection**: The trend ribbon helps identify ranging conditions when SMA 21 and SMA 34 converge, alerting traders to potential breakout opportunities.
Performance Optimization
**Signal Quality**: The requirement for both Supertrend crossover AND SMA 9 confirmation significantly improves signal reliability compared to basic trend-following approaches.
**Visual Clarity**: The comprehensive visual system enables rapid market assessment without complex calculations, ideal for traders managing multiple instruments.
**Adaptability**: Extensive customization options allow fine-tuning for specific markets, trading styles, and risk preferences while maintaining the core algorithm integrity.
## Non-Repainting Design
**Educational Note**: This indicator uses standard TradingView functions (Supertrend, SMA, RSI) with normal behavior patterns. Real-time updates on current candles are expected and standard across all technical indicators. Historical signals on closed candles remain fixed and unchanged, ensuring reliable backtesting and analysis.
**Signal Confirmation**: Final signals are confirmed only when candles close, following standard technical analysis principles. The algorithm provides clear distinction between developing signals and confirmed entries.
Technical Specifications
**Supertrend Parameters**: Default sensitivity of 4 with ATR length of 11 provides balanced signal generation. Sensitivity range from 1-20 allows adaptation to different market volatilities and trading preferences.
**Moving Average Configuration**: SMA periods of 8, 9, and 13 create multi-layered trend confirmation, while SMA 21 and 34 form the visual trend ribbon for broader market context.
**Risk Management**: ATR-based calculations with customizable risk percentage ensure dynamic adaptation to market volatility while maintaining consistent risk exposure principles.
Recommended Settings
**Conservative Approach**: Sensitivity 4-5, RSI length 14, higher timeframes (4H, Daily) for swing trading with maximum signal reliability.
**Active Trading**: Sensitivity 6-8, RSI length 8-10, intermediate timeframes (1H) for balanced signal frequency and quality.
**Scalping Setup**: Sensitivity 10-15, RSI length 5-8, lower timeframes (15-30min) with enhanced risk management protocols.
## Conclusion
The Mutanabby_AI Ultimate Algo Remastered+ combines proven trend-following principles with modern visual enhancements and comprehensive risk management. The algorithm's strength lies in its multi-layered confirmation approach and automated risk calculations, providing both novice and experienced traders with clear signals and systematic trade management.
Success with this system requires understanding the relationship between signal strength indicators and adapting sensitivity settings to match current market conditions. The comprehensive visual feedback system enables rapid decision-making while the automated risk management ensures consistent trade parameters.
Practice with different sensitivity settings and timeframes to optimize performance for your specific trading style and risk tolerance. The algorithm's systematic approach provides an excellent framework for disciplined trend-following strategies across various market environments.

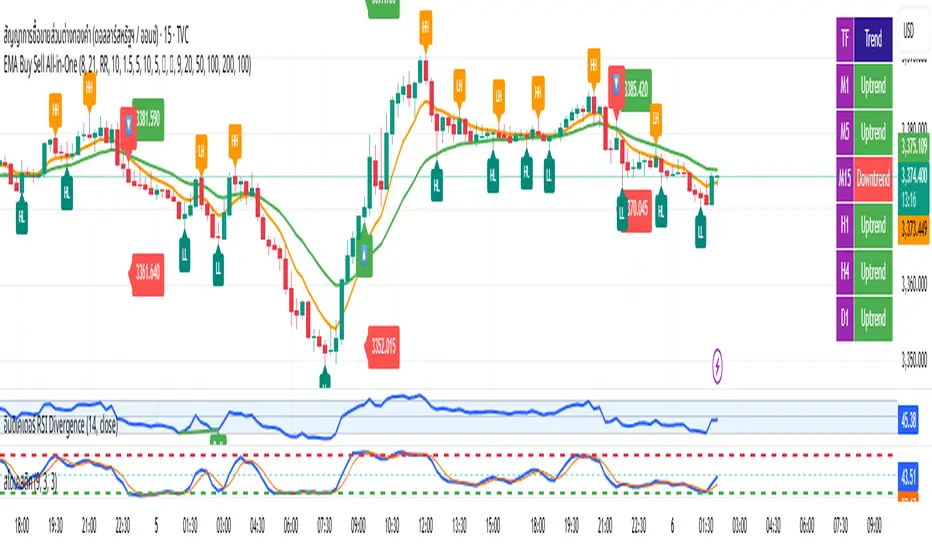
EMA Buy Sell All-in-One✨ Description (แนะนำให้ใช้ตอนกด Publish):
This all-in-one indicator combines several powerful trading tools into one script:
• EMA Cross Entry System: Customizable fast/slow EMA cross for buy/sell signals
• Dynamic SL/TP System: Choose between swing-based or custom SL/TP; auto-calculated RR support
• HH, HL, LH, LL Labels: Market structure points marked directly on chart (toggle ON/OFF)
• Multi-Timeframe Trend Table: Visual overview of EMA trends across D1 → M1 timeframes
• H1 Trend Change Icons: Alerts when the hourly trend flips direction
➤ Clean and responsive display
➤ Fully customizable via input panel
➤ Great for intraday or swing traders following trend + structure alignment
Feel free to fork or modify. Made for those who want clarity and confluence in one view.
Ayman – Full Smart Suite Auto/Manual Presets + PanelIndicator Name
Ayman – Full Smart Suite (OB/BoS/Liq/FVG/Pin/ADX/HTF) + Auto/Manual Presets + Panel
This is a multi-condition trading tool for TradingView that combines advanced Smart Money Concepts (SMC) with classic technical filters.
It generates BUY/SELL signals, draws Stop Loss (SL) and Take Profit (TP1, TP2) levels, and displays a control panel with all active settings and conditions.
1. Main Features
Smart Money Concepts Filters:
Order Block (OB) Zones
Break of Structure (BoS)
Liquidity Sweeps
Fair Value Gaps (FVG)
Pin Bar patterns
ADX filter
Higher Timeframe EMA filter (HTF EMA)
Two Operating Modes:
Auto Presets: Automatically adjusts all settings (buffers, ATR multipliers, RR, etc.) based on your chart timeframe (M1/M5/M15).
Manual Mode: Fully customize all parameters yourself.
Trade Management Levels:
Stop Loss (SL)
TP1 – partial profit
TP2 – full profit
Visual Panel showing:
Current settings
Filter status
Trend direction
Last swing levels
SL/TP status
Alerts for BUY/SELL conditions
2. Entry Conditions
A BUY signal is generated when all these are true:
Trend: Price above EMA (bullish)
HTF EMA: Higher timeframe trend also bullish
ADX: Trend strength above threshold
OB: Price in a valid bullish Order Block zone
BoS: Structure break to the upside
Liquidity Sweep: Sweep of recent lows in bullish context
FVG: A bullish Fair Value Gap is present
Pin Bar: Bullish Pin Bar pattern detected (if enabled)
A SELL signal is generated when the opposite conditions are met.
3. Stop Loss & Take Profits
SL: Placed just beyond the last swing low (BUY) or swing high (SELL), with a small ATR buffer.
TP1: Partial profit target, defined as a ratio of the SL distance.
TP2: Full profit target, based on Reward:Risk ratio.
4. How to Use
Step 1 – Apply Indicator
Open TradingView
Go to your chart (recommended: XAUUSD, M1/M5 for scalping)
Add the indicator script
Step 2 – Choose Mode
AUTO Mode: Leave “Use Auto Presets” ON – parameters adapt to your timeframe.
MANUAL Mode: Turn Auto OFF and adjust all lengths, buffers, RR, and filters.
Step 3 – Filters
In the Filters On/Off section, enable/disable specific conditions (OB, BoS, Liq, FVG, Pin Bar, ADX, HTF EMA).
Step 4 – Trading the Signals
Wait for a BUY or SELL arrow to appear.
SL and TP levels will be plotted automatically.
TP1 can be used for partial close and TP2 for full exit.
Step 5 – Alerts
Set alerts via BUY Signal or SELL Signal to receive notifications.
5. Best Practices
Scalping: Use M1 or M5 with AUTO mode for gold or forex pairs.
Swing Trading: Use M15+ and adjust buffers/ATR manually.
Combine with price action confirmation before entering trades.
For higher accuracy, wait for multiple filter confirmations rather than acting on the first arrow.
6. Summary Table
Feature Purpose Can Disable?
Order Block Finds key supply/demand zones ✅
Break of Structure Detects trend continuation ✅
Liquidity Sweep Finds stop-hunt moves ✅
Fair Value Gap Confirms imbalance entries ✅
Pin Bar Price action reversal filter ✅
ADX Trend strength filter ✅
HTF EMA Higher timeframe confirmation ✅

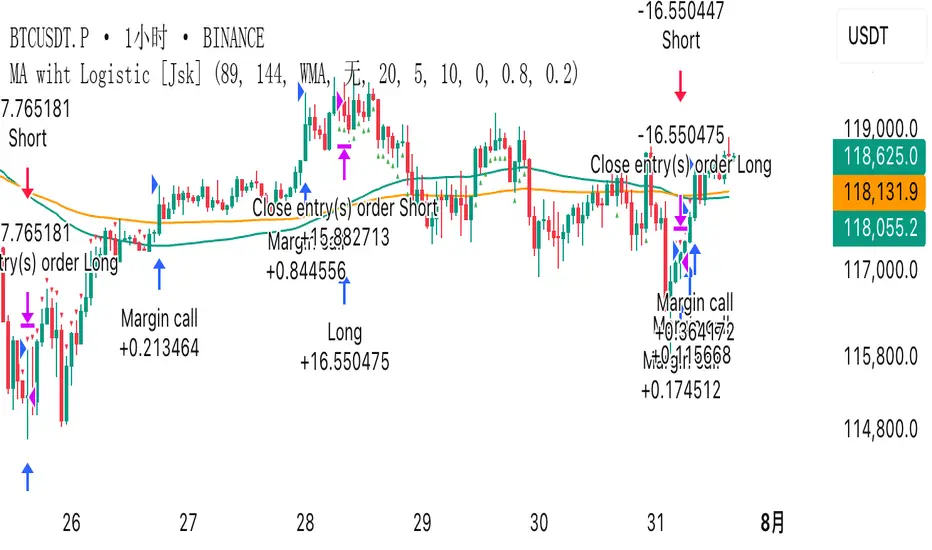
MA wiht Logistic [Jsk]This script is published for educational purposes only and does not constitute financial advice. Past performance does not guarantee future results. Trade at your own risk; the author accepts no liability for any financial loss incurred.
Concept
• Direction is defined by the relationship between price and two moving averages (Fast & Slow).
Long: Close > Fast MA > Slow MA
Short: Close < Fast MA < Slow MA
• Three independent exit modes are available:
1) None – positions are closed only when an opposite signal appears.
2) Percentage – fixed take-profit / stop-loss expressed in % of entry price (default +20 % / –5 %).
3) Logistic – a dynamic take-profit / stop-loss based on a logistic transformation of unrealised P&L.
Key Inputs
• MA Type: EMA, SMA or WMA
• Fast / Slow MA length
• Exit Mode: None | Percentage | Logistic
• Percentage TP / SL values (active when Exit Mode = Percentage)
• Logistic settings: slope k, midpoint, TP / SL probability thresholds (active when Exit Mode = Logistic)
Recommended Use
The script works on any market or timeframe, but MA-based trend filters usually perform better in assets with smooth, directional moves. Always verify results in the Strategy Tester and account for commissions and slippage.
Anti Nyangkut – Indikator Karya Anak Bangsa Anti Nyangkut – Indikator Karya Anak Bangsa
Indikator ini khusus buat kamu yang sering beli di pucuk dan jual di support, lalu akhirnya jadi bahan backtest orang lain.
💡 Sinyal buy only - muncul kalau harga udah:
✅ Di atas MA5
✅ Di atas Bollinger Bands Upper
✅ Di atas VWAP (khusus 1H & 4H)
🟢 TP dan SL otomatis muncul — biar gak cuma "niat hold sampe hijau"
📊 Cocok buat scalping & swing di 1H / 4H / 1D
Gak ada sinyal jual. Exit di tangan masing-nasing, jangan lupa pasang SL.
—
100% gratis. Bayarnya pakai amal jariyah.
—
Anti Nyangkut – An Indicator by the People, for the People
This one's for you if you always buy the top, sell the bottom, and end up becoming someone else's backtest data.
💡 Buy-Only Signals — triggered when price is:
✅ Above MA5
✅ Above Bollinger Bands Upper
✅ Above VWAP (on 1H & 4H only)
🟢 Auto TP & SL lines — so you stop saying "I'll hold until it turns green"
📊 Perfect for scalping & swing trades on 1H / 4H / 1D
There’s no sell signal. Exits are your responsibility — just don’t skip the stop loss.
—
100% free. Just pay with good karma.

Momentum Reversal StrategyBEST USE IN 15MIN TIME FRAME EURUSD / XAUSUD
1. Strategy Overview
This strategy hunts short-term momentum reversals at key levels during high-liquidity sessions.
Timeframes: 5-minute for entries; 15-minute for trend context
Sessions: London for EUR/USD & GBP/USD; New York for XAU/USD
Pairs: EUR/USD, GBP/USD, XAU/USD
Indicators (3 max):
EMA(20) and EMA(50) (close)
MACD (12, 26, 9) histogram
Optional: RSI(14) (for divergence filter)
2. Entry Rules
Trend Filter (15 min):
Long only if EMA20 > EMA50; short only if EMA20 < EMA50.
Price-Action Zone (5 min):
Identify recent swing high/low within past 20 bars.
Draw horizontal support (for longs) or resistance (for shorts).
Indicator Alignment (5 min):
MACD histogram crossing from negative to positive for longs, positive to negative for shorts.
Candle close beyond EMA20 in direction of trade.
Candle Confirmation:
Bullish engulfing or hammer at support for longs; bearish engulfing or shooting star at resistance for shorts.
Entry Execution:
Place market order on candle close that meets all above.
3. Exit Rules
Stop-Loss (SL):
Long: 1.5× ATR(14) below entry candle low.
Short: 1.5× ATR(14) above entry candle high.
Take-Profit (TP):
Set at 2× SL distance (RR 1:2).
Trailing SL:
After price moves 1× SL in profit, trail SL to breakeven.
Partial Booking:
Close 50% at 1× SL (50% of TP), move SL to entry.
Close remaining at full TP.
4. Trade Management
False Signal Filter: Skip trades when RSI(14) > 70 for longs or < 30 for shorts (avoids overbought/oversold extremes).
One Trade at a Time: No multiple positions on same pair.
Session Cutoff: Close any open trade 15 minutes before session end.
5. Risk Parameters
Risk per Trade: 1% of account equity.
Reward Target: ≥2% (1:2 RR) per trade.
Win-Rate Expectancy: ≥75% based on indicator confluence and price-action confirmation.

TradePlanner ProPlan smarter. Trade with precision.
TradePlanner Pro is a professional-grade overlay tool designed to streamline your trading decisions by visually organizing your trade plans directly on the chart. Built for traders who value preparation and clarity, this script enables precise entry planning, risk management, and target visualization—all tailored per symbol.
Core Purpose
TradePlanner Pro helps you map out potential trades using pre-defined symbol-based presets. It dynamically calculates position sizes based on your account size or fixed risk, then visualizes key trade levels (Entry, Take Profits, Stop Loss) with profit/loss metrics in both dollar and percentage terms. It's the perfect companion for traders who prepare their setups in advance and want their plans clearly represented on the chart.
Key Features
🔹 Per-Symbol Presets: Define entries, up to 3 take-profit levels, and stop-losses for each ticker.
🔹 Dynamic Risk Sizing: Choose between percentage-based risk or fixed dollar risk per trade.
🔹 Visual Trade Mapping: Automatically plots Entry, TP1–TP3, and SL lines on your chart.
🔹 Real-Time P&L Labels: Displays profit/loss amounts and percentages, with optional R/R ratios.
🔹 Custom Investment Display: Shows how much capital is allocated per trade.
🔹 Clean, Configurable UI: Adjust label positions, font sizes, opacity, and label visibility to match your style.
Whether you're swing trading or day trading, TradePlanner Pro helps you stay disciplined, organized, and confident in your execution.
How to Use TradePlanner Pro – Step-by-Step Guide
TradePlanner Pro is designed to be easy to set up while giving you full control over how your trades are visualized and calculated. Here’s how to get started:
1. Start with Default Settings
By default, the script assumes:
Account Size: $10,000
Max Money per Trade (%): 1.0%
Max Risk (USD): 0 (disabled; only percentage risk is used)
This means the script will size each trade to risk 1% of your account balance per trade unless you override it with a fixed USD risk amount.
2. Set Up Your Symbol Presets
The "Symbol Presets" input is a flexible text area where you define trade setups for each ticker.
Format (one per line):
SYMBOL:Entry,TP1 ,SL
Example:
AAPL:250,260,270,240
MSFT:100,110,90
TSLA:180,200,170
You can include 1 to 3 take-profit levels.
The script will only activate for the current chart’s symbol, matching what's listed.
3. Customize Risk Parameters
You can use:
Account % Risk – Based on account size and % risk.
Fixed USD Risk – When a dollar amount is entered (>0), it takes priority and calculates share size based on the risk per share.
There's also an option to round share quantities down to whole units, which is useful for stock or crypto trading platforms that only allow whole-number units.
4. Choose What to Display
Toggle on/off these elements as needed:
Show Entry/TP/SL Lines
Show P&L Labels – Profit/loss amounts at each target and SL.
Show Amount Invested – Includes total dollar value in the quantity label.
Show Percentages – Adds % gain/loss to each label.
Show Risk/Reward Ratios – Optionally displayed beside or below TP labels.
You can further adjust:
Font size and label opacity
Label position offset – In percent of price range, so they don’t overlap the actual levels.
5. Read the Visual Outputs
Once the preset matches the current chart symbol:
Lines will appear for Entry, TP1-TP3, and Stop Loss.
Labels will display your:
Trade quantity (and invested amount)
Dollar and % profit at each target
Total loss at stop loss
Optional R/R ratios
Everything updates dynamically and adjusts to your current chart scale and bar availabilit

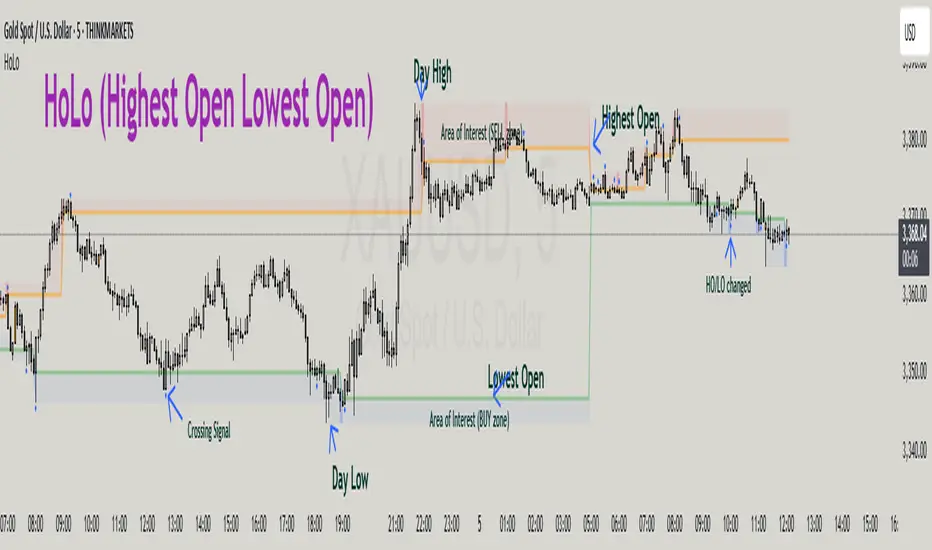
HoLo (Highest Open Lowest Open)HoLo (Highest Open Lowest Open) Method
Overview
HoLo stands for "Highest Open Lowest Open" – a forex trading strategy.
Core Concept
Definition of HoLo:
Highest Open (HO): The highest opening price among all H1 candles of the current trading day
Lowest Open (LO): The lowest opening price among all H1 candles of the current trading day
Trading Day: Starts at Asia Open Session
Strategy Setup
Step 1: Mark Key Levels
Current day's High/Low
Highest Open and Lowest Open (from H1 candles)
Step 2: Define the Area of Interest
Sell Zone: Between the Highest Open and the current day's High
Buy Zone: Between the Lowest Open and the current day's Low
Trade Entry Rules
Sell Trade:
Price goes above the Highest Open
Trigger candle (M5, M15, or M30) closes above the Highest Open
Enter a sell when price revisits the Highest Open level (Sell Stop Order)
Buy Trade:
Price drops below the Lowest Open
Trigger candle closes below the Lowest Open
Enter a buy when price revisits the Lowest Open level (Buy Stop Order)
Trigger Timeframe:
Choose M1, M5, or M15 based on:
Your screen time availability
Personal trading style
Risk and Profit Management
Stop Loss:
For sell: Set SL at the day’s High + spread
For buy: Set SL at the day’s Low + spread
Take Profit (TP) Basic Rule:
You should open 2 positions:
When profit reaches 1R: Take partial profit + move SL to BE (Break Even)
Let the remaining position run using partial TP or trailing stop
Money Management:
Never risk more than 1% per trade
Recommended: 0.5% risk due to multiple opportunities daily
Prioritize major pairs.
The Indicator
How to read data
For Day Traders
Monitor the sell zone (red area) for potential short entries near resistance
Watch the buy zone (blue area) for potential long entries near support
Use cross signals for entry/exit points
Pay attention to timing markers for key market hours
Alert
HO (Highest Open) level changes
LO (Lowest Close) level changes
Price crossing key levels
Timing notifications
Random State Machine Strategy📌 Random State Machine Strategy (Educational)
This strategy showcases a randomized entry model driven by a finite state machine, integrated with user-defined exit controls and a full-featured moving average filter.
🧠 Trade Entry Logic
Entries occur only when:
A random trigger occurs (~5% probability per bar)
The state machine accepts a new transition (sm.step())
Price is:
Above the selected MA for long entries
Below the selected MA for short entries
This ensures that entries are both stochastically driven and trend-aligned, avoiding frequent or arbitrary trades.
⚙️ How It Works
Randomized Triggers
A pseudo-random generator (seeded with time and volume) attempts to trigger state transitions.
Finite State Machine
Transitions are managed using the StateMachine from robbatt/lib_statemachine — credit to @robbatt for the modular FSM design.
Controlled Reset
The state machine resets every N bars (default: 100) if at least two transitions have occurred. This prevents stale or locked states.
Backtest Range
Define a specific test window using Start and End Date inputs.
Risk & Exits
Specify risk in points and a target risk/reward ratio. TP is auto-computed. Timed and MA-based exits can be toggled.
🧪 How to Use
Enable Long or Short trades
Choose your Moving Average type and length
Set Risk per trade and R/R ratio
Toggle TP/SL, timed exit, or MA cross exit
Adjust the State Reset Interval to suit your signal frequency
📘 Notes
Educational use only — not financial advice
Random logic is used to model structure, not predict movement
Thanks to @robbatt for the lib_statemachine integration

Strategy Builder With IndicatorsThis strategy script is designed for traders who enjoy building systems using multiple indicators.
Please note: This script does not include any built-in indicators. Instead, it works by referencing the plot outputs of the indicators you’ve already added to your chart.
For example, if you add a MACD and an ATR indicator to your chart, you can assign their plot values as inputs in the settings panel of this strategy.
• MACD as a trigger
• ATR as a filter
How Filters Work
Filters check whether certain conditions are met before a trade can be opened. For instance, if you set a filter like ATR > 30, then no trade will be executed unless that condition is true — even if the trigger fires.
All filters are linked, meaning every active filter must be satisfied for a trade to occur.
How Triggers Work
Triggers are what actually fire a trade signal — such as a moving average crossover or RSI breaking above a specific level. Unlike filters, triggers are independent. Only one active trigger needs to be true for the trade to execute.
Thanks to its modular structure, this strategy can be used with any indicator of your choice.
⸻
Risk Management Features
In the settings, you’ll find flexible options for:
• Stop Loss (SL)
• Trailing Stop Loss (TSL)
• Multi Take-Profit (TP)
These features enhance trade safety and let you tailor your risk management.
SL types available:
• Tick-based SL
• Percent-based SL
• ATR-based SL
Once you select your preferred SL type, you can fine-tune its distance using the offset field.
Trailing SL allows your stop to follow price as it moves in your favor — helping to lock in profits.
Multi-TP lets you take profits at two different levels, helping you secure gains while leaving room for extended moves.
Breakeven option is also available to automatically move your SL to entry after reaching a profit threshold.
⸻
How to Build a Solid Strategy
Let’s break down a good setup into three key components:
1. Trend Filter
Avoid trading against the trend — that’s like swimming against the current.
Use a filter like:
• Supertrend
• Momentum indicators
• Candlestick bias, etc.
Example: In this case, I used Supertrend and filtered for trades only if the price is above the uptrend line.
2. Trigger Condition
Once we confirm the trend is on our side, we need a trigger to execute at the right moment. This can be:
• RSI cross
• Candlestick patterns
• Trendline breaks
• Moving average crossovers, etc.
Example: I used RSI crossing above 50 as the entry trigger.
3. Risk Management
Even in the right trend at the right time — anything can happen. That’s why you should always define Stop Loss and Take Profit levels.
⸻
And there you have it! Your strategy is ready to backtest, refine, and deploy with alerts for live trading.
Questions or suggestions? Feel free to reach out

MNQ EMA StrategyThis strategy is not perfected yet. ONE MINUTE TIMEFRAME
The goal is to take Longs above the 5 ema when price is above all the 200, 30, and 5 ema.
Short side is when candle closes below the 5 ema and price is below the 300, 30, and 5 ema.
I use candle range blocks for different time zones to avoid excess orders from being triggered. As well as blocks when stoploss is hit or after a profitable trade of certain ticks.
There is an RSI to avoid trades when there isn't too much movement.
My goal is to get an entry when price trades above the 5 ema and then next candle passes it by .25 instead of entering immediately. The stoploss as the low of candle before entry and TP as 3 times the stoploss. I've tried a million times to make it like this but I don't know how to use pine script or Code.
The sell side is basically the same, enter at candle close below 5 ema wait for low to get swept to enter and stoploss above previous high, with TP 3 times the stoploss.
Publishing in hopes anyone knows how to adjust this
CAUTION THIS STRATEGY WORKS WITH CURRENT PRICE ACTION DUE TO ME USING RECENT TICK COUNT RATHER THAN BASED ON CANDLES OR PERCENTAGES. THIS WILL ONLY WORK AS LONG AS MARKET MOVES AS IT HAS BEEN SINCE 2024. CME_MINI:MNQ1!
Profit Guard ProProfitGuard Pro
ProfitGuard Pro is a risk management and profit calculation tool that helps traders optimize their trades by handling position sizing, risk management, leverage, and take profit calculations. With support for both cumulative and non-cumulative take profit strategies, this versatile indicator provides the insights you need to maximize your trading strategy.
How to Use ProfitGuard Pro:
Load the Indicator: Add ProfitGuard Pro to your chart in TradingView.
Set Your Entry Position: Input your desired entry price.
Define Your Stop Loss: Enter the price at which your trade will exit to minimize losses.
Add Take Profit Levels: Input your TP1, TP2, TP3, and TP4 levels, as needed.
If you want fewer take profit levels, adjust the number of TPs in the settings menu. You can choose between 1 to 4 take profit levels based on your strategy.
Adjust Risk Settings: Specify your account size and risk percentage to calculate position size and leverage.
Choose Cumulative or Non-Cumulative Mode: Toggle cumulative profit mode to either recalculate position sizes as each take profit is hit or keep position sizes static for each TP.
Once set up, ProfitGuard Pro will automatically calculate your position size, leverage, and potential profits for each take profit level, providing a clear visual on your chart to guide your trading decisions.
Key Features:
Risk Management:
Calculate your risk percentage based on account size and stop loss.
Visualize risk in dollar terms and percentage of your account.
Position Size & Leverage:
Automatically calculate the ideal position size and leverage for your trade based on your entry, stop loss, and risk settings.
Ensure you are trading with the appropriate leverage for your account size.
Cumulative vs Non-Cumulative Profit Mode:
Cumulative Mode: Adjusts position size after each take profit is reached, recalculating for remaining contracts.
Non-Cumulative Mode: Treats each take profit as a separate calculation using the full position size.
Take Profit Levels:
Set up to 4 customizable take profit levels.
Adjust percentage values for each TP target, and visualize them on your chart with easy-to-read lines.
Profit Calculation:
Displays potential profits for each take profit level based on whether cumulative or non-cumulative mode is selected.
Calculate your risk-reward ratio dynamically at each TP.
Customizable Visuals:
Easily customize the table's size, position, and color scheme to fit your chart.
Visualize key trade details like leverage, contracts, margin, and profits directly on your chart.
Short and Long Position Support:
Automatically adjusts calculations based on whether you're trading long or short.

Volume and Volatility Ratio Indicator-WODI策略名称
交易量与波动率比例策略-WODI
一、用户自定义参数
vol_length:交易量均线长度,计算基础交易量活跃度。
index_short_length / index_long_length:指数短期与长期均线长度,用于捕捉中短期与中长期趋势。
index_magnification:敏感度放大倍数,调整指数均线的灵敏度。
index_threshold_magnification:阈值放大因子,用于动态过滤噪音。
lookback_bars:形态检测回溯K线根数,用于捕捉反转模式。
fib_tp_ratio / fib_sl_ratio:斐波那契止盈与止损比率,分别对应黄金分割(0.618/0.382 等)级别。
enable_reversal:反转信号开关,开启后将原有做空信号反向为做多信号,用于单边趋势加仓。
二、核心计算逻辑
交易量百分比
使用 ta.sma 计算 vol_ma,并得到 vol_percent = volume / vol_ma * 100。
价格波动率
volatility = (high – low) / close * 100。
构建复合指数
volatility_index = vol_percent * volatility,并分别计算其短期与长期均线(乘以 index_magnification)。
动态阈值
index_threshold = index_long_ma * index_threshold_magnification,过滤常规波动。
三、信号生成与策略执行
做多/做空信号
当短期指数均线自下而上突破长期均线,且 volatility_index 突破 index_threshold 时,发出做多信号。
当短期指数均线自上而下跌破长期均线,且 volatility_index 跌破 index_threshold 时,发出做空信号。
反转信号模式(可选)
若 enable_reversal = true,则所有做空信号反向为做多,用于在强趋势行情中加仓。
止盈止损管理
进场后自动设置斐波那契止盈位(基于入场价 × fib_tp_ratio)和止损位(入场价 × fib_sl_ratio)。
支持多级止盈:可依次以 0.382、0.618 等黄金分割比率分批平仓。
四、图表展示
策略信号标记:图上用箭头标明每次做多/做空(或反转加仓)信号。
斐波那契区间:在K线图中显示止盈/止损水平线。
复合指数与阈值线:与原版相同,在独立窗口绘制短、长期指数均线、指数曲线及阈值。
量能柱状:高于均线时染色,反转模式时额外高亮。
Strategy Name
Volume and Volatility Ratio Strategy – WODI
1. User-Defined Parameters
vol_length: Length for volume SMA.
index_short_length / index_long_length: Short and long MA lengths for the composite index.
index_magnification: Sensitivity multiplier for index MAs.
index_threshold_magnification: Threshold multiplier to filter noise.
lookback_bars: Number of bars to look back for pattern detection.
fib_tp_ratio / fib_sl_ratio: Fibonacci take-profit and stop-loss ratios (e.g. 0.618, 0.382).
enable_reversal: Toggle for reversal mode; flips short signals to long for trend-following add-on entries.
2. Core Calculation
Volume Percentage:
vol_ma = ta.sma(volume, vol_length)
vol_percent = volume / vol_ma * 100
Volatility:
volatility = (high – low) / close * 100
Composite Index:
volatility_index = vol_percent * volatility
Short/long MAs applied and scaled by index_magnification.
Dynamic Threshold:
index_threshold = index_long_ma * index_threshold_magnification.
3. Signal Generation & Execution
Long/Short Entries:
Long when short MA crosses above long MA and volatility_index > index_threshold.
Short when short MA crosses below long MA and volatility_index < index_threshold.
Reversal Mode (optional):
If enable_reversal is on, invert all short entries to long to scale into trending moves.
Fibonacci Take-Profit & Stop-Loss:
Automatically set TP/SL levels at entry price × respective Fibonacci ratios.
Supports multi-stage exits at 0.382, 0.618, etc.
4. Visualization
Signal Arrows: Marks every long/short or reversal-add signal on the chart.
Fibonacci Zones: Plots TP/SL lines on the price panel.
Index & Threshold: Same as v1.0, with MAs, index curve, and threshold in a separate sub-window.
Volume Bars: Colored when above vol_ma; extra highlight if a reversal-add signal triggers

Liquidity Grab Strategy (Volume Trap)🧠 Strategy Logic:
Liquidity Grab Detection:
The script looks for a sharp drop in price (bearish engulfing or breakdown candle).
However, volume remains flat (within 5% of the 20-period moving average), suggesting the move is manipulated, not genuine.
Fair Value Gap Confirmation (FVG):
It confirms that a Fair Value Gap exists — a gap between recent candle bodies that price is likely to retrace into.
This gap represents a high-probability entry zone.
Trade Setup:
A limit BUY order is placed at the base of the FVG.
Stop Loss (SL) is placed below the gap.
Take Profit (TP) is placed at the most recent swing high.
📈 How to Use It:
Add the strategy to your TradingView chart (1–5 min or 15 min works well for intraday setups).
Look for green BUY labels and plotted lines:
💚 Green = Entry price
🔴 Red = Stop loss
🔵 Blue = Take profit
The script will automatically simulate entries when conditions are met and exit either at TP or SL.
Use TradingView’s Strategy Tester to review:
Win rate
Net profit
Risk-adjusted performance

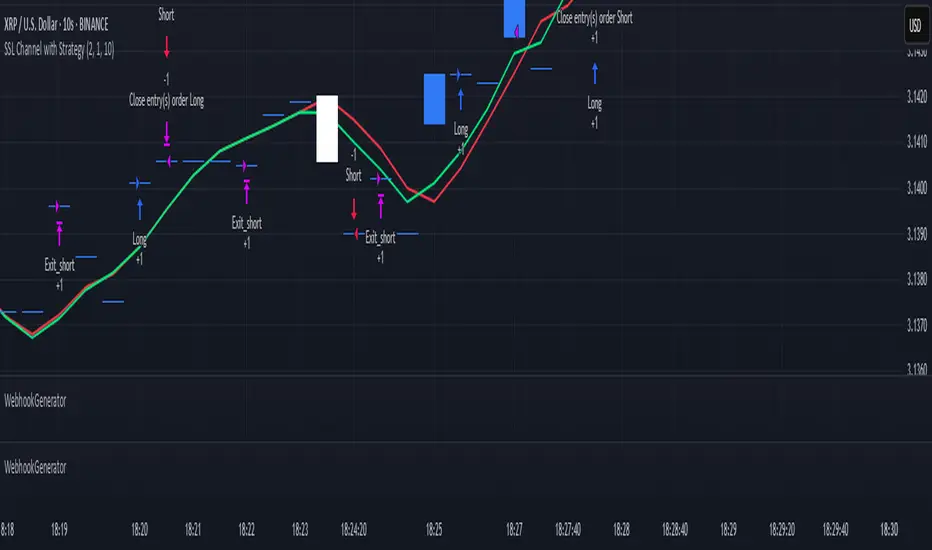
WebhookGeneratorLibrary "WebhookGenerator"
Generates Json objects for webhook messages.
GenerateOT(license_id, symbol, action, order_type, trade_type, size, price, tp, sl, risk, trailPrice, trailOffset)
CreateOrderTicket: Establishes a order ticket.
Parameters:
license_id (string) : Provide your license index
symbol (string) : Symbol on which to execute the trade
action (string) : Execution method of the trade : "MRKT" or "PENDING"
order_type (string) : Direction type of the order: "BUY" or "SELL"
trade_type (string) : Is it a "SPREAD" trade or a "SINGLE" symbol execution?
size (float) : Size of the trade, in units
price (float) : If the order is pending you must specify the execution price
tp (float) : (Optional) Take profit of the order
sl (float) : (Optional) Stop loss of the order
risk (float) : Percent to risk for the trade, if size not specified
trailPrice (float) : (Optional) Price at which trailing stop is starting
trailOffset (float) : (Optional) Amount to trail by
Returns: Return Order string
Apex Edge SMC Tactical Suite
🛰 Apex Edge SMC Tactical Suite
Apex Edge SMC Tactical Suite is a precision-engineered multi-signal tool designed for advanced traders who demand real-time edge detection, breakout identification, and smart volatility-based risk placement. Built to blend seamlessly into any price action, SMC, or momentum-based strategy.
🔧 Core Features:
📍 Entry Signals
Green & red arrows appear only when a candle meets strict "Power Candle" criteria:
High momentum breakout
Volume spike confirmation
OBV spike divergence
Trend & HTF filter optional
Volatility-adjusted stop placement
💥 Power Candles
Smart detection of explosive volume+range candles
Custom "fuel score" system ranks their momentum potential
Displays as either candle highlights or subtle labels
📊 Fuel Meter
RSI-based energy tracker with customizable threshold
Plots real-time bar strength on a mini histogram
🧠 Trap Detection + Reversals
Detects stop hunt wicks or "liquidity traps"
Shows reversal diamonds on potential reclaim setups
Built-in swing logic confirms trap reversals
🧮 HTF Filtering
Optional higher-timeframe trend filter via Hull MA
Keeps signals aligned with broader market direction
📦 TP/SL Zones
Risk is calculated using volatility clustering (recent swing zones)
TP auto-calculated using ATR-based expansion
🔔 Alerts Included:
✅ Power Candle Detection
✅ Long/Short Entry Alerts
✅ Exit Signal Alerts
✅ Trap Defense Alerts
✅ Trap Reversal Confirmations
🎯 Ideal For:
SMC / ICT traders
Breakout traders
Trend followers
Scalpers / intraday setups
Momentum + volume combo traders
⚠️ Tip: Best paired with clean chart layouts, market structure, or order block frameworks. Can be combined with internal/external liquidity sweep logic for extra confluence.
Feel free to play around with the code and if you're a professional coder (unlike me) then please tag me into any versions that you can make better. Enjoy!
Disclaimer - This script was created entirely with many hours using the assistance of ChatGPT

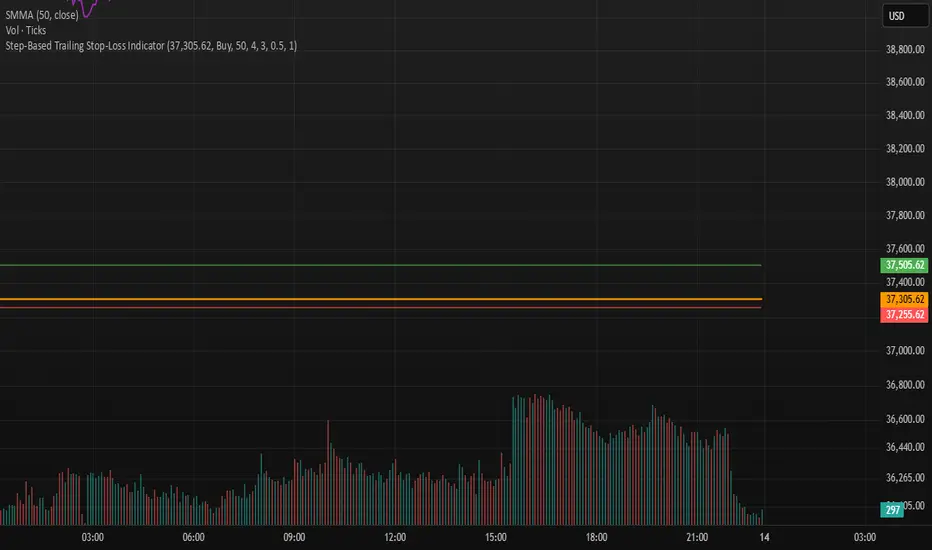
Step-Based Trailing Stop-Loss IndicatorThis indicator is built for momentum traders who want to maximize winning trades and minimize losses through a smart, step-based trailing stop-loss system. Instead of using a fixed Take Profit, this tool dynamically protects profits once the trade reaches a favorable RR (Risk-to-Reward) level.
How It Works:
Manual Entry Input
You enter your Entry Price and select Buy/Sell in the settings.
This flexibility allows backtesting or live trade tracking.
Initial Setup
Default SL: 50 ticks(Tested on us30,but works on any pair you just need to adjust SL)
TP for reference: 4R — can be used for benchmarking, but we don't limit profits with a hard TP.
Trailing Logic
Once price reaches 3R in profit:
The SL begins trailing.
It starts at 2R, keeping a 1R cushion behind the max profit.
For every 0.5R gain, SL also moves up by 0.5R:
Example: At 3.5R → SL is at 2.5R
At 5.0R → SL is at 4.0R
This trailing continues until the SL is hit or the trend exhausts.
Chart Features
🟧 Entry Line
🔴 Initial SL
🟢 Reference TP (4R, optional)
🟣 Dynamic Trailing SL
🏷️ Labels for Entry & SL levels