Dynamic Customizable 50% Line & Daily High/Low + True Day OpenA Unique Indicator for Precise Market-Level Analysis
This indicator is a fully integrated solution that automates complex market-level calculations and visualizations, offering traders a tool that goes beyond the functionality of existing open-source alternatives. By seamlessly combining several trading concepts into a single script, it delivers efficiency, accuracy, and customization that cater to both novice and professional traders.
Key Features: A Breakdown of What Makes It Unique
1. Adaptive Daily Highs and Lows
Automatically detects and plots daily high and low levels based on the selected time frame, dynamically updating in real time.
Features session-based adjustments, allowing traders to focus on levels that matter for specific trading sessions (e.g., London, New York).
Fully customizable styling, visibility, and alerts tailored to each trader’s preferences.
How It Works:
The indicator calculates daily high and low levels directly from price data, integrating session-specific time offsets to account for global trading hours. These levels provide traders with clear visual markers for key liquidity zones.
2. Automated ICT 50% Range Line
A pioneering implementation of ICT’s mid-range concept, this feature dynamically calculates and displays the midpoint of the daily range.
Offers traders a visual guide to identify premium and discount zones, aiding in determining market bias and potential trade setups.
How It Works:
The script calculates the range between the day’s high and low, dividing it by two to generate the midline. This line updates in real-time, ensuring that traders always see the most current premium and discount levels as price action evolves.
3. Dynamic Market Open Levels
Plots session opens (e.g., Asia, London, New York) and the True Day Open to provide actionable reference points for intra-day trading strategies.
Enhances precision in identifying liquidity shifts and aligning trades with institutional price movements.
How It Works:
The indicator uses predefined session times to calculate and display the opening levels for key trading sessions. It dynamically adjusts for time zones, ensuring accuracy regardless of the trader’s location.
4. Custom Watermark for Enhanced Visualization
Includes an optional watermark feature that allows users to display custom text on their charts.
Ideal for personalization, branding, or highlighting session notes without disrupting the clarity of the chart.
Why This Indicator Stands Out
First-to-Market Automation:
While the ICT 50% range line is a widely recognized concept, this is the first script to automate its calculation, combining it with other pivotal trading levels in a single tool.
All-in-One Functionality:
Unlike open-source alternatives that focus on individual features, this script integrates daily highs/lows, mid-range levels, session opens, and customizable watermarks into one cohesive system. The consolidation reduces the need for multiple indicators and ensures a clean, efficient chart setup.
Dynamic Customization:
Every feature can be adjusted to align with a trader’s strategy, time zone, or aesthetic preferences. This level of adaptability is unmatched in existing tools.
Proprietary Logic:
The indicator’s underlying calculations are built from scratch, leveraging advanced programming techniques to ensure accuracy and reliability. These proprietary methods differentiate it from similar open-source scripts.
How to Use This Indicator
Apply the Indicator:
Add it to your TradingView chart from the library.
Configure Settings:
Use the intuitive settings panel to adjust plotted levels, colors, styles, and visibility. Tailor the indicator to your trading strategy.
Incorporate into Analysis:
Combine the plotted levels with your preferred trading approach to identify liquidity zones, establish market bias, and pinpoint potential reversals or entries.
Stay Focused:
With all key levels automated and updated in real time, traders can focus on execution rather than manual plotting.
Originality and Justification for Closed Source
This script is closed-source due to its unique combination of features and proprietary logic that automates complex trading concepts like the ICT 50% range line and session-specific levels. Open-source alternatives lack this level of integration and customization, making this indicator a valuable and original contribution to the TradingView ecosystem.
What Sets It Apart from Open-Source Scripts?
Unlike open-source tools, this indicator doesn’t just replicate individual features—it enhances and integrates them into a seamless, all-in-one solution that offers traders a more efficient and effective way to analyze the market.
스크립트에서 "the script"에 대해 찾기

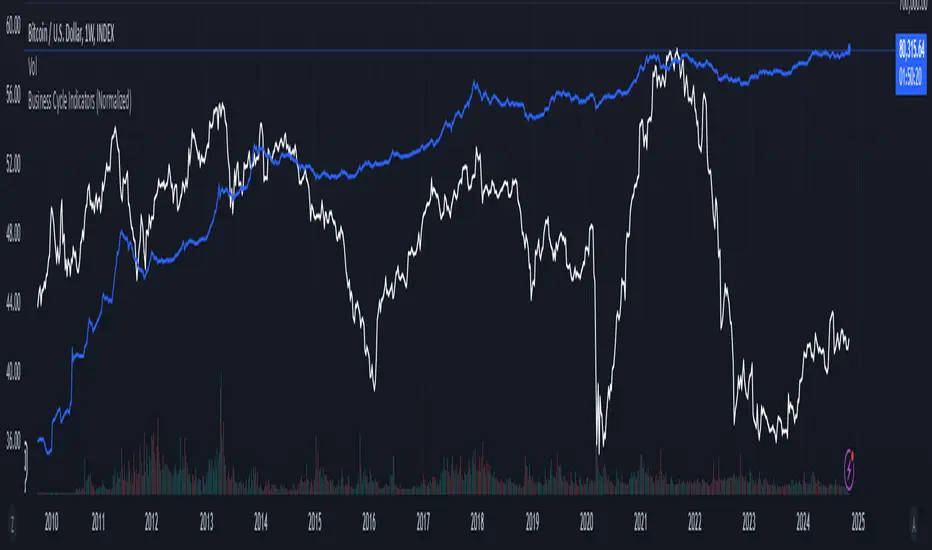
Business Cycle Indicators (Normalized)This script aggregates and normalizes several key economic indicators to provide a comprehensive view of the business cycle and overall market conditions. By combining these indicators into a single, normalized average line, the script helps identify overarching trends and shifts in the economy, aiding in more informed trading and investment decisions.
Included Indicators:
Inverted National Financial Conditions Index (NFCI):
Symbol: FRED:NFCI
Measures financial stress in the markets. An inverted NFCI aligns higher values with positive financial conditions.
Inverted Net Percentage of Banks Tightening Lending Standards (DRTSCIS):
Symbol: FRED:DRTSCIS
Reflects changes in bank lending practices. Inverting this indicator means higher values indicate easing lending standards, which is generally positive for economic growth.
HYG Close Price (iShares High Yield Corporate Bond ETF):
Symbol: AMEX:HYG
Represents the performance of high-yield corporate bonds, providing insight into credit market conditions.
Inverted High-Yield Credit Spread (BAMLH0A0HYM2):
Symbol: FRED:BAMLH0A0HYM2
Measures the spread between high-yield bonds and risk-free securities. A narrower (inverted) spread indicates better market conditions.
Manufacturing/Non-Manufacturing New Orders Ratio:
Symbols: ECONOMICS:USMNO (Manufacturing), ECONOMICS:USNMNO (Non-Manufacturing)
Compares manufacturing to non-manufacturing new orders to gauge shifts in economic activity.
US PMI (Purchasing Managers' Index):
Symbol: ECONOMICS:USBCOI
An indicator of the economic health of the manufacturing sector.
10-Year Inflation Breakeven (T10YIE):
Symbol: FRED:T10YIE
Represents market expectations of inflation over the next ten years.
Inverted 10-Year Real Yield (DFII10):
Symbol: FRED:DFII10
Reflects the real yield on 10-year Treasury Inflation-Protected Securities (TIPS). Inverted to align higher values with positive economic sentiment.
Copper/Gold Ratio:
Symbols: CAPITALCOM:COPPER (Copper), TVC:GOLD (Gold)
Compares the prices of copper and gold, often used as a barometer for global economic activity.
Features:
Normalized Indicators: Each indicator is normalized to a 0-100 scale to facilitate direct comparison, regardless of their original units or scales.
Normalized Average Line: Calculates and plots the average of all available normalized indicators, providing a single line that represents the combined economic signals.
Customizable Display:
Show Individual Indicators: Option to display individual normalized indicators for detailed analysis.
Show Normalized Average Line: Option to display the normalized average line for a consolidated view.
Dynamic Labeling: Displays the latest value of the normalized average directly on the chart for quick reference.
How to Use:
Adding the Script:
Apply the script to a chart in TradingView using a timeframe that aligns with the frequency of the economic data (daily or weekly recommended).
Customization:
Show Normalized Average Line: Enabled by default to display the combined indicator.
Show Individual Indicators: Enable this option in the script settings to display all individual normalized indicators.
Interpretation:
Normalized Scale (0-100): Higher values generally indicate stronger economic conditions, while lower values may suggest weakening conditions.
Trend Analysis: Use the normalized average line to identify trends and potential turning points in the business cycle.
Notes:
Data Availability: Ensure you have access to all the data sources used in the script. Some data feeds may require specific TradingView subscriptions.
Indicator Limitations: Economic indicators are subject to revisions and may not reflect real-time market conditions.
No Investment Advice: This script is a tool for analysis and should not be considered as financial advice. Always conduct your own research before making investment decisions.
Advanced Volume-Driven Breakout SignalsThe "Advanced Volume-Driven Breakout Signals" indicator is a cutting-edge tool designed to help traders identify high-potential trading opportunities through sophisticated volume analysis techniques. This indicator integrates volume flow analysis, moving averages, and Relative Volume (RVOL) to provide a comprehensive view of market conditions, going beyond traditional Volume Spread Analysis (VSA) methods.
Key Features:
Volume Flow Analysis: Distinguishes bullish and bearish volume flows with distinct colors, making it easier to visualize market sentiment and potential breakout points.
Volume Flow Moving Averages: Calculates moving averages for volume using various methods (SMA, EMA, WMA, HMA, VWMA), accommodating different trading strategies. This includes settings for adjusting the type of moving average and its period, as well as thresholds for high, medium, and low volume levels.
Volume Spikes Detection: Identifies significant volume spikes based on user-defined multipliers and moving averages, highlighting unusual trading activity.
Volume MA Cloud Settings: Computes general moving averages of volume to track trends and detect deviations. This feature includes options to select different moving average types and adjust thresholds for detecting high volume activity.
Relative Volume (RVOL): Measures current volume relative to historical averages, triggering signals when RVOL exceeds predefined thresholds, indicating notable changes in trading activity.
Entry Conditions: Provides clear long and short entry signals based on combined volume flow conditions and RVOL, offering actionable trading opportunities.
Volume Visualization:
— Bullish Volume Flow: Light and dark green bars indicate bullish volume flow.
— Bearish Volume Flow: Light and dark red bars denote bearish volume flow.
— High Volume Bars: Highlighted in yellow, and extreme volume bars in orange for additional context. These bars are plotted for visual aid and do not directly influence trade signals, focusing instead on the quality and strength of the volume flow.
Alerts: Allows users to create alert notifications for long and short entry signals when the criteria are met, enabling traders to respond promptly to trading opportunities.
Usage:
Overlay: Apply the indicator directly to your price chart to visualise real-time signals and volume conditions.
Customisable: Adjust settings for moving averages, RVOL, and other parameters to match your trading strategy and preferences.
Comparison to VSA Scripts: The "Advanced Volume-Driven Breakout Signals" indicator extends beyond traditional VSA scripts by incorporating a wider range of analytical features. While VSA primarily focuses on volume spread patterns and price action, this indicator offers enhanced functionality with advanced RVOL metrics, customizable moving averages, and detailed volume spike detection, making it a more versatile tool for identifying breakout opportunities and managing trades. It is particularly effective when used alongside key levels and order blocks.
Acknowledgements: Special thanks to @oh92 and @goofoffgoose for their invaluable scripts, which served as inspiration in the development of this advanced trading indicator.
Notes: The script is continually evolving, with ongoing refinements aimed at enhancing accuracy and performance.

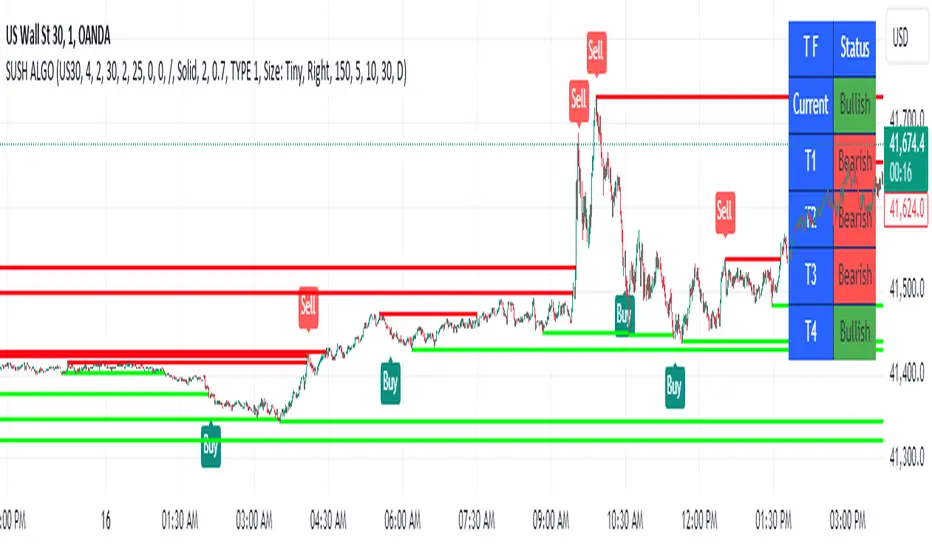
SUSH ALGOStep-by-Step Guide for Trading Using the Script
1. Asset Selection
When applying this script, the first thing to do is select your desired asset to trade.
You can select from the following assets within the script:
Scalping
Gold
USD/JPY
EUR/USD
EUR/JPY
BTC/USD
NIFTY 50
The parameters for the strategy (e.g., q, r, s, and ADX Threshold) will adjust automatically based on your selected asset. If you want to use custom parameters, turn on the Use Manual Settings option.
2. Adjust Manual Settings (Optional)
Use Manual Settings: Toggle this if you want to input your custom values for the strategy parameters.
Manual q: Affects swing period calculation.
Manual r: Affects the smoothing in the calculation of the oscillator.
Manual s: Affects the smoothing period of the main line of the oscillator.
Manual Signal Length: Length of the signal line for generating buy/sell signals.
Manual ADX Threshold: Adjusts the ADX value to filter trades based on trend strength.
3. Reading the SMI (Stochastic Momentum Index) Oscillator
SMI: This indicator oscillates between overbought and oversold levels, signaling potential entry and exit points.
Overbought Level: +30
Oversold Level: -30
The signal line is calculated based on the smoothed SMI value.
A crossover above the signal line in the oversold region (< -30) signals a buy.
A crossunder below the signal line in the overbought region (> +30) signals a sell.
4. Trade Signal Alerts
Buy Signal Alert: Triggered when the SMI crosses over the signal line in the oversold zone, and ADX exceeds the threshold.
Sell Signal Alert: Triggered when the SMI crosses under the signal line in the overbought zone, and ADX exceeds the threshold.
5. Entry, Stop Loss, and Target Levels
Entry Line: The script will plot an entry line at the close price when a buy or sell signal is triggered.
Stop Loss: A stop loss will be set based on the lowest low (for buy signals) or highest high (for sell signals) of the previous candles.
Take Profit Targets:
Target 1 (TP1): 3 times the size of the entry candle.
Target 2 (TP2): 6 times the size of the entry candle.
Target 3 (TP3): 10 times the size of the entry candle.
Make sure the Show Entry, Show Stop Loss, and Show Targets toggles are enabled to visualize these lines on the chart.
6. Monitoring the ADX (Average Directional Index)
The ADX value filters weak signals, ensuring that you trade only in trending markets.
If ADX > adxThreshold, the trend is strong, and the buy or sell signal becomes valid.
If ADX < adxThreshold, the trade signals are ignored to avoid trading in sideways markets.
7. Box, Line, and Label Toggles for Swing Highs/Lows
The script allows you to visualize swing highs and lows for better market context. You can toggle the following options:
Show Boxes: Displays rectangular boxes around the swing highs and lows.
Show Swing Lines: Plots lines at swing highs and lows for visual confirmation of key price levels.
Show Labels: Adds text labels to the swing levels, indicating whether they represent a swing high or low.
8. Customize Appearance (Optional)
You can change the appearance of the boxes, lines, and labels, such as their color, width, and style (solid or dotted), from the Appearance settings.
9. Monitor Volume and Open Interest (Optional)
You can also track volume and open interest (OI) data from various exchanges like Binance and BitMEX to get additional confirmations.
Steps for Trading
1.Select your asset from the drop-down menu based on your trading preferences.
2.Adjust manual settings (optional) if you want to use your own parameters for the strategy.
3.Wait for a buy or sell signal to trigger based on the crossover of the SMI oscillator in the overbought/oversold regions.
4.Once a signal is triggered, check for the plotted entry price, stop loss, and take profit levels on your chart.
5.Monitor the ADX value to ensure that the market is trending strongly.
6.If the trade meets your criteria, enter the trade at the indicated price.
Set your stop loss and take profit orders as indicated by the script.
Key Notes
# This strategy is designed for both trending and mean-reversion markets depending on the asset and the ADX value.
# Make sure to practice proper risk management by adjusting the stop loss and position size based on your risk tolerance.
[SGM GARCH Volatility]I'm excited to share with you a Pine Script™ that I developed to analyze GARCH (Generalized Autoregressive Conditional Heteroskedasticity) volatility. This script allows you to calculate and plot GARCH volatility on TradingView. Let's see together how it works!
Introduction
Volatility is a key concept in finance that measures the variation in prices of a financial asset. The GARCH model is a statistical method that predicts future volatility based on past volatilities and prediction residuals (errors).
Indicator settings
We define several parameters for our indicator:
length = input.int(20, title="Length")
p = input.int(1, title="Lag order (p)")
q = input.int(1, title="Degree of moving average (q)")
cluster_value = input(0.2,title="cluster value")
length: The period used for the calculations, default 20.
p: The order of the delay for the GARCH model.
q: The degree of the moving average for the GARCH model.
cluster_value: A threshold value used to color the graph.
Calculation of logarithmic returns
We calculate logarithmic returns to capture price changes:
logReturns = math.log(close) - math.log(close )
Initializing arrays
We initialize arrays to store residuals and volatilities:
var float residuals = array.new_float(length, 0)
var float volatilities = array.new_float(length, 0)
We add the new logarithmic returns to the tables and keep their size constant:
array.unshift(residuals, logReturns)
if (array.size(residuals) > length)
array.pop(residuals)
We then calculate the mean and variance of the residuals:
meanResidual = array.avg(residuals)
varianceResidual = array.stdev(residuals, meanResidual)
volatility = math.sqrt(varianceResidual)
We update the volatility table with the new value:
array.unshift(volatilities, volatility)
if (array.size(volatilities) > length)
array.pop(volatilities)
GARCH volatility is calculated from accumulated data:
var float garchVolatility = na
if (array.size(volatilities) >= length and array.size(residuals) >= length)
alpha = 0.1 // Alpha coefficient
beta = 0.85 // Beta coefficient
omega = 0.01 // Omega constant
sumVolatility = 0.0
for i = 0 to p-1
sumVolatility := sumVolatility + beta * math.pow(array.get(volatilities, i), 2)
sumResiduals = 0.0
for j = 0 to q-1
sumResiduals := sumResiduals + alpha * math.pow(array.get(residuals, j), 2)
garchVolatility := math.sqrt(omega + sumVolatility + sumResiduals)
Plot GARCH volatility
We finally plot the GARCH volatility on the chart and add horizontal lines for easier visual analysis:
plt = plot(garchVolatility, title="GARCH Volatility", color=color.rgb(33, 149, 243, 100))
h1 = hline(0.1)
h2 = plot(cluster_value)
h3 = hline(0.3)
colorGarch = garchVolatility > cluster_value ? color.red: color.green
fill(plt, h2, color = colorGarch)
colorGarch: Determines the fill color based on the comparison between garchVolatility and cluster_value.
Using the script in your trading
Incorporating this Pine Script™ into your trading strategy can provide you with a better understanding of market volatility and help you make more informed decisions. Here are some ways to use this script:
Identification of periods of high volatility:
When the GARCH volatility is greater than the cluster value (cluster_value), it indicates a period of high volatility. Traders can use this information to avoid taking large positions or to adjust their risk management strategies.
Anticipation of price movements:
An increase in volatility can often precede significant price movements. By monitoring GARCH volatility spikes, traders can prepare for potential market reversals or accelerations.
Optimization of entry and exit points:
By using GARCH volatility, traders can better identify favorable times to enter or exit a position. For example, entering a position when volatility begins to decrease after a peak can be an effective strategy.
Adjustment of stops and objectives:
Since volatility is an indicator of the magnitude of price fluctuations, traders can adjust their stop-loss and take-profit orders accordingly. Periods of high volatility may require wider stops to avoid being exited from a position prematurely.
That's it for the detailed explanation of this Pine Script™ script. Don’t hesitate to use it, adapt it to your needs and share your feedback! Happy analysis and trading everyone!

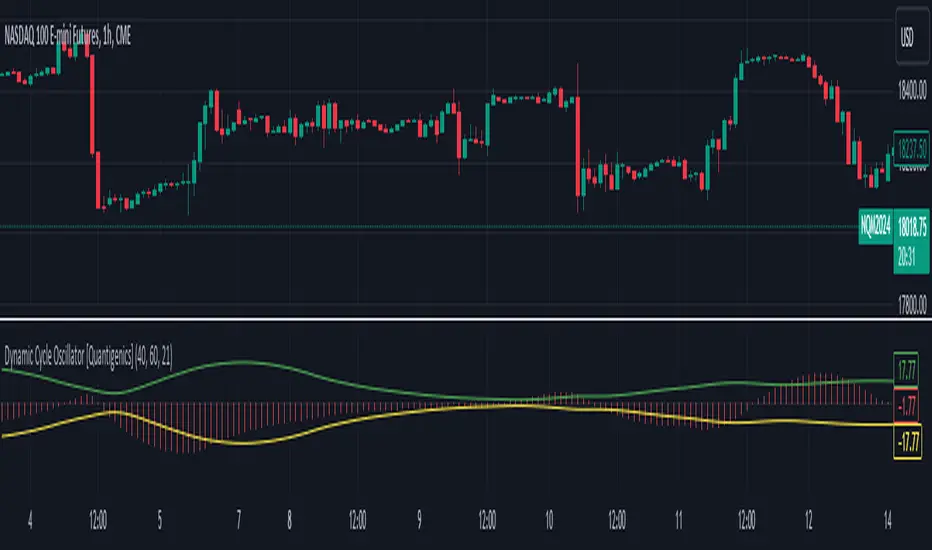
Dynamic Cycle Oscillator [Quantigenics]This script is designed to navigate through the ebbs and flows of financial markets. At its core, this script is a sophisticated yet user-friendly tool that helps you identify potential market turning points and trend continuations.
How It Works:
The script operates by plotting two distinct lines and a central histogram that collectively form a band structure: a center line and two outer boundaries, indicating overbought and oversold conditions. The lines are calculated based on a blend of exponential moving averages, which are then refined by a root mean square (RMS) over a specified number of bars to establish the cyclic envelope.
The input parameters:
Fast and Slow Periods:
These determine the sensitivity of the script. Shorter periods react quicker to price changes, while longer periods offer a smoother view.
RMS Length:
This parameter controls the range of the cyclic envelope, influencing the trigger levels for trading signals.
Using the Script:
On your chart, you’ll notice how the Dynamic Cycle Oscillator’s lines and histogram weave through the price action. Here’s how to interpret the movements.
Breakouts and Continuations:
Buy Signal: Consider a long position when the histogram crosses above the upper boundary. This suggests a possible strong bullish run.
Sell Signal: Consider a short position when the histogram crosses below the lower boundary. This suggests a possible strong bearish run.
Reversals:
Buy Signal: Consider a long position when the histogram crosses above the lower boundary. This suggests an oversold market turning bullish.
Sell Signal: Consider a short position when the histogram crosses below the upper boundary. This implies an overbought market turning bearish.
The script’s real-time analysis can serve as a robust addition to your trading strategy, offering clarity in choppy markets and an edge in trend-following systems.
Thanks! Hope you enjoy!
Triple MA HTF Indicator - Dynamic SmoothingThe indicator version of the "Triple MA HTF Strategy - Dynamic Smoothing" strategy script. In summary the indicator consist of 3 higher time frame moving averages. In which the highest timeframe is used for confirmation on the trend (filter). Moving average 1 and 2 are used to enter and exit the trade (crossover / crossunder). The main principle is to detect momentum when the faster MA 1 crosses the slower MA 2 and only trade with the trend (MA3). The dynamic smoothing in the code makes the indicator suitable to trade on lower tramecharts. The indicator script comes with the following features:
options for different types of MA.
options to choose from different timeframes & select # bars of that timeframe to calculate the MA value.
visualizations of the MA using Dynamic Smoothing calculations on lower timecharts. Note that the chart opened should be lower than the selected timeframes in the configurations.
Alerts for entry long, shorts and exits.
For more details on the script and possibility for backtesting the Triple MA HTF indicator I refer to my earlier published strategy script:

Buy Sell Volume SeparateDescription:
The script is designed to provide traders with a unique and comprehensive analysis of trading volume dynamics. Unlike existing scripts, the script offers a distinct advantage by presenting both buy and sell volumes on separate scales, simplifying trading decisions.
Key Features:
1. Dual Volume Scales: The script provides two separate volume scales, one for buy volumes and another for sell volumes. This separation allows to easily distinguish between buying and selling pressure, aiding in more precise trade entries and exits.
2. Clear and Intuitive Chart: The script ensures that the chart it generates is clean and easy to understand. The buy and sell volumes are color-coded for clarity, and you can quickly identify significant volume spikes and trends.
How to Use:
1. Adding the Script: To use the script, simply add it to your TradingView chart.
2. Interpreting Buy and Sell Volumes: On the chart, you will see two separate volume scales—one for buy volumes and one for sell volumes. Green bars represent buying pressure, while red bars indicate selling pressure. Pay attention to the relative strengths and patterns of these bars to gauge market sentiment.
3. Informed Trading Decisions: Armed with insights into both buy and sell volumes, you can make more informed trading decisions. Look for divergences, patterns, or significant volume spikes to identify potential entry and exit points.

Сoncentrated Market Maker Strategy by oxowlConcentrated Market Maker Strategy by oxowl. This script plots an upper and lower bound for liquidity provision, and checks for rebalancing conditions. It also includes alert conditions for when the price crosses the upper or lower bounds.
Here's an overview of the script:
It defines the input parameters: liquidity range percentage, rebalance frequency in minutes, and minimum trade size in assets.
It calculates the upper and lower bounds for liquidity provision based on the liquidity range percentage.
It initializes variables for the last rebalance time and price.
It defines a rebalance condition based on the frequency and current price within the specified range.
If the rebalance condition is met, it updates the last rebalance time and price.
It plots the upper and lower bounds on the chart as lines and adds price labels for both bounds.
It defines alert conditions for when the price crosses the upper or lower bounds.
Finally, it creates alert conditions with appropriate messages for when the price crosses the upper or lower bounds.
Concentrated liquidity is a concept often used in decentralized finance (DeFi) market-making strategies. It allows liquidity providers (LPs) to focus their liquidity within a specific price range, rather than across the entire price curve. Using an indicator with concentrated liquidity can offer several advantages:
Increased capital efficiency: Concentrated liquidity allows LPs to allocate their capital within a narrower price range. This means that the same amount of capital can generate more significant price impact and potentially higher returns compared to providing liquidity across a broader range.
Customized risk exposure: LPs can choose the price range they feel most comfortable with, allowing them to better manage their risk exposure. By selecting a range based on their market outlook, they can optimize their positions to maximize potential returns.
Adaptive strategies: Indicators that support concentrated liquidity can help traders adapt their strategies based on market conditions. For example, they can choose to provide liquidity around a stable price range during low-volatility periods or adjust their range when market conditions change.
To continue integrating this script into your trading strategy, follow these steps:
Import the script into your TradingView account. Navigate to the Pine editor, paste the code, and save it as a new script.
Apply the indicator to a trading pair chart. You can customize the input parameters (liquidity range percentage, rebalance frequency, and minimum trade size) based on your preferences and risk tolerance.
Set alerts for when the price crosses the upper or lower bounds. This will notify you when it's time to take action, such as adding or removing liquidity, or rebalancing your position.
Monitor the performance of your strategy over time. Adjust the input parameters as needed to optimize your returns and manage risk effectively.
(Optional) Integrate the script with a trading bot or automation platform. If you're using an API-based trading solution, you can incorporate the logic and conditions from the script into your bot's algorithm to automate the process of providing concentrated liquidity and rebalancing your positions.
Remember that no strategy is foolproof, and past performance is not indicative of future results. Always exercise caution when trading and carefully consider your risk tolerance.

Hikkake Hunter 2.0This script serves as a successor to a previous script I wrote for identifying Hikkakes nearly two years ago.
The old version has been preserved here:
█ OVERVIEW
This script is a rework of an old script that identified the Hikkake candlestick pattern. While this pattern is not usually considered a part of the standard candlestick patterns set, I found a lot of value when finding a solution to identifying it. A Hikkake pattern is a 3-candle pattern where a middle candle is nested in between the range of the prior candle, and a candle that follows has a higher high and a higher low (bearish setup) or a lower high and a lower low (bullish setup). What makes this pattern unique is the "confirmation" status of the pattern; within 3 candles of this pattern's appearance, there must be a candle that closes above the high (bullish setup) or below the low (bearish setup) of the second candle. Additional flexibility has been added which allows the user to specify the number of candles (up to 5) that the pattern may have to confirm after its appearance.
█ CONCEPTS
This script will cover concepts mainly focusing on candlestick analysis, price analysis (with higher timeframes), and statistical analysis. I believe there is also educational value presented with the use of user-defined-types (UDTs) in accomplishing these concepts that I hope others will find useful.
Candlestick Analysis - Identification and confirmation of the patterns in the deprecated script were clunky and inefficient. While the previous script required the use of 6 candles to perform the confirmations of patterns (restricted solely to identifying patterns that confirmed in 3 candles or less), this script only requires 3 candles to identify and process patterns by utilizing a UDT representing a 'pattern object'. An object representing a pattern will be created when it has been identified, and fields within that object will be set for processing by the functions it is passed to. Pattern objects are held by a var array (values within the array persist between bars) and will be removed from this array once they have been confirmed or non-confirmed.
This is a significant deviation from the previous script's methods, as it prevents unnecessary re-evaluations of the confirmation status of patterns (i.e. Hikkakes confirmed on the first candle will no longer need to be checked for confirmations on the second or third; a pitfall of the deprecated version which required multiple booleans tracking prior confirmation statuses). This deviation is also what provides the flexibility in changing the number of candles that can pass before a pattern is deemed non-confirmed.
As multiple patterns can be confirmed simultaneously, this script uses another UDT representing a linked-list reduction of the pattern object used to process it. This liked-list object will then be used for Price Analysis.
Price Analysis - This script employs the use of a UDT which contains all the returns of confirmed patterns. The user specifies how many candles ahead of the confirmed pattern to calculate its return, as well as where this calculation begins. There are two settings: FROM APPEARANCE and FROM CONFIRMATION (default). Price differences are calculated from the open of the candle immediately following the candle which had confirmed the pattern to the close of the candle X candles ahead (default 10). ( SEE FEATURES )
Because of how Pine functions, this calculation necessitates a lookback on prior candles to identify when a pattern had been confirmed. This is accomplished with the following pseudo-code:
if not na(confirmed linked-list )
for all confirmed in list
GET MATRIX PLACEMENT
offset = FROM CONFIRMATION ? 0 : # of candles to confirm
openAtFind = open
percent return = ((close - openAtFind) / openAtFind) * 100
ADD percent return TO UDT IN MATRIX
All return UDTs are held in a matrix which breaks up these patterns into specific groups covered in the next section.
Higher Timeframes - This script makes a request.security call to a higher timeframe in order to identify a price range which breaks up these patterns into groups based on the 'partition' they had appeared in. The default values for this partitioning will break up the chart into three sections: upper, middle, and lower. The upper section represents the highest 20% of the yearly trading range that an asset has experienced. The lower section represents the trading range within a third (33%) of the yearly low. And the middle section represents the yearly high-low range between these two partitions.
The matrix containing all return UDTs will have these returns split up based on the number of candles required to confirm the pattern as well as the partition the pattern had appeared in. The underlying rationale is that patterns may perform better or worse at different parts of an asset's trading range.
Statistical Analysis - Once a pattern has been confirmed, the matrix containing all return UDTs will be queried to check if a 'returnArray' object has been created for that specific pattern. If not, one will be initialized and a confirmed linked-list object will be created that contains information pertinent to the matrix position of this object.
This matrix contains the returns of both the Bullish and Bearish Hikkake patterns, separated by the number of candles needed to confirm them, and by the partitions they had appeared in. For the standard 3 candles to confirm, this means the matrix will contain 18 elements (dependent on the number of candles allowed for confirmations; its size will range from 12 to 30).
When the required number of candles for Price Analysis passes, a percent return is calculated and added to the returnArray contained in the matrix at the location derived from the confirmed linked-list object's values. The return is added, and all values in the returnArray are updated using Pine's built in array.___ functions. This returnArray object contains the array of all returns, its size, its average, the median, the standard deviation of returns, and a separate 3-integer array which holds values that correspond to the types of returns experienced by this pattern (negative, neutral, and positive)*.
After a pattern has been confirmed, this script will place the partition and all of the aforementioned stats values (plus a 95% confidence interval of expected returns) related to that pattern onto the tooltip of the label that identifies it. This allows users to scroll over the label of a confirmed pattern to gauge its prior performance under specific conditions. The percent return of the specific pattern identified will later be placed onto the label tooltip as well. ( SEE LIMITATIONS )
The stats portion of this script also plays a significant role in how patterns are presented when using the Adaptive Coloring mode described in FEATURES .
*These values are incremented based on user-input related to what constitutes a 'negative' or 'positive' return. Default values would place any return by a pattern between -3% and 3% in the 'neutral' category, and values exceeding either end will be placed in the 'negative' or 'positive' categories.
█ FEATURES
This script contains numerous inputs for modifying its behavior and how patterns are presented/processed, separated into 5 groups.
Confirmation Setting - The most important input for this script's functioning. This input is a 'confirm=true' input and must be set by the user before the script is applied to the chart. It sets the number of candles that a pattern has to confirm once it has been identified.
Alert Settings - This group of booleans sets which types of alerts will fire during the scripts execution on the chart. If enabled, the four alerts will trigger when: a pattern has been identified, a pattern has been confirmed, a pattern has been non-confirmed, and show the return for that confirmed pattern in an alert. Because this script uses the 'alert' function and not 'alertcondition', these must be enabled before 'any alert() function call' is set in TradingView's 'alerts' settings.
Partition Settings - This group of inputs are responsible for creating (and viewing) the partitions that breaks the returns of the patterns identified up into their respective groups. The user may set the resolution to grab the range from, the length back of this resolution the partitions get their values from, the thresholds which breaks the partitions up into their groups, and modify the visibility (if they're shown, the colors, opacity) of these partitions.
Stats Settings - These inputs will drastically alter how patterns are presented and the resulting information derived from them after their appearance. Because of this section's importance, some of these inputs will be described in more detail.
P/L Sample Length - Defines the number of candles after the starting point to grab values from in the % return calculation for that pattern.
P/L Starting Point - Defines the starting point where the P/L calculation will take place. 'FROM APPEARANCE' will set the starting point at the candle immediately following the pattern's appearance. 'FROM CONFIRMATION' will place the starting point immediately following the candle which had confirmed the pattern. ( SEE LIMITATIONS )
Min Returns Needed - Sets how many times a specific pattern must appear (both by number of candles needed to confirm and by partition) before the statistics for that pattern are displayed onto the tooltip (and for gradient coloration in Adaptive Coloring mode).
Enable Adaptive Coloring - Changes the coloration of the patterns based on the bullish/bearishness of the specified Gradient Reference value of that pattern compared to the Return Tolerance values OR the minimum and maximum values of that specified Gradient Reference value contained in the matrix of all returns. This creates a color from a gradient using the user-specified colors and alters how many of the patterns may appear if prior performance is taken into account.
Gradient Reference - Defines which stats measure of returns will be used in the gradient color generation. The two settings are 'AVG' and 'MEDIAN'.
Hard Limit - This boolean sets whether the Return Tolerance values will not be replaced by values that exceed them from the matrix of returns in color gradient generation. This changes the scale of the gradient where any Gradient Reference values of patterns that exceed these tolerances will be colored the full bullish or bearish gradient colors, and anything in between them will be given a color from the gradient.
Visibility Settings - This last section includes all settings associated with the overall visibility of patterns found with this script. This includes the position of the labels and their colors (+ pattern colors without Adaptive Coloring being enabled), and showing patterns that were non-confirmed.
Most of these inputs in the script have these kinds of descriptions to what they do provided by their tooltips.
█ HOW TO USE
I attempted to make this script much easier to use in terms of analyzing the patterns and displaying the information to the user. The previous script would have the user go to the 'data window' side bar on TradingView to view the returns of a pattern after they had specified which pattern to analyze through the settings, needlessly convoluted. This aim at simplicity was achieved through the use of UDTs and specific code-design.
To use, simply apply the indicator to a chart, set the number of candles (between 2 and 5) for confirming this specific pattern and adjust the many settings described above at your leisure.
█ LIMITATIONS
Disclaimer - This is a tool created with the hopes of helping identify a specific pattern and provide an informative view about the performance of that pattern. Previous performance is not indicative of future results. None of this constitutes any form of financial advice, *use at your own risk*.
Statistical Analysis - This script assumes that all patterns will yield a NORMAL DISTRIBUTION regarding their returns which may not be reflective of reality. I personally have limited experience within the field of statistics apart from a few high school/college courses and make no guarantees that the calculation of the 95% confidence interval is correct. Please review the source code to verify for yourself that this interval calculation is correct (Function Name: f_DisplayStatsOnLabel).
P/L Starting Point - Because of when the object related to the confirmation status of a pattern is created (specifically the linked-list object) setting the 'P/L Starting Point' to 'FROM APPEARANCE' will yield the results of that P/L calculation at the same time as 'FROM CONFIRMATION'.
█ EXAMPLES
Default Settings:
Partition Background (default):
Partition Background (Resolution D : Length 30):
Adaptive Coloration:
Show Non-Confirmed:

[@btc_charlie] Trader XO Macro Trend ScannerWhat is this script?
This script has two main functions focusing on EMAs (Exponential Moving Average) and Stochastic RSI.
EMAs
EMAs are typically used to give a view of bullish / bearish momentum. When the shorter EMA (calculated off more recent price action) crosses, or is above, the slower moving EMA (calculated off a longer period of price action), it suggests that the market is in an uptrend. This can be an indication to either go long on said asset, or that it is more preferable to take long setups over short setups. Invalidation on long setups is usually found via price action (e.g. previous lows) or simply waiting for an EMA cross in the opposite direction (i.e. shorter EMA crosses under longer term EMA).
This is not a perfect system for trade entry or exit, but it does give a good indication of market trends. The settings for the EMAs can be changed based on user inputs, and by default the candles are coloured based on the crosses to make it more visual. The default settings are based on “Trader XO’s” settings who is an exceptional swing trader.
RSI
Stochastic RSI is a separate indicator that has been added to this script. RSI measures Relative Strength (RSI = Relative Strength Index). When RSI is <20 it is considered oversold, and when >80 it is overbought. These conditions suggests that momentum is very strong in the direction of the trend.
If there is a divergence between the price (e.g. price is creating higher highs, and stoch RSI is creating lower highs) it suggests the strength of the trend is weakening. Whilst this script does not highlight divergences, what it does highlight is when the shorter term RSI (K) crosses over D (the average of last 3 periods). This can give an indication that the trend is losing strength.
Combination
The EMAs indicate when trend shifts (bullish or bearish).
The RSI indicates when the trend is losing momentum.
The combination of the two can be used to suggest when to prefer a directional bias, and subsequently shift in anticipation of a trend reversal.
Note that no signal is 100% accurate and an interpretation of market conditions and price action will need to be overlayed to
Why is it different to others?
I have not found other scripts that are available in this way visually including alerts when Stoch RSI crosses over/under the extremes; or the mid points.
Whilst these indicators are default, the combination of them and how they are presented is not and makes use of the TradingView colouring functionalities.
What are the features?
Customise the variables (averages) used in the script.
Display as one EMA or two EMAs (the crossing ones).
Alerts on EMA crosses.
Alerts on Stoch RSI crosses - slow/fast, upper, lower areas.
- Currently set on the chart to show alerts when Stoch RSI is above 80, then falls below 80 (and colours it red).
Customisable colours.
What are the best conditions for this?
It is designed for high timeframe charts and analysis in crypto, since crypto tends to trend.
It can however be used for lower timeframes.
Disclaimer/Notes:
I have noticed several videos appearing suggesting that this is a "100% win rate indicator" .
NO indicator has 100% win rate.
An indicator is an *indicator* that is all.
Please use responsibly and let me know if there are any mods or updates you would like to see.

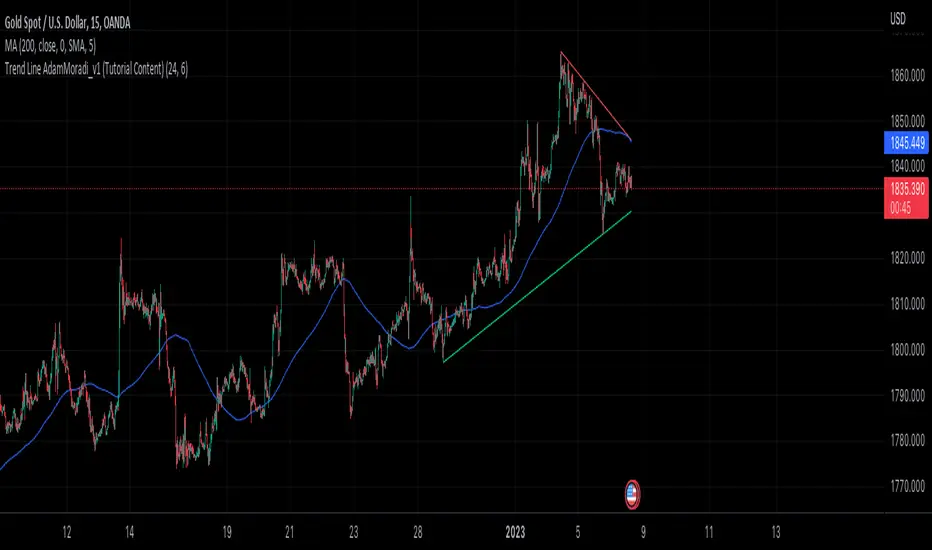
Trend Line Adam Moradi v1 (Tutorial Content)
The Pine Script strategy that plots pivot points and trend lines on a chart. The strategy allows the user to specify the period for calculating pivot points and the number of pivot points to be used for generating trend lines. The user can also specify different colors for the up and down trend lines.
The script starts by defining the input parameters for the strategy and then calculates the pivot high and pivot low values using the pivothigh() and pivotlow() functions. It then stores the pivot points in two arrays called trend_top_values and trend_bottom_values. The script also has two arrays called trend_top_position and trend_bottom_position which store the positions of the pivot points.
The script then defines a function called add_to_array() which takes in three arguments: apointer1, apointer2, and val. This function adds val to the beginning of the array pointed to by apointer1, and adds bar_index to the beginning of the array pointed to by apointer2. It then removes the last element from both arrays.
The script then checks if a pivot high or pivot low value has been calculated, and if so, it adds the value and its position to the appropriate arrays using the add_to_array() function.
Next, the script defines two arrays called bottom_lines and top_lines which will be used to store trend lines. It also defines a variable called starttime which is set to the current time.
The script then enters a loop to calculate and plot the trend lines. It first deletes any existing trend lines from the chart. It then enters two nested loops which iterate over the pivot points stored in the trend_bottom_values and trend_top_values arrays. For each pair of pivot points, the script calculates the slope of the line connecting them and checks if the line is a valid trend line by iterating over the price bars between the two pivot points and checking if the line is above or below the close price of each bar. If the line is found to be a valid trend line, it is plotted on the chart using the line.new() function.
Finally, the script colors the trend lines using the colors specified by the user.
Tutorial Content
'PivotPointNumber' is an input parameter for the script that specifies the number of pivot points to consider when calculating the trend lines. The value of 'PivotPointNumber' is set by the user when they configure the script. It is used to determine the size of the arrays that store the values and positions of the pivot points, as well as the number of pivot points to loop through when calculating the trend lines.
'up_trend_color' is an input parameter for the script that specifies the color to use for drawing the trend lines that are determined to be upward trends. The value of 'up_trend_color' is set by the user when they configure the script and is passed to the color parameter of the line.new() function when drawing the upward trend lines. It determines the visual appearance of the upward trend lines on the chart.
'down_trend_color' is an input parameter for the script that specifies the color to use for drawing the trend lines that are determined to be downward trends. The value of 'down_trend_color' is set by the user when they configure the script and is passed to the color parameter of the line.new() function when drawing the downward trend lines. It determines the visual appearance of the downward trend lines on the chart.
'pivothigh' is a variable in the script that stores the value of the pivot high point. It is calculated using the pivothigh() function, which returns the highest high over a specified number of bars. The value of 'pivothigh' is used in the calculation of the trend lines.
'pivotlow' is a variable in the script that stores the value of the pivot low point. It is calculated using the pivotlow() function, which returns the lowest low over a specified number of bars. The value of 'pivotlow' is used in the calculation of the trend lines.
'trend_top_values' is an array in the script that stores the values of the pivot points that are determined to be at the top of the trend. These are the pivot points that are used to calculate the upward trend lines.
'trend_top_position' is an array in the script that stores the positions (i.e., bar indices) of the pivot points that are stored in the 'trend_top_values' array. These positions correspond to the locations of the pivot points on the chart.
'trend_bottom_values' is an array in the script that stores the values of the pivot points that are determined to be at the bottom of the trend. These are the pivot points that are used to calculate the downward trend lines.
'trend_bottom_position' is an array in the script that stores the positions (i.e., bar indices) of the pivot points that are stored in the 'trend_bottom_values' array. These positions correspond to the locations of the pivot points on the chart.
apointer1 and apointer2 are variables used in the add_to_array() function, which is defined in the script. They are both pointers to arrays, meaning that they hold the memory addresses of the arrays rather than the arrays themselves. They are used to manipulate the arrays by adding new elements to the beginning of the arrays and removing elements from the end of the arrays.
apointer1 is a pointer to an array of floating-point values, while apointer2 is a pointer to an array of integers. The specific arrays that they point to depend on the arguments passed to the add_to_array() function when it is called. For example, if add_to_array(trend_top_values, trend_top_posisiton, pivothigh) is called, then apointer1 would point to the tval array and apointer2 would point to the tpos array.
'bottom_lines' (short for "Bottom Lines") is an array in the script that stores the line objects for the downward trend lines that are drawn on the chart. Each element of the array corresponds to a different trend line.
'top_lines' (short for "Top Lines") is an array in the script that stores the line objects for the upward trend lines that are drawn on the chart. Each element of the array corresponds to a different trend line.
Both 'bottom_lines' and 'top_lines' are arrays of type "line", which is a data type in PineScript that represents a line drawn on a chart. The line objects are created using the line.new() function and are used to draw the trend lines on the chart. The variables are used to store the line objects so that they can be manipulated and deleted later in the script.
Loops
maxline is a variable in the script that specifies the maximum number of trend lines that can be drawn on the chart. It is used to determine the size of the bottom_lines and top_lines arrays, which store the line objects for the trend lines.
The value of maxline is set to 3 at the beginning of the script, meaning that at most 3 trend lines can be drawn on the chart at a time. This value can be changed by the user if desired by modifying the assignment statement "maxline = 3".
'count_line_low' (short for "Count Line Low") is a variable in the script that keeps track of the number of downward trend lines that have been drawn on the chart. It is used to ensure that the maximum number of trend lines (as specified by the maxline variable) is not exceeded.
'count_line_high' (short for "Count Line High") is a variable in the script that keeps track of the number of upward trend lines that have been drawn on the chart. It is used to ensure that the maximum number of trend lines (as specified by the maxline variable) is not exceeded.
Both 'count_line_low' and 'count_line_high' are initialized to 0 at the beginning of the script and are incremented each time a new trend line is drawn. If either variable exceeds the value of maxline, then no more trend lines are drawn.
'pivot1', 'up_val1', 'up_val2', up1, and up2 are variables used in the loop that calculates the downward trend lines in the script. They are used to store intermediate values during the calculation process.
'pivot1' is a loop variable that is used to iterate through the pivot points (stored in the trend_bottom_values and trend_bottom_position arrays) that are being considered for use in the trend line calculation.
'up_val1' and 'up_val2' are variables that store the values of the pivot points that are used to calculate the downward trend line.
up1 and up2 are variables that store the positions (i.e., bar indices) of the pivot points that are stored in 'up_val1' and 'up_val2', respectively. These positions correspond to the locations of the pivot points on the chart.
'value1' and 'value2' are variables that are used to store the values of the pivot points that are being compared in the loop that calculates the trend lines in the script. They are used to determine whether a trend line can be drawn between the two pivot points.
For example, if 'value1' is the value of a pivot point at the top of the trend and 'value2' is the value of a pivot point at the bottom of the trend, then a trend line can be drawn between the two points if 'value1' is greater than 'value2'. The values of 'value1' and 'value2' are used in the calculation of the slope and intercept of the trend line.
'position1' and 'position2' are variables that are used to store the positions (i.e., bar indices) of the pivot points that are being compared in the loop that calculates the trend lines in the script. They are used to determine the distance between the pivot points, which is necessary for calculating the slope of the trend line.
For example, if 'position1' is the position of a pivot point at the top of the trend and 'position2' is the position of a pivot point at the bottom of the trend, then the distance between the two points is given by 'position1' - 'position2'. This distance is used in the calculation of the slope of the trend line.
'different', 'high_line', 'low_location', 'low_value', and 'valid' are variables that are used in the loop that calculates the downward trend lines in the script. They are used to store intermediate values during the calculation process.
'different' is a variable that stores the slope of the downward trend line being calculated. It is calculated as the difference in value between the two pivot points (stored in up_val1 and up_val2) divided by the distance between the pivot points (calculated using their positions, stored in up1 and up2).
'high_line' is a variable that stores the current value of the trend line being calculated at a given point in the loop. It is initialized to the value of the second pivot point (stored in up_val2) and is updated on each iteration of the loop using the value of different.
'low_location' is a variable that stores the position (i.e., bar_index) on the chart of the point where the trend line being calculated first touches the low price. It is initialized to the position of the second pivot point (stored in up2) and is updated on each iteration of the loop if the trend line touches a lower low.
'low_value' is a variable that stores the value of the trend line at the point where it first touches the low price. It is initialized to the value of the second pivot point (stored in up_val2) and is updated on each iteration of the loop if the trend line touches a lower low.
'valid' is a Boolean variable that is used to indicate whether the trend line being calculated is valid. It is initialized to true and is set to false if the trend line does not pass through all the lows between the pivot points. If valid is still true after the loop has completed, then the trend line is considered valid and is drawn on the chart.
d_value1, d_value2, d_position1, and d_position2 are variables that are used in the loop that calculates the upward trend lines in the script. They are used to store intermediate values during the calculation process.
d_value1 and d_value2 are variables that store the values of the pivot points that are used to calculate the upward trend line.
d_position1 and d_position2 are variables that store the positions (i.e., bar indices) of the pivot points that are stored in d_value1 and d_value2, respectively. These positions correspond to the locations of the pivot points on the chart.
The variables d_value1, d_value2, d_position1, and d_position2 have the same function as the variables uv1, uv2, up1, and up2, respectively, but for the calculation of the upward trend lines rather than the downward trend lines. They are used in a similar way to store intermediate values during the calculation process.
thank you.
Stoch/RSI with EMA50 Cross & HHLLA hybrid but simple indicator that plots 4 strategies in one pane .
1) RSI Indicator
2) Stoch RSI
3) EMA50 Cross (To determine direction in current timeframe)
4) Higher Highs & Lower Lows to analyze the trend and break of trend
The relative strength index (RSI) is a momentum indicator used in technical analysis. It is displayed as an oscillator (a line graph) on a scale of zero to 100. When the RSI indicator crosses 30 on the RSI chart, it is a bullish sign and when it crosses 70, it is a bearish sign.
The Stochastic RSI (StochRSI) is also a momentum indicator used in technical analysis. It is displayed as an oscillator (a line graph) on a scale of zero to 100. When the StochRSI indicator crosses 20 on the RSI chart, it is a bullish sign and when it crosses 80, it is a bearish sign.
The EMA50Cross denotes two cases in the script:
a) A crossover of CMP on the EMA50 is highlighted by a green bar signals a possible bullish trend
b) A crossunder of CMP on the EMA50 is highlighted by a red bar signals a possible bearish trend
The HHLL is denoted by mneumonics HH, HL,LH, LL. A combination of HHs and HLs denotes a uptrend while the combination of LLs and LHs denoted a downtrend
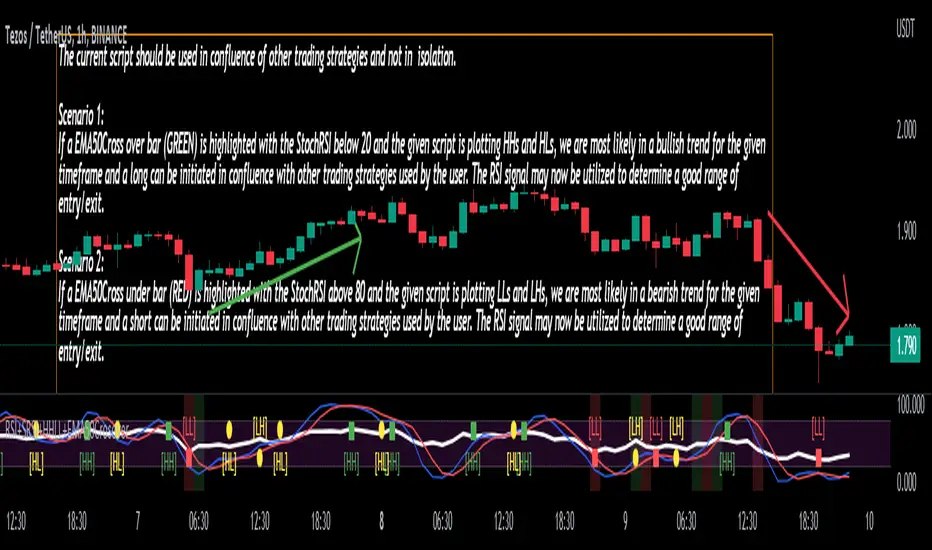
The current script should be used in confluence of other trading strategies and not in isolation.
Scenario 1:
If a EMA50Cross over bar (GREEN) is highlighted with the StochRSI below 20 and the given script is plotting HHs and HLs, we are most likely in a bullish trend for the given timeframe and a long can be initiated in confluence with other trading strategies used by the user. The RSI signal may now be utilized to determine a good range of entry/exit.
Scenario 2:
If a EMA50Cross under bar (RED) is highlighted with the StochRSI above 80 and the given script is plotting LLs and LHs, we are most likely in a bearish trend for the given timeframe and a short can be initiated in confluence with other trading strategies used by the user. The RSI signal may now be utilized to determine a good range of entry/exit.
Disclaimer:
The current script should be used in confluence with other trading strategies and not in isolation. The scripts works best on 4H and 1D Timeframes and should be used with caution on lower timeframes.
This indicator is not intended to give exact entry or exit points for a trade but to provide a general idea of the trend & determine a good range for entering or exiting the trade. Please DYOR
Credit & References:
This script uses the default technical analysis reference library provided by PineScript (denoted as ta)
PriceCatch Crypto Screener IOHi,
TradingView community and Crypto traders. Warm Greetings.
PriceCatch Crypto Screener.
I am sharing a script that screens the following Crypto.
ADAUSD, ALGOUSD, AMPUSD, ATOMUSD, AUCTIONUSD, AVAXUSD, BTCUSD, BTRSTUSD, CHZUSD, DAIUSD, DOGEUSD, DOTUSD,
EOSUSD, ETHUSD, FETUSD, FXUSD, JASMYUSD, LINKUSD, LRCUSD, MANAUSD, MATICUSD, NUUSD, OMGUSD, OXTUSD,
SHIBUSD, SKLUSD, SNXUSD, SOLUSD, TRIBEUSD, USTUSD, XLMUSD, XTZUSD, YFIUSD, ZRXUSD
Once this script is added to your chart and the resolution is set, it will automatically keep watching for any breakout on the above Crypto and display the results on chart for your attention. You may use the settings option of the script to screen on different time-frames. For example, you may manually select 30Min, 1H, etc., to scan on the respective time-frames. This way, you can quickly spot any opportunities emerging on different time-frames. The Screener runs independently of any symbol displayed on your chart.
NOTE - PRIOR TO USING THIS SCRIPT:
Please remember that the script is shared with absolutely no assurances about usability and any warranties whatsoever and as a responsible trader, please satisfy yourselves thoroughly and use it only if you are convinced it works for you. Remember, you are 100% responsible for your actions. If you understand and accept that, you may use the script.
QUERIES/FEEDBACK
Please PM me or leave comments.
Regards to all and wish everyone all the best with trading.

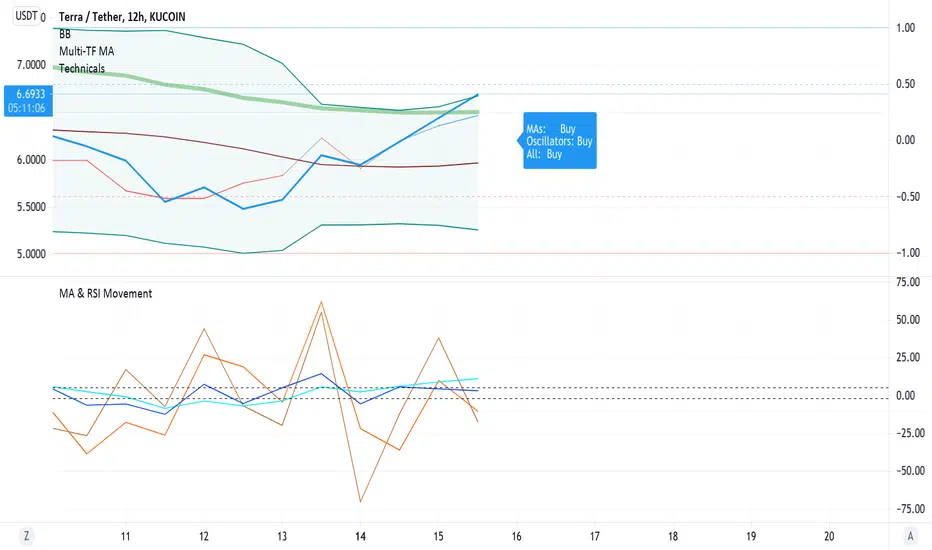
Barholle eMA and RSI Movement TestThis is a test that offers insight into whether and asset is heading into bullish or bearish territory.
This indicator/test offers insight into the Exponential Moving Average's velocity and acceleration as well as the Stochastic RSI's velocity, acceleration and jerk. Included is a 'Stochastic Difference' and 'Stochastic Growth' indicators (commented out) that measure the difference between K and D in the Stoch RSI as well as the rate of it's change. This test is all about crossovers - the best leading indicator is a downward cross of the eMA velocity over the eMA acceleration, indicating a drop in price in the current or next bar.
The lines or importance have been set to -2 and 5, but these should be adjusted to suit your preferences. These numbers were chosen in order to try and create some kind of threshold after which action might be suggested. Backtesting is highly recommended so you can see how the test does and does not work. It is super powerful, but it is not omniscient - its an RSI and eMA derivative, past success does not necessarily dictate future success.
Please look at the code for several more plots you can use of derivatives and other ideas explore but commented out for greater legibility of the graph. Commenting and commenting (or uncommenting all and just disabling some in the settings) and comparing the graphs and crossovers is a useful exercise. To that end, one last concept - the MARSI - a combined moving averages and RSI measurement - was abandoned because it didn't appear to indicate anything of use, however you may find crossovers or patterns with it comparing it to other graphs, so it was left in but commented.
Please take a look at the comments and all the math and indicators 'left on the cutting room floor' in the script. Maybe you'll find a gem in the redux version of this script.
Outreach regarding the script, patterns noticed and full-on stealing of the script are all permitted. Many elements of this script were nabbed from other scripts - thank you to a community of coders who put it all out there.
Tick Data DetailedHello All,
After Tick Chart and Tick Chart RSI scripts, this is Tick Data Detailed script. Like other tick scrips this one only works on real-time bars too. it creates two tables: the table at the right shows the detailed data for Current Bar and the table at the left shows the detailed data for all calculated bars (cumulative). the script checks the volume on each tick and add the tick and volume to the specified level (you can set/change levels)
The volume is multiplied by close price to calculate real volume .There are 7 levels/zones and the default levels are:
0 - 10.000
10.000 - 20.000
20.000 - 50.000
50.000 - 100.000
100.000 - 200.000
200.000 - 400.000
> 400.000
With this info, you will get number of ticks and total volumes on each levels. The idea to separate this levels is in order to know which type of traders trade at that moment. for example volume of whale moves are probably greater than 400.000 or at least 100.000. Or volume of small traders is less than 10.000 or between 20.000-50.000.
You will get info if there is anomaly on each candle as well. what is anomaly definition? Current candle is green but Sell volume is greater than Buy volume or current candle is red but Buy volume is greater than Sell volume . it is shown as (!). you should think/search why/how this anomaly occurs. You can see screenshot about it below.
also "TOTAL" text color changes automatically. if Buy volume is greater than Sell volume then its color becomes Green, if Sell volume is greater than Buy volume then its color becomes Red (or any color you set)
Optionally you can change background and text colors as shown in the example below.
Explanation:
How anomaly is shown:
You can enable coloring background and set the colors as you wish:
And Thanks to @Duyck for letting me use the special characters from his great script.
Enjoy!

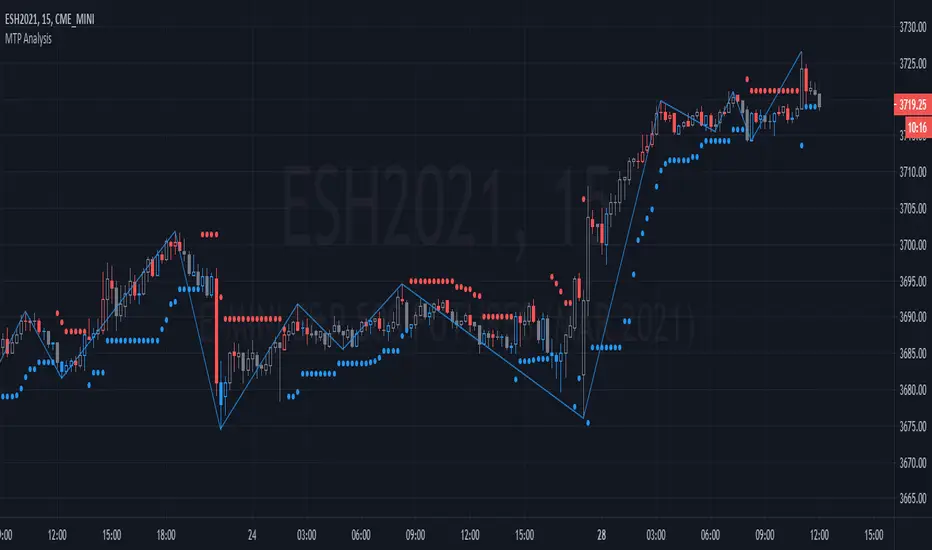
MTP AnalysisThe MTP Reversal Bars, MTP Swing Pivots and MTP ATR Stop are all included in the MTP Analysis Script.
The MTP Reversal Bars give the entry triggers for the MTPredictor Trade Setups. Blue for a potential Buy, Red for a potential Sell, and Grey for neutral. Please note, these are only to be used in conjunction with our MT Trade and MTP Advanced Trade Setup Scripts, and are only relevant at (or up to 5 bars after) a potential trade setup. They are calculated using a unique combination of reversal triggers.
The MTP Swing Pivots connect the swing highs and lows on your chart, giving you the Pivots off which to work for your MTPredictor Analysis, for example when using our MTP Decision Point (DP) Script. The Swing Pivots use the number of Bars either side of the pivots for its construction (not a % retracement), and as such are not a simple Zig-zag indicator.
The MTP ATR Stop is used to trail your protective Stop, once in a position, when the Market is “strong” (MTP Trend indicator is beyond the strength band) when the market reaches its projected Profit target. Please see the MTP Trend indicator Script for more information on this.
There is a risk in Trading and Investing. Losses can and will unfold.
The script is available as an “invite-only” script, as part of the MTPredictor suite of tools on Trading View.
To obtain access, please go to the web page in our signature that appears below.
SR Levels - Major Support and Resistance LevelsHello Traders!
This Indicator helps you to identify Major support and resistance level. Major Vibration numbers are working as support & resistance in the many scripts as I have seen. Since I have my research about the vibration numbers, I strongly believe these numbers are works as good Support & Resistance. This is just try to idendify the those number to enter into the trade. Use Other indicators to Identify Trend and for your support!
When Price move low to high:
1) Green Line works are buy entry point, TP area is Red Line, SL area also Red Just below the Green Line
When Price Move High to Low:
1) Red Lines are works as Sell entry point, TP are Green Line, SL area also Green Lines just above the Red Line.
Notes: This Indicators is mainly focus the script which more than 5 digit scripts. Example above 10000 price scripts only.. for Intraday. below 10000 or 1000 scripts also works but for long term not for intraday...
NSE:BANKNIFTY
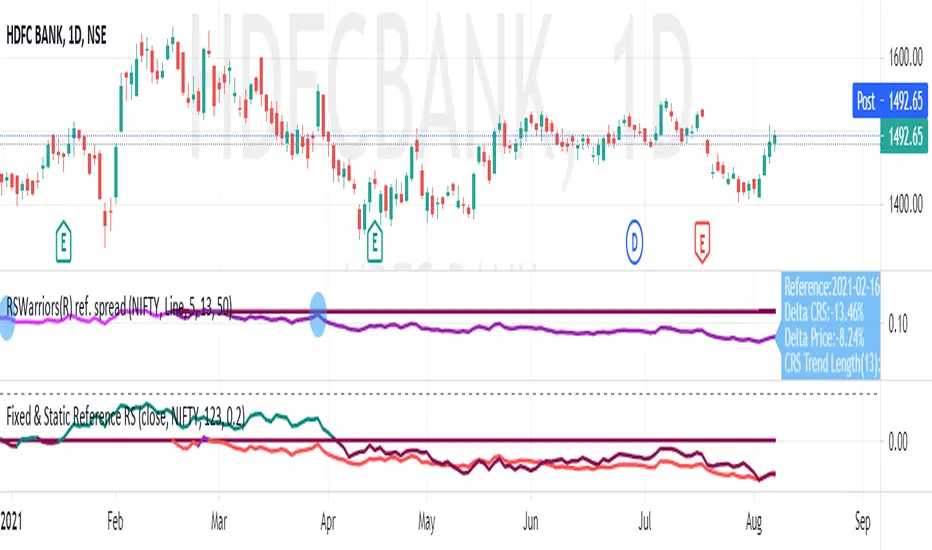
Fixed Reference Relative StrengthRelative Strength based on a fixed reference session date. This study works on day timeframe only.
The idea here is to "fix" a reference trading session day. The relative strength of subsequent candles are measured based on this reference day only. Relative strengths of bars before this bar is irrelevant and not plotted. As the plotting of the bars advances, the length is automatically adjusted so that the base reference is the "fixed" reference only. The RS value is multiplied by 100 to give a percentage value.
The other Relative Strength indicators that I have published (and other Relative Strength scripts generally available on TradingView), generally take a fixed length as input and that has to be advanced each trading session. What this results into is that only the "latest bar" RS is compared to the "reference" session date. All the RS values prior to this latest bar is actually compared to days previous to the reference date.
In the example above, we have input 13-Feb-2020 as the "fixed" reference trading session day. Starting from 14-Feb-2020, each session day, we calculate the RS always with respect to 13-Feb-2020, unlike the other scripts. When the RS value of today, 08-Sep-2020 is being calculated, it is using 13-Feb-2020 (as the other scripts do when the length is advanced one day each trading session day). However, when the RS value of 07-Sep-2020 is being calculated today (08-Sep-2020), it is still using 13-Feb-2020 as the reference. In the other scripts, a calculation of RS for 07-Sep-2020 on 08-Sep-2020 would have taken 12-Feb-2020 as the reference value.
This plot thus gives the exact performance of the script with respect to the benchmark index from the fixed reference each day. A performance trend is therefore possible to do on this plot.
Standard Deviation Measurement ToolIf you like the script please come back and leave me a comment or find me on the interwebs. I get notified you "liked" it... but I have no idea if you actually use it. So, let me know =)
The script uses the open price as the mean and calculates the standard deviation from the open price on a per candle basis
- Goal: -
To establish a mean based on the Open Price and calculate the standard deviation.
The reason for this is if the Open is the mean, then the Standard deviation implies a standardized distance a given candle can be expected to travel
from the open price
- Edge: -
If you know that there is a 68%/95%/99.7% probability that price will NOT move more than
One Standard Deviation/Two Standard Deviations/Three Standard Deviations from the open price respectively
you can set reasonable price targets that relate to those probabilities in a given timeframe.
e.g. if you're on a 1h chart and your target is 3.5% from the open price, but 1 standard deviation of the hourly candle is equal to 0.78%.
You can make assumptions on either:
- The reasonableness of your target
or
- The holding period likely required for the trade.
Also, Standard Deviation is a function of volatility and this tool provides a unique mechanism for measuring volatility as well on a candle by candle basis
- Customization Options-
- Set 3 independent upper and lower standard deviations.
- Each set of standard deviations are on a switch so you can show 1, 2, or 3 sets of standard deviations
- You can set the distribution width
- Though it's not recommended, you can change the mean source.
- There is a switch to show the standard deviation on only the real-time bar or real-time and historical bars.
- How I Think About This Script -
This strategy is predicated the same principle as Bollinger Bands: the reality that 68% of all data points will fall within one standard deviation of the mean, 96% of all data points will fall within two standard deviations, and 98% of al data points will fall within 3 standard deviations. By understanding the standard deviation, you can possibly infer an edge by understanding the probabilistic range price will be bound to the limits of standard deviation rules according to their probabilistic outcomes for the single candle on any given timeframe. Bollinger Bands are designed to provide this information with the mean being a 20-period moving average and this indicator.
This indicator is designed to provide standard deviation information with the mean being based on the distance price travels away from the open of individual candles in the lookback period.
If you use a strategy where you enter on major candle closes, this can be useful to set targets for those entries based on the intended hold period or at least add/remove validity to other target metrics.
Example:
Your target is at the 1.618 Fibonacci level and your confirmation triggers on the 4h candle close (H4 if that's your thing lol). You set up the indicator based on the standard deviation of price movement in 4h candles over the last week.
Let's say the indicator shows that the 1.618 Fibonacci level is 3 standard deviations away.
This being the case this statistically indicates that within the next 4 hours, you have a very low probability of achieving your target (>2%). This doesn't invalidate your target, but it does indicate a low probability of achieving it in the next 4hrs. With this information, you can infer that you are either going to be (a) really lucky (b) in this trade for a lot longer than 4hrs or (c) your target is unrealistic given your intended hold period.
You can develop a more probabilistically favorable hold period calculation by looking at the standard deviation on a higher time frame (e.g. 1d-1w).
Bonus feature: You'll find that the 2 and 3 standard deviations will often "cluster" and these clusters often provide future S/R levels. That's a pretty sweet feature no one things to look for. But, try it. Find a cluster of 2nd and 3rd stdevs that are in somewhat of a horizontal pattern (usually the result of a range) and you'll find that to be a good s/r area. Even better if you use the 3.2 standard deviation, you'll find that is a fantastic breakout signal!
Summary
So, you can use it for target setting, a confluence test, a reasonableness test, or just a measurement tool.
This was the first TV script I ever wrong.. Got taken down. But, I've re-released it because there are other TV scripts that attempt to do this but are completely wrong.
Please be careful about using other people's scripts. Always validate the math of the script before you use it if possible.
Stay safe out there and I hope all your dreams come true.

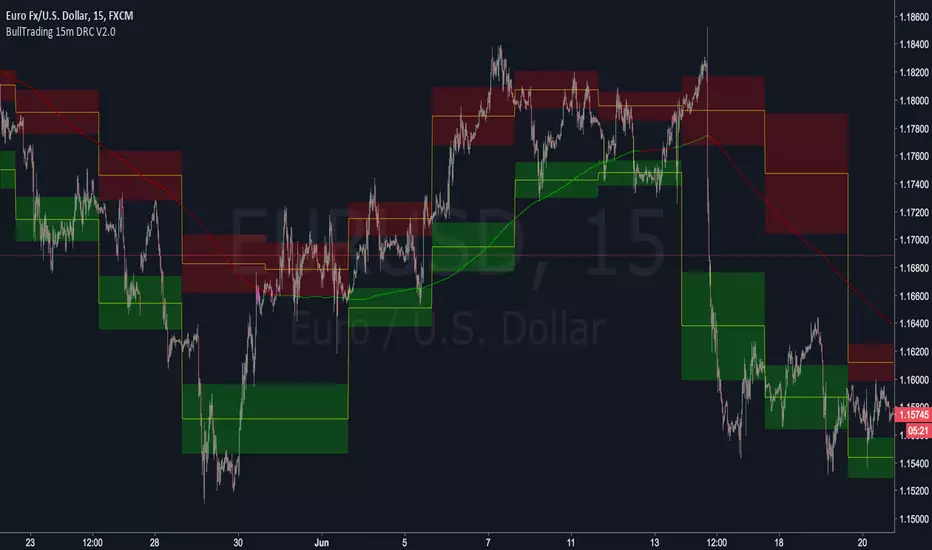
BullTrading 15 Min Daily Retracement Channel V2.0Hi Traders, I have been received tons of private messages asking me access to my previous scripts. Please let me apologize for not being able to answer all messages. Once you publish a script in Tradingview you can manage individual access to the script but there is no option to open the script after being published.
For that reason I decided to open this script for you, this indicator implements many of the best features contained in previous "invite only scripts". It is designed to display alerts for day trading and short term swings using the 15m Timeframe.
How to use "BullTrading 15 Min Daily Retracement Channel V2.0" indicator?
This indicator is experimental but works if the trader applies good judgment and risk management. Neither myself or BullTrading Asset Management is or will be responsible for any live trading loss using this script, so please use it on Demo.
ALWAYS USE PENDING ORDERS!! It is always much better to wait price using your Fibonacci Retracement tool or the indicator reference lines.
Set Buy signals AT THE CLOSE of yellow candlesticks.
Set Sell signals AT THE CLOSE of fuchsia candlesticks.
Most of the time Buy/Sell signals will react with too much anticipation so you can wait for the price to form enough fractals in order to analyze your entry levels, risk management, SL's and TP's.
AVOID AT ALL COSTS to enter the market immediately after a signal. WAIT for fractal formations to confirm reversals. I will say it AGAIN: Use only pending orders and AVOID market execution orders!
If your order is already filled and the moving average changes color or the price consolidates in your entry level it is better to trail tight your SL, exit the trade with small loss or Break Even instead of waiting for a full Stop Loss exit (this conditions usually indicate trend continuations against the indicator signals).
If the market goes against the signal, THINK and use the indicator lines and channels to match a level using your Fib retracement tool. Applying this criteria will lead for better entry levels in the opposite direction.
Feel free to comment suggestions.
Best Regards
GustavoRubi
MTF Bollinger Bands (2SD & 3SD)
개요
1분봉이나 5분봉 등 하위 타임프레임에서 스캘핑을 할 때, 차트를 변경하지 않고 상위 타임프레임(기본 4시간)의 볼린저 밴드 위치를 확인하기 위해 제작했습니다.
주요 기능
MTF (Multi-Timeframe): 현재 보고 있는 차트와 상관없이 설정한 타임프레임의 볼린저 밴드를 표시합니다. (기본값: 4시간)
듀얼 밴드 시각화 (Dual Zone): 표준편차 2(2SD)와 표준편차 3(3SD)을 동시에 계산합니다.
2SD 영역: 2SD와 3SD의 배경색이 겹치도록 설계하여, 중심부(2SD)가 시각적으로 더 진하게 보입니다. 이는 주요 지지/저항 구간을 직관적으로 보여줍니다.
3SD 영역: 외곽은 연하게 표시되어 과매수/과매도 구간을 식별하기 좋습니다.
끊김 없는 라인: gaps_off 처리를 통해 타임프레임 변경 시 선이 끊기지 않고 부드럽게 연결됩니다.
설정 가이드
Timeframe: 기준이 될 상위 시간대를 선택하세요. (기본: 240분/4시간)
Multiplier: 표준편차 배수를 변경할 수 있습니다. (기본: 2.0 / 3.0)
Transparency: 배경 투명도를 조절해 밴드의 진하기를 변경하세요.
==========================================
Overview
Designed for traders who need to monitor Higher Timeframe (HTF) volatility while scalping on Lower Timeframes (LTF). This indicator overlays HTF Bollinger Bands on your current chart without the need to switch tabs.
Key Features
MTF Capability: Displays Bollinger Bands from any user-defined timeframe. (Default: 4 Hours).
Dual Zone Visualization: Plots both 2 Standard Deviations (2SD) and 3 Standard Deviations (3SD).
Visual Depth: The script utilizes an overlapping fill method. The inner 2SD band appears darker as it layers on top of the 3SD background, clearly highlighting the primary support/resistance zone.
Extreme Zones: The outer 3SD band remains lighter, indicating extreme overbought/oversold conditions.
Seamless Plotting: Uses gaps_off to ensure lines remain continuous across different timeframes.
Settings
Timeframe: Select the target HTF. (Default: 240 / 4H)
Multiplier: Adjust the standard deviation multipliers. (Default: 2.0 & 3.0)
Style: Customize colors and transparency to fit your chart theme.

AG Pro Dynamic Channels PremiumAG Pro Dynamic Channels Premium
The Gold Standard in Automated Market Structure.
AG Pro Dynamic Channels Premium is the culmination of advanced algorithmic development, designed specifically for professional traders who refuse to compromise on chart clarity.
While standard indicators flood your screen with noise, this Premium edition employs a proprietary "Smart Filtering Engine" to identify, validate, and project only the most statistically significant support and resistance channels. It transforms chaos into a clear, actionable roadmap.
🏆 Why Go Premium?
This is not just an update; it is a complete overhaul of the trend detection logic.
1. 🧠 Smart Quality Control (Exclusive) The core difference in the Premium version is its ability to "think" before it draws.
Volatility Filtering: The script analyzes the slope of every potential trend. It automatically rejects unsustainable "pump/dump" moves and flat ranges, keeping only tradeable structures.
Wick Exclusion Logic: An advanced algorithm that ignores extreme volatility spikes (wicks), drawing channels based on candle body consolidation for higher precision.
2. 🏷️ Intelligent Labeling System Instant situational awareness. Every channel is auto-labeled (e.g., Mj Ext Up), so you know exactly which market phase (Major or Minor, Internal or External) you are trading in without guessing.
3. ⚡ Zero-Lag Optimization The code has been refactored for maximum efficiency, ensuring faster load times and smoother performance even on lower timeframes.
💎 Key Features
Dual-Layer Architecture: Simultaneously tracks Major Trends (for bias) and Minor Trends (for entries).
Dynamic Support & Resistance: The dotted midline acts as a high-probability reversal zone.
Institutional Grade Alerts: Fully customizable alerts for Breakouts and Reactions, complete with metadata for automated trading systems.
Auto-Tuning: Default settings are optimized for a balance of sensitivity and reliability, but fully customizable for specific assets (Crypto, Forex, Indices).
⚙️ Methodology (How It Works)
To comply with TradingView House Rules, here is the technical logic behind the script:
Pivot Detection: The script scans price action using a highly sensitive lookback period to find raw Pivot Highs and Lows.
Structure Mapping: It processes these points to define the Market Structure (HH, LL, LH, HL).
Validation Layer: Before rendering, the Smart Filter calculates the channel's duration and slope coefficient. If the channel is too short or too steep (violating the user-defined Max Slope threshold), it is discarded as "Market Noise."
Projection: Validated channels are drawn with dynamic extensions and fill zones.
🔒 How to Get Access
This is an Invite-Only script. Access is restricted to authorized users.
To Request Access: Please send me a private message on TradingView or check the links in my profile signature for more information.
Existing Members: If you have active access, the script will load automatically.
Disclaimer: Technical analysis tools are for educational purposes. Past performance does not guarantee future results.
Developed by Ali Gurtuna (AG Pro Series).
