Systemic Net Liquidity (Macro Fuel for Crypto & Stocks)This indicator tracks Systemic Net Liquidity, the single most important macro factor for determining the long-term trend of risk assets like Bitcoin (BTC) and major indices (S&P 500). It measures the amount of actual cash available in the financial system to chase speculative assets, distinguishing between money that is circulating and money that is locked up at the Federal Reserve.
Mechanism (What It Measures)
The script uses direct data from the FRED (Federal Reserve Economic Data) to calculate the true state of market funding:
\text{Net Liquidity} = \text{Fed Assets (WALCL)} - \text{Treasury General Account (TGA)} - \text{Reverse Repo (RRP)}
1. Fed Assets (WALCL): The total balance sheet of the Fed (The overall supply of money).
2. Treasury General Account (TGA): Funds the US Treasury collects via bond issuance. When the TGA rises, liquidity is actively drained from the banking system (A major bearish pressure).
3. Overnight Reverse Repo (RRP): Cash parked by banks and money market funds at the Fed, effectively frozen and not contributing to market activity.
How to Interpret Signals
Treat the Net Liquidity line as the market's "Fuel Gauge":
📈 BULLISH SIGNAL (Liquidity Injection): When the Net Liquidity line is rising, money is flowing back into the system, signalling a tailwind for risk assets.
📉 BEARISH SIGNAL (Liquidity Drain): When the line is falling (often due to high TGA balances), cash is being removed. This signals major friction and pressure on price action.
⚠️ DIVERGENCE WARNING: A strong signal is generated when Price (e.g., BTC) rises, but Net Liquidity falls. This macro divergence strongly suggests a major trend reversal or correction is imminent.
Important Notes
Data Source: Data is directly sourced from FRED and updates daily/weekly. This tool is best used for macro analysis and identifying high-level cycles, not short-term scalping.
Disclaimer: Use this indicator as a confirmation tool within your broader strategy. It is not a standalone trading signal.
스크립트에서 "text"에 대해 찾기

Institutional Volume Flow (IVF) with VWAP & Zones. Accumulation Zone (Green Background)Logic: Signals potential institutional buying at the low.Conditions: The current close price is below VWAP $\text{(close} < \text{VWAP)}$, AND there has been at least one Aggressive Buy (IVF) bar within the last $\text{N}$ bars.2. Manipulation Zone (Red Background)Logic: Signals a Stop Hunt or False Breakout where the market briefly takes out a previous extreme before reversing with institutional conviction.Conditions:False Break High: Current high is a new 2-bar high, immediately followed by an Aggressive Sell (IVF) bar.False Break Low: Current low is a new 2-bar low, immediately followed by an Aggressive Buy (IVF) bar.3. Compression Zone (Purple Background)Logic: Signals a period of low volatility where price is "coiling up" for a large move.Conditions: The bar's range $\text{(high} - \text{low)}$ is consistently small (less than a multiplier of the Average True Range (ATR)) for a specific number of bars.The zones are plotted using bgcolor() for a visual area on the chart and plotshape() to mark the specific bar where the condition is met. Manipulation is given the highest plotting priority to ensure it's visible over other zones if conditions overlap.Would you like me to elaborate on the typical trading strategy associated with any of these three zones (Accumulation, Manipulation, or Compression)?

FVG HTF# FVG HTF — Higher‑Timeframe Fair Value Gaps
## Summary
- Plots higher‑timeframe Fair Value Gap (FVG) zones directly on your current chart.
- Tracks fill progress using four methods: Any Touch, Midpoint Reached, Wick Sweep, Body Beyond.
- Shows optional labels with timeframe source and live fill percentage; label text color is configurable.
- Designed for clean overlays and efficient rendering with limits on graphics and bars processed.
## What It Does
- Detects bullish and bearish FVGs from a chosen timeframe (or the chart timeframe) and renders:
- Zone Top/Bottom lines and a dotted midpoint line
- Semi‑transparent area fill between the edges
- Optional label at the midpoint with a tooltip showing zone prices
- Continuously updates zones forward and removes them when the selected fill condition is met.
## Inputs
- `Enable FVG` (`fvgSH2`): Toggle detection/plotting on/off.
- `Timeframe` (`fvgTF2`): Choose `Chart` or HTFs (`5 Minutes`, `15 Minutes`, `1 Hour`, `4 Hours`, `1 Day`, `1 Week`, `1 Month`).
- `Fill Method` (`fvgFill2`):
- Any Touch — wick or body touches any part of the zone
- Midpoint Reached — price reaches at least the 50% of the zone
- Wick Sweep — wick fully travels past the far edge and back inside (conceptually stricter than touch)
- Body Beyond — candle body closes beyond the opposite edge (strong confirmation)
- `Zones` colors (`fvgCb2`, `fvgCs2`): Bullish/Bearish zone colors.
- `Labels` (`fvgLB2`): Show/Hide on‑chart labels.
- `Label Color` (`fvgLBc2`): Color picker for label text (default: white).
- `Max Bars Back` (`maxBars2`): Limits processing to recent bars for performance.
## Timeframe Rules
- The helper `htfTF` prevents selecting a timeframe lower than the chart. If an invalid lower TF is chosen, it falls back to `timeframe.period`.
- Supports minute, daily, weekly, and monthly aggregations that are safe for intraday/daily/weekly charts.
## Detection Logic
- Uses rolling higher‑timeframe bars constructed on the fly and checks 3‑bar displacement patterns:
- Bullish FVG: current HTF low above the high two bars ago AND previous HTF close above that high, with no direct gap condition.
- Bearish FVG: current HTF high below the low two bars ago AND previous HTF close below that low, with no direct gap condition.
- On detection, the script creates an FVG object with:
- Top/Bottom lines (`lnTop`, `lnBtm`) and midpoint line (`lnAvg`)
- Midpoint label (`lbTxt`) showing source timeframe and updating fill percentage
- Semi‑transparent fill (`linefill`) for visual clarity
## Fill Tracking
- Fill threshold depends on selected method:
- Any Touch: opposite edge
- Midpoint Reached: zone’s midpoint
- Wick Sweep: stricter condition conceptually (implemented as an opposite‑edge threshold)
- Body Beyond: requires close beyond the opposite edge
- Each bar updates label x‑position and line endpoints forward; the label text shows the best fill ratio achieved.
- When the threshold is reached, the FVG (label, lines, fill) is removed from the chart.
## Best Practices
- Start with `Any Touch` to visualize broad repairs; switch to `Body Beyond` for conservative confirmations.
- Use `1 Hour` or `4 Hours` overlays on 5m–15m charts for context; `1 Day` on 1H charts; `1 Week` on daily charts.
- Keep labels on when monitoring fills intraday; hide labels for clean higher‑level context.
- Adjust `Max Bars Back` if performance is impacted by many zones.
## Repainting Notes
- HTF zones are computed on `timeframe.change(tf)` and therefore confirm on HTF bar closes.
- Label endpoints extend each bar; detection itself avoids lookahead bias. For strict confirmation, align entries with HTF closes.
## Limitations
- “Wick Sweep” is treated as a stricter touch to the far edge; it does not enforce a separate “return inside” bar state.
- Label text color applies uniformly to bull/bear labels. If you need separate colors per side, contact the author.
## Credits & Version
- Pine Script v6; © rithsilanew2020
## Quick Start
1. Enable FVG and choose your HTF (e.g., `1 Hour`).
2. Pick a Fill Method (start with `Any Touch`).
3. Select zone colors and label text color.
4. Set `Max Bars Back` as needed for performance.
5. Use labels/tooltip values (Top/Mid/Bottom) to plan entries and manage risk.

Top-line % MovesOverview
A clean, text-only overlay that shows price momentum at a glance. It prints one line at the top-center of your chart:
Movement | Day % | 3-Day % | Wk %
What it shows
Day - Percent change from today’s regular-session open to the latest price
3-Day - Percent change from the daily open 3 trading days ago
Wk - Percent change from the daily open 5 trading days ago
How it works
Pulls daily opens via request.security so it stays consistent across intraday and daily timeframes
Calculates percent moves versus those opens and renders a single centered text line
Transparent background, bright white text, no bars or lines, minimal chart footprint
Notes
“Wk” uses 5 trading days. If you prefer 7 calendar days, change the lookback to your preference
Daily opens follow the symbol’s TradingView session settings. Extended or 24h markets may differ from your broker’s definition of “open”
Best for
Quick momentum read without clutter
Screeners, streaming layouts, and compact dashboards
Inputs
None
Tags
percent change, overlay, momentum, daily open, intraday, text display, minimal, Pine v6

Aquantprice: Institutional Structure MatrixSETUP GUIDE
Open TradingView
Go to Indicators
Search: Aquantprice: Institutional Structure Matrix
Click Add to Chart
Customize:
Min Buy = 10, Min Sell = 7
Show only PP, R1, S1, TC, BC
Set Decimals = 5 (Forex) or 8 (Crypto)
USE CASES & TRADING STRATEGIES
1. CPR Confluence Trading (Most Popular)
Rule: Enter when ≥3 timeframes show Buy ≥10/15 or Sell ≥7/13
text Example:
Daily: 12/15 Buy
Weekly: 11/15 Buy
Monthly: 10/15 Buy
→ **STRONG LONG BIAS**
Enter on pullback to nearest **S1 or L3**
2. Hot Zone Scalping (Forex & Indices)
Rule: Trade only when price is in Hot Zone (closest 2 levels)
text Hot: S1-PP → Expect bounce or breakout
Action:
- Buy at S1 if Buy Count ↑
- Sell at PP if Sell Count ↑
3. Institutional Reversal Setup
Rule: Price at H3/L3 + Reversal Condition
text Scenario:
Price touches **Monthly L3**
L3 in **Hot Zone**
Buy Count = 13/15
→ **High-Probability Reversal Long**
4. CPR Width Filter (Avoid Choppy Markets)
Rule: Trade only if CPR Label = "Strong Trend"
text CPR Size < 0.25 → Trending
CPR Size > 0.75 → Sideways (Avoid)
5. Multi-Timeframe Bias Dashboard
Use "Buy" and "Sell" columns as a sentiment meter
TimeframeBuySellBiasDaily123BullishWeekly89BearishMonthly112Bullish
→ Wait for alignment before entering
HOW TO READ THE TABLE
Column Meaning Time frame D, W, M, 3M, 6M, 12MOpen Price Current session open PP, TC, BC, etc. Pivot levels (color-coded if in Hot Zone) Buy X/15 conditions met (≥10 = Strong Buy)Sell X/13 conditions met (≥7 = Strong Sell)CPR Size Histogram + Label (Trend vs Range)Zone Hot: PP-S1, Med: S2-L3, etc. + PP Distance
PRO TIPS
Best on 5M–1H charts for entries
Use with volume or order flow for confirmation
Set alerts on Buy ≥12/15 or Sell ≥10/13
Hide unused levels to reduce clutter
Combine with AQuantPrice Dashboard (Small TF) for full system
IDEAL MARKETS
Forex (EURUSD, GBPUSD, USDJPY)
Indices (NAS100, SPX500, DAX)
Crypto (BTC, ETH – use 6–8 decimals)
Commodities (Gold, Oil)
🚀 **NEW INDICATOR ALERT**
**Aquantprice: Institutional Structure Matrix**
The **ALL-IN-ONE CPR Dashboard** used by smart money traders.
✅ **6 Timeframes in 1 Table** (Daily → Yearly)
✅ **15 Buy + 13 Sell Conditions** (Institutional Logic)
✅ **Hot Zones, CPR Width, PP Distance**
✅ **Fully Customizable – Show/Hide Any Level**
✅ **Real-Time Zone Detection** (Hot, Med, Low)
✅ **Precision up to 8 Decimals**
**No more switching charts. No more confusion.**
See **where institutions are positioned** — instantly.
👉 **Add to Chart Now**: Search **"Aquantprice: Institutional Structure Matrix"**
🔥 **Free Access | Pro-Level Insights**
*By AQuant – Trusted by 10,000+ Traders*
#CPR #PivotTrading #SmartMoney #TradingView
FINAL TAGLINE
"See What Institutions See — Before They Move."
Aquantprice: Institutional Structure Matrix
Your Edge. One Dashboard.

Rotating Messages (Rules or Motivational)This lightweight utility indicator allows you to display rotating custom text messages directly on your TradingView chart — perfect for reminders, trading rules, motivational quotes, or session notes.
You can define multiple messages separated by semicolons (;) or new lines, and the indicator will automatically cycle through them based on time or bar count. Ideal for traders who want visual cues without cluttering the chart.
⚙️ Main Features
⏱ Time-based or bar-based rotation — switch messages every X seconds (real-time) or X bars (historical/backtest mode).
📍 Flexible positioning — choose between Top Right, Bottom Right, or Bottom Center.
📏 Vertical offset — move text up or down for perfect placement on your chart.
🎨 Custom styling — set text color, background color, border visibility, and text size.
✍️ Simple message input — enter your rules or quotes in a text box with support for multi-line messages.

Dynamic Auto FibonacciDynamic Auto Fibonacci - Logarithmic Fib Retracements & Extensions
Overview
Dynamic Auto Fibonacci is an advanced Fibonacci analysis tool that automatically identifies swing highs and lows to plot precise retracement and extension levels on your chart. Unlike traditional manual Fibonacci tools, this indicator dynamically updates as price action evolves, with full support for logarithmic scaling - essential for accurate analysis on long-term charts and high-growth assets.
The indicator features a clean, modern aesthetic with customizable vibrant colors and text-only labels that won't clutter your chart, making it perfect for both intraday scalping and long-term position trading.
Key Features
✅ Automatic Fibonacci Detection - Automatically finds the highest high and lowest low within your selected timeframe
✅ Manual Anchor Point - Click directly on the chart to set a custom low point for your Fibonacci analysis
✅ Logarithmic Scale Support - True logarithmic Fibonacci calculations for accurate levels on log-scale charts
✅ Flexible Display Modes - Show retracements only, extensions only, or both simultaneously
✅ Fully Customizable Levels - Adjust any Fibonacci level value, color, or toggle individual levels on/off
✅ Unified Color Mode - One-click option to change all levels to a single color (perfect for minimalist chart styles)
✅ Clean Modern Design - Text-only labels with vibrant colors and adjustable positioning
✅ 13 Default Levels - Includes 0.0, 0.236, 0.382, 0.5, 0.618, 0.786, 0.886, 1.0, 1.236, 1.414, 1.618, 2.0, and 2.618
How to Use
Quick Start (Automatic Mode)
Add the indicator to your chart
By default, it will automatically find the lowest and highest points over the past 12 months
Fibonacci levels will appear with clean colored text labels positioned to the right of current price
Setting a Custom Anchor Point (Manual Mode)
This is the most powerful feature - drawing from a specific swing low:
Click the Settings icon (gear) on the indicator
Navigate to Fibonacci Settings group
Click inside the "Anchor Start Time" field - this will activate anchor selection mode
Click directly on the candle where you want to set your swing low point on the chart
The indicator will automatically:
Lock that candle as your anchor (swing low)
Find the highest high that occurred after your selected anchor point
Draw Fibonacci retracement and extension levels between those two points
Important: The anchor represents the starting point (0.0 level) of your Fibonacci, and the indicator finds the peak after that point as the 1.0 level.
Display Modes
Navigate to Display Settings → Display Mode to choose:
Retracements & Extensions (default) - Shows all levels from 0.0 to 2.618
Retracements Only - Shows only 0.0 to 1.0 levels (great for identifying pullback entry zones)
Extensions Only - Shows 1.0+ levels (useful for profit targets and breakout projections)
Customizing Individual Levels
Under Retracement Levels and Extension Levels groups, each level has three controls:
Toggle checkbox - Show/hide the level
Value field - Adjust the exact Fibonacci ratio (e.g., change 0.618 to 0.65 if desired)
Color picker - Set unique colors for each level
Unified Color Override
Perfect for chart screenshots or minimalist aesthetics:
Go to Unified Color Override settings group
Enable "Use Unified Color for All Levels"
Choose your color (defaults to gray)
All lines and text immediately change to that color - individual settings are preserved when you toggle back off
Line & Label Customization
Display Settings group offers:
Line Style: Solid, Dashed, or Dotted
Line Length: Short (10 bars), Medium (50 bars), or Long (extends right infinitely)
Line Width: 1-5 pixels
Label Size: Tiny to Huge
Label Offset: Adjust how many bars to the right labels appear (default: 12)
Show Anchor Line: Display vertical lines at your swing low and swing high points
Settings Overview
Fibonacci Settings:
Retracement Timeframe (default: 12M)
Anchor Start Time (click to select candle)
Use Log Scale Calculation (highly recommended for crypto and growth stocks)
Display Settings:
Display Mode (Retracements & Extensions / Retracements Only / Extensions Only)
Line Style, Length, Width
On-Chart Labels (clean text) or Price Scale Labels (traditional right-side axis)
Label Size and Offset
Unified Color Override:
One-click monochrome mode for all levels
Individual Level Controls:
8 customizable retracement levels (0.0 to 1.0)
5 customizable extension levels (1.236 to 2.618)
Use Cases
📊 Swing Trading - Identify key support/resistance zones for entries and exits
📊 Scalping - Use short-term anchors to find precise intraday reversal levels
📊 Position Trading - Logarithmic calculations essential for multi-year crypto/stock analysis
📊 Options Trading - Extension levels provide excellent profit target zones
📊 Multi-Timeframe Analysis - Set different anchors to compare short-term vs. long-term Fibonacci structures
Tips for Best Results
For cryptocurrency and growth stocks: Always enable "Use Log Scale Calculation" and view your chart in log scale
For precision: Use the manual anchor feature to draw from confirmed swing lows/highs rather than relying on automatic detection
For clean charts: Toggle off levels you don't actively use (e.g., disable 0.786 and 0.886 if you only trade 0.382/0.618)
For screenshots: Enable Unified Color Override and set to grayscale for professional-looking chart exports
Note on Logarithmic Scale
This indicator includes true logarithmic Fibonacci calculations, which are critical when analyzing assets with significant price appreciation. Standard arithmetic Fibonacci tools become increasingly inaccurate on log-scale charts - this indicator solves that problem by calculating levels using logarithmic mathematics when "Use Log Scale Calculation" is enabled.
Disclaimer: This indicator is a tool for technical analysis and does not constitute financial advice. Always perform your own analysis and risk management before making trading decisions.

FVG SizeFVG Size Indicator – Description
Overview
This Pine Script v5 indicator detects and visualizes Fair Value Gaps (FVGs) on the chart. It draws colored boxes for FVGs, center lines (CE), and displays the size of each FVG as a label. The indicator is designed for manual analysis, helping traders identify potential price imbalances.
Key Features
FVG Detection:
Identifies bullish and bearish FVGs based on price structure.
Draws colored boxes for FVGs and dotted center lines (CE).
FVG Size Display:
Shows the size of each FVG as a label inside the box.
Customizable minimum size threshold to filter out smaller FVGs.
Dynamic Adjustments:
Extends FVG boxes to the right as new bars form.
Removes FVGs that are filled (mitigated) by price action.
Customizable Settings:
Adjustable colors, text size, and display options.
Settings and Translations
Here are the German settings with their English translations:
FVG Settings
Long FVG Farbe → Long FVG Color (Color for bullish FVG boxes)
Short FVG Farbe → Short FVG Color (Color for bearish FVG boxes)
CE Farbe → CE Color (Color for the center line)
Tage Rückblick → Lookback Days (Number of days to look back for FVGs)
Lösche gefüllte Boxen & Linien → Delete Filled Boxes & Lines (Removes FVGs that have been filled by price)
FVG Display
FVG Größe anzeigen → Show FVG Size (Displays the size of each FVG as a label)
Text → Text Size (Size of the FVG size label text)
Mindestgröße → Minimum Size (Minimum FVG size to display, filtering out smaller FVGs)
How It Works
FVG Detection Logic:
A bullish FVG is detected if the high of the 3rd bar is lower than the low of the 1st bar.
A bearish FVG is detected if the low of the 3rd bar is higher than the high of the 1st bar.
Drawing FVGs:
The indicator draws a box between the high/low of the 1st and 3rd bars.
A center line (CE) is drawn at the midpoint of the FVG.
The size of the FVG is displayed as a label inside the box.
Dynamic Adjustments:
FVG boxes are extended to the right as new bars form.
If the price fills the FVG, the box and line are removed (depending on settings).
Mitigation Logic:
If the price closes beyond the FVG boundaries, the FVG is considered "filled" and removed.

Full Currency Strength Table Dashboard (8 Currencies)
# Full Currency Strength Table Dashboard (8 Currencies) 📊
This indicator provides a **simplified, visual representation of the current relative strengths of 8 major global currencies** (EUR, USD, GBP, JPY, AUD, NZD, CAD, CHF). It's designed as a minimalist dashboard that appears discreetly on your chart, giving traders a quick and clear picture of forex pair movements.
The indicator calculates the relative strength of each currency based on its movement against the other 7 currencies in the panel, providing insight into which currencies are currently the strongest and which are the weakest.
## Key Features 🌟
* **Simplified Visualization:** Instead of showing currency strength as a line on the chart, which can often be distracting, the indicator uses a **data table (dashboard)** positioned on the chart. This ensures **maximum chart visibility** and cleanliness.
* **8 Major Currencies:** All major currencies are included ($A$ - EUR, $B$ - USD, $C$ - GBP, $D$ - JPY, $E$ - AUD, $F$ - NZD, $G$ - CAD, $H$ - CHF), allowing strength calculation based on **28 base currency pairs**.
* **Strength Calculation:** Strength is calculated based on the average percentage change $\left(\frac{\text{Close} - \text{Open}}{\text{Open}} \times 100\right)$ of the currency relative to all 7 other currencies.
* **Timeframe Setting:** Users can select a **higher timeframe (TF)** (e.g., Daily - 'D') for the strength calculation. This allows analysis of longer-term currency strength momentum, independent of the chart's current timeframe.
* **Customizable Design:** You can adjust the table's position, text size, the colour of each currency, and the resolution (length) of the strength meter.
## How to Use the Indicator (Interpretation) 💡
1. **Select a Timeframe (TF):** It's recommended to use a higher TF (e.g., Daily - 'D' or 4h - '240') to get more stable currency strength signals.
2. **The Dashboard Table:** The table displays:
* The currency name (bottom, with its corresponding colour).
* The numerical strength value (top, expressed in points or average change).
* The **Strength Meter (bar)** visually represents the currency's relative strength compared to the other currencies on the panel (calculated based on the Min/Max values across all 8 currencies).
3. **Making Decisions:**
* **Buy:** Look for a currency pair where the **Base Currency** is significantly **strong** (high positive value, long meter) and the **Quote Currency** is significantly **weak** (high negative value, short meter).
* **Sell:** Look for a currency pair where the **Base Currency** is significantly **weak** and the **Quote Currency** is significantly **strong**.
* **Avoid Trading:** Avoid pairs where both currencies have roughly the same strength or are close to zero.
## Note on Calculation and Code 🛠️
* **Base Pairs:** The script calculates 28 base currency pairs (e.g., EURUSD, EURGBP... CADCHF) using the `request.security` function to retrieve data from the selected timeframe (`freq`).
* **Data Correction:** A correction was implemented in the code by adding ` ` after `request.security` to always use the **CLOSED bar values** from the higher TF. This **eliminates NaN (Not a Number) data** that would appear when using the current bar.
* **Accumulation:** Accumulation (`sumA, sumB...`) only occurs when the selected higher TF changes (`timeframe.change(freq)`), effectively tracking the currency's relative strength during the formation of **one closed bar** on that higher TF.
### License
This work is licensed under the **Attribution-NonCommercial-ShareAlike 4.0 International (CC BY-NC-SA 4.0)** license.
The original concept and code are based on the work of the **LuxAlgo** team and finalized to fix syntax errors and handle NaN data for stable use with 8 currencies.
---
**Questions or suggestions?** I'd love to hear your feedback in the comments! Happy trading! 📈

Advanced Speedometer Gauge [PhenLabs]Advanced Speedometer Gauge
Version: PineScript™v6
📌 Description
The Advanced Speedometer Gauge is a revolutionary multi-metric visualization tool that consolidates 13 distinct trading indicators into a single, intuitive speedometer display. Instead of cluttering your workspace with multiple oscillators and panels, this gauge provides a unified interface where you can switch between different metrics while maintaining consistent visual interpretation.
Built on PineScript™ v6, the indicator transforms complex technical calculations into an easy-to-read semi-circular gauge with color-coded zones and a precision needle indicator. Each of the 13 available metrics has been carefully normalized to a 0-100 scale, ensuring that whether you’re analyzing RSI, volume trends, or volatility extremes, the visual interpretation remains consistent and intuitive.
The gauge is designed for traders who value efficiency and clarity. By consolidating multiple analytical perspectives into one compact display, you can quickly assess market conditions without the visual noise of traditional multi-indicator setups. All metrics are non-overlapping, meaning each provides unique insights into different aspects of market behavior.
🚀 Points of Innovation
13 selectable metrics covering momentum, volume, volatility, trend, and statistical analysis, all accessible through a single dropdown menu
Universal 0-100 normalization system that standardizes different indicator scales for consistent visual interpretation across all metrics
Semi-circular gauge design with 21 arc segments providing smooth precision and clear visual feedback through color-coded zones
Non-redundant metric selection ensuring each indicator provides unique market insights without analytical overlap
Advanced metrics including MFI (volume-weighted momentum), CCI (statistical deviation), Volatility Rank (extended lookback), Trend Strength (ADX-style), Choppiness Index, Volume Trend, and Price Distance from MA
Flexible positioning system with 5 chart locations, 3 size options, and fully customizable color schemes for optimal workspace integration
🔧 Core Components
Metric Selection Engine: Dropdown interface allowing instant switching between 13 different technical indicators, each with independent parameter controls
Normalization System: All metrics converted to 0-100 scale using indicator-specific algorithms that preserve the statistical significance of each measurement
Semi-Circular Gauge: Visual display using 21 arc segments arranged in curved formation with two-row thickness for enhanced visibility
Color Zone System: Three distinct zones (0-40 green, 40-70 yellow, 70-100 red) providing instant visual feedback on metric extremes
Needle Indicator: Dynamic pointer that positions across the gauge arc based on precise current metric value
Table Implementation: Professional table structure ensuring consistent positioning and rendering across different chart configurations
🔥 Key Features
RSI (Relative Strength Index): Classic momentum oscillator measuring overbought/oversold conditions with adjustable period length (default 14)
Stochastic Oscillator: Compares closing price to price range over specified period with smoothing, ideal for identifying momentum shifts
MFI (Money Flow Index): Volume-weighted RSI that combines price movement with volume to measure buying and selling pressure intensity
CCI (Commodity Channel Index): Measures statistical deviation from average price, normalized from typical -200 to +200 range to 0-100 scale
Williams %R: Alternative overbought/oversold indicator using high-low range analysis, inverted to match 0-100 scale conventions
Volume %: Current volume relative to moving average expressed as percentage, capped at 100 for extreme spikes
Volume Trend: Cumulative directional volume flow showing whether volume is flowing into up moves or down moves over specified period
ATR Percentile: Current Average True Range position within historical range using specified lookback period (default 100 bars)
Volatility Rank: Close-to-close volatility measured against extended historical range (default 252 days), differs from ATR in calculation method
Momentum: Rate of change calculation showing price movement speed, centered at 50 and normalized to 0-100 range
Trend Strength: ADX-style calculation using directional movement to quantify trend intensity regardless of direction
Choppiness Index: Measures market choppiness versus trending behavior, where high values indicate ranging markets and low values indicate strong trends
Price Distance from MA: Measures current price over-extension from moving average using standard deviation calculations
🎨 Visualization
Semi-Circular Arc Display: Curved gauge spanning from 0 (left) to 100 (right) with smooth progression and two-row thickness for visibility
Color-Coded Zones: Green zone (0-40) for low/oversold conditions, yellow zone (40-70) for neutral readings, red zone (70-100) for high/overbought conditions
Needle Indicator: Downward-pointing triangle (▼) positioned precisely at current metric value along the gauge arc
Scale Markers: Vertical line markers at 0, 25, 50, 75, and 100 positions with corresponding numerical labels below
Title Display: Merged cell showing “𓄀 PhenLabs” branding plus currently selected metric name in monospace font
Large Value Display: Current metric value shown with two decimal precision in large text directly below title
Table Structure: Professional table with customizable background color, text color, and transparency for minimal chart obstruction
📖 Usage Guidelines
Metric Selection
Select Metric: Default: RSI | Options: RSI, Stochastic, Volume %, ATR Percentile, Momentum, MFI (Money Flow), CCI (Commodity Channel), Williams %R, Volatility Rank, Trend Strength, Choppiness Index, Volume Trend, Price Distance | Choose the technical indicator you want to display on the gauge based on your current analytical needs
RSI Settings
RSI Length: Default: 14 | Range: 1+ | Controls the lookback period for RSI calculation, shorter periods increase sensitivity to recent price changes
Stochastic Settings
Stochastic Length: Default: 14 | Range: 1+ | Lookback period for stochastic calculation comparing close to high-low range
Stochastic Smooth: Default: 3 | Range: 1+ | Smoothing period applied to raw stochastic value to reduce noise and false signals
Volume Settings
Volume MA Length: Default: 20 | Range: 1+ | Moving average period used to calculate average volume for comparison with current volume
Volume Trend Length: Default: 20 | Range: 5+ | Period for calculating cumulative directional volume flow trend
ATR and Volatility Settings
ATR Length: Default: 14 | Range: 1+ | Period for Average True Range calculation used in ATR Percentile metric
ATR Percentile Lookback: Default: 100 | Range: 20+ | Historical range used to determine current ATR position as percentile
Volatility Rank Lookback (Days): Default: 252 | Range: 50+ | Extended lookback period for Volatility Rank metric using close-to-close volatility
Momentum and Trend Settings
Momentum Length: Default: 10 | Range: 1+ | Lookback period for rate of change calculation in Momentum metric
Trend Strength Length: Default: 20 | Range: 5+ | Period for directional movement calculations in ADX-style Trend Strength metric
Advanced Metric Settings
MFI Length: Default: 14 | Range: 1+ | Lookback period for Money Flow Index calculation combining price and volume
CCI Length: Default: 20 | Range: 1+ | Period for Commodity Channel Index statistical deviation calculation
Williams %R Length: Default: 14 | Range: 1+ | Lookback period for Williams %R high-low range analysis
Choppiness Index Length: Default: 14 | Range: 5+ | Period for calculating market choppiness versus trending behavior
Price Distance MA Length: Default: 50 | Range: 10+ | Moving average period used for Price Distance standard deviation calculation
Visual Customization
Position: Default: Top Right | Options: Top Left, Top Right, Bottom Left, Bottom Right, Middle Right | Controls gauge placement on chart for optimal workspace organization
Size: Default: Normal | Options: Small, Normal, Large | Adjusts overall gauge dimensions and text size for different monitor resolutions and preferences
Low Zone Color (0-40): Default: Green (#00FF00) | Customize color for low/oversold zone of gauge arc
Medium Zone Color (40-70): Default: Yellow (#FFFF00) | Customize color for neutral/medium zone of gauge arc
High Zone Color (70-100): Default: Red (#FF0000) | Customize color for high/overbought zone of gauge arc
Background Color: Default: Semi-transparent dark gray | Customize gauge background for contrast and chart integration
Text Color: Default: White (#FFFFFF) | Customize all text elements including title, value, and scale labels
✅ Best Use Cases
Quick visual assessment of market conditions when you need instant feedback on whether an asset is in extreme territory across multiple analytical dimensions
Workspace organization for traders who monitor multiple indicators but want to reduce chart clutter and visual complexity
Metric comparison by switching between different indicators while maintaining consistent visual interpretation through the 0-100 normalization
Overbought/oversold identification using RSI, Stochastic, Williams %R, or MFI depending on whether you prefer price-only or volume-weighted analysis
Volume analysis through Volume %, Volume Trend, or MFI to confirm price movements with corresponding volume characteristics
Volatility monitoring using ATR Percentile or Volatility Rank to identify expansion/contraction cycles and adjust position sizing
Trend vs range identification by comparing Trend Strength (high values = trending) against Choppiness Index (high values = ranging)
Statistical over-extension detection using CCI or Price Distance to identify when price has deviated significantly from normal behavior
Multi-timeframe analysis by duplicating the gauge on different timeframe charts to compare metric readings across time horizons
Educational purposes for new traders learning to interpret technical indicators through consistent visual representation
⚠️ Limitations
The gauge displays only one metric at a time, requiring manual switching to compare different indicators rather than simultaneous multi-metric viewing
The 0-100 normalization, while providing consistency, may obscure the raw values and specific nuances of each underlying indicator
Table-based visualization cannot be exported or saved as an image separately from the full chart screenshot
Optimal parameter settings vary by asset type, timeframe, and market conditions, requiring user experimentation for best results
💡 What Makes This Unique
Unified Multi-Metric Interface: The only gauge-style indicator offering 13 distinct metrics through a single interface, eliminating the need for multiple oscillator panels
Non-Overlapping Analytics: Each metric provides genuinely unique insights—MFI combines volume with price, CCI measures statistical deviation, Volatility Rank uses extended lookback, Trend Strength quantifies directional movement, and Choppiness Index measures ranging behavior
Universal Normalization System: All metrics standardized to 0-100 scale using indicator-appropriate algorithms that preserve statistical meaning while enabling consistent visual interpretation
Professional Visual Design: Semi-circular gauge with 21 arc segments, precision needle positioning, color-coded zones, and clean table implementation that maintains clarity across all chart configurations
Extensive Customization: Independent parameter controls for each metric, five position options, three size presets, and full color customization for seamless workspace integration
🔬 How It Works
1. Metric Calculation Phase:
All 13 metrics are calculated simultaneously on every bar using their respective algorithms with user-defined parameters
Each metric applies its own specific calculation method—RSI uses average gains vs losses, Stochastic compares close to high-low range, MFI incorporates typical price and volume, CCI measures deviation from statistical mean, ATR calculates true range, directional indicators measure up/down movement, and statistical metrics analyze price relationships
2. Normalization Process:
Each calculated metric is converted to a standardized 0-100 scale using indicator-appropriate transformations
Some metrics are naturally 0-100 (RSI, Stochastic, MFI, Williams %R), while others require scaling—CCI transforms from ±200 range, Momentum centers around 50, Volume ratio caps at 2x for 100, ATR and Volatility Rank calculate percentile positions, and Price Distance scales by standard deviations
3. Gauge Rendering:
The selected metric’s normalized value determines the needle position across 21 arc segments spanning 0-100
Each arc segment receives its color based on position—segments 0-8 are green zone, segments 9-14 are yellow zone, segments 15-20 are red zone
The needle indicator (▼) appears in row 5 at the column corresponding to the current metric value, providing precise visual feedback
4. Table Construction:
The gauge uses TradingView’s table system with merged cells for title and value display, ensuring consistent positioning regardless of chart configuration
Rows are allocated as follows: Row 0 merged for title, Row 1 merged for large value display, Row 2 for spacing, Rows 3-4 for the semi-circular arc with curved shaping, Row 5 for needle indicator, Row 6 for scale markers, Row 7 for numerical labels at 0/25/50/75/100
All visual elements update on every bar when barstate.islast is true, ensuring real-time accuracy without performance impact
💡 Note:
This indicator is designed for visual analysis and market condition assessment, not as a standalone trading system. For best results, combine gauge readings with price action analysis, support and resistance levels, and broader market context. Parameter optimization is recommended based on your specific trading timeframe and asset class. The gauge works on all timeframes but may require different parameter settings for intraday versus daily/weekly analysis. Consider using multiple instances of the gauge set to different metrics for comprehensive market analysis without switching between settings.

High Time Frame (HTF) Swing PointsIdentify and display swing highs and lows across multiple higher timeframes on a chart, overlaying horizontal lines and customizable labels at these swing points.
Timeframes
Five user-defined higher timeframes (default settings: 5-minute, 15-minute, 1-hour, 4-hour, and daily)
Manually show/hide individual timeframes
When chart’s timeframe is set higher than one of the five configured, the indicator will automatically hide it. This helps to prevent clutter when navigating between timeframes on the chart
Swing Levels
Configure the line color, opacity, width and weather it’s solid/dotted/dashed
Once swing levels are identified, the indicator will look for the chart candle where the line starts
When price crosses the swing level, the line will be terminated
Tags
Customize the tag text for each individual timeframe, using blank if a tag is not desired for that timeframe
A tag text color can be set for all tags or base it on the line color
Set tag text size based on: Auto, Tiny, Small, Normal, Large
Choose how far to the right of the line the tag text should appear, as an integer representing the size of a candle
Choose to clear the tag or leave it in place after price crosses a swing level
Use Cases
Visualize key swing points from higher timeframes to identify potential reversal or breakout zones
Identify possible low resistance liquidity run (LRLR) areas
Use swing points for stop placement or as targets or draws on liquidity

Synthetic Implied APROverview
The Synthetic Implied APR is an artificial implied APR, designed to imitate the implied APR seen when trading cryptocurrency funding rates. It combines real-time funding rates with premium data to calculate an artificial market expectation of the annualized funding rate.
The (actual) implied APR is the market's expectation of the annualized funding rate. This is dependent on bid/ask impacts of the implied APR, something which is currently unavailable to fetch with TradingView. In essence, an implied APR of X% means traders believe that asset's funding fees to average X% when annualized.
What's important to understand, is that the actual value of the synthetic implied APR is not relevant. We only simply use its relative changes when we trade (i.e if it crosses above/below its MA for a given weight). Even for the same asset, the implied APRs will change depending on days to maturity.
How it calculates
The synthetic implied APR is calculated with these steps:
Collects premium data from perpetual futures markets using optimized lower timeframe requests (check my 'Predicted Funding Rates' indicator)
Calculates the funding rate by adding the premium to an interest rate component (clamped within exchange limits)
Derives the underlying APR from the 8-hour funding rate (funding rate × 3 × 365)
Apply a weighed formula that imitates both the direction (underlying APR) with the volatility of prices (from the premium index and funding)
premium_component = (prem_avg / 50 ) * 365
weighedprem = (weight * fr) + ((1 - weight) * apr) + (premium_component * 0.3)
impliedAPR = math.avg(weighedprem, ta.sma(apr, maLength))
How to use it: Generally
Preface: Funding rates are an indication of market sentiment
If funding is positive, generally the market is bullish as longs are willing to pay shorts funding
If funding is negative, generally the market is bearish as shorts are willing to pay longs funding
So, this script can be used like a typical oscillator:
Bullish: If implied APR > MA OR if implied APR MA is green
Bearish: If implied APR < MA OR if implied APR MA is red
The components:
Synthetic Implied APR: The main metric. At current setting of 0.7, it imitates volatility
Weight: The higher the value, the smoother the synthetic implied APR is (and MA too). This value is very important to the imitation. At 0.7, it imitates the actual volatility of the implied APR. At weight = 1, it becomes very smooth. Perfect for trading
Synthetic Implied APR Moving Average: A moving average of the Synthetic implied APR. Can choose from multiple selections, (SMA, EMA, WMA, HMA, VWMA, RMA)
How to use it: Trading Funding
When trading funding there're multiple ways to use it with different settings
Trade funding rates with trend changes
Settings: Weight = 1
Method 1: When the implied APR MA turns green, long funding rates (or short if red)
Method 2: When the implied APR crosses above the MA, long funding rates (or short when crosses below)
Trade funding rates with MA pullbacks
Settings: Weight = 0.7, timeframe 15m
In an uptrend: When implied APR crosses below then above the script, long funding opportunity
In an downtrend: When implied APR crosses above then below the script, shortfunding opportunity
You can determine the trend with the method before, using a weight of 1
To trade funding rates, it's best to have these 3 scripts at these settings:
Predicted Funding Rates: This allows you to see the predicted funding rates and see if they've maxxed out for added confluence too (+/-0.01% usually for Binance BTC futures)
Synthetic implied APR: At weight 1, the MA provides a good trend (whether close above/below or colour change)
Synthetic implied APR: At weight 0.7, it provides a good imitation of volatility
How to use it: Trading Futures
When trading futures:
You can determine roughly what the trend is, if the assumption is made that funding rates can help identify trends if used as a sentiment indicator. It should be supplemented with traditional trend trading methods
To prevent whipsaws, weight should remain high
Long trend: When the implied APR MA turns green OR when it crosses above its MA
Short trend: When the implied APR MA turns red OR when it below above its MA
Why it's original
This indicator introduces a unique synthetic weighting system that combines funding rates, underlying APR, and premium components in a way not found in existing TradingView scripts. Trading funding rates is a niche area, there aren't that many scripts currently available. And to my knowledge, there's no synthetic implied APR scripts available on TradingView either. So I believe this script to be original in that sense.
Notes
Because it depends on my triangular weighting algos, optimal accuracy is found on timeframes that are 4H or less. On higher timeframes, the accuracy drops off. Best timeframes for intraday trading using this are 15m or 1 hour
The higher the timeframe, the lower the MA one should use. At 1 hour, 200 or higher is best. At say, 4h, length of 50 is best
Only works for coins that have a Binance premium index
Inputs
Funding Period - Select between "1 Hour" or "8 Hour" funding cycles. 8 hours is standard for Binance
Table - Toggle the information dashboard on/off to show or hide real-time metrics including funding rate, premium, and APR value
Weight - Controls the balance between funding rate (higher values = smoother) and APR (lower values = more responsive) in the calculation, ranging from 0.0 to 1.0. Default is 0.7, this imitates the volatility
Auto Timeframe Implied Length - Automatically calculates optimal smoothing length based on your chart timeframe for consistent behavior across different time periods
Manual Implied Length - Sets a fixed smoothing length (in bars) when auto mode is disabled, with lower values being more responsive and higher values being smoother
Show Implied APR MA - Displays an additional moving average line of the Synthetic Implied APR to help identify trend direction and crossover signals
MA Type for Implied APR - Selects the calculation method (SMA, EMA, WMA, HMA, VWMA, or RMA) for the moving average, each offering different responsiveness and lag characteristics
MA Length for Implied APR - Sets the lookback period (1-500 bars) for the moving average, with shorter lengths providing more signals and longer lengths filtering noise
Show Underlying APR - Displays the raw APR calculation (without synthetic weighting) as a reference line to compare against the main indicator
Bullish Color - Sets the color for positive values in the table and rising MA line
Bearish Color - Sets the color for negative values in the table and falling MA line
Table Background - Customizes the background color and transparency of the information dashboard
Table Text Color - Sets the color for label text in the left column of the information table
Table Text Size - Controls the font size of table text with options from Tiny to Huge

Simple Technicals Table📊 Simple Technicals Table
🎯 A comprehensive technical analysis dashboard displaying key pivot points and moving averages across multiple timeframes
📋 OVERVIEW
The Simple Technicals Table is a powerful indicator that organizes essential trading data into a clean, customizable table format. It combines Fibonacci-based pivot points with critical moving averages for both daily and weekly timeframes, giving traders instant access to key support/resistance levels and trend information.
Perfect for:
Technical analysts studying multi-timeframe data
Chart readers needing quick reference levels
Market researchers analyzing price patterns
Educational purposes and data visualization
🚀 KEY FEATURES
📊 Dual Timeframe Analysis
Daily (D1) and Weekly (W1) data side-by-side
Real-time updates as market conditions change
Seamless comparison between timeframes
🎯 Fibonacci Pivot Points
R3, R2, R1 : Resistance levels using Fibonacci ratios (38.2%, 61.8%, 100%)
PP : Central pivot point from previous period's data
S1, S2, S3 : Support levels with same methodology
📈 Complete EMA Suite
EMA 10 : Short-term trend identification
EMA 20 : Popular swing trading reference
EMA 50 : Medium-term trend confirmation
EMA 100 : Institutional support/resistance
EMA 200 : Long-term trend determination
📊 Essential Indicators
RSI 14 : Momentum for overbought/oversold conditions
ATR 14 : Volatility measurement for risk management
🎨 Full Customization
9 table positions : Place anywhere on your chart
5 text sizes : Tiny to huge for optimal visibility
Custom colors : Background, headers, and text
Optional pivot lines : Visual weekly levels on chart
⚙️ HOW IT WORKS
Fibonacci Pivot Calculation:
Pivot Point (PP) = (High + Low + Close) / 3
Range = High - Low
Resistance Levels:
R1 = PP + (Range × 0.382)
R2 = PP + (Range × 0.618)
R3 = PP + (Range × 1.000)
Support Levels:
S1 = PP - (Range × 0.382)
S2 = PP - (Range × 0.618)
S3 = PP - (Range × 1.000)
Smart Price Formatting:
< $1: 5 decimal places (crypto-friendly)
$1-$10: 4 decimal places
$10-$100: 3 decimal places
> $100: 2 decimal places
📊 TECHNICAL ANALYSIS APPLICATIONS
⚠️ EDUCATIONAL PURPOSE ONLY
This indicator is designed solely for technical analysis and educational purposes . It provides data visualization to help understand market structure and price relationships.
📈 Data Analysis Uses
Support & Resistance Identification : Visualize Fibonacci-based pivot levels
Trend Analysis : Study EMA relationships and price positioning
Multi-Timeframe Study : Compare daily and weekly technical data
Market Structure : Understand key technical levels and indicators
📚 Educational Benefits
Learn about Fibonacci pivot point calculations
Understand moving average relationships
Study RSI and ATR indicator values
Practice multi-timeframe technical analysis
🔍 Data Visualization Features
Organized table format for easy data reading
Color-coded levels for quick identification
Real-time technical indicator values
Historical data integrity maintained
🛠️ SETUP GUIDE
1. Installation
Search "Simple Technicals Table" in indicators
Add to chart (appears in middle-left by default)
Table displays automatically on any timeframe
2. Customization
Table Position : Choose from 9 locations
Text Size : Adjust for screen resolution
Colors : Match your chart theme
Pivot Lines : Toggle weekly level visualization
3. Optimization Tips
Use larger text on mobile devices
Dark backgrounds work well with light text
Enable pivot lines for visual reference
✅ BEST PRACTICES
Recommended Usage:
Use for technical analysis and educational study only
Combine with other analytical methods for comprehensive analysis
Study multi-timeframe data relationships
Practice understanding technical indicator values
Important Notes:
Levels based on previous period's data
Most effective in trending markets
No repainting - uses confirmed data only
Works on all instruments and timeframes
🔧 TECHNICAL SPECS
Performance:
Pine Script v5 optimized code
Minimal CPU/memory usage
Real-time data updates
No lookahead bias
Compatibility:
All chart types (Candlestick, Bar, Line)
Any instrument (Stocks, Forex, Crypto, etc.)
All timeframes supported
Mobile and desktop friendly
Data Accuracy:
Precise floating-point calculations
Historical data integrity maintained
No future data leakage
📱 DEVICE SUPPORT
✅ Desktop browsers (Chrome, Firefox, Safari, Edge)
✅ TradingView mobile app (iOS/Android)
✅ TradingView desktop application
✅ Light and dark themes
✅ All screen resolutions
📋 VERSION INFO
Version 1.0 - Initial Release
Fibonacci-based pivot calculations
Dual timeframe support (Daily/Weekly)
Complete EMA suite (10, 20, 50, 100, 200)
RSI and ATR indicators
Fully customizable interface
Optional pivot line visualization
Smart price formatting
Mobile-optimized display
⚠️ DISCLAIMER
This indicator is designed for technical analysis, educational and informational purposes ONLY . It provides data visualization and technical calculations to help users understand market structure and price relationships.
⚠️ NOT FOR TRADING DECISIONS
This tool does NOT provide trading signals or investment advice
All data is for analytical and educational purposes only
Users should not base trading decisions solely on this indicator
Always conduct thorough research and analysis before making any financial decisions
📚 Educational Use Only
Use for learning technical analysis concepts
Study market data and indicator relationships
Practice chart reading and data interpretation
Understand mathematical calculations behind technical indicators
The Simple Technicals Table provides technical data visualization to assist in market analysis education. It does not constitute financial advice, trading recommendations, or investment guidance. Users are solely responsible for their own research and decisions.
Author: ToTrieu
Version: 1.0
Category: Technical Analysis / Support & Resistance
License: Open source for educational use
💬 Questions? Comments? Feel free to reach out!

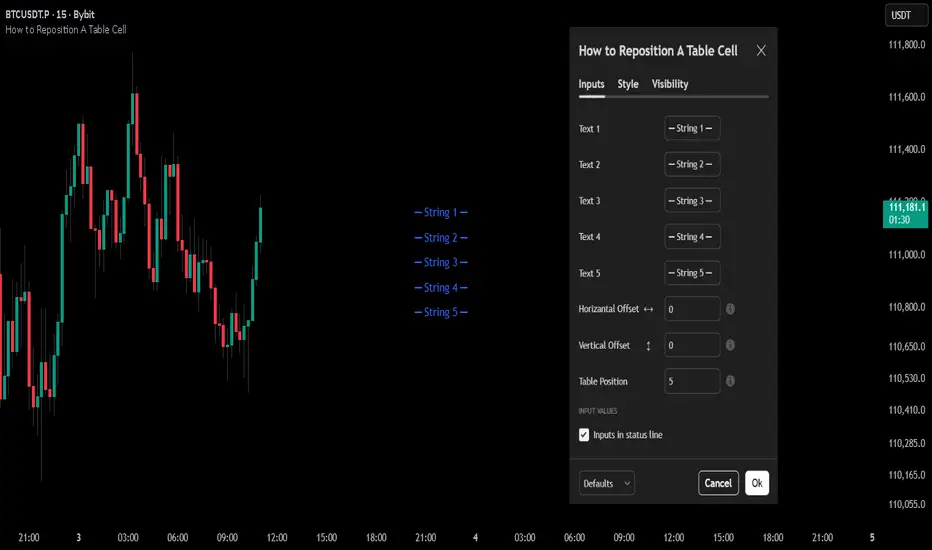
How to Reposition A Table CellOVERVIEW
Using table functions in Pine Script is one of the most effective methods for reporting and interpreting data in a readable manner. However, the built-in capabilities for dynamically repositioning table location are limited. To extend these limitations, a small intervention to the script may be required. This indicator exemplifies how such intervention can be modeled.
CONCEPTS
This indicator provides comprehensive control over table positioning through several user-defined parameters that work together to create flexible display options.
Text Parameters : These five string inputs allow users to define the content displayed in the table. Each parameter accepts custom text that will be displayed as separate rows within the table cell. (The relevant parameters are designed as examples. When implementing the code into your own scripts, you can use series string variables instead of the those inputs.)
Horizontal Offset : This integer parameter controls the horizontal positioning of the table content. Negative values shift the table content to the left, while positive values move it to the right. The offset is multiplied by a spacing factor (currently set to 4) to provide more noticeable movement. This parameter is particularly useful when you need to avoid overlapping with other chart elements or align multiple indicators.
Vertical Offset : This integer parameter manages the vertical positioning by adding line breaks above or below the content. Negative values push the content downward by adding line breaks at the beginning, while positive values elevate the content by adding line breaks at the end. This creates effective vertical spacing without affecting the table's base position.
Table Position : This parameter accepts values from 1 to 9, corresponding to the standard TradingView table positions arranged in a 3x3 grid format (1-3: top row, 4-6: middle row, 7-9: bottom row). This serves as the base positioning before any offset adjustments are applied, providing users with familiar reference points for initial placement.
FUNCTION
The core functionality centers on the custom f_position() function, which processes text positioning based on horizontal and vertical offset values. For vertical positioning, it adds line breaks before or after content depending on the offset direction. For horizontal positioning, it splits the text by rows and adds calculated spaces to each row, maintaining proper alignment across multi-line content. The spacing uses a fixed multiplier of 4, providing good balance between precision and visible movement.
ORIGINALITY & NOTES
Tihs indicator,
introduces a novel approach to table positioning that goes beyond TradingView's standard 9-position limitation by implementing custom offset calculations that allow pixel-level control over table placement.
serves as an educational resource, demonstrating advanced Pine Script techniques for UI manipulation that can be adapted for various custom indicator developments.
is particularly valuable for developers creating complex dashboard layouts or educational materials where precise positioning is crucial. The modular design of the positioning function makes it easily adaptable for other projects requiring similar functionality.
I hope it helps everyone, Always combine with risk management principles and market context awareness. I hope it helps everyone. Trade as safely as possible. Best of luck!
Intrabar Volume Delta — RealTime + History (Stocks/Crypto/Forex)Intrabar Volume Delta Grid — RealTime + History (Stocks/Crypto/Forex)
# Short Description
Shows intrabar Up/Down volume, Delta (absolute/relative) and UpShare% in a compact grid for both real-time and historical bars. Includes an MTF (M1…D1) dashboard, contextual coloring, density controls, and alerts on Δ and UpShare%. Smart historical splitting (“History Mode”) for Crypto/Futures/FX.
---
# What it does (Quick)
* **UpVol / DownVol / Δ / UpShare%** — visualizes order-flow inside each candle.
* **Real-time** — accumulates intrabar volume live by tick-direction.
* **History Mode** — splits Up/Down on closed bars via simple or range-aware logic.
* **MTF Dashboard** — one table view across M1, M5, M15, M30, H1, H4, D1 (Vol, Up/Down, Δ%, Share, Trend).
* **Contextual opacity** — stronger signals appear bolder.
* **Label density** — draw every N-th bar and limit to last X bars for performance.
* **Alerts** — thresholds for |Δ|, Δ%, and UpShare%.
---
# How it works (Real-Time vs History)
* **Real-time (open bar):** volume increments into **UpVolRT** or **DownVolRT** depending on last price move (↑ goes to Up, ↓ to Down). This approximates live order-flow even when full tick history isn’t available.
* **History (closed bars):**
* **None** — no split (Up/Down = 0/0). Safest for equities/indices with unreliable tick history.
* **Approx (Close vs Open)** — all volume goes to candle direction (green → Up 100%, red → Down 100%). Fast but yields many 0/100% bars.
* **Price Action Based** — splits by Close position within High-Low range; strength = |Close−mid|/(High−Low). Above mid → more Up; below mid → more Down. Falls back to direction if High==Low.
* **Auto** — **Stocks/Index → None**, **Crypto/Futures/FX → Approx**. If you see too many 0/100 bars, switch to **Price Action Based**.
---
# Rows & Meaning
* **Volume** — total bar volume (no split).
* **UpVol / DownVol** — directional intrabar volume.
* **Delta (Δ)** — UpVol − DownVol.
* **Absolute**: raw units
* **Relative (Δ%)**: Δ / (Up+Down) × 100
* **Both**: shows both formats
* **UpShare%** — UpVol / (Up+Down) × 100. >50% bullish, <50% bearish.
* Helpful icons: ▲ (>65%), ▼ (<35%).
---
# MTF Dashboard (🔧 Enable Dashboard)
A single table with **Vol, Up, Down, Δ%, Share, Trend (🔼/🔽/⏭️)** for selected timeframes (M1…D1). Great for a fast “panorama” read of flow alignment across horizons.
---
# Inputs (Grouped)
## Display
* Toggle rows: **Volume / Up / Down / Delta / UpShare**
* **Delta Display**: Absolute / Relative / Both
## Realtime & History
* **History Mode**: Auto / None / Approx / Price Action Based
* **Compact Numbers**: 1.2k, 1.25M, 3.4B…
## Theme & UI
* **Theme Mode**: Auto / Light / Dark
* **Row Spacing**: vertical spacing between rows
* **Top Row Y**: moves the whole grid vertically
* **Draw Guide Lines**: faint dotted guides
* **Text Size**: Tiny / Small / Normal / Large
## 🔧 Dashboard Settings
* **Enable Dashboard**
* **📏 Table Text Size**: Tiny…Huge
* **🦓 Zebra Rows**
* **🔲 Table Border**
## ⏰ Timeframes (for Dashboard)
* **M1…D1** toggles
## Contextual Coloring
* **Enable Contextual Coloring**: opacity by signal strength
* **Δ% cap / Share offset cap**: saturation caps
* **Min/Max transparency**: solid vs faint extremes
## Label Density & Size
* **Show every N-th bar**: draw labels only every Nth bar
* **Limit to last X bars**: keep labels only in the most recent X bars
## Colors
* Up / Down / Text / Guide
## Alerts
* **Delta Threshold (abs)** — |Δ| in volume units
* **UpShare > / <** — bullish/bearish thresholds
* **Enable Δ% Alert**, **Δ% > +**, **Δ% < −** — relative delta levels
---
# How to use (Quick Start)
1. Add the indicator to your chart (overlay=false → separate pane).
2. **History Mode**:
* Crypto/Futures/FX → keep **Auto** or switch to **Price Action Based** for richer history.
* Stocks/Index → prefer **None** or **Price Action Based** for safer splits.
3. **Label Density**: start with **Limit to last X bars = 30–150** and **Show every N-th bar = 2–4**.
4. **Contextual Coloring**: keep on to emphasize strong Δ% / Share moves.
5. **Dashboard**: enable and pick only the TFs you actually use.
6. **Alerts**: set thresholds (ideas below).
---
# Alerts (in TradingView)
Add alert → pick this indicator → choose any of:
* **Delta exceeds threshold** (|Δ| > X)
* **UpShare above threshold** (UpShare% > X)
* **UpShare below threshold** (UpShare% < X)
* **Relative Delta above +X%**
* **Relative Delta below −X%**
**Starter thresholds (tune per symbol & TF):**
* **Crypto M1/M5**: Δ% > +25…35 (bullish), Δ% < −25…−35 (bearish)
* **FX (tick volume)**: UpShare > 60–65% or < 40–35%
* **Stocks (liquid)**: set **Absolute Δ** by typical volume scale (e.g., 50k / 100k / 500k)
---
# Notes by Market Type
* **Crypto/Futures**: 24/7 and high liquidity — **Price Action Based** often gives nicer history splits than Approx.
* **Forex (FX)**: TradingView volume is typically **tick volume** (not true exchange volume). Treat Δ/Share as tick-based flow, still very useful intraday.
* **Stocks/Index**: historical tick detail can be limited. **None** or **Price Action Based** is a safer default. If you see too many 0/100% shares, switch away from Approx.
---
# “All Timeframes” accuracy
* Works on **any TF** (M1 → D1/W1).
* **Real-time accuracy** is strong for the open bar (live accumulation).
* **Historical accuracy** depends on your **History Mode** (None = safest, Approx = fastest/simplest, Price Action Based = more nuanced).
* The MTF dashboard uses `request.security` and therefore follows the same logic per TF.
---
# Trade Ideas (Use-Cases)
* **Scalping (M1–M5)**: a spike in Δ% + UpShare>65% + rising total Vol → momentum entries.
* **Intraday (M5–M30–H1)**: when multiple TFs show aligned Δ%/Share (e.g., M5 & M15 bullish), join the trend.
* **Swing (H4–D1)**: persistent Δ% > 0 and UpShare > 55–60% → structural accumulation bias.
---
# Advantages
* **True-feeling live flow** on the open bar.
* **Adaptable history** (three modes) to match data quality.
* **Clean visual layout** with guides, compact numbers, contextual opacity.
* **MTF snapshot** for quick bias read.
* **Performance controls** (last X bars, every N-th bar).
---
# Limitations & Care
* **FX uses tick volume** — interpret Δ/Share accordingly.
* **History Mode is an approximation** — confirm with trend/structure/liquidity context.
* **Illiquid symbols** can produce noisy or contradictory signals.
* **Too many labels** can slow charts → raise N, lower X, or disable guides.
---
# Best Practices (Checklist)
* Crypto/Futures: prefer **Price Action Based** for history.
* Stocks: **None** or **Price Action Based**; be cautious with **Approx**.
* FX: pair Δ% & UpShare% with session context (London/NY) and volatility.
* If labels overlap: tweak **Row Spacing** and **Text Size**.
* In the dashboard, keep only the TFs you actually act on.
* Alerts: start around **Δ% 25–35** for “punchy” moves, then refine per asset.
---
# FAQ
**1) Why do some closed bars show 0%/100% UpShare?**
You’re on **Approx** history mode. Switch to **Price Action Based** for smoother splits.
**2) Δ% looks strong but price doesn’t move — why?**
Δ% is an **order-flow** measure. Price also depends on liquidity pockets, sessions, news, higher-timeframe structure. Use confirmations.
**3) Performance slowdown — what to do?**
Lower **Limit to last X bars** (e.g., 30–100), increase **Show every N-th bar** (2–6), or disable **Draw Guide Lines**.
**4) Dashboard values don’t “match” the grid exactly?**
Dashboard is multi-TF via `request.security` and follows the history logic per TF. Differences are normal.
---
# Short “Store” Marketing Blurb
Intrabar Volume Delta Grid reveals the order-flow inside every candle (Up/Down, Δ, UpShare%) — live and on history. With smart history splitting, an MTF dashboard, contextual emphasis, and flexible alerts, it helps you spot momentum and bias across Crypto, Forex (tick volume), and Stocks. Tidy labels and compact numbers keep the panel readable and fast.

Weekly pecentage tracker by PRIVATE
Settings Picture below this link: 👇
i.ibb.co
What it is
A lightweight “Weekly % Tracker” overlay that lets you manually enter weekly performance (in percent) for XAUUSD + up to 10 FX pairs, then shows:
a small table panel with each enabled symbol and its % result
one TOTAL row (Sum / Average / Compounded across all enabled symbols)
an optional mini badge showing the % for a single selected symbol
Nothing is auto-calculated from price—you type the % yourself.
Key settings
Panel: show/hide, position, number of decimals, colors (background, text, green/red).
Total mode:
Sum – adds percentages
Average – mean of enabled rows
Compounded –
(
∏
(
1
+
𝑝
/
100
)
−
1
)
×
100
(∏(1+p/100)−1)×100
Symbols:
XAUUSD (toggle + label + % input)
10 FX pairs (each has On/Off, label text, % input). You can rename labels to any symbol text you want.
Mini badge: show/hide, position, and symbol to display.
How it works
Overlay indicator: overlay=true; just draws UI on the chart (no plots).
Arrays (syms, vals, ons) collect the row data in order: XAU first, then FX1…FX10.
Helpers:
posFrom() converts a position string (e.g., “Top Right”) into a position.* constant.
wp_col() picks green/red/neutral based on the sign of the %.
wp_round() rounds values to the selected decimals.
calc_total() computes the TOTAL with the chosen mode over enabled rows only.
Table creation logic:
Counts how many rows are enabled.
If none enabled or panel is off: the panel table is deleted, so no box/background is visible.
If enabled and on: the panel is (re)created at the chosen position.
On each last bar (barstate.islast), it clears the table to transparent (bgcolor=na) and then fills one row per enabled symbol, followed by a single TOTAL row.
Mini badge:
Always (re)created on position change.
Shows selected symbol’s % (or “-” if that symbol isn’t enabled or has no value).
Colors text green/red by sign.
Notes & limits
It’s manual input—the script doesn’t read trades or P/L from price.
You can rename each row’s label to match any symbol name you want.
When no rows are enabled, the panel disappears entirely (no empty background).
Designed to be light: only draws tables; no heavy plotting.
If you want the TOTAL row to be optional, or different color thresholds, or CSV-style export/import of the values, say the word and I’ll add it.

Custom Volume + Buyer & Price %Title: Custom Volume + Buyer & Price %
Description:
This indicator helps you see who is controlling the market — buyers or sellers — using volume and price action. It works even if your chart is on a small timeframe (like 5-min or 15-min), by showing Daily, Weekly, and Monthly information from the higher timeframe volume charts.
Key Features & How It Works:
Buyer % (B%):
Measures where the closing price is within the high-low range of a candle.
Calculation:
\text{Buyer %} = \frac{\text{Close} - \text{Low}}{\text{High} - \text{Low}} \times 100
Interpretation:
> 50% → Buyers are stronger
< 50% → Sellers are stronger
50% → Balanced
Volume Coloring:
Volume bars are colored based on Buyer %, not price movement:
Green → Buyers dominate
Red → Sellers dominate
Yellow → Balanced day
Higher Timeframe Insight:
Displays Daily, Weekly, and Monthly volume & Buyer % even if your chart is on a smaller timeframe.
Lets you understand long-term buying or selling pressure while trading intraday.
21-Day Average:
Shows average Buyer % and average volume over the past 21 days for trend context.
Why It’s Useful:
Quickly visualize whether the market is buyer-driven or seller-driven.
Identify strong accumulation or distribution days.
Works on any chart timeframe while giving higher timeframe perspective.
Ideal for traders who want easy, visual insight into market sentiment.

FluidFlow OscillatorFluidFlow Oscillator: Study Material for Traders
Overview
The FluidFlow Oscillator is a custom technical indicator designed to measure price momentum and market flow dynamics by simulating fluid motion concepts such as velocity, viscosity, and turbulence. It helps traders identify potential buy and sell signals along with trend strength, momentum direction, and volatility conditions.
This study explains the underlying calculation concepts, signal logic, visual cues, and how to interpret the professional dashboard table that summarizes key indicator readings.
________________________________________
How the FluidFlow Oscillator Works
Core Mechanisms
1. Price Flow Velocity
o Measures the rate of change of price over a specified flow length (default 40 bars).
o Calculated as a percentage change of closing price: roc=close−closelen_flowcloselen_flow×100\text{roc} = \frac{\text{close} - \text{close}_{len\_flow}}{\text{close}_{len\_flow}} \times 100roc=closelen_flowclose−closelen_flow×100
o Smoothed by an EMA (Exponential Moving Average) to reduce noise, generating a "flow velocity" value.
2. Viscosity Factor
o Analogous to fluid viscosity, it adjusts the flow velocity based on recent price volatility.
o Volatility is computed as the standard deviation of close prices over the flow length.
o The viscosity acts as a damping factor to slow down the flow velocity in highly volatile conditions.
o This results in a "flow with viscosity" value, that smooths out the velocity considering market turbulence.
3. Turbulence Burst
o Captures sudden changes or bursts in the flow by measuring changes between successive viscosity-adjusted flows.
o The turbulence value is a smoothed absolute change in flow.
o A burst boost factor is added to the oscillator to incorporate this rapid change component, amplifying signals during sudden shifts.
4. Oscillator Calculation
o The raw oscillator value is the sum of flow with viscosity plus burst boost, scaled by 10.
o Clamped between -100 and +100 to limit extremes.
o Finally, smoothed again by EMA for cleaner visualization.
________________________________________
Signal Logic
The oscillator works with complementary components to produce actionable signals:
• Signal Line: An EMA-smoothed version of the oscillator for generating crossover-based signals.
• Momentum: The rate of change of the oscillator itself, smoothed by EMA.
• Trend: Uses fast (21-period EMA) and slow (50-period EMA) moving averages of price to identify market trend direction (uptrend, downtrend, or sideways).
Signal Conditions
• Bullish Signal (Buy): Oscillator crosses above the oversold threshold with positive momentum.
• Bearish Signal (Sell): Oscillator crosses below the overbought threshold with negative momentum.
Statuses
The oscillator provides descriptive market states based on level and momentum:
• Overbought
• Oversold
• Buy Signal
• Sell Signal
• Bullish / Bearish (momentum-driven)
• Neutral (no clear trend)
________________________________________
Color System and Visualization
The oscillator uses a sophisticated HSV color model adapting hues according to:
• Oscillator value magnitude and sign (positive or negative)
• Acceleration of oscillator changes
• Smooth color gradients to facilitate intuitive understanding of trend strength and momentum shifts
Background colors highlight overbought (red tint) and oversold (green tint) zones with transparency.
________________________________________
How to Understand the Professional Dashboard Table
The FluidFlow Oscillator offers an integrated table at the bottom center of the chart. This dashboard summarizes critical indicator readings in 8 columns across 3 rows:
Column Description
SIGNAL Current signal status (e.g., Buy, Sell, Overbought) with color coding
OSCILLATOR Current oscillator value (-100 to +100) with color reflecting intensity and direction
MOMENTUM Momentum bias indicating strength/direction of oscillator changes (Strong Up, Up, Sideways, Down, Strong Down)
TREND Current trend status based on EMAs (Strong Uptrend, Uptrend, Sideways, Downtrend, Strong Downtrend)
VOLATILITY Volatility percentage relative to average, indicating market activity level
FLOW Flow velocity value describing price momentum magnitude and direction
TURBULENCE Turbulence level indicating sudden bursts or spikes in price movement
PROGRESS Oscillator's position mapped as a percentage (0% to 100%) showing proximity to extreme levels
Rows Explained
• Row 1 (Header): Labels for each metric.
• Row 2 (Values): Current numerical or descriptive values color-coded along a professional scheme:
o Green or lime tones indicate positive or bullish conditions.
o Red or orange tones indicate caution, sell signals, or bearish conditions.
o Blue tones indicate neutral or stable conditions.
• Row 3 (Status Indicators): Emoji-like icons and bars provide a quick visual gauge of each metric's intensity or signal strength:
o For example, "🟢🟢🟢" suggests very strong bullish momentum, while "🔴🔴🔴" suggests strong bearish momentum.
o Progress bar visually demonstrates oscillator movement toward oversold or overbought extremes.
________________________________________
Practical Interpretation Tips
• A Buy signal with green colors and strong momentum usually precedes upward price moves.
• An Overbought status with red background and red table colors warns of potential price corrections or reversals.
• Watch the Turbulence to gauge market instability; spikes may precede price shocks or volatility bursts.
• Confirm signals with the Trend and Momentum columns to avoid false entries.
• Use the Progress bar to anticipate oscillations approaching key threshold levels for timing trades.
________________________________________
Alerts
The oscillator supports alerts for:
• Buy and sell signals based on oscillator crossovers.
• Overbought and oversold levels reached.
These help traders automate awareness of important market conditions.
________________________________________
Disclaimer
The FluidFlow Oscillator and its signals are for educational and informational purposes only. They do not guarantee profits and should not be considered as financial advice. Always conduct your own research and use proper risk management when trading. Past performance is not indicative of future results.
________________________________________
This detailed explanation should help you understand the workings of the FluidFlow Oscillator, its components, signal logic, and how to analyze its professional dashboard for informed trading decisions.

Advanced VWAP CalendarThe Advanced VWAP Calendar is a designed to plot Volume Weighted Average Price (VWAP) lines anchored to user-defined and preset time periods, including weekly, monthly, quarterly, and custom anchors. As of August 15, 2025, this indicator provides traders with a robust tool for analyzing price trends relative to volume-weighted averages, with clear labeling and extensive customization options. Below is a summary of its key features and functionality, with technical details and code references updated to focus on user-facing behavior and presentation, while preserving all other aspects of the original summary.
Key Features
Multiple Time Period VWAPs:
Weekly VWAPs: Supports up to five VWAPs for a user-selected month and year, starting at midnight each Monday (e.g., W1 Aug 2025, W2 Aug 2025). Enabled via a single toggle, with anchors automatically set to the first Monday of the chosen month.
Monthly VWAPs: Plots VWAPs for all 12 months of a selected year (e.g., Jan 2025, Feb 2025) or a single user-specified month/year. Labels use month abbreviations (e.g., "Aug 2025").
Quarterly VWAPs: Covers four quarters of a selected year (e.g., Q1 2025, Q2 2025), with options to enable all quarters or individual ones (Q1–Q4).
Legacy VWAPs: Provides monthly and quarterly VWAPs for a user-selected legacy year (e.g., 2024), labeled with a "Legacy" prefix (e.g., "Legacy Jan 2024," "Legacy Q1 2024"), with similar enablement options.
Custom VWAPs: Includes 10 fully customizable VWAPs, each with user-defined anchor times, labels (e.g., "Q1 2025"), colors, line widths (1–5), text colors, bubble styles, text sizes (8–40), and background options.
Clear and Dynamic Labeling:
Labels appear to the right of the chart, showing the VWAP value (e.g., "Q1 2025 123.45").
Weekly labels follow a "W# Month Year" format (e.g., "W1 Aug 2025").
Monthly labels use abbreviated months (e.g., "Aug 2025"), while quarterly labels use "Q# Year" (e.g., "Q3 2025").
Legacy labels include a "Legacy" prefix (e.g., "Legacy Q1 2024").
Labels support customizable text sizes (tiny to huge) and can be displayed with or without a background, with optional bubble styles.
Flexible Customization:
Each VWAP can be enabled or disabled independently, with user inputs for anchor times, labels, and visual properties.
Colors are predefined for weekly (red, orange, blue, green, purple), monthly (varied), quarterly (red, blue, green, yellow), and legacy VWAPs, but custom VWAPs allow any color selection.
Line widths and text sizes are adjustable, ensuring visual clarity and chart readability.
This indicator was a dual effort, code was heavily contributed in effort by AzDxB, major credit and THANKS goes to him www.tradingview.com
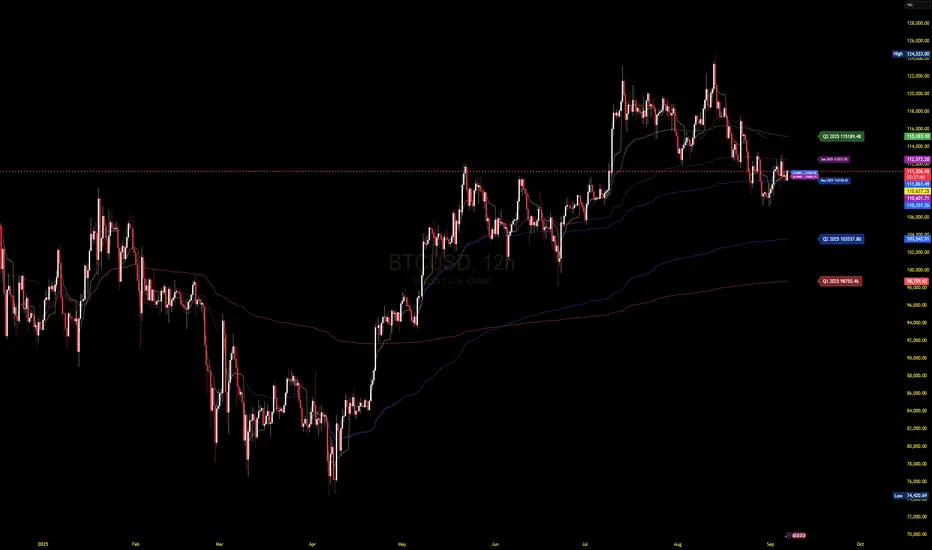
ATAI Triangles — Volume-Based & Price Pattern Analysis (v1.01)ATAI Triangles — Volume-Based & Price Pattern Analysis (v1.01)
Overview
ATAI Triangles identifies two synchronized triangle structures — Hi-Lo-Hi (HLH) and Lo-Hi-Lo (LHL) — and analyzes them both geometrically and volumetrically. For each triangle, volume is split between its two legs (segments), providing interpretable insights into buyer vs seller activity along each path.
The idea is that certain geometric shapes, when paired with volume distribution on each leg, can reveal patterns worth exploring. Users are encouraged to share their observations and interpretations in the TradingView comments section so that more aspects of these triangle combinations can be discovered collectively.
Extra (for fun)
For a bit of entertainment, we’ve included a symbolic “hexagram” glyph that appears when both triangle types align in a particular way — it’s just a visual nod to geometry and has no predictive or trading value.
Interface & data clarity
- Inputs and parameters are organized by function (pattern geometry, volume analysis, visuals, HUD, labels).
- Each input includes tooltips explaining its purpose, units, and possible effects on calculations.
- All on-chart objects (polylines, labels, connectors) are named and colored to reflect their role, with volume values formatted in engineering notation (K, M, B).
- HUD columns and label texts use concise terms and consistent units, so that every displayed value is directly traceable to a calculation in the code.
- Daily and lower-timeframe volume series are clearly separated, with update logic documented to indicate intrabar provisional values vs finalized bar-close values.
Usage notes
Designed to be used alongside other indicators and chart tools for context; it is not a standalone signal generator.
All Buy/Sell volumes are absolute (non-negative); Δ = Buy − Sell.
Intrabar values update live and finalize at bar close (no repaint after close).
Disclaimer
For research, discussion, and educational purposes only. This is not financial advice and does not guarantee any outcome. Trade at your own risk.
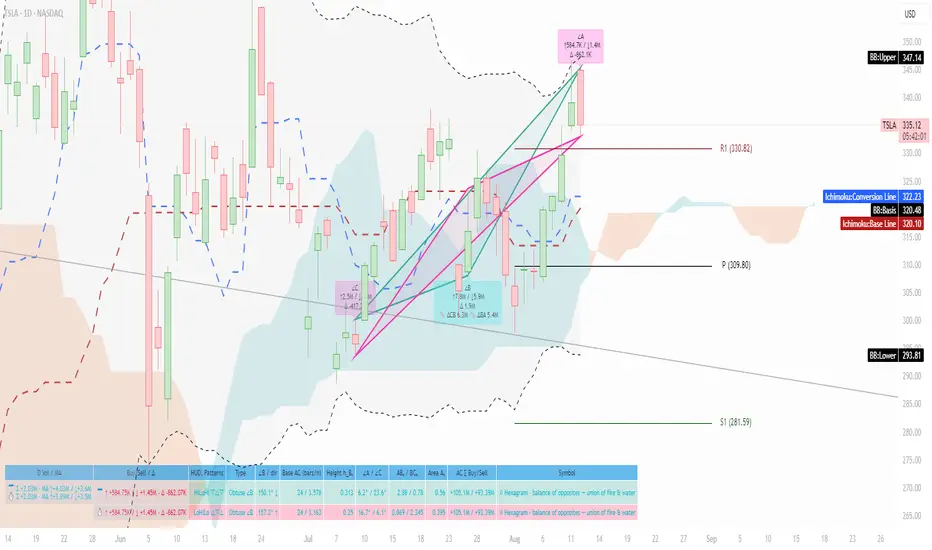
VWAP CALENDARThe VWAP CALENDAR indicator plots up to 20 anchored Volume-Weighted Average Price (VWAP) lines on your chart, each starting from a user-defined date and time (e.g., April 20, 2024). Designed for simplicity, it helps traders visualize VWAPs for key events or dates, with customizable labels and colors. The indicator is optimized for crypto markets (e.g., BTC/USD) but works with any symbol providing volume data.
Features: Multiple VWAPs: Configure up to 20
independent VWAPs, each with a custom anchor date and time.
Dynamic Labels: Labels update in real-time, aligning precisely with each VWAP line’s price level, positioned to the right of the chart for clarity.
Customizable Settings: Adjust label text (e.g., “Event A”), line colors, line widths (1–5 pixels), text colors, and text sizes (8–40 points, default 22).
Bubble or No-Background Labels: Choose between bubble-style labels (with colored backgrounds) or plain text labels without backgrounds.
Timeframe Support: Accurate on daily, 4-hour, 1-hour, and 30-minute charts for anchors within ~1.5 years (e.g., April 20, 2024, from August 2025).
Limitations: VWAP accuracy for anchors like April 20, 2024 (~477 days back) is reliable on 1-hour and larger timeframes. Below 30-minute (e.g., 15-minute, 24-minute), VWAPs may start later or be unavailable due to TradingView’s 5,000-bar historical data limit. For distant anchors, use 4-hour or daily charts to ensure accuracy.
Requires sufficient chart history (e.g., premium account or deep exchange data) for older anchors on 1-hour or 30-minute charts.
Usage Notes: Set anchor dates via the indicator settings (e.g., “2024-04-20 00:00”).
Enable/disable individual VWAPs as needed.
Zoom out to load maximum chart history for best results, especially on 1-hour or 30-minute timeframes.
Ideal for crypto symbols with continuous trading data, but verify data availability for other markets.
Disclaimer:
This is a free indicator provided as-is

VWAP CALENDARThe VWAP CALENDAR indicator plots up to 20 anchored Volume-Weighted Average Price (VWAP) lines on your chart, each starting from a user-defined date and time (e.g., April 20, 2024). Designed for simplicity, it helps traders visualize VWAPs for key events or dates, with customizable labels and colors. The indicator is optimized for crypto markets (e.g., BTC/USD) but works with any symbol providing volume data.
Features: Multiple VWAPs: Configure up to 20 independent VWAPs, each with a custom anchor date and time.
Dynamic Labels: Labels update in real-time, aligning precisely with each VWAP line’s price level, positioned to the right of the chart for clarity.
Customizable Settings: Adjust label text (e.g., “Event A”), line colors, line widths (1–5 pixels), text colors, and text sizes (8–40 points, default 22).
Bubble or No-Background Labels: Choose between bubble-style labels (with colored backgrounds) or plain text labels without backgrounds.
Timeframe Support: Accurate on daily, 4-hour, 1-hour, and 30-minute charts for anchors within ~1.5 years (e.g., April 20, 2024, from August 2025).
Limitations: VWAP accuracy for anchors like April 20, 2024 (~477 days back) is reliable on 1-hour and larger timeframes. Below 30-minute (e.g., 15-minute, 24-minute), VWAPs may start later or be unavailable due to TradingView’s 5,000-bar historical data limit. For distant anchors, use 4-hour or daily charts to ensure accuracy.
Requires sufficient chart history (e.g., premium account or deep exchange data) for older anchors on 1-hour or 30-minute charts.
Usage Notes: Set anchor dates via the indicator settings (e.g., “2024-04-20 00:00”).
Enable/disable individual VWAPs as needed.
Zoom out to load maximum chart history for best results, especially on 1-hour or 30-minute timeframes.
Ideal for crypto symbols with continuous trading data, but verify data availability for other markets.
Disclaimer:
This is a free indicator provided as-is.
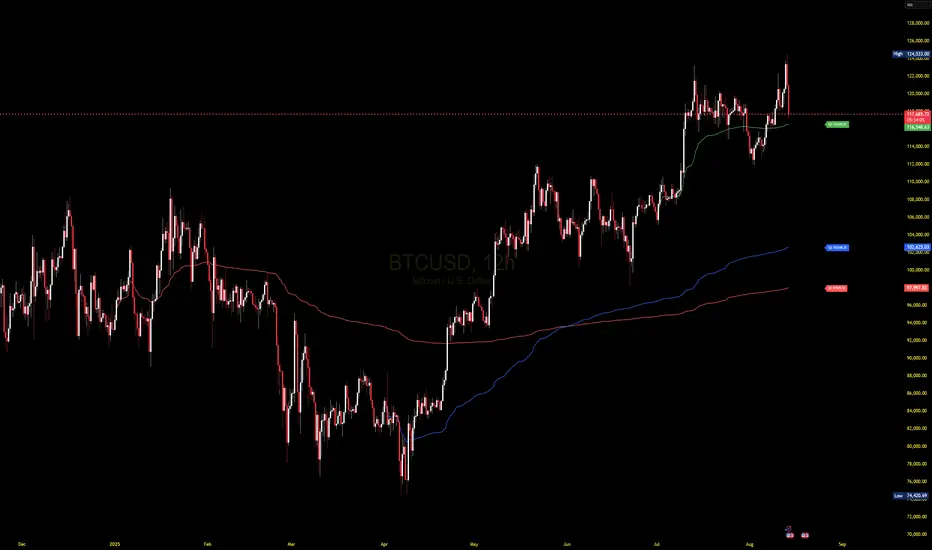
Multi SMA + Golden/Death + Heatmap + BB**Multi SMA (50/100/200) + Golden/Death + Candle Heatmap + BB**
A practical trend toolkit that blends classic 50/100/200 SMAs with clear crossover labels, special 🚀 Golden / 💀 Death Cross markers, and a readable candle heatmap based on a dynamic regression midline and volatility bands. Optional Bollinger Bands are included for context.
* See trend direction at a glance with SMAs.
* Get minimal, de-cluttered labels on important crosses (50↔100, 50↔200, 100↔200).
* Highlight big regime shifts with special Golden/Death tags.
* Read momentum and volatility with the candle heatmap.
* Add Bollinger Bands if you want classic mean-reversion context.
Designed to be lightweight, non-repainting on confirmed bars, and flexible across timeframes.
# What This Indicator Does (plain English)
* **Tracks trend** using **SMA 50/100/200** and lets you optionally compute each SMA on a higher or different timeframe (HTF-safe, no lookahead).
* **Prints labels** when SMAs cross each other (up or down). You can force signals only after bar close to avoid repaint.
* **Marks Golden/Death Crosses** (50 over/under 200) with special labels so major regime changes stand out.
* **Colors candles** with a **heatmap** built from a regression midline and volatility bands—greenish above, reddish below, with a smooth gradient.
* **Optionally shows Bollinger Bands** (basis SMA + stdev bands) and fills the area between them.
* **Includes alert conditions** for Golden and Death Cross so you can automate notifications.
---
# Settings — Simple Explanations
## Source
* **Source**: Price source used to calculate SMAs and Bollinger basis. Default: `close`.
## SMA 50
* **Show 50**: Turn the SMA(50) line on/off.
* **Length 50**: How many bars to average. Lower = faster but noisier.
* **Color 50** / **Width 50**: Visual style.
* **Timeframe 50**: Optional alternate timeframe for SMA(50). Leave empty to use the chart timeframe.
## SMA 100
* **Show 100**: Turn the SMA(100) line on/off.
* **Length 100**: Bars used for the mid-term trend.
* **Color 100** / **Width 100**: Visual style.
* **Timeframe 100**: Optional alternate timeframe for SMA(100).
## SMA 200
* **Show 200**: Turn the SMA(200) line on/off.
* **Length 200**: Bars used for the long-term trend.
* **Color 200** / **Width 200**: Visual style.
* **Timeframe 200**: Optional alternate timeframe for SMA(200).
## Signals (crossover labels)
* **Show crossover signals**: Prints triangle labels on SMA crosses (50↔100, 50↔200, 100↔200).
* **Wait for bar close (confirmed)**: If ON, signals only appear after the candle closes (reduces repaint).
* **Min bars between same-pair signals**: Minimum spacing to avoid duplicate labels from the same SMA pair too often.
* **Trend filter (buy: 50>100>200, sell: 50<100<200)**: Only show bullish labels when SMAs are stacked bullish (50 above 100 above 200), and only show bearish labels when stacked bearish.
### Label Offset
* **Offset mode**: Choose how to push labels away from price:
* **Percent**: Offset is a % of price.
* **ATR x**: Offset is ATR(14) × multiplier.
* **Percent of price (%)**: Used when mode = Percent.
* **ATR multiplier (for ‘ATR x’)**: Used when mode = ATR x.
### Label Colors
* **Bull color** / **Bear color**: Background of triangle labels.
* **Bull label text color** / **Bear label text color**: Text color inside the triangles.
## Golden / Death Cross
* **Show 🚀 Golden Cross (50↑200)**: Show a special “Golden” label when SMA50 crosses above SMA200.
* **Golden label color** / **Golden text color**: Styling for Golden label.
* **Show 💀 Death Cross (50↓200)**: Show a special “Death” label when SMA50 crosses below SMA200.
* **Death label color** / **Death text color**: Styling for Death label.
## Candle Heatmap
* **Enable heatmap candle colors**: Turns the heatmap on/off.
* **Length**: Lookback for the regression midline and volatility measure.
* **Deviation Multiplier**: Band width around the midline (bigger = wider).
* **Volatility basis**:
* **RMA Range** (smoothed high-low range)
* **Stdev** (standard deviation of close)
* **Upper/Middle/Lower color**: Gradient colors for the heatmap.
* **Heatmap transparency (0..100)**: 0 = solid, 100 = invisible.
* **Force override base candles**: Repaint base candles so heatmap stays visible even if your chart has custom coloring.
## Bollinger Bands (optional)
* **Show Bollinger Bands**: Toggle the overlay on/off.
* **Length**: Basis SMA length.
* **StdDev Multiplier**: Distance of bands from the basis in standard deviations.
* **Basis color** / **Band color**: Line colors for basis and bands.
* **Bands fill transparency**: Opacity of the fill between upper/lower bands.
---
# Features & How It Works
## 1) HTF-Safe SMAs
Each SMA can be calculated on the chart timeframe or a higher/different timeframe you choose. The script pulls HTF values **without lookahead** (non-repainting on confirmed bars).
## 2) Crossover Labels (Three Pairs)
* **50↔100**, **50↔200**, **100↔200**:
* **Triangle Up** label when the first SMA crosses **above** the second.
* **Triangle Down** label when it crosses **below**.
* Optional **Trend Filter** ensures only signals aligned with the overall stack (50>100>200 for bullish, 50<100<200 for bearish).
* **Debounce** spacing avoids repeated labels for the same pair too close together.
## 3) Golden / Death Cross Highlights
* **🚀 Golden Cross**: SMA50 crosses **above** SMA200 (often a longer-term bullish regime shift).
* **💀 Death Cross**: SMA50 crosses **below** SMA200 (often a longer-term bearish regime shift).
* Separate styling so they stand out from regular cross labels.
## 4) Candle Heatmap
* Builds a **regression midline** with **volatility bands**; colors candles by their position inside that channel.
* Smooth gradient: lower side → reddish, mid → yellowish, upper side → greenish.
* Helps you see momentum and “where price sits” relative to a dynamic channel.
## 5) Bollinger Bands (Optional)
* Classic **basis SMA** ± **StdDev** bands.
* Light visual context for mean-reversion and volatility expansion.
## 6) Alerts
* **Golden Cross**: `🚀 GOLDEN CROSS: SMA 50 crossed ABOVE SMA 200`
* **Death Cross**: `💀 DEATH CROSS: SMA 50 crossed BELOW SMA 200`
Add these to your alerts to get notified automatically.
---
# Tips & Notes
* For fewer false positives, keep **“Wait for bar close”** ON, especially on lower timeframes.
* Use the **Trend Filter** to align signals with the broader stack and cut noise.
* For HTF context, set **Timeframe 50/100/200** to higher frames (e.g., H1/H4/D) while you trade on a lower frame.
* Heatmap “Length” and “Deviation Multiplier” control smoothness and channel width—tune for your asset’s volatility.
