Composite Momentum IndicatorComposite Momentum Indicator" combines the signals from several oscillators, including Stochastic, RSI, Ultimate Oscillator, and Commodity Channel Index (CCI) by averaging the standardized values (Z-Scores). Since it is a Z-Score based indicators the values will be typically be bound between +3 and -3 oscillating around 0. Here's a summary of the code:
Input Parameters: Users can customize the look-back period and set threshold values for overbought and oversold conditions. They can also choose which oscillators to include in the composite calculation.
Oscillator Calculations: The code calculates four separate oscillators - Stochastic, RSI, Ultimate Oscillator, and CCI - each measuring different aspects of market momentum.
Z-Scores Calculation: For each oscillator, the code calculates a Z-Score, which normalizes the oscillator's values based on its historical standard deviation and mean. This allows for a consistent comparison of oscillator values across different timeframes.
Composite Z-Score: The code aggregates the Z-Scores from the selected oscillators, taking into account user preferences (whether to include each oscillator). It then calculates an average Z-Score to create the "Composite Momentum Oscillator."
Conditional Color Coding: The composite oscillator is color-coded based on its average Z-Score value. It turns green when it's above the overbought threshold, red when it's below the oversold threshold, and blue when it's within the specified range.
Horizontal Lines: The code plots horizontal lines at key levels, including 0, ±3, ±2, and ±1, to help users identify important momentum levels.
Gradient Fills: It adds gradient fills above the overbought threshold and below the oversold threshold to visually highlight extreme momentum conditions.
Combining the Stochastic, RSI, Ultimate Oscillator, and Commodity Channel Index (CCI) into one composite indicator offers several advantages for traders and technical analysts:
Comprehensive Insight: Each of these oscillators measures different aspects of market momentum and price action. Combining them into one indicator provides a more comprehensive view of the market's behavior, as it takes into account various dimensions of momentum simultaneously.
Reduced Noise: Standalone oscillators can generate conflicting signals and produce noisy readings, especially during choppy market conditions. A composite indicator smoothes out these discrepancies by averaging the signals from multiple indicators, potentially reducing false signals.
Confirmation and Divergence: By combining multiple oscillators, traders can seek confirmation or divergence signals. When multiple oscillators align in the same direction, it can strengthen a trading signal. Conversely, divergence between the oscillators can warn of potential reversals or weakening trends.
Customization: Traders can tailor the composite indicator to their specific trading strategies and preferences. They have the flexibility to include or exclude specific oscillators, adjust look-back periods, and set threshold levels. This adaptability allows for a more personalized approach to technical analysis.
Clarity and Efficiency: Rather than cluttering the chart with multiple individual oscillators, a composite indicator condenses the information into a single plot. This enhances the clarity of the chart and makes it easier for traders to quickly interpret market conditions.
Overbought/Oversold Identification: Combining these oscillators can improve the identification of overbought and oversold conditions. It reduces the likelihood of false signals since multiple indicators must align to trigger these extreme conditions.
Educational Tool: For novice traders and analysts, a composite indicator can serve as an educational tool by demonstrating how different oscillators interact and influence each other's signals. It allows users to learn about multiple technical indicators in one glance.
Efficient Use of Screen Space: A single composite indicator occupies less screen space compared to multiple separate indicators. This is especially beneficial when analyzing multiple markets or timeframes simultaneously.
Holistic Approach: Instead of relying on a single indicator, a composite approach encourages a more holistic assessment of market conditions. Traders can consider a broader range of factors before making trading decisions.
Increased Confidence: A composite indicator can boost traders' confidence in their decisions. When multiple reliable indicators align, it can provide a stronger basis for taking action in the market.
In summary, combining the Stochastic, RSI, Ultimate Oscillator, and CCI into one composite indicator enhances the depth and reliability of technical analysis. It simplifies the decision-making process, reduces noise, and offers a more complete picture of market momentum, ultimately helping traders make more informed and well-rounded trading decisions.
* Feel free to compare against individual oscillatiors*
스크립트에서 "technical"에 대해 찾기

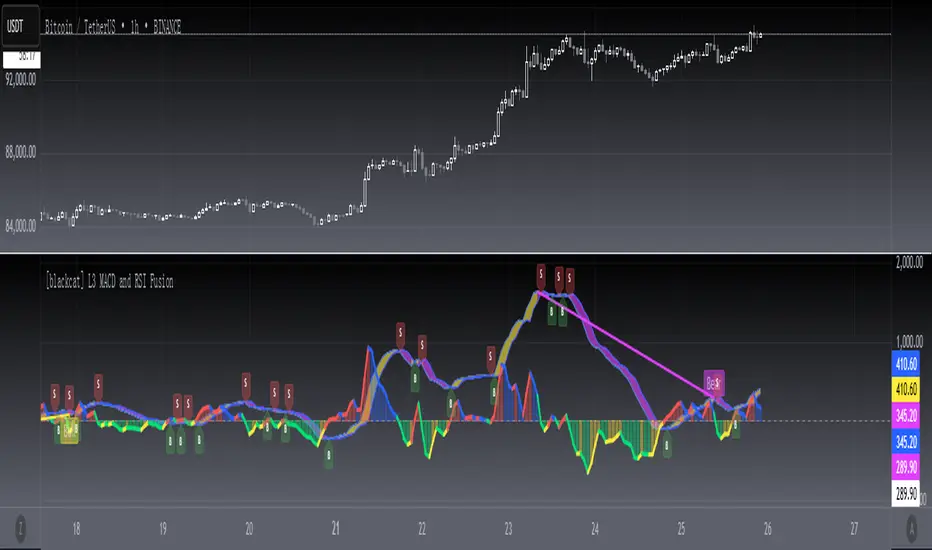
[blackcat] L3 MACD and RSI Fusion The MACD and RSI fusion is a popular technical analysis strategy used by traders to identify buy and sell signals in the market. The strategy makes use of two popular technical indicators, the Moving Average Convergence Divergence (MACD) and the Relative Strength Index (RSI), and combines them to create a powerful trading signal.
The MACD and RSI fusion was originally developed for the Chinese stock market and is commonly used by traders all over the world. The strategy is based on the idea that the MACD and RSI indicators can be used together to provide a more accurate and reliable signal.
To use the MACD and RSI fusion , traders need to follow a few simple steps. The following code is the TradingView Pine script v4 indicator equivalent of the original MACD and RSI fusion code:
```
//@version=4
study(" MACD and RSI fusion ", overlay=false)
// Define the simple fusion indicator
simple_fusion = (ema(close, 12) - ema(close, 26)) * 1.2 + rsi(close, 14) / 50
// Define the simple fusion lag indicator
simple_fusion_lag = nz(simple_fusion )
// Plot the simple fusion and simple fusion lag indicators
plot(simple_fusion, color=color.blue, title="simple fusion")
plot(simple_fusion_lag, color=color.red, title="simple fusion Lag")
```
This code defines the simple fusion and simple fusion Lag indicators and plots them on the chart. The simple fusion indicator is the sum of the 12- and 26-period exponential moving averages of the closing price, multiplied by 1.2, and added to the 14-period relative strength index of the closing price, divided by 50. The simple fusion Lag indicator is the value of the simple fusion indicator from the previous period.
Traders can use the simple fusion and simple fusion Lag indicators to identify buy and sell signals. When the simple fusion indicator crosses above the simple fusion Lag indicator, it is a buy signal, and when the simple fusion indicator crosses below the simple fusion Lag indicator, it is a sell signal.
In conclusion, the MACD and RSI fusion is a simple but powerful technical analysis strategy that combines two popular technical indicators to identify buy and sell signals in the market.
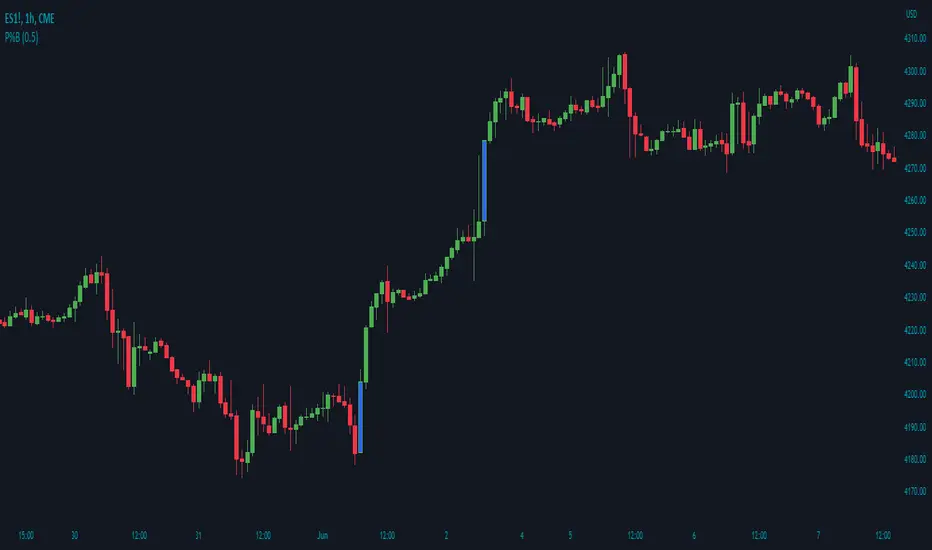
Adjustable Bull Bear Candle Indicator (V1.2)Indicator Description: Adjustable Bull Bear Candle Indicator
This indicator, named "Adjustable Bull Bear Candle Indicator ," is designed to assist traders in identifying potential bullish and bearish signals within price charts. It combines candlestick pattern analysis, moving average crossovers, and RSI (Relative Strength Index) conditions to offer insights into potential trading opportunities.
Disclaimer:
Trading involves substantial risk and is not suitable for every investor. This indicator is a tool designed to aid in technical analysis, but it does not guarantee successful trades. Always exercise your own judgment and seek professional advice before making any trading decisions.
Key Features:
Preceding Candles Analysis:
The indicator examines the behavior of the previous 'n' candles to identify specific patterns that indicate bearish or bullish momentum.
Candlestick Pattern and Momentum:
It considers the relationship between the opening and closing prices of the current candle to determine if it's bullish or bearish. The indicator then assesses the absolute price difference and compares it to the cumulative absolute differences of preceding candles.
Moving Averages:
The indicator calculates two Simple Moving Averages (SMAs) – Close SMA and Far SMA – to help identify trends and crossovers in price movement.
Relative Strength Index (RSI):
RSI is used as an additional measure to gauge momentum. It analyzes the current price's magnitude of recent gains and losses and compares it to past data.
Time Constraint:
If enabled, the indicator operates within a specific time window defined by the user. This feature can help traders focus on specific market hours.
Customizable Alerts:
The indicator includes an alert system that can be enabled or disabled. You can also adjust the specific alert conditions to align with your trading strategy.
How to Use:
This indicator generates buy signals when specific conditions are met, including a bullish candlestick pattern, positive price difference, closing price above the SMAs, RSI above a threshold, preceding bearish candles, and optionally within a specified time window. Conversely, short signals are generated under conditions opposite to those of the buy signal.
Disclosure and Risk Warning:
Educational Tool: This indicator is meant for educational purposes and to aid traders in their technical analysis. It's not a trading strategy in itself.
Risk of Loss: Trading carries inherent risks, including the potential for substantial loss. Always manage risk and consider using proper risk management techniques.
Diversification: Do not rely solely on this indicator. A well-rounded trading approach includes fundamental analysis, risk management, and proper diversification.
Consultation: It's strongly advised to consult with a financial professional before making any trading decisions.
Conclusion:
The "Bullish Candle after Bearish Candles with Momentum Indicator" can be a valuable tool in your technical analysis toolkit. However, successful trading requires a deep understanding of market dynamics, risk management, and continual learning. Use this indicator in conjunction with other tools and strategies to enhance your trading decisions.
Remember that past performance is not indicative of future results. Always be cautious and informed when participating in the financial markets.

Hybrid EMA AlgoLearner⭕️Innovative trading indicator that utilizes a k-NN-inspired algorithmic approach alongside traditional Exponential Moving Averages (EMAs) for more nuanced analysis. While the algorithm doesn't actually employ machine learning techniques, it mimics the logic of the k-Nearest Neighbors (k-NN) methodology. The script takes into account the closest 'k' distances between a short-term and long-term EMA to create a weighted short-term EMA. This combination of rule-based logic and EMA technicals offers traders a more sophisticated tool for market analysis.
⭕️Foundational EMAs: The script kicks off by generating a 50-period short-term EMA and a 200-period long-term EMA. These EMAs serve a dual purpose: they provide the basic trend-following capability familiar to most traders, akin to the classic EMA 50 and EMA 200, and set the stage for more intricate calculations to follow.
⭕️k-NN Integration: The indicator distinguishes itself by introducing k-NN (k-Nearest Neighbors) logic into the mix. This machine learning technique scans prior market data to find the closest 'neighbors' or distances between the two EMAs. The 'k' closest distances are then picked for further analysis, thus imbuing the indicator with an added layer of data-driven context.
⭕️Algorithmic Weighting: After the k closest distances are identified, they are utilized to compute a weighted EMA. Each of the k closest short-term EMA values is weighted by its associated distance. These weighted values are summed up and normalized by the sum of all chosen distances. The result is a weighted short-term EMA that packs more nuanced information than a simple EMA would.

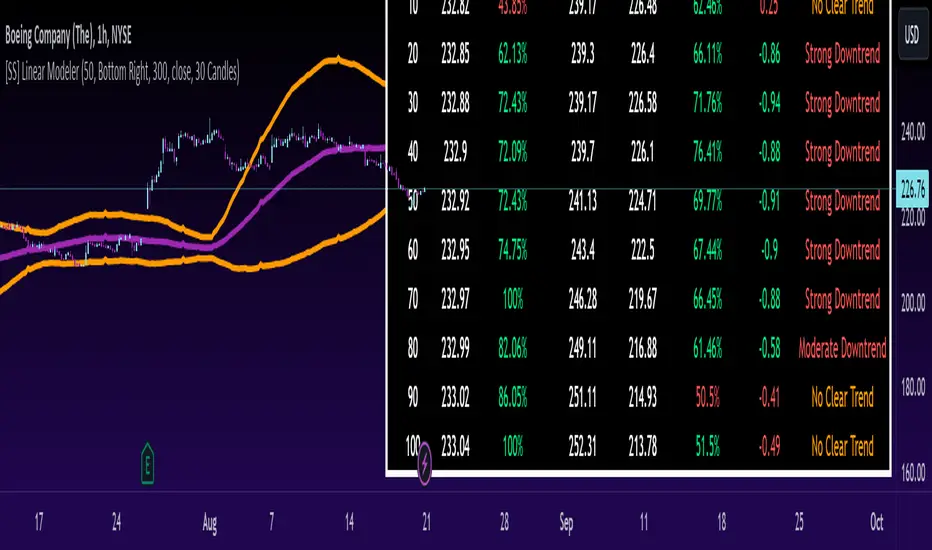
[SS] Linear ModelerHello everyone,
This is the linear modeler indicator.
It is a statistical based indicator that provides a likely price target and range based on a linear regression time series analysis.
To represent it visually, all the indicator does is it represents a linear regression channel and actually plots out the range at various points based on the current trend (see the chart below):
The indicator will perform the same assessment, but give you a working range and timeline for targets.
As well, the indicator will back-test the range and variables to see how it is performing and how reliable the results are likely to be.
General Functions:
In the chart above you can see all the various parameters and functions.
The indicator will display the most likely target (MLT) to be expected within the next pre-determined timeframe (by candles).
So for the first target, the indicator is saying within the next 10 candles, BA's MLT is 221.46 and based on BT results the reliability of this assessment is around 46%.
The indicator will also display the anticipated range at each designated timeframe.
In the chart above, we can see that at 20 candles, the likely range that BA should be trading in is 204 and 238 with a reliability of around 62% based on previous performance.
Plot Functions:
As this is performing a linear time series projection, you can have the indicator plot the projected ranges. Simply go to the settings menu and select the desired forecast length:
This will plot out the desired range and result over the specified time period. Here is an example of BA plotted over the next 50 candles on the hourly:
You can technically use this as an SMA/EMA type indicator, just keep in mind it may be a bit slower than a traditional EMA and SMA indicator, as it is processing a lot of data and plotting out forecasted data as opposed to an SMA or EMA.
If you wish to use it as an EMA or SMA, you can unselect the "Display Chart" Function to hide the table, and you can also select the "Plot Label" function. This will display the current projection analytics directly on your plotted line so you don't need to reference the table at all:
Tips on use:
I use this on the larger and smaller timeframes. On all timeframes, I will look to targets that display 90% to 100% in the BT results.
Bear in mind, this does not mean that we will 100% of the time hit this target, these targets can fail, it just means that there is a higher confidence of hitting this target than other, less reliable targets.
I will plot these targets out if they fall within the implied range of the timeframe I am looking at and will act on them according to the price action.
This is a great indicator to use in combination with other range based indicators. If you use the implied range from options to help guide your trading, you can see which targets are likely to be hit based on the current trend that fall within that implied range.
You can also assess the strength of the trends at various points in time and have an actionable range with a reliability reading at various points in time.
That is pretty much the bulk of the indicator.
Hopefully you find it helpful and useful.
As always, leave your questions and suggestions below.
Thanks for reading and checking it out!
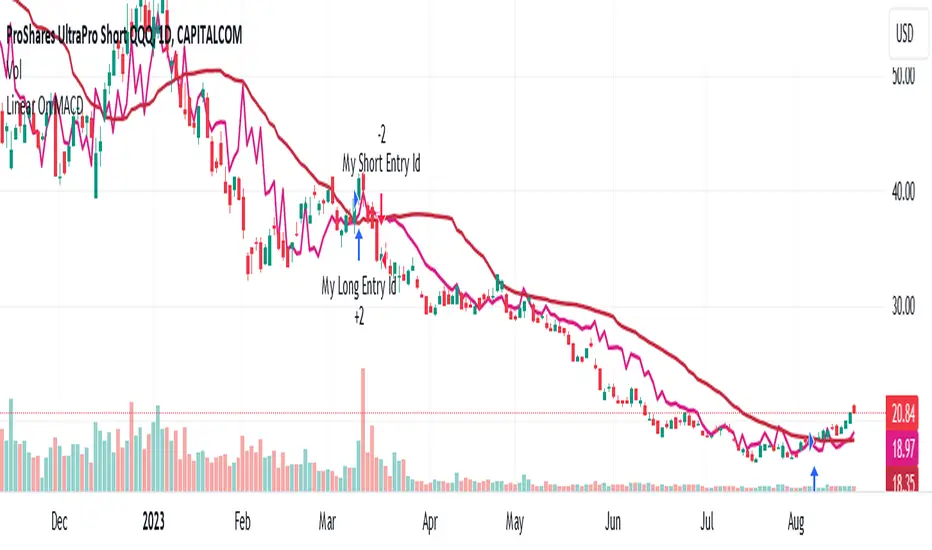
Linear On MACDUnlocking the Magic of Linear Regression in TradingView
In the ever-evolving world of financial markets, traders and investors seek effective tools to gauge price movements, make informed decisions, and achieve their financial goals. One such tool that has proven its worth over time is linear regression, a mathematical concept that has found its way into technical analysis and trading strategies. In this blog post, we will explore the magic behind linear regression, delve into its history, and understand how it's widely used as a technical indicator.
The Birth of Linear Regression: From Mathematics to Trading
Linear regression is a statistical method that aims to model the relationship between two variables by fitting a linear equation to observed data. The formula for a linear regression line is typically expressed as y = a + bx, where y is the dependent variable, x is the independent variable, a is the intercept, and b is the slope.
While the roots of linear regression trace back to the field of statistics, it didn't take long for traders and investors to recognize its potential in the financial world. By applying linear regression to historical price data, traders can identify trends, assess the relationship between variables, and even predict potential future price levels.
The Linear On MACD Strategy
Let's take a closer look at a powerful example of how linear regression is employed in a trading strategy right within TradingView. The "Linear On MACD" strategy harnesses the potential of linear regression in conjunction with the Moving Average Convergence Divergence (MACD) indicator. The goal of this strategy is to generate buy and sell signals based on the interactions between the predicted stock price and the MACD indicator.
Here's a breakdown of the strategy's components:
Calculation of Linear Regression: The strategy begins by calculating linear regression coefficients for the historical stock price based on volume. This helps predict potential future price levels.
Predicted Stock Price: The linear regression results are then used to plot the predicted stock price on the chart. This provides a visual representation of where the price could trend based on historical data.
Buy and Sell Signals: The strategy generates buy signals when certain conditions are met. These conditions include the predicted stock price being between the open and close prices, a rising MACD, and other factors that suggest a potential bullish trend. On the other hand, sell signals are generated based on MACD trends and predicted price levels.
Risk Management: The strategy also incorporates risk tolerance levels to determine entry and exit points. This ensures that traders take into account their risk appetite when making trading decisions.
Embracing the Magic of Linear Regression
As we explore the "Linear On MACD" strategy, we uncover the power of linear regression in aiding traders and investors. Linear regression, a mathematical marvel, seamlessly merges with technical analysis to provide insights into potential price movements. Its historical significance in statistics blends perfectly with the demands of modern financial markets.
Whether you're a seasoned trader or a curious investor, the Linear On MACD strategy exemplifies how a robust mathematical concept can be harnessed to make informed trading decisions. By embracing the magic of linear regression, you're tapping into a tool that continues to evolve alongside the financial world it empowers.
Disclaimer: The information provided in this blog post is for educational purposes only and does not constitute financial advice. Trading and investing carry risks, and it's important to conduct thorough research and consider seeking professional advice before making any trading decisions.
Trig-Log Scaled Momentum OscillatorTaylor Series Approximations for Trigonometry:
1. The indicator starts by calculating sine and cosine values of the close price using Taylor Series approximations. These approximations use polynomial terms to estimate the values of these trigonometric functions.
Mathematical Component Formation:
2. The calculated sine and cosine values are then multiplied together. This gives us the primary mathematical component, termed as the 'trigComponent'.
Smoothing Process:
3. To ensure that our indicator is less susceptible to market noise and more reactive to genuine price movements, this 'trigComponent' undergoes a smoothing process using a simple moving average (SMA). The length of this SMA is defined by the user.
Logarithmic Transformation:
4. With our smoothed value, we apply a natural logarithm approximation. Again, this approximation is based on the Taylor expansion. This step ensures that all resultant values are positive and offers a different scale to interpret the smoothed component.
Dynamic Scaling:
5. To make our indicator more readable and comparable over different periods, the logarithmically transformed values are scaled between a range. This range is determined by the highest and lowest values of the transformed component over the user-defined 'lookback' period.
ROC (Rate of Change) Direction:
6. The direction of change in our scaled value is determined. This offers a quick insight into whether our mathematical component is increasing or decreasing compared to the previous value.
Visualization:
7. Finally, the indicator plots the dynamically scaled and smoothed mathematical component on the chart. The color of the plotted line depends on its direction (increasing or decreasing) and its boundary values.

Filtered Volume Profile [ChartPrime]The "Filtered Volume Profile" is a powerful tool that offers insights into market activity. It's a technical analysis tool used to understand the behavior of financial markets. It uses a fixed range volume profile to provide a histogram representing how much volume occurred at distinct price levels.
Profile in action with various significant levels displayed
How to Use
The script is designed to analyze cumulative trading volumes in different price bins over a certain period, also known as `'lookback'`. This lookback period can be defined by the user and it represents the number of bars to look back for calculating levels of support and resistance.
The `'Smoothing'` input determines the degree to which the output is smoothed. Higher values lead to smoother results but may impede the responsiveness of the indicator to rapid changes in volatility.
The `'Peak Sensitivity'` input is used to adjust the sensitivity of the script's peak detection algorithm. Setting this to a lower value makes the algorithm more sensitive to local changes in trading volume and may result in "noisier" outputs.
The `'Peak Threshold'` input specifies the number of bins that the peak detection mechanism should account for. Larger numbers imply that more volume bins are taken into account, and the resultant peaks are based on wider intervals.
The `'Mean Score Length'` input is used for scaling the mean score range. This is particularly important in defining the length of lookback bars that will be used to calculate the average close price.
Sinc Filter
The application of the sinc-filter to the Filtered Volume Profile reduces the risk of viewing artefacts that may misrepresent the underlying market behavior. Sinc filtering is a high-quality and sharp filter that doesn't manifest any ringing effects, making it an optimal choice for such volume profiling.
Histogram
On the histogram, the volume profile is colored based on the balance of bullish to bearish volume. If a particular bar is more intense in color, it represents a larger than usual volume during a single price bar. This is a clear signal of a strong buying or selling pressure at a particular price level.
Threshold for Peaks
The `peak_thresh` input determines the number of bins the algorithm takes in account for the peak detection feature. The 'peak' represents the level where a significant amount of volume trading has occurred, and usually is of interest as an indicative of support or resistance level.
By increasing the `peak_thresh`, you're raising the bar for what the algorithm perceives as a peak. This could result in fewer, but more significant peaks being identified.
History of Volume Profiles and Evolution into Sinc Filtering
Volume profiling has a rich history in market analysis, dating back to the 1950s when Richard D. Wyckoff, a legendary trader, introduced the concept of volume studies. He understood the critical significance of volume and its relationship with market price movement. The core of Wyckoff's technical analysis suite was the relationship between prices and volume, often termed as "Effort vs Results".
Moving forward, in the early 1800s, the esteemed mathematician J. R. Carson made key improvements to the sinc function, which formed the basis for sinc filtering application in time series data. Following these contributions, trading studies continued to create and integrate more advanced statistical measures into market analysis.
This culminated in the 1980s with J. Peter Steidlmayer’s introduction of Market Profile. He suggested that markets were a function of continuous two-way auction processes thus introducing the concept of viewing markets in price/time continuum and price distribution forms. Steidlmayer's Market Profile was the first wide-scale operation of organized volume and price data.
However, despite the introduction of such features, challenges in the analysis persisted, especially due to noise that could misinform trading decisions. This gap has given rise to the need for smoothing functions to help eliminate the noise and better interpret the data. Among such techniques, the sinc filter has become widely recognized within the trading community.
The sinc filter, because of its properties of constructing a smooth passing through all data points precisely and its ability to eliminate high-frequency noise, has been considered a natural transition in the evolution of volume profile strategies. The superior ability of the sinc filter to reduce noise and shield against over-fitting makes it an ideal choice for smoothing purposes in trading scripts, particularly where volume profiling forms the crux of the market analysis strategy, such as in Filtered Volume Profile.
Moving ahead, the use of volume-based studies seems likely to remain a core part of technical analysis. As long as markets operate based on supply and demand principles, understanding volume will remain key to discerning the intent behind price movements. And with the incorporation of advanced methods like sinc filtering, the accuracy and insight provided by these methodologies will only improve.
Mean Score
The mean score in the Filtered Volume Profile script plays an important role in probabilistic inferences regarding future price direction. This score essentially characterizes the statistical likelihood of price trends based on historical data.
The mean score is calculated over a configurable `'Mean Score Length'`. This variable sets the window or the timeframe for calculation of the mean score of the closing prices.
Statistically, this score takes advantage of the concept of z-scores and probabilities associated with the t-distribution (a type of probability distribution that is symmetric and bell-shaped, just like the standard normal distribution, but has heavier tails).
The z-score represents how many standard deviations an element is from the mean. In this case, the "element" is the price level (Point of Control).
The mean score section of the script calculates standard errors for the root mean squared error (RMSE) and addresses the uncertainty in the prediction of the future value of a random variable.
The RMSE of a model prediction concerning observed values is used to measure the differences between values predicted by a model and the values observed.
The lower the RMSE, the better the model is able to predict. A zero RMSE means a perfect fit to the data. In essence, it's a measure of how concentrated the data is around the line of best fit.
Through the mean score, the script effectively predicts the likelihood of the future close price being above or below our identified price level.
Summary
Filtered Volume Profile is a comprehensive trading view indicator which utilizes volume profiling, peak detection, mean score computations, and sinc-filter smoothing, altogether providing the finer details of market behavior.
It offers a customizable look back period, smoothing options, and peak sensitivity setting along with a uniquely set peak threshold. The application of the Sinc Filter ensures a high level of accuracy and noise reduction in volume profiling, making this script a reliable tool for gaining market insights.
Furthermore, the use of mean score calculations provides probabilistic insights into price movements, thus providing traders with a statistically sound foundation for their trading decisions. As trading markets advance, the use of such methodologies plays a pivotal role in formulating effective trading strategies and the Filtered Volume Profile is a successful embodiment of such advancements in the field of market analysis.

SRTL, 2EMA & TRAMASRTL - Support Resistance and Trend Line with Double EMA and TRAMA
The SRTL indicator is a powerful tool for technical analysis that seamlessly integrates support and resistance levels, trend lines, and moving average signals. It offers traders a comprehensive view of the market's dynamics, making it a valuable addition to any trading toolkit. Here's a concise summary of its key features and functionalities:
Key Features:
- Dynamic Support and Resistance Levels based on Pivot Points
- Trend Lines based on Recent Pivot Points
- Double Exponential Moving Averages (EMA) with adjustable lengths
- Trend Regularity Adaptive Moving Average (TRAMA) for trend identification
- Buy and Sell signals based on the crossover of EMAs
The indicator is composed of 4 main components:
1. Support and resistance levels: The indicator calculates support and resistance levels based on pivot points and a channel width parameter. These levels can be used to identify potential entry and exit points for trades. The script calculates and plots dynamic support and resistance levels based on pivot points. Users can adjust the period for calculating pivot points, loopback period, and S/R strength to customize the levels' sensitivity.
2. Trend Lines: The script identifies and plots trend lines based on recent pivot points. Users can customize the number of pivot points to consider and the start date to begin plotting the trend lines. The script identifies and plots trend lines based on recent pivot points. By adjusting the number of pivot points to consider and the start date, traders can visualize potential trends and assess the market's overall direction. This feature helps traders understand the prevailing market sentiment and make informed trading decisions.
3. Double Exponential Moving Averages (EMA): The script calculates and plots two Exponential Moving Averages (EMA) with customizable lengths. A crossover of these EMAs can be used as a signal for potential trend changes. The study calculates and displays two Exponential Moving Averages (EMA) with adjustable lengths. The crossover of these EMAs serves as a crucial signal for potential trend changes. When the faster EMA crosses above the slower EMA, a "Buy" signal is generated, and when the faster EMA crosses below the slower EMA, a "Sell" signal is generated.
4. Trend Regularity Adaptive Moving Average (TRAMA): The script calculates and plots the TRAMA, a unique adaptive moving average that helps identify trends and adapt to market conditions. The indicator includes the Trend Regularity Adaptive Moving Average (TRAMA), an adaptive moving average designed to identify trends and adapt to varying market conditions. TRAMA helps traders gauge the strength of a trend and provides valuable insights into potential trend reversals.
5. Signals: The script generates "Buy - Green" and "Sell- Red" signals based on the crossover of the two EMAs and Pivot Point Trend Levels. That Also Customizable.
How to Use:
The SRTL indicator is a powerful tool for technical analysis, offering multiple layers of information for traders. When the price approaches dynamic support or resistance levels, The dynamic support and resistance levels are based on pivot points and adjust to the market's current conditions. The trend lines help visualize potential trends and can be adjusted to show different numbers of pivot points. Additionally, the Double EMA and TRAMA lines provide further insight into the market's momentum and potential reversals. Traders can assess the potential for trend reversals or breakouts. The trend lines help visualize the market's prevailing direction, and the crossover of the Double EMA signals potential entry and exit points.
Traders should use this study as part of a broader trading strategy and combine it with other technical indicators, fundamental analysis, and risk management techniques. Additionally, it's essential to test the indicator thoroughly in a demo or back testing environment before applying it to live trading to ensure its compatibility with individual trading styles and preferences.

Trend Analyser by Abdul KhaderThis indicator is designed to provide buy and sell signals based on a combination of technical analysis methods. It uses the Relative Strength Index (RSI), Moving Average Convergence Divergence (MACD), and Exponential Moving Averages (EMA) to generate signals. It also calculates Stop Loss (SL) and Take Profit (TP) levels based on the Average True Range (ATR).
Components:
RSI: An oscillator that measures the speed and change of price movements. RSI is used to identify overbought and oversold conditions. In this indicator, an RSI below 30 is considered oversold and an RSI above 70 is considered overbought.
MACD: A trend-following momentum indicator that shows the relationship between two moving averages of a security’s price. The MACD triggers technical signals when it crosses above (to buy) or below (to sell) its signal line.
EMA: These moving averages give more weight to recent prices and are used to identify short-term price trends. A crossover of a shorter period EMA (9 periods in this case) above a longer period EMA (21 periods in this case) generates a buy signal. Conversely, a crossover of the shorter EMA below the longer EMA generates a sell signal.
ATR: This is a market volatility indicator. The ATR is used to calculate Stop Loss and Take Profit levels. These levels are set at a distance from the entry price, equal to a certain multiplier (1.5 in this case) of the ATR.
How to Use:
Buy Signal: A green triangle below the price bar indicates a buy signal. This is generated when the following conditions are met:
The short-term EMA crosses above the long-term EMA
The RSI is below 30 (oversold condition)
The MACD line crosses above the signal line and is above zero
Sell Signal: A red triangle above the price bar indicates a sell signal. This is generated when the following conditions are met:
The short-term EMA crosses below the long-term EMA
The RSI is above 70 (overbought condition)
The MACD line crosses below the signal line and is below zero
Stop Loss and Take Profit: These levels are indicated by dashed lines. The stop loss for a long position is set below the entry price, while the take profit is set above. For a short position, the stop loss is set above the entry price and the take profit is set below.
Important Notes:
This indicator is designed for intraday trading and may not be suitable for longer-term trades.
Always use this indicator in conjunction with other aspects of technical and fundamental analysis. No indicator can provide accurate signals 100% of the time.
Always backtest this indicator with historical data before using it in live trading.
Risk management is crucial in trading. Never risk more than a small percentage of your trading capital on a single trade.
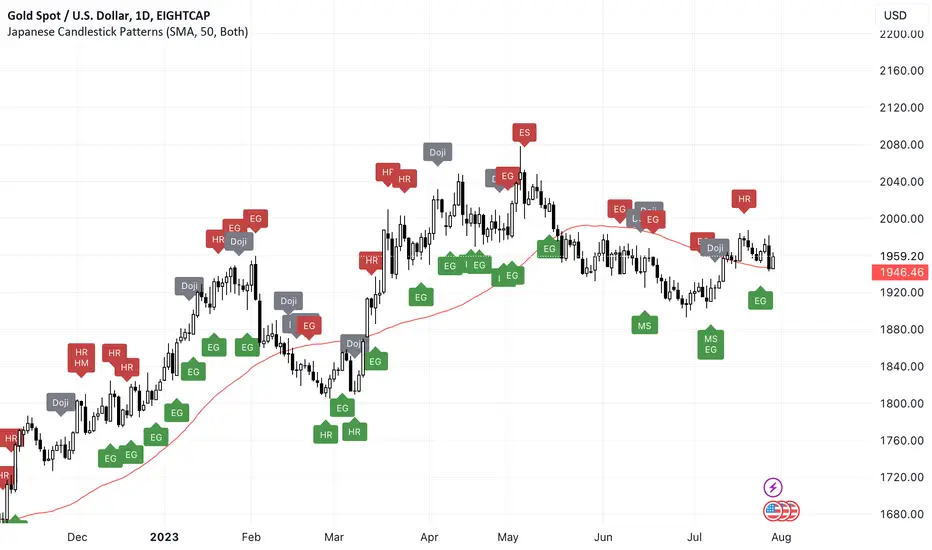
Japanese Candlestick Patterns💡 Japanese Candlesticks are a visual representation of price movements in financial markets. They were first developed by Japanese rice traders in the 18th century to analyze the price of rice contracts, and have since been adopted by traders across the world for a wide range of assets.
📌 A candlestick is composed of a rectangular body and two thin lines, known as wicks, that extend from the top and bottom of the body. The body represents the difference between the opening and closing prices of the asset during a specific time period, while the wicks indicate the high and low prices reached during that period.
📌 By using these and other candlestick patterns, traders can identify potential buying and selling opportunities and manage their risk accordingly. However, it's important to note that candlestick patterns should be used in conjunction with other technical and fundamental analysis tools to make well-informed trading decisions.
📌 Candlestick patterns are particularly useful because they are based on price action rather than external factors such as news or economic data. This makes them useful for traders who employ technical analysis, as they can use candlestick patterns to identify potential trading opportunities and manage their risk accordingly.
🚀 Candlesticks can be used to identify market trends, as well as potential buying and selling opportunities. By analyzing the patterns formed by multiple candlesticks, traders can gain insights into the behavior of the market and make informed trading decisions. Overall, Japanese Candlesticks are a powerful tool for technical analysis that can provide valuable insights into financial markets.
🔍 THE PATTERNS THAT ARE RECOGNIZED:
🔄 Reversal Patterns
* Counterattack Lines
* Dark-Cloud Cover
* Engulfing ( Bearish / Bullish )
* Hammer
* Hanging Man
* Harami ( Bearish / Bullish )
* In Neck
* On Neck
* Piercing
* Three Black Crows
* Thrusting
* Upside Gap Two Crows
⭐️ Stars
* Abandoned Baby
* Evening star
* Inverted Hammer
* Morning Star
* Shooting Star
🎯 Doji
* Doji
* Dragonfly Doji
* Evening Doji Star
* Gravestone Doji
* Long Legged Doji
* Morning Doji Star
🔥 Continuation Patterns
* Falling Three Methods
* Rising Three Methods
* Tasuki ( Upside / Downside )
🥊 Utility
* Long Lower Shadow
* Long Upper Shadow
❤️ Please, support the work with like & comment! ❤️
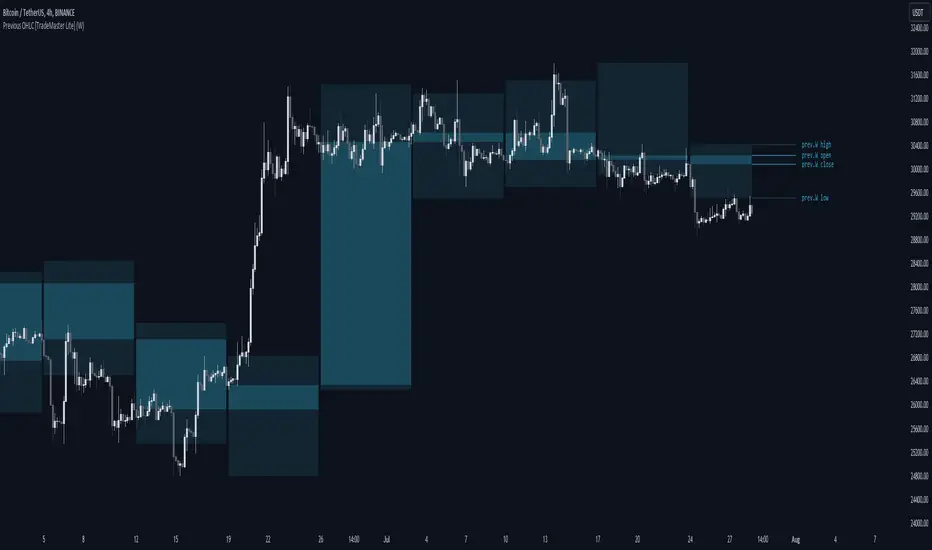
Previous OHLC Levels [TradeMaster Lite]In trading, the “Previous Open/High/Low/Close” (or previous OHLC) refers to the opening, high, low and closing price of the instrument in the previous period. These prices are typically used in technical analysis to identify trends and patterns and to make trading decisions. Some traders may also use the differences between the opening, high, low and closing prices to make trading decisions. For example, the difference between the closing and opening price (the so-called “true body”) and the high and low price (the so-called “upper shadow” and “lower shadow”) can indicate the strength of a trend, whether the bulls or bears are controlling the market, and can also give an idea of market volatility, and are also used as support and resistance levels.
Previous Open: shows the opening price of the previous period. It's the price at which the market first started trading in that period.
Previous High: represents the highest price reached during the previous period. It can act as a resistance level for the current period.
Previous Low: indicates the lowest price hit during the previous period. It can serve as a support level in the current period.
Previous Close: the last price at which the asset traded during the previous period. It's often considered the most accurate reflection of the market sentiment at the end of that period.
These values provide a summary of the previous trading period's price action, giving you a baseline for comparing current price movements. They can help in understanding the market's direction and identifying potential support and resistance levels. It is important to keep in mind that, like any other technical indicator, Previous OHLC does not give a definitive indication of future market direction and should be used in conjunction with other analytical tools, as well as fundamental analysis and market sentiment. It is also important to have appropriate risk management in place.
👉 General advice
Confirming Signals with other indicators:
As with all technical indicators, it is important to confirm potential signals with other analytical tools, such as support and resistance levels, as well as indicators like RSI, MACD, and volume. This helps increase the probability of a successful trade.
Use proper risk management:
When using this or any other indicator, it is crucial to have proper risk management in place. Consider implementing stop-loss levels and thoughtful position sizing.
Combining with other technical indicators:
The indicator can be effectively used alongside other technical indicators to create a comprehensive trading strategy and provide additional confirmation.
Keep in Mind:
Thorough research and backtesting are essential before making any trading decisions. Furthermore, it's crucial to have a solid understanding of the indicator and its behavior. Additionally, incorporating fundamental analysis and considering market sentiment can be vital factors to take into account in your trading approach.
Limitations:
This is a lagging indicator. Please note that the displayed values are delayed by the chosen timeframe on historical bars and show the values from the previous period on the current bar.
The indicators within the TradeMaster Lite package aim for simplicity and efficiency, while retaining their original purpose and value. Some settings, functions or visuals may be simpler than expected.
⭐ Conclusion
We hold the view that the true path to success is the synergy between the trader and the tool, contrary to the common belief that the tool itself is the sole determinant of profitability. The actual scenario is more nuanced than such an oversimplification. Our aim is to offer useful features that meet the needs of the 21st century and that we actually use.
🛑 Risk Notice:
Everything provided by trademasterindicator – from scripts, tools, and articles to educational materials – is intended solely for educational and informational purposes. Past performance does not assure future returns.
CCI+EMA Strategy with Percentage or ATR TP/SL [Alifer]This is a momentum strategy based on the Commodity Channel Index (CCI), with the aim of entering long trades in oversold conditions and short trades in overbought conditions.
Optionally, you can enable an Exponential Moving Average (EMA) to only allow trading in the direction of the larger trend. Please note that the strategy will not plot the EMA. If you want, for visual confirmation, you can add to the chart an Exponential Moving Average as a second indicator, with the same settings used in the strategy’s built-in EMA.
The strategy also allows you to set internal Stop Loss and Take Profit levels, with the option to choose between Percentage-based TP/SL or ATR-based TP/SL.
The strategy can be adapted to multiple assets and timeframes:
Pick an asset and a timeframe
Zoom back as far as possible to identify meaningful positive and negative peaks of the CCI
Set Overbought and Oversold at a rough average of the peaks you identified
Adjust TP/SL according to your risk management strategy
Like the strategy? Give it a boost!
Have any questions? Leave a comment or drop me a message.
CAUTIONARY WARNING
Please note that this is a complex trading strategy that involves several inputs and conditions. Before using it in live trading, it is highly recommended to thoroughly test it on historical data and use risk management techniques to safeguard your capital. After backtesting, it's also highly recommended to perform a first live test with a small amount. Additionally, it's essential to have a good understanding of the strategy's behavior and potential risks. Only risk what you can afford to lose .
USED INDICATORS
1 — COMMODITY CHANNEL INDEX (CCI)
The Commodity Channel Index (CCI) is a technical analysis indicator used to measure the momentum of an asset. It was developed by Donald Lambert and first published in Commodities magazine (now Futures) in 1980. Despite its name, the CCI can be used in any market and is not just for commodities. The CCI compares current price to average price over a specific time period. The indicator fluctuates above or below zero, moving into positive or negative territory. While most values, approximately 75%, fall between -100 and +100, about 25% of the values fall outside this range, indicating a lot of weakness or strength in the price movement.
The CCI was originally developed to spot long-term trend changes but has been adapted by traders for use on all markets or timeframes. Trading with multiple timeframes provides more buy or sell signals for active traders. Traders often use the CCI on the longer-term chart to establish the dominant trend and on the shorter-term chart to isolate pullbacks and generate trade signals.
CCI is calculated with the following formula:
(Typical Price - Simple Moving Average) / (0.015 x Mean Deviation)
Some trading strategies based on CCI can produce multiple false signals or losing trades when conditions turn choppy. Implementing a stop-loss strategy can help cap risk, and testing the CCI strategy for profitability on your market and timeframe is a worthy first step before initiating trades.
2 — AVERAGE TRUE RANGE (ATR)
The Average True Range (ATR) is a technical analysis indicator that measures market volatility by calculating the average range of price movements in a financial asset over a specific period of time. The ATR was developed by J. Welles Wilder Jr. and introduced in his book “New Concepts in Technical Trading Systems” in 1978.
The ATR is calculated by taking the average of the true range over a specified period. The true range is the greatest of the following:
The difference between the current high and the current low.
The difference between the previous close and the current high.
The difference between the previous close and the current low.
The ATR can be used to set stop-loss orders. One way to use ATR for stop-loss orders is to multiply the ATR by a factor (such as 2 or 3) and subtract it from the entry price for long positions or add it to the entry price for short positions. This can help traders set stop-loss orders that are more adaptive to market volatility.
3 — EXPONENTIAL MOVING AVERAGE (EMA)
The Exponential Moving Average (EMA) is a type of moving average (MA) that places a greater weight and significance on the most recent data points.
The EMA is calculated by taking the average of the true range over a specified period. The true range is the greatest of the following:
The difference between the current high and the current low.
The difference between the previous close and the current high.
The difference between the previous close and the current low.
The EMA can be used by traders to produce buy and sell signals based on crossovers and divergences from the historical average. Traders often use several different EMA lengths, such as 10-day, 50-day, and 200-day moving averages.
The formula for calculating EMA is as follows:
Compute the Simple Moving Average (SMA).
Calculate the multiplier for weighting the EMA.
Calculate the current EMA using the following formula:
EMA = Closing price x multiplier + EMA (previous day) x (1-multiplier)
STRATEGY EXPLANATION
1 — INPUTS AND PARAMETERS
The strategy uses the Commodity Channel Index (CCI) with additional options for an Exponential Moving Average (EMA), Take Profit (TP) and Stop Loss (SL).
length : The period length for the CCI calculation.
overbought : The overbought level for the CCI. When CCI crosses above this level, it may signal a potential short entry.
oversold : The oversold level for the CCI. When CCI crosses below this level, it may signal a potential long entry.
useEMA : A boolean input to enable or disable the use of Exponential Moving Average (EMA) as a filter for long and short entries.
emaLength : The period length for the EMA if it is used.
2 — CCI CALCULATION
The CCI indicator is calculated using the following formula:
(src - ma) / (0.015 * ta.dev(src, length))
src is the typical price (average of high, low, and close) and ma is the Simple Moving Average (SMA) of src over the specified length.
3 — EMA CALCULATION
If the useEMA option is enabled, an EMA is calculated with the given emaLength .
4 — TAKE PROFIT AND STOP LOSS METHODS
The strategy offers two methods for TP and SL calculations: percentage-based and ATR-based.
tpSlMethod_percentage : A boolean input to choose the percentage-based method.
tpSlMethod_atr : A boolean input to choose the ATR-based method.
5 — PERCENTAGE-BASED TP AND SL
If tpSlMethod_percentage is chosen, the strategy calculates the TP and SL levels based on a percentage of the average entry price.
tp_percentage : The percentage value for Take Profit.
sl_percentage : The percentage value for Stop Loss.
6 — ATR-BASED TP AND SL
If tpSlMethod_atr is chosen, the strategy calculates the TP and SL levels based on Average True Range (ATR).
atrLength : The period length for the ATR calculation.
atrMultiplier : A multiplier applied to the ATR to set the SL level.
riskRewardRatio : The risk-reward ratio used to calculate the TP level.
7 — ENTRY CONDITIONS
The strategy defines two conditions for entering long and short positions based on CCI and, optionally, EMA.
Long Entry: CCI crosses below the oversold level, and if useEMA is enabled, the closing price should be above the EMA.
Short Entry: CCI crosses above the overbought level, and if useEMA is enabled, the closing price should be below the EMA.
8 — TP AND SL LEVELS
The strategy calculates the TP and SL levels based on the chosen method and updates them dynamically.
For the percentage-based method, the TP and SL levels are calculated as a percentage of the average entry price.
For the ATR-based method, the TP and SL levels are calculated using the ATR value and the specified multipliers.
9 — EXIT CONDITIONS
The strategy defines exit conditions for both long and short positions.
If there is a long position, it will be closed either at TP or SL levels based on the chosen method.
If there is a short position, it will be closed either at TP or SL levels based on the chosen method.
Additionally, positions will be closed if CCI crosses back above oversold in long positions or below overbought in short positions.
10 — PLOTTING
The script plots the CCI line along with overbought and oversold levels as horizontal lines.
The CCI line is colored red when above the overbought level, green when below the oversold level, and white otherwise.
The shaded region between the overbought and oversold levels is plotted as well.

Volume ValueWhen VelocityTitle: Volume ValueWhen Velocity Trading Strategy
▶ Introduction:
The " Volume ValueWhen Velocity " trading strategy is designed to generate long position signals based on various technical conditions, including volume thresholds, RSI (Relative Strength Index), and price action relative to the Simple Moving Average (SMA). The strategy aims to identify potential buy opportunities when specific criteria are met, helping traders capitalize on potential bullish movements.
▶ How to use and conditions
★ Important : Only on Spot Binance BINANCE:BTCUSDT
Name: Volume ValueWhen Velocity
Operating mode: Long on Spot BINANCE BINANCE:BTCUSDT
Timeframe: Only one hour
Market: Crypto
currency: Bitcoin only
Signal type: Medium or short term
Entry: All sections in the Technical Indicators and Conditions section must be saved to enter (This is explained below)
Exit: Based on loss limit and profit limit It is removed in the settings section
Backtesting:
⁃ Exchange: BINANCE BINANCE:BTCUSDT
⁃ Pair: BTCUSDT
⁃ Timeframe:1h
⁃ Fee: 0.1%
- Initial Capital: 1,000 USDT
- Position sizing: 500 usdt
-Trading Range: 2022-07-01 11:30 ___ 2023-07-21 14:30
▶ Strategy Settings and Parameters:
1. `strategy(title='Volume ValueWhen Velocity', ...`: Sets the strategy title, initial capital, default quantity type, default quantity value, commission value, and trading currency.
↬ Stop-Loss and Take-Profit Settings:
1. long_stoploss_value and long_stoploss_percentage : Define the stop-loss percentage for long positions.
2. long_takeprofit_value and long_takeprofit_percentage : Define the take-profit percentage for long positions.
↬ ValueWhen Occurrence Parameters:
1. occurrence_ValueWhen_1 and occurrence_ValueWhen_2 : Control the occurrences of value events.
2. `distance_value`: Specifies the minimum distance between occurrences of ValueWhen 1 and ValueWhen 2.
↬ RSI Settings:
1. rsi_over_sold and rsi_length : Define the oversold level and RSI length for RSI calculations.
↬ Volume Thresholds:
1. volume_threshold1 , volume_threshold2 , and volume_threshold3 : Set the volume thresholds for multiple volume conditions.
↬ ATR (Average True Range) Settings:
1. atr_small and atr_big : Specify the periods used to calculate the Average True Range.
▶ Date Range for Back-Testing:
1. start_date, end_date, start_month, end_month, start_year, and end_year : Define the date range for back-testing the strategy.
▶ Technical Indicators and Conditions:
1. rsi: Calculates the Relative Strength Index (RSI) based on the defined RSI length and the closing prices.
2. was_over_sold: Checks if the RSI was oversold in the last 10 bars.
3. getVolume and getVolume2 : Custom functions to retrieve volume data for specific bars.
4. firstCandleColor : Evaluates the color of the first candle based on different timeframes.
5. sma : Calculates the Simple Moving Average (SMA) of the closing price over 13 periods.
6. numCandles : Counts the number of candles since the close price crossed above the SMA.
7. atr1 : Checks if the ATR_small is less than ATR_big for the specified security and timeframe.
8. prevClose, prevCloseBarsAgo, and prevCloseChange : ValueWhen functions to calculate the change in the close price between specific occurrences.
9. atrval: A condition based on the ATR_value3.
▶ Buy Signal Condition:
Condition: A combination of multiple volume conditions.
buy_signal: The final buy signal condition that considers various technical conditions and their interactions.
▶ Long Strategy Execution:
1. The strategy will enter a long position (buy) when the buy_signal condition is met and within the specified date range.
2. A stop-loss and take-profit will be set for the long position to manage risk and potential profits.
▶ Conclusion:
The " Volume ValueWhen Velocity " trading strategy is designed to identify long position opportunities based on a combination of volume conditions, RSI, and price action. The strategy aims to capitalize on potential bullish movements and utilizes a stop-loss and take-profit mechanism to manage risk and optimize potential returns. Traders can use this strategy as a starting point for their own trading systems or further customize it to suit their preferences and risk appetite. It is crucial to thoroughly back-test and validate any trading strategy before deploying it in live markets.
↯ Disclaimer:
Risk Management is crucial, so adjust stop loss to your comfort level. A tight stop loss can help minimise potential losses. Use at your own risk.
How you or we can improve? Source code is open so share your ideas!
Leave a comment and smash the boost button!

Daily SPY PlanThe Daily SPY Plan indicator is a technical analysis tool designed to provide traders with a visual representation of price levels and take profit points for the SPY (S&P 500 ETF) on a daily timeframe. This indicator utilizes the Average True Range (ATR) to calculate projected price levels and take profit points, aiding traders in identifying potential breakout and profit-taking opportunities.
Indicator Description:
The indicator is written in Pine Script, specifically for use on the TradingView platform. It plots several levels on the price chart, each representing a potential breakout or take profit point. The levels are determined based on a fraction of the ATR added or subtracted from the closing price. The fractions used are 0.25, 0.5, 0.75, 1.0, 1.25, and 1.5 times the ATR.
The indicator distinguishes between breakout levels and take profit levels using different colors. Breakout levels, which indicate potential entry or exit points, are displayed in green, while take profit levels are shown in gray.
Key Features and Use:
ATR Calculation: The indicator calculates the Average True Range (ATR) using a specified length (default value of 14). ATR is a measure of market volatility and represents the average range between the high and low prices over a specific period.
Projected Price Levels: The indicator plots several projected price levels above and below the closing price. These levels are calculated by adding or subtracting a fraction of the ATR from the closing price. Traders can use these levels as potential breakout points or areas to set stop-loss orders.
Take Profit Points: The indicator also plots take profit points at specific levels above and below the closing price. These levels are designed to help traders identify potential areas to secure profits or partially exit their positions.
Visual Representation: The indicator utilizes step-like lines to plot the projected price levels and take profit points, providing a clear visual representation on the price chart. Traders can easily identify the relevant levels and incorporate them into their trading strategies.
Customizability: The indicator allows traders to customize the ATR length and choose whether to display Fibonacci levels (although there are no Fibonacci calculations in the provided code). These customization options enable traders to adapt the indicator to their preferred trading style and timeframe.
Limitations and Considerations:
Complementary Analysis: The Daily SPY Plan indicator should be used as a complementary tool alongside other technical analysis techniques and indicators. It provides price levels and take profit points based on ATR calculations, but it doesn't incorporate additional market factors or trading strategies.
Timeframe Suitability: The indicator is specifically designed for the daily timeframe of the SPY. Traders should consider adjusting the parameters and adapting the indicator if using it on different timeframes or instruments.
Risk Management: While the indicator suggests potential breakout and take profit points, it does not provide explicit stop-loss levels or risk management parameters. Traders should incorporate appropriate risk management techniques to protect their capital.
Conclusion:
The Daily SPY Plan indicator is a valuable technical analysis tool for traders focusing on the SPY ETF and the daily timeframe. By utilizing the ATR, it helps traders identify potential breakout levels and take profit points. However, traders should remember that this indicator is just one piece of the puzzle and should be used in conjunction with other technical analysis tools and risk management strategies to make informed trading decisions.

Heikin Ashi ROC Percentile Strategy**User Guide for the "Heikin Ashi ROC Percentile Strategy"**
This strategy, "Heikin Ashi ROC Percentile Strategy", is designed to provide an easy-to-use framework for trading based on the Heikin Ashi Rate of Change (ROC) and its percentiles.
Here's how you can use it:
1. **Setting the Start Date**: You can set the start date for the strategy in the user inputs at the top of the script. The variable `startDate` defines the point from which the script begins executing trades. Simply input the desired date in the format "YYYY MM DD". For example, to start the strategy from March 3, 2023, you would enter `startDate = timestamp("2023 03 03")`.
2. **Adjusting the Midline, Lookback Period, and Stop Loss Level**: The `zerohLine`, `rocLength`, and `stopLossLevel` inputs allow you to adjust the baseline for ROC, the lookback period for the SMA and ROC, and the level at which the strategy stops the loss, respectively. By tweaking these parameters, you can fine-tune the strategy to better suit your trading style or the particular characteristics of the asset you are trading.
3. **Understanding the Trade Conditions**: The script defines conditions for entering and exiting long and short positions based on crossovers and crossunders of the ROC and the upper and lower "kill lines". These lines are defined as certain percentiles of the ROC's highest and lowest values over a specified lookback period. When the ROC crosses above the lower kill line, the script enters a long position; when it crosses below the upper kill line, it exits the position. Similarly, when the ROC crosses below the upper kill line, the script enters a short position; when it crosses above the lower kill line, it exits the position.
In my testing, this strategy performed best on a day and hour basis. However, I encourage you to experiment with different timeframes and settings to see how the strategy performs under various conditions. Remember, there's no one-size-fits-all approach to trading; what works best will depend on your specific circumstances, goals, and risk tolerance.
If you find other useful applications for this strategy, please let me know in the comments. Your feedback is invaluable in helping to refine and improve this tool. Happy trading!
Normalized Volume Rate of ChangeThis indicator is designed to help traders gauge changes in volume dynamics and identify potential shifts in buying or selling pressure. By normalizing the volume rate of change and comparing it to moving averages of itself, it offers valuable insights into market trends and can assist in making informed trading decisions.
Calculation:
The indicator calculates the Volume Rate of Change (VROC) by measuring the percentage change in volume over a specified length. This calculation provides a relative measure of how quickly the volume is increasing or decreasing. It then normalizes the VROC to a range of -1 to +1 by scaling it based on the highest and lowest values observed within the specified length. This normalization allows for easy comparison of the current VROC value with historical levels, enabling traders to assess the intensity of volume fluctuations.
Interpretation:
The main plot of the indicator displays the normalized VROC values as columns. The color of each column provides valuable information about the relationship between the VROC and the moving averages. Lime-colored columns indicate that the VROC is above both moving averages, suggesting increased buying pressure and potential bullish sentiment. Conversely, fuchsia-colored columns indicate that the VROC is below both moving averages, suggesting increased selling pressure and potential bearish sentiment. Yellow-colored columns indicate that the VROC is between the two moving averages, reflecting a period of consolidation or indecision in the market.
To further enhance interpretation, the indicator includes two moving averages. The Aqua line represents the faster moving average (MA1), and the Orange line represents the slower moving average (MA2). These moving averages provide additional context by smoothing out the VROC values and highlighting the overall trend. Traders can observe the interaction between the moving averages and the VROC to identify potential crossovers and assess the strength of trend reversals or continuations.
Colors:
-- Lime : The lime color is used to represent high volume rate of change above both moving averages. This color indicates a potentially bullish market sentiment, suggesting that buyers are dominant.
-- Fuchsia : The fuchsia color is used to represent low volume rate of change below both moving averages. This color indicates a potentially bearish market sentiment, suggesting that sellers are dominant.
-- Yellow : The yellow color is used to represent the volume rate of change between the two moving averages. This color reflects a transitional phase where neither buyers nor sellers have a clear advantage, signaling a period of consolidation or indecision in the market.
To provide additional visual cues for potential trade signals, the indicator includes lime-colored arrows below the price chart when there is a crossover upwards (MA1 crossing above MA2). This lime arrow indicates a potential bullish signal, suggesting a favorable time to consider long positions. Similarly, fuchsia-colored arrows are displayed above the price chart when there is a crossover downwards (MA1 crossing below MA2), signaling a potential bearish signal and suggesting a favorable time to consider short positions.
Applications:
This indicator offers various applications in trading strategies, including:
-- Trend Identification : By observing the relationship between the normalized VROC and the moving averages, traders can identify potential shifts in market trends. Lime-colored columns above both moving averages indicate a strong bullish trend, suggesting an opportunity to capitalize on upward price movements. Conversely, fuchsia-colored columns below both moving averages indicate a strong bearish trend, suggesting an opportunity to profit from downward price movements. Yellow-colored columns between the moving averages indicate a period of consolidation or uncertainty, signaling a potential trend reversal or continuation.
-- Confirmation of Price Moves : The indicator's ability to reflect volume dynamics in relation to the moving averages can help traders validate price moves. When significant price movements are accompanied by lime-colored columns (indicating high volume rate of change above both moving averages), it adds confirmation to the bullish sentiment. Similarly, fuchsia-colored columns accompanying downward price movements validate the bearish sentiment. This confirmation can enhance traders' confidence in the reliability of price moves.
-- Trade Timing : The indicator's moving average crossovers and the presence of arrows provide timing signals for trade entries and exits. Lime arrows appearing below the price chart signal potential long entry opportunities, indicating a bullish market sentiment. Conversely, fuchsia arrows appearing above the price chart suggest potential short entry opportunities, indicating a bearish market sentiment. These signals can be used in conjunction with other technical analysis tools to improve trade timing and increase the probability of successful trades.
Parameter Adjustments:
Traders can adjust the length of the VROC and the moving averages according to their trading preferences and timeframes. Longer VROC lengths provide a broader view of volume dynamics over an extended period, making it suitable for assessing long-term trends. Shorter VROC lengths offer a more sensitive measure of recent volume changes, making it suitable for shorter-term analysis. Similarly, adjusting the lengths of the moving averages can help adapt the indicator to different market conditions and trading styles.
Limitations:
While the indicator provides valuable insights, it has some limitations that traders should be aware of:
-- False Signals : Like any technical indicator, false signals can occur. During periods of low liquidity or in choppy markets, the indicator may generate misleading signals. It is essential to consider other indicators, price action, and fundamental analysis to confirm the signals before taking any trading actions.
-- Lagging Nature : Moving averages inherently lag behind the price action and volume changes. As a result, there may be a delay in the generation of signals and capturing trend reversals. Traders should exercise patience and avoid solely relying on this indicator for immediate trade decisions. Combining it with other indicators and tools can provide a more comprehensive picture of market conditions.
In conclusion, this indicator offers valuable insights into volume dynamics and trend analysis. By comparing the normalized VROC with moving averages, traders can identify shifts in buying or selling pressure, validate price moves, and improve trade timing. However, it is important to consider its limitations and use it in conjunction with other technical analysis tools to form a well-rounded trading strategy. Additionally, thorough testing, experimentation, and customization of the indicator's parameters are recommended to align it with individual trading preferences and market conditions.

Reversal Signals [LuxAlgo]The Reversal Signals indicator is a technical analysis tool that aims to identify when a trend is fading and potentially starting to reverse.
As a counter-trend tool, the Reversal Signals indicator aims to solve the problem of several technical analysis indicators that perform well during trending markets but struggle in ranging markets. By understanding the key concepts and applications of the tool, traders can enhance their market timing and improve their trading strategies.
Note: It's important to explore the settings of the indicator to customize to your own usage & display as there are various options available as covered below.
🔶 USAGE
The Reversal Signals indicator is comprised of two main phases: Momentum Phase and Trend Exhaustion Phase . These phases help identify potential trend reversals in bullish, bearish, and ranging markets.
🔹The Momentum Phase
The momentum phase consists of a 9-candle count and in rare cases 8-candle count. In a bullish trend, a starting number ‘1’ is plotted if a candle closes higher than the close of a candle four periods ago. In a bearish trend, a starting number ‘1’ is plotted if a candle closes lower than the close of a candle four periods ago.
The following numbers are plotted when each successive candle satisfies the four-period rule. The potential reversal point comes when the Reversal Signals plot a label on top of a candle in a bullish trend or at the bottom of a candle in a bearish trend. The momentum phase is immediately canceled if, at any point, a candle fails to satisfy the four-period rule.
Based on the extremes of the momentum phase, the Reversal Signals generate support & resistance levels as well as risk/stop levels.
🔹 The Trend Exhaustion Phase
The trend exhaustion phase starts after completing the momentum phase and consists of a 13-candle count. In a bullish trend exhaustion phase, each candle’s close is compared to the close of two candles earlier, and the close must be greater than the close two periods earlier. In a bearish trend exhaustion phase, each candle’s close is compared to the close of two candles earlier, and the close must be lower than the close two periods earlier.
The trend exhaustion phase does not require a consecutive sequence of candles; if the order of candles is interrupted, the trend exhaustion phase is not canceled. The trend exhaustion phase generates stronger trading signals than the momentum phase, with the potential for longer-lasting price reversals.
🔹 Trading Signals
The Reversal Signals script presents an overall setup and some phase-specific trade setup options, where probable trades might be considered. All phase-specific trade setups, presented as options, are triggered once the selected phase is completed and followed by a price flip in the direction of the trade setup.
Please note that those setups are presented for educational purposes only and do not constitutes professional and/or financial advice
- Momentum: Enter a trade at momentum phase completion, and search for buy (sell) when the bullish (bearish) momentum phase pattern is complete. Ideally, the momentum phase completion should close near its support/resistance line but shall not be above them, which indicates continuation of the trend
- Exhaustion: Enter a trade on trend exhaustion phase completion, and search for buy (sell) when the bullish (bearish) trend exhaustion phase is complete
- Qualified: Buy (sell) when a bullish (bearish) trend exhaustion phase combined with another bullish (bearish) momentum phase sequence is complete
Long trade setups are presented with "L" label and short trade setups with "S" label, where the content of the label displays details related to the probable trade opportunity
Once a phase-specific trade setup is triggered then the Reversal Signals script keeps checking the status of the price action relative to the phase-specific trade setups and in case something goes wrong presents a caution label. Pay attention to the content of the caution labels as well as where they appear. A trade signal, followed immediately by a warning indication can be assumed as a continuation of the underlying trend and can be traded in the opposite direction of the suggested signal
It is strongly advised to confirm trading setups in conjunction with other forms of technical and fundamental analysis, including technical indicators, chart/candlestick pattern analysis, etc.
🔶 DETAILS
The Reversal Signals script performs the detection of the phases by counting the candlestick meeting the specific conditions, which includes:
- Detection of the 8th and 9th candle perfection during the momentum phase
- In some cases, the 8th count will be assumed as momentum phase completion
- Trend exhaustion phase counting stops in case any type of momentum phase completion is detected during the counting process
- Postponing the last count of the trend exhaustion phase, the 13th candle must be below/above the 8th candle and if not the candles will be indicated with '+' sign under them and the script continues to search for a 13th candle at the next ones until the conditions are met
🔶 ALERTS
When an alert is configured, the user will have the ability to be notified in case;
Momentum / Trend Exhaustion phase completion
Support & Resistance level cross detection
Stop / Risk level cross detection
Long / Short Trade Setups are triggered
Please note, alerts are available with 'any alert() function call' and the alerts will be received only for the features that are enabled during alert configuration
🔶 SETTINGS
🔹 Momentum Phase
Display Phases: displays the momentum phases, where the Completed option allows the display of only completed momentum phases. The detailed option allows the display of the entire process of the momentum phase processes
Support & Resistance Levels: Toggles the visibility of the Support & Resistance Levels and Line Styling options
Momentum Phase Risk Levels: Toggles the visibility of the momentum phase Stop/Risk Levels and Line Styling options
For color options please refer to the options available under the style tab
🔹 Trend Exhaustion Phase
Display Phases: displays the trend exhaustion phases, where the Completed option allows the display of only completed trend exhaustion phases. The detailed option allows the display of the entire process of the trend exhaustion phase processes
Trend Exhaustion Phase Risk Levels: Toggles the visibility of the trend exhaustion phase Stop/Risk Levels
Trend Exhaustion Phase Target Levels: Toggles the visibility of the trend exhaustion phase Target Levels
For color options please refer to the options available under the style tab
🔹 Trade Setups
Overall Trend Direction & Trade Setup: displays the overall trend and probable trade setup levels, the users should search for a price flip and confirm with other means of technical and fundamental analysis for the trade setups once the label is plotted
Phase-Specific Trade Setup Options
Momentum: Searches for a trade setup after momentum phase completion
Exhaustion: Searches for a trade setup after trend exhaustion phase completion, stronger trend reversal possibility compared to momentum phase setup
Qualified: Searches for a trade setup after the trend exhaustion phase followed by a momentum phase completion
None: No trade setups are presented
Price Flips against the Phase Specific Trade Setups: enables checking the price action relative to the phase-specific trade setups
🔶 RELATED SCRIPTS
Here are the scripts that may add additional insight during potential trading decisions.
Buyside-Sellside-Liquidity
Support-Resistance-Classification

RSI-CCI Fusion + AlertsThe "RSI-CCI Fusion" indicator combines the Relative Strength Index (RSI) and Commodity Channel Index (CCI) from TradingView.
RSI-CCI Fusion: Unlocking Synergies in Technical Analysis
Technical analysis plays a crucial role in understanding market dynamics and making informed trading decisions. I often rely on a combination of indicators to gain insights into price movements and identify potential trade opportunities. In the lines below, I will explore the "RSI-CCI Fusion" indicator, a powerful tool that combines the strengths of the Relative Strength Index (RSI) and the Commodity Channel Index (CCI) to provide enhanced trading insights.
1. Understanding the RSI and CCI Indicators
Before delving into the fusion of these indicators, let's briefly review their individual characteristics. The RSI is a widely used momentum oscillator that measures the speed and change of price movements. It oscillates between 0 and 100, with readings above 70 indicating overbought conditions and readings below 30 indicating oversold conditions.
On the other hand, the CCI is a versatile indicator designed to identify cyclical trends in prices. It measures the distance between the price and its statistical average, thereby providing valuable insights into overbought and oversold levels.
2. The Concept of RSI-CCI Fusion
The RSI-CCI Fusion indicator is born out of my desire to harness the collective power of the RSI and CCI. By combining these indicators, I can benefit from a more comprehensive trading signal that captures both momentum and cyclical trend dynamics.
The fusion process involves assigning weights to the RSI and CCI, creating a blended indicator that reflects their relative importance. The weighted combination ensures that both indicators contribute meaningfully to the final result.
To maintain consistency, the RSI and CCI values are standardized using the z-score technique. This normalization process brings the values to a common scale, making them directly comparable. Rescaling is then applied to bring the combined indicator back to its original scale, facilitating intuitive interpretation.
3. Interpreting the RSI-CCI Fusion Indicator
When plotting the RSI-CCI Fusion indicator on a chart, I gain valuable insights into market dynamics and potential trading opportunities. The indicator's plot typically includes dynamic upper and lower bands, which are calculated based on the indicator's standard deviation. These bands provide boundaries for evaluating overbought and oversold conditions.
When the RSI-CCI Fusion indicator crosses above the lower band, it suggests oversold conditions and potential buying opportunities. Conversely, when the indicator crosses below the upper band, it indicates overbought conditions and potential selling opportunities. I also pay attention to the baseline, which represents the neutral level and may signal potential trend reversals.
4. Utilizing Alerts for Trading Decisions
The RSI-CCI Fusion indicator can be further enhanced by incorporating alerts. These alerts notify me when the indicator generates buy or sell signals, enabling me to take prompt action. I can customize the alerts based on my preferred thresholds and timeframes.
However, it is crucial to remember that the RSI-CCI Fusion indicator should not be relied upon in isolation. To increase the robustness of my trading decisions, it is recommended to combine the indicator with other analysis techniques such as trend lines, support and resistance levels, or additional indicators. This convergence of analysis methodologies enhances the overall accuracy of my trade signals.
Conclusion: The RSI-CCI Fusion indicator represents a compelling approach to technical analysis by synergizing the strengths of the RSI and CCI. By combining momentum and cyclical trend dynamics, I gain a more comprehensive view of market conditions. The fusion of these indicators, accompanied by timely alerts, equips me with valuable insights and facilitates well-informed trading decisions.
As with any technical analysis tool, it is essential for me to backtest the RSI-CCI Fusion indicator to evaluate its performance across different market conditions and timeframes. Additionally, applying proper risk management strategies is crucial to ensure consistent and disciplined trading practices.

TrendingNowTrendingNow Indicator - An Experimental Study
Introduction:
The TrendingNow indicator is an experimental study designed to identify trending market conditions and potential trading opportunities. It combines various technical analysis tools and parameters to provide insights into trend direction, momentum, volume, and price reversals.
Methodology:
The TrendingNow indicator is calculated based on the following parameters and calculations:
Moving Average: A simple moving average (SMA) is calculated using the specified length parameter. It helps smooth out price fluctuations and identify the overall trend direction.
Upper and Lower Bands: The upper and lower bands are derived from the moving average by adding and subtracting a deviation calculated using the multiplier parameter. These bands provide dynamic levels for potential trend reversals.
Price Reversals: The indicator detects price reversals by identifying when the price crosses above or below the upper or lower bands. These reversals suggest potential entry or exit points in the market.
Trend Confirmation: The indicator uses a moving average of the closing prices over the confirmation length parameter to confirm the overall trend direction. It helps filter out false signals and validates the presence of a trend.
Momentum Oscillator: The indicator calculates the relative strength index (RSI) over the momentum length parameter. The RSI measures the speed and change of price movements, indicating potential overbought and oversold conditions.
Volume Trend Confirmation: The study compares the current volume with the average volume over the specified length. If the current volume is above the volume threshold, it suggests increasing volume activity and potential confirmation of the trend.
Volatility Filter: The indicator incorporates an average true range (ATR) calculation to assess market volatility. The volatility threshold is derived by multiplying the ATR by the volatility multiplier parameter. It helps filter out signals during periods of low volatility.
Experimental Study:
The TrendingNow indicator aims to experiment with the combination of these technical analysis tools to identify trending market conditions and potential trading opportunities. By monitoring the price reversals, trend confirmation, momentum, volume trends, and volatility, traders can potentially identify high-probability trade setups.
The study involves observing the indicator's signals and assessing their effectiveness in different market conditions. Traders can experiment with different parameter values, timeframes, and asset classes to optimize the indicator's performance.
Usage and Interpretation:
When using the TrendingNow indicator, traders can consider the following guidelines:
Trend Identification: A bullish trend is indicated when the price is above the upper band, the moving average is rising, and the trend confirmation is positive. A bearish trend is indicated when the price is below the lower band, the moving average is declining, and the trend confirmation is negative.
Price Reversals: Price crossing above the upper band may suggest a potential selling opportunity, while price crossing below the lower band may indicate a potential buying opportunity. These reversals should be confirmed by other indicators and market conditions.
Momentum and Volume Confirmation: Traders can pay attention to the RSI levels to assess overbought and oversold conditions. High volume activity in line with the trend can provide additional confirmation.
Volatility Consideration: Traders may choose to adjust the volatility multiplier parameter based on the current market conditions. Higher values may be more suitable during periods of higher volatility, while lower values may be preferred during low volatility.
Conclusion:
The TrendingNow indicator offers an experimental approach to identifying trending market conditions and potential trading opportunities. Traders can customize the indicator parameters and combine it with other analysis techniques to suit their trading strategies. It is important to conduct thorough testing and validation before incorporating the indicator into live trading.
Disclaimer:
The information provided in this document, including the TrendingNow indicator and the accompanying experimental study, is for educational and experimental purposes only. It should not be considered as financial advice or a recommendation to engage in any trading or investment activities. Trading and investing in financial markets carry inherent risks, and past performance is not indicative of future results.
Before making any trading decisions, it is essential to conduct your own research, evaluate your risk tolerance, and consider your financial situation. The TrendingNow indicator is based on historical price data and technical analysis tools. However, it is important to understand that market conditions can change rapidly, and the indicator may not accurately predict future market movements or generate profitable trades in all situations.
The experimental study aims to explore the effectiveness of the TrendingNow indicator under different market conditions. However, the results obtained from the study are specific to historical data and may not necessarily be indicative of real-time market performance. It is recommended to exercise caution and use the indicator in conjunction with other analysis techniques and risk management strategies.
The TrendingNow indicator's parameters, such as length, multiplier, confirmation length, momentum length, overbought level, oversold level, volume threshold, and volatility multiplier, are adjustable inputs. Traders should carefully consider and test different parameter settings to suit their trading style and market conditions. Furthermore, it is important to regularly review and update the indicator's parameters as market dynamics change.
Trading in financial markets involves the potential for financial loss, and individuals should only trade with funds they can afford to lose. It is strongly advised to seek the guidance of a qualified financial professional or advisor before making any investment decisions.
By using the TrendingNow indicator and conducting the experimental study, you acknowledge that you are solely responsible for any trading decisions you make, and you agree to hold harmless the authors, developers, and distributors of this indicator for any losses, damages, or liabilities incurred as a result of your trading activities.

Price Percentage Shaded CandlesDescription:
The Price Percentage Shaded Candles indicator (P%SC) is a technical analysis tool designed to represent price candles on a chart with shading intensity based on the percentage change between the open and close prices. This overlay indicator enhances visual analysis by providing a visual representation of price movement intensity.
How it Works:
The P%SC indicator calculates the percentage change between the open and close prices of each candle. It then determines the shading intensity of the price candles based on this percentage change. Higher percentage changes result in darker shading, while lower percentage changes result in lighter shading.
Usage:
To effectively utilize the Price Percentage Shaded Candles indicator, follow these steps:
1. Apply the Price Percentage Shaded Candles indicator to your chart by adding it from the available indicators.
2. Configure the indicator's inputs:
- Specify the color for bullish candles using the "Bullish Color" input.
- Specify the color for bearish candles using the "Bearish Color" input.
3. Observe the shaded candles on the chart:
- Bullish candles are colored with the specified bullish color and shaded according to the percentage change.
- Bearish candles are colored with the specified bearish color and shaded according to the percentage change.
4. Interpret the shaded candles:
- Darker shading indicates a higher percentage change and stronger price movement during the corresponding candle.
- Lighter shading indicates a lower percentage change and weaker price movement during the corresponding candle.
5. Combine the analysis of shaded candles with other technical analysis tools, such as trend lines, support and resistance levels, or candlestick patterns, to identify potential trade setups.
6. Implement appropriate risk management strategies, including setting stop-loss orders and position sizing, to manage your trades effectively and protect your capital.
Note: The Price Percentage Shaded Candles indicator provides insights into the shading intensity of price candles based on percentage changes. However, it is recommended to use this indicator in conjunction with other technical analysis tools and perform thorough analysis before making trading decisions.
Price Percentage Breakout by Time PeriodDescription:
The Price Percentage Breakout by Time Period (P%BTP) indicator is a technical analysis tool designed to identify potential breakout signals based on the percentage change in price over a specified lookback period. It helps traders identify significant price movements that exceed a user-defined threshold, indicating potential trading opportunities.
How it Works:
The P%BTP indicator calculates the percentage change between the open and close prices of each candle. It compares this percentage change to the highest percentage change observed over the specified lookback period. When the percentage change exceeds or equals this highest value, it indicates a potential breakout signal. The indicator colors the bars on the chart based on whether it's a bullish or bearish breakout.
Usage:
To effectively utilize the Price Percentage Breakout by Time Period indicator, follow these steps:
1. Apply the P%BTP indicator to your chart by adding it from the available indicators.
2. Customize the input settings to suit your preferences. You can define the lookback period, which determines the number of bars used for calculating the percentage change, as well as choose colors for bullish and bearish breakouts.
3. Observe the bars on the chart:
- Bars highlighted in the bullish color indicate potential bullish breakout signals.
- Bars highlighted in the bearish color indicate potential bearish breakout signals.
4. Interpret the breakout signals:
- A bullish breakout signal occurs when the percentage change in price exceeds or equals the highest percentage change observed over the lookback period, indicating a potential upward movement.
- A bearish breakout signal occurs when the percentage change in price exceeds or equals the highest percentage change observed over the lookback period, indicating a potential downward movement.
5. Consider additional analysis:
- Combine the breakout signals from the P%BTP indicator with other technical analysis tools, such as support and resistance levels, trend lines, or candlestick patterns, to confirm potential trade setups.
6. Implement appropriate risk management strategies, including setting stop-loss orders and position sizing, to manage your trades effectively and protect your capital.
Note: The Price Percentage Breakout by Time Period indicator provides insights into potential breakout signals based on the percentage change in price over a specified lookback period. However, it is recommended to use this indicator in conjunction with other technical analysis tools and perform thorough analysis before making trading decisions.

Price Percentage Breakout by Chosen PercentageDescription:
The Price Percentage Breakout indicator (P%B) is a technical analysis tool designed to identify potential breakout signals based on percentage changes in price. It helps traders identify significant price movements that exceed a specified threshold, indicating potential trading opportunities.
How it Works:
The Price Percentage Breakout indicator calculates the percentage change between the open and close prices of each candle. It compares this percentage change to a user-defined threshold to determine if a breakout has occurred. When the percentage change exceeds the threshold, indicating a significant price movement, the indicator highlights the breakout on the chart. Additionally alerts can be created by the user that display the percentage of the breakout.
Usage:
To effectively utilize the Price Percentage Breakout indicator, follow these steps:
1. Apply the P%B indicator to your chart by adding it from the available indicators.
2. Customize the input settings to suit your preferences. You can choose the color for highlighting the breakout and set the percentage threshold for detecting breakouts.
3. Observe the bars on the chart:
- Bars highlighted in the chosen color indicate potential breakout signals.
4. Interpret the breakout signals:
- A breakout signal occurs when the percentage change in price exceeds the specified threshold. This suggests a significant price movement.
5. Consider additional analysis:
- Combine the breakout signals from the Price Percentage Breakout indicator with other technical analysis tools, such as support and resistance levels, trend lines, or candlestick patterns, to confirm potential trade setups.
6. Implement appropriate risk management strategies, including setting stop-loss orders and position sizing, to manage your trades effectively and protect your capital.
Note: The Price Percentage Breakout indicator provides insights into potential breakout signals based on percentage changes in price. However, it is recommended to use this indicator in conjunction with other technical analysis tools and perform thorough analysis before making trading decisions.