Final Scalping Strategy - RELAXED ENTRY, jangan gopoh braderEMA Scalping System (MTF) Guide (1HR direction, 15 min entry)
Objective
To capture small, consistent profits by entering trades when 15-minute momentum aligns with the 1-hour trend.
Trades are executed only during high-liquidity London and New York sessions to increase the probability of execution and success.
Strategy Setup
Chart Timeframe (Execution): 15-Minute (M15).
Trend Filter (HTF): 1-Hour (H1) chart data is used for the long-term EMA.
Long-Term Trend Filter: 50-Period EMA (based on H1 data).
Short-Term Momentum Signal: 20-Period EMA (based on M15 data).
Risk
Metric: 14-period ATR for dynamic Stop Loss calculation.
✅ Trading Rules🟢
Long (Buy) Entry Conditions
Session: Must be within the London (0800-1700 GMT) or New York (1300-2200 GMT) sessions.
HTF Trend: Current price must be above the 1-Hour EMA 50.
Momentum Signal: Price crosses above the 15-Minute EMA 20.
Confirmation: The bar immediately following the crossover must close above the 15-Minute EMA 20.
Ent
ry: A market order is executed on the close of the confirmation candle.
🔴 Short (Sell) Entry Conditions
Session: Must be within the London (0800-1700 GMT) or New York (1300-2200 GMT) sessions.
HTF Trend: Current price must be below the 1-Hour EMA 50.
Momentum Signal: Price crosses below the 15-Minute EMA 20.
Confirmation: The bar immediately following the crossover must close below the 15-Minute EMA 20.
Entry: A market order is executed on the close of the confirmation candle.
🛑 Trade Management & Exits
Stop Loss (SL): Placed dynamically at 2.0 times the 14-period ATR distance from the entry candle's low (for Buys) or high (for Sells).
Take Profit (TP): Placed dynamically to achieve a 1.5 Risk-Reward Ratio (RR) (TP distance = 1.5 x SL d
istance).
📊 On-Chart Visuals
Detailed Labels: A box appears on the entry bar showing the action, SL/TP prices, Risk/Reward in Pips, and the exact R:R ratio.
Horizontal Lines: Dashed lines display the calculated SL (Red) and TP (Green) levels while the trade is active.
Background: The chart background is shaded to highlight the active London and New York tradi
ng sessions.
스크립트에서 "take profit"에 대해 찾기

Confirmed Momentum QQQ (RSI/MACD Filter)Gemini and Myself,
How This Targets a Higher Win Rate
The key to the win rate increase is the RSI 20/80 filter.
Long Signal: A long entry is now only taken if the trend is up (SMA cross), the MACD is bullish, and the RSI is not overbought (below 80). By only entering when momentum is not yet exhausted, you increase the chance that the price can travel far enough to hit your 4.0 point Take Profit.
Wider SL: The wider Stop Loss of 2.5 points reduces the chance of being stopped out prematurely by routine market movements (whipsaws), which is the number one killer of win rates in high-frequency trading.
After applying these changes, you will need to run the Strategy Tester again to see the new win rate and the new total number of trades.
Would you like me to help you interpret the new Strategy Tester results once you apply these settings?

Elliott Wave Expert AdvisorElliott Wave Expert Advisor - Professional Wave Analysis Tool
OVERVIEW
--------
The Elliott Wave Expert Advisor is a comprehensive Pine Script indicator designed for TradingView that automates Elliott Wave analysis and generates high-probability trading signals. Built on Ralph Nelson Elliott's Wave Principle, this indicator identifies impulse wave patterns, validates them against strict Elliott Wave rules, and provides precise entry points with calculated risk management levels.
CORE FUNCTIONALITY
------------------
1. TREND DETECTION
- Dual Moving Average system (Fast/Slow MA)
- MACD confirmation for trend strength
- Automatic trend classification (Uptrend/Downtrend/Sideways)
- Only generates signals aligned with main trend
2. SWING POINT DETECTION
- Automatic pivot high/low identification
- Configurable sensitivity (lookback periods)
- Minimum swing size filtering to reduce noise
- ZigZag visualization connecting swing points
3. WAVE IDENTIFICATION
- 5-wave impulse pattern recognition (1-2-3-4-5)
- 3-wave corrective pattern detection (A-B-C)
- Wave labels displayed on chart
- Color-coded validation status (Blue = Valid, Orange = Pending)
4. ELLIOTT WAVE RULES VALIDATION
Strictly enforces three cardinal rules:
- Rule 1: Wave 2 never retraces more than 100% of Wave 1
- Rule 2: Wave 3 is never the shortest impulse wave
- Rule 3: Wave 4 never overlaps Wave 1 price territory
5. FIBONACCI ANALYSIS
- Automatic Fibonacci retracement calculations (23.6%, 38.2%, 50%, 61.8%, 78.6%)
- Fibonacci extension projections (100%, 161.8%, 261.8%)
- Wave 3 and Wave 5 target projections
- Fibonacci-based Take Profit levels
6. SIGNAL GENERATION
- Entry signals at Wave 2 completion (catch Wave 3)
- Entry signals at Wave 4 completion (catch Wave 5)
- Automatic Stop Loss placement below/above pivot points
- Multiple Take Profit targets (TP1 at 1.618 extension, TP2 at Wave 5 projection)
- Risk/Reward ratio calculation and filtering
- Minimum R:R threshold (default 1.5:1)
7. VISUAL ELEMENTS
- Pivot markers (H/L) showing swing highs and lows
- ZigZag lines connecting swing points
- Wave number labels (1-2-3-4-5) with validation colors
- Entry signal arrows (Green = BUY, Red = SELL)
- Stop Loss lines (Red dashed)
- Take Profit lines (Green dashed and dotted)
- Real-time status dashboard showing:
* Number of pivots detected
* Wave count progress (X/5)
* Pattern validation status
* Market trend direction
* Signal active status
* Helpful tips and guidance
OPTIMAL USAGE
-------------
• Timeframes: H1, H4, D1 (avoid M1-M5 due to noise)
• Markets: Forex majors (EUR/USD, GBP/USD), Gold (XAU/USD), Major Cryptocurrencies
• Market Conditions: Strong trending markets (avoid ranging/sideways conditions)
• Risk Management: Never risk more than 1-2% per trade
• Position Sizing: Based on calculated Stop Loss distance
CONFIGURATION PARAMETERS
------------------------
Trend Detection:
- MA Fast Period (default: 20)
- MA Slow Period (default: 50)
- MACD settings (12/26/9)
Swing Detection:
- Pivot Lookback Left/Right (default: 10/10, reduce to 5/5 for M15)
- Min Swing Size % (default: 0.1%, reduce to 0.05% for M15)
Wave Detection:
- Min Wave Size % (default: 0.5%, reduce to 0.2-0.3% for smaller timeframes)
Risk Management:
- SL Buffer % (default: 0.1%)
- TP1 Fibonacci Ratio (default: 1.618)
- Min Risk/Reward (default: 1.5)
Visualization:
- Toggle visibility for MAs, ZigZag, Wave Labels, Signals, SL/TP
- Customizable colors for all elements
- Optional trend background coloring
IMPORTANT NOTES
---------------
• Elliott Wave analysis is subjective - this indicator implements one specific interpretation
• Works best in trending markets; automatically suppresses signals in sideways conditions
• Signals are NOT repainting after pivot confirmation
• Not a "holy grail" - combine with other analysis and proper risk management
• Requires patience - quality setups are infrequent but high-probability
• Always backtest on historical data before live trading
ELLIOTT WAVE THEORY BACKGROUND
------------------------------
Elliott Wave Theory, developed by Ralph Nelson Elliott in the 1930s, proposes that market prices move in predictable wave patterns driven by investor psychology. An impulse wave consists of five sub-waves (three in the trend direction, two corrections), followed by a three-wave correction. This indicator automates the identification of these patterns and validates them against Elliott's original rules.
DISCLAIMER
----------
This indicator is for educational and informational purposes only. Past performance does not guarantee future results. Always conduct your own analysis and never trade with money you cannot afford to lose. The indicator provides signals based on technical analysis patterns and does not constitute financial advice.
VERSION
-------
v1.0 - Initial Release
Pine Script v5
Created: 2024
SUPPORT
-------
For detailed usage instructions, refer to the included documentation:
- usage_guide.md - Complete user manual with examples
- elliott_rules.md - Elliott Wave theory reference and implementation details

Victoria Overlay - HTF 200 + VWAP + ATR Stop + MA TrioConsolidated road to minions
Buy Setup:
EMA1 crosses above SMA3.
RSI confirms above 50.
Volume increasing (confirming momentum).
Candle closes above SMA1 base.
Sell Setup:
EMA1 crosses below SMA3.
RSI drops below 50 or exits overbought.
Volume confirms (declining or reversing).
Candle closes below SMA1 base.
Tips:
Think of EMA1 as the scalper’s trigger.
SMA3 is your momentum check.
SMA1 (base) = short-term bias.
Avoid entries during low-volume chop.
Use for day trades or tight scalps; exits happen fast.
Overlay (Smoothed Heikin Ashi + Swing + VWAP + ATR Stop + 200-SMA)
Purpose: Multi-layer trend confirmation + clean structure.
Type: Swing alignment tool.
🟩 BUY / CALL Conditions
Green “Buy (Gated)” arrow appears.
Price is above VWAP, above 200-SMA, and above ATR stop.
ATR stop (green line) sits under price → support confirmed.
Heikin-Ashi candles are green/lime.
Bias label says “Above VWAP | Above 200 | Swing Up”.
🟥 SELL / PUT Conditions
Red “Sell (Gated)” arrow appears.
Price is below VWAP, below 200-SMA, and below ATR stop.
ATR stop (red line) sits above price → resistance confirmed.
Heikin-Ashi candles are red.
Bias label says “Below VWAP | Below 200 | Swing Down”.
Exit / Risk Control:
Close position when price crosses ATR stop.
If Heikin candles flip color, momentum is reversing.
Best Use Cases:
For next-day or multi-hour swing entries.
Use ATR Stop for dynamic stop loss.
Stay out when the bias label is mixed (e.g. “Above VWAP | Below 200 | Swing Down”).
Pro Tip:
On big news days, let VWAP reset post-open before acting on arrows — filters fake signals.
RSI Panel Pro (v6)
Purpose: Strength + exhaustion confirmation.
Type: Momentum filter.
Key Levels:
Overbought: 80+ → take profits soon.
Oversold: 20– → watch for bounce setups.
Bull regime: RSI above 60 = momentum strong.
Bear regime: RSI below 40 = weakness.
Buy / Entry Signals:
RSI crosses up from below 40 or 20.
RSI line is above RSI-EMA (gray line).
Higher timeframe RSI (if used) is also rising.
Trim / Exit:
RSI drops under 60 after being strong.
RSI crosses below its EMA.
Sell / Put Setup:
RSI fails at 60 or drops below 40.
RSI crosses under EMA after a bounce.
Tips:
Pair RSI panel with Victoria Overlay — only take gated buys when RSI confirms.
RSI < 40 but above 20 = “loading zone” for reversals.
RSI > 70 = overextended → wait for confirmation before entering.
Combined Execution Rules
Goal What to Watch Action
Entry (CALL) EMA1 > SMA3, Buy (Gated) arrow, RSI rising > 50 Buy call / open long
Entry (PUT) EMA1 < SMA3, Sell (Gated) arrow, RSI < 50 Buy put / open short
Exit Early Price crosses ATR stop or RSI flips under EMA Exit trade / protect gains
Trend Filter VWAP + 200-SMA alignment Only trade in that direction
Avoid Trades Conflicting bias label or low volume Stay flat
Pro Tips
VWAP → Intraday mean: above = bullish control, below = bearish control.
ATR Stop → Dynamic trailing stop: never widen it manually.
Smoothed Heikin-Ashi → filters noise: trend stays until color flips twice.
RSI Panel → confirms whether to hold through pullbacks.
If RSI and Overlay disagree — wait, not trade.

Average Price Calculator / VisualizerDCA Average Price Calculator - Visualize Your Breakeven & TP!
Ever wished you could visualize your trades and instantly see your average entry price right here on TradingView? Especially if you're a DCA (Dollar-Cost Averaging) trader like me, tracking multiple entries can be a hassle. You're constantly switching to a spreadsheet or calculator to figure out your breakeven and take-profit levels. Well I've developed this DCA Average Price Calculator to solve exactly that problem, bringing all your position planning directly onto your chart.
What It Does
This indicator is a interactive tool designed to calculate the weighted average price of up to 10 separate trade entries. It then plots your crucial breakeven (average price) and a customizable take-profit target directly on your chart, giving you a clear visual of your position.
Key Features
Up to 10 Order Entries: Plan complex DCA strategies with support for up to ten individual buys.
Flexible Size Input: Enter your position size in either USD Amount or Number of Shares/Contracts. The script is smart enough to know which one you're using.
Instant Average Price Calculation: Your weighted average price (your breakeven point) is calculated and plotted in real-time as a clean yellow line.
Customizable Take-Profit Target: Set your desired profit percentage and see your take-profit level instantly plotted as a green line.
Detailed On-Chart Labels: Each order you plot is marked with a detailed label showing the entry price, the number of shares purchased, and the total USD value of that entry.
Clean & Uncluttered UI: The main Average and TP labels are intelligently shifted to the right, ensuring they don't overlap with your entry markers, keeping your chart readable.
How to Use It - Simple Steps
Add the indicator to your chart.
Open the script's 'Settings' menu.
In the 'Take Profit' section, set your desired profit percentage (e.g., 1 for 1%).
Under the 'Orders' section, begin filling in your entries. For each 'Order #', enter the Price.
Next, enter the size. You can either fill in the 'Size (USD)' box OR the '/ Shares' box. Leave the one you're not using at 0.
As you add orders, the 'Avg' (yellow) and 'TP' (green) lines, along with the blue order labels, will automatically appear and adjust on your chart!
Who Is This For?
DCA Traders: This is the ultimate tool for you!
Position Traders: Keep track of scaling into a larger position over time.
Manual Backtesters: Quickly simulate and visualize how a series of buys would have played out.
Any Trader who wants a quick and easy way to calculate their average entry without leaving TradingView.
I built this tool to improve my own trading workflow, and I hope it helps you as much as it has helped me. If you find it useful, please consider giving it a 'Like' and feel free to leave any feedback or suggestions in the comments!
Happy trading

BB SPY Mean Reversion Investment StrategySummary
Mean reversion first, continuation second. This strategy targets equities and ETFs on daily timeframes. It waits for price to revert from a Bollinger location with candle and EMA agreement, then manages risk with ATR based exits. Uniqueness comes from two elements working together. One, an adaptive band multiplier driven by volatility of volatility that expands or contracts the envelope as conditions change. Two, a bias memory that re arms the same direction after any stop, target, or time exit until a true opposite signal appears. Add it to a clean chart, use the markers and levels, and select on bar close for conservative alerts. Shapes can move while the bar is open and settle on close.
Scope and intent
• Markets. Currently adapted for SPY, needs to be optimized for other assets
• Timeframes. Daily primary. Other frames are possible but not the default
• Default demo. SPY on daily
• Purpose. Trade mean reversion entries that can chain into a longer swing by splitting holds into ATR or time segments
Originality and usefulness
• Novelty. Adaptive band width from volatility of volatility plus a persistent bias array that keeps the original direction alive across sequential entries until an opposite setup is confirmed
• Failure modes mitigated. False starts in chop are reduced by candle color and EMA location. Missed continuation after a take profit or stop is addressed by the re arm engine. Oversized envelopes during quiet regimes are avoided by the adaptive multiplier
• Testability. Every module has Inputs and visible levels so users can see why a suggestion appears
• Portable yardstick. All risk and targets are expressed in ATR units
Method overview in plain language
The engine measures where price sits relative to Bollinger bands, confirms with candle color and EMA location, requires ADX for shorts(in our case long close since we use it currently as long only), and optionally requires a trend or mean reversion regime using band width percent rank and basis slope. Risk uses ATR for stop, target, and optional breakeven. A small array stores the last confirmed direction. While flat, the engine keeps a pending order in that direction. The array flips only when a true opposite setup appears.
Base measures
• Range basis. True Range smoothed over a user defined ATR Length
• Return basis. Not required
Components
• Bollinger envelope. SMA length and standard deviation multiplier. Entry is based on cross of close through the band with location bias
• Candle and EMA filter. Close relative to open and close relative to EMA align direction
• ADX gate for shorts. Requires minimum trend strength for short trades
• Adaptive multiplier. Band width scales using volatility of volatility so envelopes breathe with conditions
• Regime gate optional. Band width percent rank and basis slope identify trend or mean reversion regimes
• Risk manager. ATR stop, ATR target, optional breakeven, optional time exit
• Bias memory. Array stores last confirmed direction and re arms entries while flat
Fusion rule
Minimum satisfied gates count style. All required gates must be true. Optional gates are controlled in Inputs. Bias memory never overrides an opposite confirmed setup.
Signal rule
• Long setup when close crosses up through the lower band, the bar closes green, and close is above the long EMA
• Short setup when close crosses down through the upper band, the bar closes red, close is below the short EMA, and ADX is above the minimum
• While flat the model keeps a pending order in the stored direction until a true opposite setup appears
• IN LONG or IN SHORT describes states between entry and exit
What you will see on the chart
• Markers for Long and Short setups
• Exit markers from ATR or time rules
• Reference levels for entry, stop, and target
• Bollinger bands and optional adaptive bands
Inputs with guidance
Setup
• Signal timeframe. Uses the chart timeframe
• Invert direction optional. Flips long and short
Logic
• BB Length. Typical 10 to 50. Higher smooths more
• BB Mult. Typical 1.0 to 2.5. Higher widens entries
• EMA Length long. Typical 10 to 50
• EMA Length short. Typical 5 to 30
• ADX Minimum for short. Typical 15 to 35
Filters
• Regime Type. none or trend or mean reversion
• Rank Lookback. Typical 100 to 300
• Basis Slope Length and Threshold. Larger values reduce false trends
Risk
• ATR Length. Typical 10 to 21
• ATR Stop Mult. Typical 1.0 to 3.0
• ATR Take Profit Mult. Typical 2.0 to 5.0
• Breakeven Trigger R. Move stop to entry after the chosen multiple
• Time Exit. Minimum bars and extension when profit exceeds a fraction of ATR
Bias and rearm
• Bias flips kept. Array depth
• Keep rearm when flat. Maintain a pending order while flat
UI
• Show markers and levels. Clean defaults
Usage recipes
Alerts update in real time and can change while the bar forms. Select on bar close for conservative workflows.
Properties visible in this publication
• Initial capital 25000
• Base currency USD
• If any higher timeframe calls are enabled, request.security uses lookahead off
• Commission 0.03 percent
• Slippage 3 ticks
• Default order size method Percent of equity with value 5
• Pyramiding 0
• Process orders on close On
• Bar magnifier Off
• Recalculate after order is filled Off
• Calc on every tick Off
Realism and responsible publication
No performance claims. Costs and fills vary by venue. Shapes can move intrabar and settle on close. Strategies use standard candles only.
Honest limitations and failure modes
High impact releases and thin liquidity can break assumptions. Gap heavy symbols may require larger ATR. Very quiet regimes can reduce contrast in the mean reversion signal. If stop and target can both be touched inside one bar, outcome follows the TradingView order model for that bar path.
Regimes with extreme one sided trend and very low volatility can reduce mean reversion edges. Results vary by symbol and venue. Past results never guarantee future outcomes.
Open source reuse and credits
None.
Backtest realism
Costs are realistic for liquid equities. Sizing does not exceed five percent per trade by default. Any departure should be justified by the user.
If you got any questions please le me know

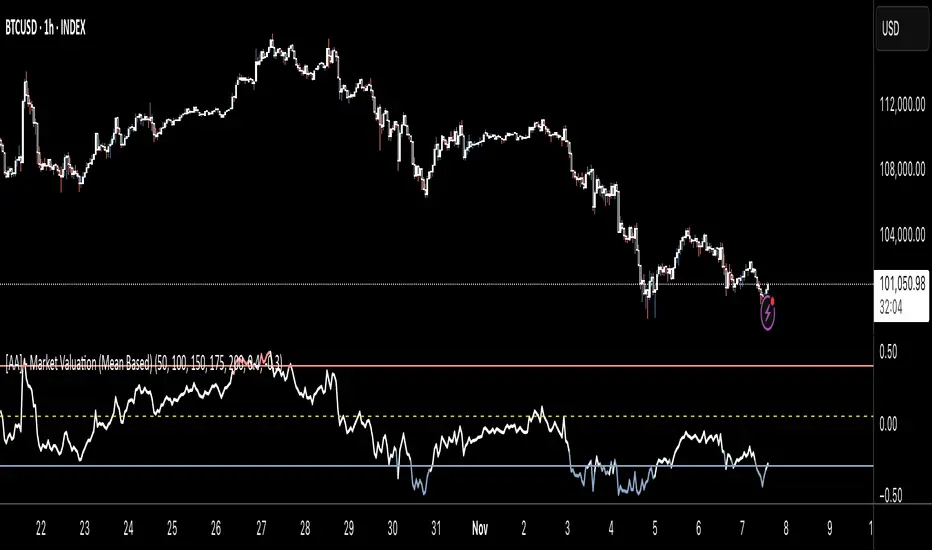
[AA] - Market Valuation (Mean Based) - Market Valuation (Mean Based)
What it does
This indicator estimates whether price is overvalued, undervalued, or fairly valued relative to its structural mean across multiple lookback windows. It builds a single normalized oscillator from short-, mid-, and long-term ranges so traders can quickly see when price is stretched away from equilibrium.
This is not a mashup of existing tools. It’s a custom mean-deviation model that aggregates multi-window range positioning into one score.
How it works (concepts)
For each lookback length (13, 25, 30, 50, 100, 200):
Range & midpoint:
Highest high H and lowest low L.
Structural midpoint Mid = (H + L)/2.
Normalized deviation:
Dev = (Close − Mid) / (H − L) → location of price within its own range.
Aggregation:
The oscillator z_struct is the average of the deviations from the five windows.
Result: a smoothed, dimensionless value (roughly −1 to +1 in typical markets) showing multi-horizon displacement from the mean.
Plots & levels
Oscillator (area): z_struct
Reference lines: +0.40 (OB), 0.00 (equilibrium), −0.30 (OS)
Coloring:
Red when z_struct > OB (extended above mean)
Blue when z_struct < OS (extended below mean)
White in between
Suggested use
Mean reversion context: Fade extremes in range-bound conditions; take profits into OB/OS.
Trend awareness: In strong trends, extremes can persist—use levels as exhaustion context rather than standalone entry.
Filter/confirm: Combine with your trend filter or structure tools to time pullbacks and avoid chasing extended moves.
Inputs
Lookbacks: 13, 25, 30, 50, 100, 200
Thresholds: OB = 0.40, OS = −0.30
Notes & limitations
Works on the current symbol/timeframe only; no security() calls and no repainting beyond normal bar completion.
In very tight or flat ranges (H ≈ L), normalized deviations can become sensitive; consider longer windows or higher timeframes.
This is an indicator, not a strategy. No signals are generated; use with risk management.
Originality statement
This script implements an original, multi-window mean-deviation aggregation. It does not replicate a built-in or a public indicator; its purpose is to quantify cross-horizon valuation in a single, normalized measure.
ATR SL/TP Precision Zones (Dots)ATR SL/TP Precision Zones (Dots) is a volatility-based tool designed to help traders set accurate Stop Loss and Take Profit levels based on real market volatility — not fixed pips or emotion.
This indicator uses ATR (Average True Range) multiplied by 1.2 to calculate dynamic distance bands.
Instead of drawing a ribbon or channel, it places simple dots above and below each candle:
Upper Dot (Green) → Suggested Take Profit / Price Stretch Zone
Lower Dot (Red) → Suggested Stop Loss Cushion / Support Expansion Zone
Because ATR measures market volatility, these dots expand during high volatility and tighten during slow markets, helping traders avoid stop-loss hunts and premature exits.
Why This Works
Most traders lose because:
They set SL too close → stopped out by noise
They set TP too far → price never reaches it
This tool calibrates those distances automatically based on real price movement behavior.
ATR = volatility
Volatility = market breathing room
This indicator ensures your trade has room to breathe, increasing win consistency.
Best Use Cases
Scalping
Swing trading
Trend continuation entries
Reversal confirmations with support/resistance
Works on Crypto / Forex / Stocks / Futures

PSAR with ATR Trailing Stop + SMA Filter📈 Strategy Overview: PSAR + 6×ATR Trailing Stop with SMA Filter
This strategy is built around the principle of “Cut the losers, let the winners run” — a disciplined, trend-following approach that combines the Parabolic SAR indicator with dynamic risk management and a Simple Moving Average (SMA) trend filter.
🔍 Strategy Logic
Trend Filter Trades are only taken in the direction of the prevailing trend, defined by a user-selected SMA (default: 100).
✅ Long trades only when price is above the SMA
✅ Short trades only when price is below the SMA
Entry Signal: A trade is triggered when the Parabolic SAR flips to the opposite side of the price bars, signaling a potential trend reversal.
Stop Loss: The stop loss is dynamically set at 6×ATR from the entry price. This adapts to market volatility and is recalculated every bar — effectively acting as a trailing stop.
Exit Logic: There is no fixed take profit. The trade remains open until the trailing stop is hit — allowing winners to run and losers to be cut quickly.
Risk Management: Each trade risks 0.5% of total equity, ensuring consistent position sizing and capital preservation.
📊 Visual Elements
PSAR dots mark trend direction changes
SMA line shows the broader trend filter
Trailing stop crosses (with 50% opacity) indicate the current stop level without cluttering the chart
⚙️ Customizable Inputs
PSAR parameters: Start, Increment, Maximum
ATR length and multiplier
SMA length
Risk percentage per trade
This strategy is ideal for traders who want to stay aligned with the trend, automate disciplined exits, and avoid emotional decision-making. Clean, simple, and powerful.
Wishing you calm and successful trades!

NY VIX Channel Trend US Futures Day Trade StrategyNY VIX Channel Trend Strategy
Summary in one paragraph
Session anchored intraday strategy for index futures such as ES and NQ on one to fifteen minute charts. It acts only after the first configurable window of New York Regular Trading Hours and uses a VIX derived daily implied move to form a realistic channel from the session open. Originality comes from using a pure implied volatility yardstick as portable support and resistance, then committing in the direction of the first window close relative to the open. Add it to a clean chart and trade the simple visuals. For conservative alerts use on bar close.
Scope and intent
• Markets. Index futures ES and NQ
• Timeframes. One to thirty minutes
• Default demo. ES1 on five minutes
• Purpose. Provide a portable intraday yardstick for entries and exits without curve fitting
• Limits. This is a strategy. Orders are simulated on standard candles
Originality and usefulness
• Unique concept. A VIX only channel anchored at 09:30 New York plus a single window trend test
• Addresses. False urgency at session open and unrealistic bands from arbitrary multipliers
• Testability. Every input is visible and the channel is plotted so users can audit behavior
• Portable yardstick. Daily implied move equals VIX percent divided by square root of two hundred fifty two
• Protected status. None. Method and use are fully disclosed
Method overview in plain language
Take the daily VIX or VIX9D value, convert it to a daily fraction by dividing by square root of two hundred fifty two, then anchor a symmetric channel at the New York session open. Observe the first N minutes. If that window closes above the open the bias is long. If it closes below the open the bias is short. One trade per session. Exits occur at the channel boundary or at a bracket based on a user selected VIX factor. Positions are closed a set number of minutes before the session ends.
Base measures
Return basis. The daily implied move unit equals VIX percent divided by square root of two hundred fifty two and serves as the distance unit for targets and stops.
Components
• VIX Channel. Top, mid, bottom lines anchored at 09:30 New York. No extra multipliers
• Window Trend. Close of the first N minutes relative to the session open sets direction
• Risk Bracket. Take profit and stop loss equal to VIX unit times user factor
• Session Window. Uses the exchange time of the chart
Fusion rule
Minimum gates count equals one. The trade only arms after the window has elapsed and a direction exists. One entry per session.
Signal rule
• Long when the window close is above the session open and the window has completed
• Short when the window close is below the session open and the window has completed
• Exit on channel touch. Long exits at the top. Short exits at the bottom
• Flat thirty minutes before the session close or at the user setting
Inputs with guidance
Setup
• Use VIX9D. Width source. Typical true for fast tone or false for baseline
• Use daily OPEN. Toggle for sensitivity to overnight changes
Logic
• Window minutes. Five to one hundred twenty. Larger values delay entries and reduce whipsaw
• VIX factor for TP. Zero point five to two. Raising it widens the profit target
• VIX factor for SL. Zero point five to two. Raising it widens the stop
• Exit minutes before close. Fifteen to ninety. Raising it exits earlier
Properties visible in this publication
• Initial capital one hundred thousand USD
• Base currency USD
• request.security uses lookahead off
• Commission cash per contract two point five $ per each contract. Slippage one tick
• Default order size method FIXED with value one contract. Pyramiding zero. Process orders on close ON. Bar magnifier OFF. Recalculate after order is filled OFF. Calc on every tick ON
Realism and responsible publication
No performance claims. Past results never guarantee future outcomes. Fills and slippage vary by venue. Shapes can move while a bar forms and settle on close. Strategy uses standard candles.
Honest limitations and failure modes
Economic releases and thin liquidity can break the channel. Very quiet regimes can reduce signal contrast. Session windows follow the exchange time of the chart. If both stop and target can be hit within one bar, assume stop first for conservative reading without bar magnifier.
Works best in liquid hours of New York RTH. Very large gaps and surprise news may exceed the implied channel. Always validate on the symbols you trade.
Entries and exits
• Entry logic. After the first window, go long if the window close is above the session open, go short if below
• Exit logic. Long exits at the channel top or at the take profit or stop. Short exits at the channel bottom or at the take profit or stop. Flat before session close by the configured minutes
• Risk model. Initial stop and target based on the VIX unit times user factors. No trail and no break even. No cooldown
• Tie handling. Treat as stop first for conservative interpretation
Position sizing
Fixed size one contract per trade. Target risk per trade should generally remain near one percent of account equity. Risk is based on the daily volatility value, the max loss from the tests for one year duration with 5min chart was 4%, while the avg loss was below <1% of the total capital.
If you have any questions please let me know. Thank you for coming by !

ADX Color Change by BehemothI find this tool to be the most valuable and accurate entry point indicator along with moving averages and the VWAP.
ADX Color Indicator - Controls & Intraday Trading Benefits
Indicator Controls:
1. ADX Length (default: 14)
- Controls the calculation period for ADX
- Lower values (7-10) = more sensitive, faster signals (better for scalping)
- Higher values (14-20) = smoother, fewer false signals (better for swing trades)
- *Intraday tip:* Try 10-14 for most intraday timeframes
2. Show Threshold Levels (default: On)
- Displays the 20 and 25 horizontal lines
- Helps you quickly identify when ADX crosses key strength levels
3. Use Custom Timeframe (default: Off)
- Allows viewing higher timeframe ADX on lower timeframe charts
- *Example:* Trade on 5-min chart but see 15-min or 1-hour ADX
4. Custom Timeframe
- Select any timeframe: 1m, 5m, 15m, 30m, 1H, 4H, D, etc.
- *Intraday tip:* Use 15m or 1H ADX on 5m charts for better trend context
5. Show +DI and -DI (default: Off)
- Shows directional movement indicators
- Green line (+DI) > Red line (-DI) = bullish trend
- Red line (-DI) > Green line (+DI) = bearish trend
6. Show Background Zon es (default: Off)
- Visual background colors for quick trend strength identification
- Green = strong trend (ADX > 25)
- Yellow = moderate trend (ADX 20-25)
Intraday Trading Benefits:
1. Avoid Choppy Markets
- When ADX < 20 (no background color), market is ranging
- Reduces false breakout trades and whipsaws
- Save time and capital by stepping aside during low-quality setups
2. Identify High-Probability Trend Trades
- **Green line + Green zone** = strong trend building, look for pullback entries
- Yellow line crossing above 20 = early trend formation signal
- Catch trends early when ADX starts rising from below 20
3. Multi-Timeframe Analysis
- Use custom timeframe to align with higher timeframe trends
- *Example:* If 1H ADX shows green (strong trend), take breakout trades on 5m chart in same direction
- Increases win rate by trading with the bigger picture
4. Exit Signals
- When ADX turns red (falling), trend is weakening
- Consider tightening stops or taking profits
- Avoid entering new positions when ADX is declining
5. Quick Visual Confirmation
- Color coding eliminates need to analyze numbers
- Instant recognition: Green = go, Yellow = caution, Red = trend dying
- Faster decision-making during fast market moves
6. Scalping Strategy
- Set ADX length to 7-10 for sensitive signals
- Only scalp when ADX is rising (blue, yellow, or green)
- Exit when ADX turns red
7. Breakout Confirmation
- Wait for ADX to rise above 20 after a breakout
- Filters false breakouts in ranging markets
- Yellow or green color confirms momentum behind the move
Optimal Intraday Settings:
- Day Trading (5-15 min charts):** ADX Length = 10-14
- Scalping (1-5 min charts):** ADX Length = 7-10, watch custom 15m timeframe
- Swing Intraday (30min-1H charts):** ADX Length = 14-20
Simple Trading Rules:
✅ Trade: ADX rising + above 20 (yellow or green)
⚠️ Caution: ADX flat or just crossed 20
❌ Avoid:*ADX falling (red) or below 20
The key advantage is staying out of low-quality, choppy price action which is where most intraday traders lose money!

Enhanced MA Crossover Pro📝 Strategy Summary: Enhanced MA Crossover Pro
This strategy is an advanced, highly configurable moving average (MA) crossover system designed for algorithmic trading. It uses the crossover of two customizable MAs (a "Fast" MA 1 and a "Slow" MA 2) as its core entry signal, but aggressively integrates multiple technical filters, time controls, and dynamic position management to create a robust and comprehensive trading system.
💡 Core Logic
Entry Signal: A bullish crossover (MA1 > MA2) generates a Long signal, and a bearish crossover (MA1 < MA2) generates a Short signal. Users can opt to use MA crossovers from a Higher Timeframe (HTF) for the entry signal.
Confirmation/Filters: The basic MA cross signal is filtered by several optional indicators (see Filters section below) to ensure trades align with a broader trend or momentum context.
Position Management: Trades are managed with a sophisticated system of Stop Loss, Take Profit, Trailing Stops, and Breakeven stops that can be fixed, ATR-based, or dynamically adjusted.
Risk Management: Daily limits are enforced for maximum profit/loss and maximum trades per day.
⚙️ Key Features and Customization
1. Moving Averages
Primary MAs (MA1 & MA2): Highly configurable lengths (default 8 & 20) and types: EMA, WMA, SMA, or SMMA/RMA.
Higher Timeframe (HTF) MAs: Optional MAs calculated on a user-defined resolution (e.g., "60" for 1-hour) for use as an entry signal or as a trend confirmation filter.
2. Multi-Filter System
The entry signal can be filtered by the following optional conditions:
SMA Filter: Price must be above a 200-period SMA for long trades, and below it for short trades.
VWAP Filter: Price must be above VWAP for long trades, and below it for short trades.
RSI Filter: Long trades are blocked if RSI is overbought (default 70); short trades are blocked if RSI is oversold (default 30).
MACD Filter: Requires the MACD Line to be above the Signal Line for long trades (and vice versa for short trades).
HTF Confirmation: Requires the HTF MA1 to be above HTF MA2 for long entries (and vice versa).
3. Dynamic Stop and Target Management (S/L & T/P)
The strategy provides extensive control over exits:
Stop Loss Methods:
Fixed: Fixed tick amount.
ATR: Based on a multiple of the Average True Range (ATR).
Capped ATR: ATR stop limited by a maximum fixed tick amount.
Exit on Close Cross MA: Position is closed if the price crosses back over the chosen MA (MA1 or MA2).
Breakeven Stop: A stop can be moved to the entry price once a trigger distance (fixed ticks or Adaptive Breakeven based on ATR%) is reached.
Trailing Stop: Can be fixed or ATR-based, with an optional feature to auto-tighten the trailing multiplier after the breakeven condition is met.
Profit Target: Can be a fixed tick amount or a dynamic target based on an ATR multiplier.
4. Time and Session Control
Trading Session: Trades are only taken between defined Start/End Hours and Minutes (e.g., 9:30 to 16:00).
Forced Close: All open positions are closed near the end of the session (e.g., 15:45).
Trading Days: Allows specific days of the week to be enabled or disabled for trading.
5. Risk and Position Limits
Daily Profit/Loss Limits: The strategy tracks daily realized and unrealized PnL in ticks and will close all positions and block new entries if the user-defined maximum profit or maximum loss is hit.
Max Trades Per Day: Limits the number of executed trades in a single day.
🎨 Outputs and Alerts
Plots: Plots the MA1, MA2, SMA, VWAP, and HTF MAs (if enabled) on the chart.
Shapes: Plots visual markers (BUY/SELL labels) on the bar where the MA crossover occurs.
Trailing Stop: Plots the dynamic trailing stop level when a position is open.
Alerts: Generates JSON-formatted alerts for entry ({"action":"buy", "price":...}) and exit ({"action":"exit", "position":"long", "price":...}).

Central Limit Theorem Reversion IndicatorDear TV community, let me introduce you to the first-ever Central Limit Theorem indicator on TradingView.
The Central Limit Theorem is used in statistics and it can be quite useful in quant trading and understanding market behaviors.
In short, the CLT states: "When you take repeated samples from any population and calculate their averages, those averages will form a normal (bell curve) distribution—no matter what the original data looks like."
In this CLT indicator, I use statistical theory to identify high-probability mean reversion opportunities in the markets. It calculates statistical confidence bands and z-scores to identify when price movements deviate significantly from their expected distribution, signaling potential reversion opportunities with quantifiable probability levels.
Mathematical Foundation
The Central Limit Theorem (CLT) says that when you average many data points together, those averages will form a predictable bell-curve pattern, even if the original data is completely random and unpredictable (which often is in the markets). This works no matter what you're measuring, and it gets more reliable as you use more data points.
Why using it for trading?
Individual price movements seem random and chaotic, but when we look at the average of many price movements, we can actually predict how they should behave statistically. This lets us spot when prices have moved "too far" from what's normal—and those extreme moves tend to snap back (mean reversion).
Key Formula:
Z = (X̄ - μ) / (σ / √n)
Where:
- X̄ = Sample mean (average return over n periods)
- μ = Population mean (long-term expected return)
- σ = Population standard deviation (volatility)
- n = Sample size
- σ/√n = Standard error of the mean
How I Apply CLT
Step 1: Calculate Returns
Measures how much price changed from one bar to the next (using logarithms for better statistical properties)
Step 2: Average Recent Returns
Takes the average of the last n returns (e.g., last 100 bars). This is your "sample mean."
Step 3: Find What's "Normal"
Looks at historical data to determine: a) What the typical average return should be (the long-term mean) and b) How volatile the market usually is (standard deviation)
Step 4: Calculate Standard Error
Determines how much sample averages naturally vary. Larger samples = smaller expected variation.
Step 5: Calculate Z-Score
Measures how unusual the current situation is.
Step 6: Draw Confidence Bands
Converts these statistical boundaries into actual price levels on your chart, showing where price is statistically expected to stay 95% and 99% of the time.
Interpretation & Usage
The Z-Score:
The z-score tells you how statistically unusual the current price deviation is:
|Z| < 1.0 → Normal behavior, no action
|Z| = 1.0 to 1.96 → Moderate deviation, watch closely
|Z| = 1.96 to 2.58 → Significant deviation (95%+), consider entry
|Z| > 2.58 → Extreme deviation (99%+), high probability setup
The Confidence Bands
- Upper Red Bands: 95% and 99% overbought zones → Expect mean reversion downward as the price is not likely to cross these lines.
- Center Gray Line: Statistical expectation (fair value)
- Lower Blue Bands: 95% and 99% oversold zones → Expect mean reversion upward
Trading Logic:
- When price exceeds the upper 95% band (z-score > +1.96), there's only a 5% probability this is random noise → Strong sell/short signal
- When price falls below the lower 95% band (z-score < -1.96), there's a 95% statistical expectation of upward reversion → Strong buy/long signal
Background Gradient
The background color provides real-time visual feedback:
- Blue shades: Oversold conditions, expect upward reversion
- Red shades: Overbought conditions, expect downward reversion
- Intensity: Darker colors indicate stronger statistical significance
Trading Strategy Examples
Hypothetically, this is how the indicator could be used:
- Long: Z-score < -1.96 (below 95% confidence band)
- Short: Z-score > +1.96 (above 95% confidence band)
- Take profit when price returns to center line (Z ≈ 0)
Input Parameters
Sample Size (n) - Default: 100
Lookback Period (m) - Default: 100
You can also create alerts based on the indicator.
Final notes:
- The indicator uses logarithmic returns for better statistical properties
- Converts statistical bands back to price space for practical use
- Adaptive volatility: Bands automatically widen in high volatility, narrow in low volatility
- No repainting: yay! All calculations use historical data only
Feedback is more than welcome!
Henri

RSI + Elder Bull-Bear pressure RSI + Bull/Bear (Elder-Ray enhanced RSI)
What it is
An extended RSI that overlays Elder-Ray Bull/Bear Power on the same, zero-centered scale. You get classic RSI regime cues plus a live read of buy/sell pressure, with optional smoothing, bands, and right-edge value labels.
Key features
RSI with bands – default bands 30 / 50 / 70 (editable).
Bull/Bear Power (Elder) – ATR-normalized; optional EMA/SMA/RMA/HMA smoothing.
One-pane overlay – RSI and Bull/Bear share a common midline (RSI-50 ↔ panel 0).
Right-edge labels – always visible at the chart’s right margin with adjustable offsets.
How to read it
Cyan line = RSI (normalized)
Above the mid band = bullish regime; below = bearish regime.
Green = Bull Power, Red = Bear Power
Columns/lines above 0 show buy pressure; below 0 show sell pressure.
Smoothing reduces noise; zero-line remains your key reference.
Trade logic (simple playbook)
Entry
BUY (primary):
RSI crosses up through 50 (regime turns bullish), and
Bull (green) crosses up through 0 (buy pressure confirms).
SELL (primary):
RSI crosses down through 50, and
Bear (red) crosses down through 0 (sell pressure confirms).
Alternative momentum entries
Aggressive BUY: Bull (green) pushes above RSI-80 band (strong upside impulse).
Aggressive SELL: Bear (red) pushes below RSI-30 band (strong downside impulse).
Exits / trade management
In a long: consider exiting or tightening stops if Bear (red) dips below the 0 line (rising sell pressure) or RSI loses 50.
In a short: consider exiting or tightening if Bull (green) rises above 0 or RSI reclaims 50.
Tip: “0” on the panel is your pressure zero-line (maps to RSI-50). Most whipsaws happen near this line; smoothing (e.g., EMA 21) helps.
Defaults (on first load)
RSI bands: 30 / 50 / 70 with subtle fills.
Labels: tiny, pushed far right (large offsets).
Bull/Bear smoothing: EMA(21), smoothed line plot mode.
RSI plotted normalized so it overlaps the pressure lines cleanly.
Tighten or loosen the Bull/Bear thresholds (e.g., Bull ≥ +0.5 ATR, Bear ≤ −0.5 ATR) to demand stronger confirmation.
Settings that matter
Smoothing length/type – balances responsiveness vs. noise.
Power/RSI Gain – visual scaling only (doesn’t change logic).
Band placement – keep raw 30/50/80 or switch to “distance from 50” if you prefer symmetric spacing.
Label offsets – move values clear of the last bar/scale clutter.
Good practices
Combine with structure/ATR stops (e.g., 1–1.5× ATR, swing high/low).
In trends, hold while RSI stays above/below 50 and the opposite pressure line doesn’t dominate.
In ranges, favor signals occurring near the mid band and take profits at the opposite band.
Disclaimer: This is a research/visual tool, not financial advice at any kind. Test your rules on multiple markets/timeframes and size positions responsibly.

Gold 15m: Trend + S/R + Liquidity Sweep (RR 1:2)This strategy is designed for short-term trading on XAUUSD (Gold) using the 15-minute timeframe. It combines trend direction, support/resistance pivots, liquidity sweep detection, and momentum confirmation to identify high-probability reversal setups in line with the dominant market trend.
⚙️ Core Logic:
Trend Filter (EMA 200):
The strategy only takes long positions when price is above the 200 EMA and short positions when price is below it.
Support/Resistance via Pivots:
Dynamic swing highs and lows are identified using pivot points. These act as local supply and demand levels where liquidity is likely to accumulate.
Liquidity Sweep Detection:
A bullish liquidity sweep occurs when price briefly breaks below the last pivot low (grabbing liquidity) and then closes back above it.
A bearish sweep occurs when price breaks above the last pivot high and then closes back below.
Momentum & Candle Strength:
The strategy filters signals based on candle range and body size to ensure entries occur during strong price reactions, not weak retracements.
Risk Management (1:2 RR):
Stop-loss is placed slightly beyond the last pivot level using ATR-based buffers, and take-profit is set at 2× the risk distance, maintaining a reward-to-risk ratio of 1:2.
💼 Trade Logic Summary:
Long Entry:
After a bullish liquidity sweep & reclaim, momentum confirmation, and trend alignment (above EMA 200).
Short Entry:
After a bearish sweep & reclaim, momentum confirmation, and trend alignment (below EMA 200).
Exit:
Automated via ATR-based Stop Loss and Take Profit targets.
📊 Customization Options:
Adjustable EMA length, pivot settings, ATR multipliers, and RR ratio.
Option to enable/disable trend filter.
Toggle display of S/R zones on chart.
🧠 Best Use:
Works best during London and New York sessions when Gold shows strong momentum.
Can be adapted for forex pairs and indices by tuning ATR and pivot parameters.

London Breakout Structure by Ale 2This indicator identifies market structure breakouts (CHOCH/BOS) within a specific London session window, highlighting potential breakout trades with automatic entry, stop loss (SL), and take profit (TP) levels.
It helps traders focus on high-probability breakouts when volatility increases after the Asian session, using price structure, ATR-based volatility filters, and a custom risk/reward setup.
🔹 Example of Strategy Application
Define your session (e.g. 04:00 to 05:00).
Wait for a CHOCH (Change of Character) inside this session.
If a bullish CHOCH occurs → go LONG at candle close.
If a bearish CHOCH occurs → go SHORT at candle close.
SL is set below/above the previous swing using ATR × multiplier.
TP is calculated automatically based on your R:R ratio.
📊 Example:
When price breaks above the last swing high within the session, a “BUY” label appears and the indicator draws Entry, SL, and TP levels automatically.
If the breakout fails and price closes below the opposite structure, a “SELL” signal will replace the bullish setup.
🔹 Details
The logic is based on structural shifts (CHOCH/BOS):
A CHOCH occurs when price breaks and closes beyond the most recent high/low.
The indicator dynamically detects these shifts in structure, validating them only inside your chosen time window (e.g. the London Open).
The ATR filter ensures setups are valid only when the range has enough volatility, avoiding false signals in low-volume hours.
You can also visualize:
The session area (purple background)
Entry, Stop Loss, and Take Profit levels
Direction labels (BUY/SELL)
ATR line for volatility context
🔹 Configuration
Start / End Hour: define your preferred trading window.
ATR Length & Multiplier: adjust for volatility.
Risk/Reward Ratio: set your desired R:R (default 1:2).
Minimum Range Filter: avoids signals with tight SLs.
Alerts: receive notifications when breakout conditions occur.
🔹 Recommendations
Works best on 15m or 5m charts during London session.
Designed for breakout and structure-based traders.
Works on Forex, Crypto, and Indices.
Ideal as a visual and educational tool for understanding BOS/CHOCH behavior.

VWAP & Band Cross Strategy v6 - AdvancedThese are a few updates made to the original script. The daily take profit and stop loss functions correctly for 1 contract but because of the pyramiding input even if not used you'll need to multiply the values by the number of contracts to keep consistent results. I have been unable to correct that function. Let me know if you test the script and have any recommendations for improvement. If trading an actual account I do recommend setting hard daily limits with your provider because there is still slippage from the original exit alerts even with the daily stop loss in place.
1. Real-Time Execution & Hard PnL Limits (The Focus)
The most critical changes were implemented to ensure the daily profit and loss limits act as hard, real-time barriers instead of waiting for the candle to close.
• Intrabar Tick Execution: The parameter calc_on_every_tick=true was added to the strategy() declaration. This forces the entire script to re-evaluate its logic on every single price update (tick), enabling immediate action.
• Real-Time PnL Tracking: The PnL calculation was updated to track the total_daily_pnl by summing the realized profit/loss (from closed trades) and the unrealized profit/loss (strategy.openprofit) on every tick.
• Immediate Closure: The script now checks the total_daily_pnl against the user-defined limits (daily_take_profit_value, daily_stop_loss_value) and immediately executes strategy.close_all() the moment the threshold is breached, preventing further trading.
• Combined Risk Enforcement: The user-defined "Max Intraday Risk ($)" and the "Daily Stop Loss (Value)" are compared, and the script enforces the tighter of the two limits.
2. Visibility and External Alerting
To address the unavoidable issue of slippage (which causes price overshoot in fast markets even with tick execution), dedicated alert mechanisms were added.
• Dedicated Alert Condition: An alertcondition named DAILY PNL LIMIT REACHED was added. This allows you to set up a TradingView alert that triggers the instant the daily_limit_reached variable turns true, giving you the fastest possible notification.
• Visual Marker: A large red triangle (\u25b2) is plotted on the chart using plotchar at the exact moment the daily limit condition is met, providing a clear visual confirmation of the trigger bar.
3. Strategy Features and Input Flexibility
Several user-requested features were integrated to make the strategy more robust and customizable.
• Trailing Stop / Breakeven (TSL/BE): A new exit option, Fixed Ticks + TSL, was added, allowing you to set a fixed profit target while also deploying a trailing stop or breakeven level based on points/ticks gained.
• Multiple Exit Types: The exit strategy was expanded to include logic for several types: Fixed Ticks, ATR-based, Capped ATR-based, VWAP Cross, and Price/Band Crosses.
• Pyramiding Control: An input Max Pyramiding Entries was introduced to control how many positions the strategy can have open at the same time.
• Confirmation Logic Toggle: Added an input to choose how multiple confirmation indicators (RSI, SMMA, MACD) are combined: "AND" (all must be true) or "OR" (at least one must be true).
• Indicator Confirmations: Logic for three external indicators—RSI, SMMA (EMA), and MACD—was fully integrated to act as optional filters for entry.
• VWAP Reset Anchors: Logic was corrected to properly reset the VWAP calculation based on the selected period ("Daily", "Weekly", or "Session") by using Pine Script v6's required anchor series.
Trading Day Filters: Inputs were added to select which specific days of the week the strategy is allowed to trade.

Advanced Psychological Levels with Dynamic Spacing═══════════════════════════════════════
ADVANCED PSYCHOLOGICAL LEVELS WITH DYNAMIC SPACING
═══════════════════════════════════════
A comprehensive psychological price level indicator that automatically identifies and displays round number levels across multiple timeframes. Features dynamic ATR-based spacing, smart crypto detection, distance tracking, and customizable alert system.
───────────────────────────────────────
WHAT THIS INDICATOR DOES
───────────────────────────────────────
This indicator automatically draws psychological price levels (round numbers) that often act as support and resistance:
- Dynamic ATR-Based Spacing - Adapts level spacing to market volatility
- Multiple Level Types - Major (250 pip), Standard (100 pip), Mid, and Intraday levels
- Smart Asset Detection - Automatically adjusts for Forex, Crypto, Indices, and CFDs
- Crypto Price Adaptation - Intelligent level spacing based on cryptocurrency price magnitude
- Distance Information Table - Real-time percentage distance to nearest levels
- Combined Level Labels - Clear identification when multiple level types coincide
- Performance Optimized - Configurable visible range and label limits
- Comprehensive Alerts - Notifications when price crosses any level type
───────────────────────────────────────
HOW IT WORKS
───────────────────────────────────────
PSYCHOLOGICAL LEVELS CONCEPT:
Psychological levels are round numbers where traders tend to place orders, creating natural support and resistance zones. These include:
- Forex: 1.0000, 1.0100, 1.0050 (pips)
- Crypto: $100, $1,000, $10,000 (whole numbers)
- Indices: 10,000, 10,500, 11,000 (points)
Why They Matter:
- Traders naturally gravitate to round numbers
- Stop losses cluster at these levels
- Take profit orders concentrate here
- Institutional algorithmic trading often targets these levels
DYNAMIC ATR-BASED SPACING:
Traditional Method:
- Fixed spacing regardless of volatility
- May be too tight in volatile markets
- May be too wide in quiet markets
Dynamic Method (Recommended):
- Uses ATR (Average True Range) to measure volatility
- Automatically adjusts level spacing
- Tighter levels in low volatility
- Wider levels in high volatility
Calculation:
1. Calculate ATR over specified period (default: 14)
2. Multiply by ATR multiplier (default: 2.0)
3. Round to nearest psychological level
4. Generate levels at dynamic intervals
Benefits:
- Adapts to market conditions
- More relevant levels in all volatility regimes
- Reduces clutter in trending markets
- Provides more detail in ranging markets
LEVEL TYPES:
Major Levels (250 pip/point):
- Highest significance
- Primary support/resistance zones
- Color: Red (default)
- Style: Solid lines
- Spacing: 2.5x standard step
Standard Levels (100 pip/point):
- Secondary importance
- Common psychological barriers
- Color: Blue (default)
- Style: Dashed lines
- Spacing: Standard step
Mid Levels (50% between major):
- Optional intermediate levels
- Halfway between major levels
- Color: Gray (default)
- Style: Dotted lines
- Usage: Additional confluence points
Intraday Levels (sub-100 pip):
- For intraday traders
- Fine-grained precision
- Color: Yellow (default)
- Style: Dotted lines
- Only shown on intraday timeframes
SMART ASSET DETECTION:
Forex Pairs:
- Detects major currency pairs automatically
- Uses pip-based calculations
- Standard: 100 pips (0.0100)
- Major: 250 pips (0.0250)
- Intraday: 20, 50, 80 pip subdivisions
Cryptocurrencies:
- Automatic price magnitude detection
- Adaptive spacing based on price:
* Under $0.10: Levels at $0.01, $0.05
* $0.10-$1: Levels at $0.10, $0.50
* $1-$10: Levels at $1, $5
* $10-$100: Levels at $10, $50
* $100-$1,000: Levels at $100, $500
* $1,000-$10,000: Levels at $1,000, $5,000
* Over $10,000: Levels at $5,000, $10,000
Indices & CFDs:
- Fixed point-based system
- Major: 500 point intervals (with 250 sub-levels)
- Standard: 100 point intervals
- Suitable for stock indices like SPX, NASDAQ
COMBINED LEVEL LABELS:
When multiple level types coincide at the same price:
- Single line drawn (highest priority color)
- Combined label shows all types
- Priority: Major > Standard > Mid > Intraday
Example Label Formats:
- "1.1000 Major" - Major level only
- "1.1000 Std + Major" - Both standard and major
- "50000 Intra + Mid + Std" - Three levels coincide
Benefits:
- Cleaner chart appearance
- Clear identification of confluence
- Reduced visual clutter
- Easy to spot high-importance levels
DISTANCE INFORMATION TABLE:
Real-time tracking of nearest levels:
Table Contents:
- Nearest major level above (price and % distance)
- Nearest standard level above (price and % distance)
- Nearest standard level below (price and % distance)
Display:
- Top right corner (configurable)
- Color-coded by level type
- Real-time percentage calculations
- Helpful for position management
Usage:
- Identify proximity to key levels
- Set realistic profit targets
- Gauge potential move magnitude
- Monitor approaching resistance/support
ALERT SYSTEM:
Comprehensive crossing alerts:
Alert Types:
- Major Level Crosses
- Standard Level Crosses
- Intraday Level Crosses
Alert Modes:
- First Cross Only: Alert once when level is crossed
- All Crosses: Alert every time level is crossed
Alert Information:
- Level type crossed
- Specific price level
- Direction (above/below)
- One alert per bar to prevent spam
Configuration:
- Enable/disable by level type
- Choose alert frequency
- Customize for your trading style
───────────────────────────────────────
HOW TO USE
───────────────────────────────────────
INITIAL SETUP:
General Settings:
1. Enable "Use Dynamic ATR-Based Spacing" (recommended)
2. Set ATR Period (14 is standard)
3. Adjust ATR Multiplier (2.0 is balanced)
Visibility Settings:
1. Set Visible Range % (10% recommended for clarity)
2. Adjust Label Offset for readability
3. Configure performance limits if needed
Level Selection:
1. Enable/disable level types based on trading style
2. Adjust line counts for each type
3. Choose line styles and colors for visibility
TRADING STRATEGIES:
Breakout Trading:
1. Wait for price to approach major or standard level
2. Monitor for consolidation near level
3. Enter on confirmed break above/beyond level
4. Stop loss just beyond the broken level
5. Target: Next major or standard level
Rejection Trading:
1. Identify major psychological level
2. Wait for price to test the level
3. Look for rejection signals (wicks, bearish/bullish candles)
4. Enter in direction of rejection
5. Stop beyond the level
6. Target: Previous level or mid-level
Range Trading:
1. Identify range between two major levels
2. Buy at lower psychological level
3. Sell at upper psychological level
4. Use standard and mid-levels for position management
5. Exit if major level breaks with volume
Confluence Trading:
1. Look for combined levels (Std + Major)
2. These represent high-probability zones
3. Use as primary support/resistance
4. Increase position size at confluence
5. Expect stronger reactions at these levels
Session-Based Trading:
1. Note opening level at session start (Asian/London/NY)
2. Trade breakouts of major levels during high-volume sessions
3. London/NY sessions: More likely to break levels
4. Asian session: More likely to respect levels (range trading)
RISK MANAGEMENT WITH PSYCHOLOGICAL LEVELS:
Stop Loss Placement:
- Place stops just beyond psychological levels
- Add buffer (5-10 pips for forex)
- Avoid exact round numbers (stop hunting risk)
- Use previous major level as maximum stop
Take Profit Strategy:
- First target: Next standard level (partial profit)
- Second target: Next major level (remaining position)
- Trail stops to breakeven at first target
- Use distance table to calculate risk/reward
Position Sizing:
- Larger positions at major levels (higher probability)
- Smaller positions at intraday levels (lower probability)
- Scale in at standard levels between major levels
- Reduce size when multiple levels are close together
TIMEFRAME CONSIDERATIONS:
Higher Timeframes (4H, Daily, Weekly):
- Focus on Major and Standard levels only
- Disable Intraday and Mid levels
- Wider level spacing expected
- Use for swing trading and position trading
Lower Timeframes (5m, 15m, 1H):
- Enable all level types
- Use Intraday levels for precision
- Tighter level spacing acceptable
- Good for day trading and scalping
Multi-Timeframe Approach:
- Identify major levels on Daily/4H charts
- Refine entries using 15m/1H intraday levels
- Trade in direction of higher timeframe bias
- Use lower timeframe levels for position management
───────────────────────────────────────
CONFIGURATION GUIDE
───────────────────────────────────────
GENERAL SETTINGS:
Dynamic ATR-Based Spacing:
- Enabled: Recommended for most markets
- Disabled: Fixed psychological levels
- ATR Period: 14 (standard), 10 (responsive), 20 (smooth)
- ATR Multiplier: 1.0-5.0 (2.0 is balanced)
VISIBILITY SETTINGS:
Visible Range %:
- 5%: Very tight range, minimal clutter
- 10%: Balanced view (recommended)
- 20%: Wide range, more context
- 50%: Maximum range, all levels visible
Label Offset:
- 10-20 bars: Close to current price
- 30-50 bars: Moderate distance
- 50-100 bars: Far from price action
Performance Limits:
- Max Historical Bars: Reduce if indicator loads slowly
- Max Labels: Reduce for cleaner chart (20-30 recommended)
LEVEL CUSTOMIZATION:
Line Count:
- Lower (1-3): Cleaner chart, fewer levels
- Medium (4-6): Balanced view
- Higher (7-10): More context, busier chart
Line Styles:
- Solid: High importance, easy to see
- Dashed: Medium importance, clear but subtle
- Dotted: Low importance, minimal visual weight
Colors:
- Use contrasting colors for different level types
- Red/Blue/Yellow default works well
- Adjust based on chart background and personal preference
DISTANCE TABLE:
Position:
- Top Right: Doesn't interfere with price action
- Top Left: Good for right-side price scale
- Bottom positions: Less common but available
Colors:
- Default (white text, dark background) works for most charts
- Match your chart theme for consistency
- Ensure text is readable against background
ALERT CONFIGURATION:
Alert by Level Type:
- Major: Most important, fewer false signals
- Standard: Balance of frequency and importance
- Intraday: Many signals, best for active traders
Alert Frequency:
- First Cross Only: Cleaner, less noise (recommended for swing trading)
- All Crosses: Every touch, good for scalping
Alert Setup in TradingView:
1. Configure desired alert types in indicator settings
2. Right-click chart → Add Alert
3. Select this indicator
4. Choose "Any alert() function call"
5. Set delivery method (mobile, email, webhook)
───────────────────────────────────────
ASSET-SPECIFIC TIPS
───────────────────────────────────────
FOREX (EUR/USD, GBP/USD, etc.):
- Major levels at x.x000, x.x500
- Standard levels at x.xx00
- Intraday levels at 20/50/80 pips
- Most effective during London/NY sessions
- Watch for "figure" levels (1.0000, 1.1000)
CRYPTOCURRENCIES (BTC, ETH, etc.):
- Enable dynamic spacing for volatile markets
- Levels adjust automatically based on price
- Watch major $1,000 increments for BTC
- $100 levels important for ETH
- Smaller caps: Use standard levels
- High volatility: Increase ATR multiplier to 3.0
STOCK INDICES (SPX, NASDAQ, etc.):
- 100-point levels most important
- 500-point levels for major S/R
- 50-point mid-levels for refinement
- Watch end-of-day for level reactions
- Futures often lead spot on level breaks
GOLD/COMMODITIES:
- Major levels at $50 increments ($1,900, $1,950)
- Standard levels at $10 increments
- Very reactive to psychological levels
- Watch for false breaks during low volume
- Best reactions during active trading hours
───────────────────────────────────────
BEST PRACTICES
───────────────────────────────────────
Chart Setup:
- Use clean price action charts
- Avoid too many indicators
- Ensure psychological levels are clearly visible
- Match colors to your chart theme
Level Selection:
- Start with Major and Standard levels only
- Add Mid and Intraday as needed
- Less is more - avoid chart clutter
- Adjust based on timeframe
Combining with Other Tools:
- Volume profile for confluence
- Trendlines intersecting psychological levels
- Moving averages near round numbers
- Fibonacci levels coinciding with psychological levels
Common Mistakes to Avoid:
- Trading every level touch (be selective)
- Ignoring volume confirmation
- Setting stops exactly at levels (stop hunting)
- Forgetting to adjust for different assets
- Over-relying on levels without price action confirmation
Performance Optimization:
- Reduce visible range for faster loading
- Lower max historical bars on lower timeframes
- Limit labels to 30-50 for clarity
- Disable unused level types
───────────────────────────────────────
EDUCATIONAL DISCLAIMER
───────────────────────────────────────
This indicator identifies psychological price levels based on round numbers that tend to act as support and resistance. The methodology includes:
- Round number detection algorithms
- ATR-based dynamic spacing calculations
- Asset-specific level determination
- Distance percentage calculations
Psychological levels are a recognized concept in technical analysis, studied by traders and institutions. However, they do not guarantee price reactions and should be used as part of a comprehensive trading strategy including proper risk management, volume analysis, and price action confirmation.
───────────────────────────────────────
USAGE DISCLAIMER
───────────────────────────────────────
This tool is for educational and analytical purposes. Psychological levels can act as support or resistance but price reactions are not guaranteed. Dynamic spacing may generate different levels in different market conditions. Always conduct independent analysis, use proper risk management, and never risk capital you cannot afford to lose. Past performance does not indicate future results.
───────────────────────────────────────
CREDITS & ATTRIBUTION
───────────────────────────────────────
Original Concept: Sonar Lab

Forex Dynamic Lot Size CalculatorForex Dynamic Lot Size Calculator for Forex. Works on USD Base and USD Quote pairs. Provides real-time data based on stop-loss location. Allows you to know in real-time how the number of lots you need to purchase to match your risk %.
Number of Lots is calculated based on total risk. Total risk is calculated based on Stop-Loss + Commission + Spread Fees + Slippage measured in pips. Also includes data such as break-even pips, net take profit, margin required, buying power used, and a few others. All are real-time and anchored to the current price.
The intention of creating this indicator is to help with risk management. You know exactly how many lots you need to get this very moment to have your total risk at lets say $250, which includes commission fees, spread fees, and slippage.
To put it simply, if I was to enter the trade right now and willing to risk exactly $250, how many lots will I need to get right this second?
---
- To use adjust Account Settings along with other variables.
- Stop Loss Mode can be Manual or Dynamic. If you select Dynamic, then you will have to adjust Stop Loss Level to where you can see the reference line on the screen. It is at 1.1 by default. Just enter current price and the line will appear. Adjust it by dragging it to where you want your stop loss to be.
- Take Profit Mode can also be Manual or Dynamic. I just keep my TP at Manual and use Quick Access to set Quick RR levels.
- Adjust Spreads and Slippage to your liking. I tried to have TV calculate current spread, but it seem like it doesn't have access to real-life data for me like MT5 does. I just use average instead. Both are optional, depending on your broker and type of account you use.
- Pip Value for the current pair, Return on Margin, and Break-even line can be turned on and off, based on your needs. I just get the Break-even value in pips from the pannel and use that as reference where I need to relocate my stop loss to break-ever (commission + spreds + slippage).
- Panel is fully customizable based on your liking. Important fields are highlighted along with reference lines.

Relative Volume (Multi-TF, D, W, M)Relative Volume (Multi-TF, Candle-Matched Colors)
This indicator measures Relative Volume (RVOL) — the ratio of current volume to average historical volume — across any higher timeframe (Daily, Weekly, or Monthly) and displays it as color-coded columns that match the candle colors of the chart you’re viewing.
RVOL reveals how active today’s market participation is compared to its typical rhythm.
RVOL = 1.0 → normal volume
>1.5 → rising interest
>2.0–3.0 → strong institutional participation
>5.0 → climax or exhaustion levels
Features
Works on any chart timeframe while computing RVOL from your chosen higher timeframe (e.g., show Daily RVOL while trading on a 5-minute chart).
Column colors automatically match your chart’s candle colors (green/red/neutral).
Adjustable lookback period (len) and selectable source timeframe (D, W, or M).
Pre-drawn horizontal guide levels at 1.0, 1.2, 1.5, 2, 3, and 5 for quick interpretation.
Compatible with all chart types, including Heikin Ashi or custom color schemes.
Typical Use
Swing trading:
Look for quiet bases where RVOL stays 0.4–0.9, then expansion ≥2 on breakout days.
Confirm follow-through when green days keep RVOL ≥1.2–1.5 and red pullbacks stay below 1.0.
Day trading:
Watch intraday RVOL (on 1–5m charts) for bursts ≥2 that sustain for several bars — this signals crowd engagement and valid momentum.
Interpretation Summary
RVOL Value Meaning Typical Action
0.4–0.9 Quiet base / low interest Watch for setup
1.0 Normal activity Neutral
1.2–1.5 Valid participation Early confirmation
2–3 Strong expansion Momentum / breakout
≥5 Climax / exhaustion Take profits or avoid new entries
Author’s note:
RVOL isn’t directional; it tells how many players are active, not who’s winning. Combine it with structure (levels, VWAP, or trend) to see when the market crowd truly commits.

VWAP & Band Cross Strategy v6VWAP & Band Cross Strategy v6: Script Summary
This Pine Script implements a highly flexible, multi-layered trading strategy centered around the Volume Weighted Average Price (VWAP) and its associated Standard Deviation Bands.
The strategy is designed to test various entry/exit models based on how the price interacts with the central VWAP line and the upper/lower volatility bands, with extensive risk management and confirmation filters.
1. Core Mechanics (VWAP & Bands)
VWAP Calculation: Calculates the VWAP based on a user-defined source (default is the close price).
Standard Deviation Bands: Creates upper and lower bands by calculating the standard deviation of the price (over 20 periods by default) and multiplying it by a user-defined Multiplier (default is 2.0). These bands dynamically expand and contract with volatility.
Plotting: The script clearly plots the VWAP (purple), the Upper Band (green), and the Lower Band (red), with a colored fill between the bands.
2. Entry Triggers
The core entry logic is based on a single, user-selected cross event between the price and the VWAP/Bands. The user can choose from six predefined entry types:
Entry Type Category
Entry Trigger (Long)
Entry Trigger (Short)
Mean Reversion
Price crosses over the Lower Band.
Price crosses under the Upper Band.
Trend Following
Price crosses over the Upper Band (Breakout).
Price crosses under the Lower Band (Breakout).
VWAP Cross
Price crosses over the VWAP.
Price crosses under the VWAP.
3. Filters and Confirmation
Trades are only executed if they pass a series of optional filters, making the strategy highly customizable:
Technical Confirmation (Optional): Users can enable and configure up to three additional indicators that must align with the trade direction:
RSI: Price must be Oversold (for Long) or Overbought (for Short).
SMMA: Price must be above the SMMA (for Long) or below (for Short).
MACD: MACD line must cross the Signal line and the Histogram must be positive/negative.
Time and Day Filters: Trades are restricted to a defined Entry Start/End Hour/Minute window, and only execute on user-selected Trading Days of the week.
Trade Direction: Can be toggled to execute Long Only, Short Only, or Both.
4. Advanced Risk Management (Daily Limits)
The strategy incorporates robust daily limits that reset at a configured Daily Reset Hour/Minute:
Daily Profit/Loss Limits: If the running total of Realized PnL (closed trades) + Unrealized PnL (open position) exceeds a user-defined Daily Take Profit (in Ticks) or falls below the Daily Stop Loss (in Ticks), the strategy locks out new trades and immediately closes any open position.
Max Daily Trades: Prevents the strategy from entering more than a specified number of trades per day.
5. Exit Logic
The strategy exit is also highly configurable via the Exit Type setting:
Fixed Ticks / ATR / Capped ATR: If one of these is selected, the script calculates a static Stop Loss and Take Profit level upon entry, using either fixed tick values or dynamic values based on the Average True Range (ATR), which are then executed using Pine Script's strategy.exit function.
Cross Exits (VWAP/Bands): If selected, the position is closed when the price crosses the VWAP or a specific band in the opposite direction.
End-of-Day Close: An unconditional exit that closes all open positions at a user-defined Close All Hour/Minute, regardless of profit/loss or limit status, preventing positions from being held overnight.

Trading Toolkit - Comprehensive AnalysisTrading Toolkit – Comprehensive Analysis
A unified trading analysis toolkit with four sections:
📊 Company Info
Fundamentals, market cap, sector, and earnings countdown.
📅 Performance
Date‑range analysis with key metrics.
🎯 Market Sentiment
CNN‑style Fear & Greed Index (7 components) + 150‑SMA positioning.
🛡️ Risk Levels
ATR/MAD‑based stop‑loss and take‑profit calculations.
Key Features
CNN‑style Fear & Greed approximation using:
Momentum: S&P 500 vs 125‑DMA
Price Strength: NYSE 52‑week highs vs lows
Market Breadth: McClellan Volume Summation (Up/Down volume)
Put/Call Ratio: 5‑day average (inverted)
Volatility: VIX vs 50‑DMA (inverted)
Safe‑Haven Demand: 20‑day SPY–IEF return spread
Junk‑Bond Demand: HY vs IG credit spread (inverted)
Normalization: z‑score → percentile (0–100) with ±3 clipping.
CNN‑aligned thresholds:
Extreme Fear: 0–24 | Fear: 25–44 | Neutral: 45–54 | Greed: 55–74 | Extreme Greed: 75+.
Risk tools: ATR & MAD volatility measures with configurable multipliers.
Flexible layout: vertical or side‑by‑side columns.
Data Sources
S&P 500: CBOE:SPX or AMEX:SPY
NYSE: INDEX:HIGN, INDEX:LOWN, USI:UVOL, USI:DVOL
Options: USI:PCC (Total PCR), fallback INDEX:CPCS (Equity PCR)
Volatility: CBOE:VIX
Treasuries: NASDAQ:IEF
Credit Spreads: FRED:BAMLH0A0HYM2, FRED:BAMLC0A0CM
Risk Management
ATR risk bands: 🟢 ≤3%, 🟡 3–6%, ⚪ 6–10%, 🟠 10–15%, 🔴 >15%
MAD‑based stop‑loss and take‑profit calculations.
Author: Daniel Dahan
(AI Generated, Merged & enhanced version with CNN‑style Fear & Greed)

Amiya's Doji / Hammer / Spinning Top Breakout Strategy v5How it works
1. Pattern Detection (Previous Candle):
• Checks if total shadow length ≥ 2 × body.
• Checks if candle height (high − low) is between 10 and 21.5 points.
• If true → marks that candle as a potential Doji, Hammer, or Spinning Top.
2. Long Setup:
• LTP (close) crosses above previous candle high.
• Previous candle is a valid pattern candle.
• Stop Loss = 3 points below previous candle low.
• Take Profit = 5 × (high − low) of previous candle added to previous high.
3. Short Setup:
• LTP (close) crosses below previous candle low.
• Previous candle is a valid pattern candle.
• Stop Loss = 3 points above previous candle high.
• Take Profit = 5 × (high − low) of previous candle subtracted from previous low.
4. Visualization:
• Yellow background highlights pattern candles.
• Green ▲ and Red ▼ markers show entry points.
Deep yellow candles → represent Doji / Hammer / Spinning Top patterns
• Green triangle → Buy signal
• Red triangle → Sell signal
• Dotted green line + label → Target
• Dotted red line + label → Stop loss
• Gray background → Outside trading hours
• Auto close → All trades square off at 3:29 PM IST
