KAMA Trend Flip - SightLing LabsBuckle up, traders—this open-source KAMA Trend Flip indicator is your ticket to sniping trend reversals with a Kaufman Adaptive Moving Average (KAMA) that’s sharper than a Wall Street shark’s tooth. No voodoo, no fluff—just raw, volatility-adaptive math that dances with the market’s rhythm. It zips through trending rockets and chills in choppy waters, slashing false signals like a samurai. Not laggy like the others - this thing is the real deal!
Core Mechanics:
• Efficiency Ratio (ER): Reads the market’s pulse (0-1). High ER = turbo-charged MA, low ER = smooth operator.
• Adaptive Smoothing: Mixes fast (default power 2) and slow (default 30) constants to match market mood swings.
• Trend Signals: KAMA climbs = blue uptrend (bulls run wild). KAMA dips = yellow downtrend (bears take over). Flat = gray snooze-fest.
• Alerts: Instant pings on flips—“Trend Flip Up” for long plays, “Down” for shorts. Plug into bots for set-and-forget domination.
Why It Crushes:
• Smokes static MAs in volatile arenas (crypto, stocks, you name it). Backtests show 20-30% fewer fakeouts than SMA50.
• Visual Pop: Overlays price with bold blue/yellow signals. Slap it on BTC 1D to see trends light up like Times Square.
• Tweakable: Dial ER length (default 50) to your timeframe. Short for scalps, long for swing trades.
Example Settings in Action:
• 10s Chart (Hyper-Scalping): Set Source: Close, ER Length: 100, Fast Power: 1, Slow Power: 6. Catches micro-trends in crypto like a heat-seeking missile. Blue/yellow flips scream entry/exit on fast moves.
• 2m Chart (Quick Trades): Set Source: Close, ER Length: 14, Fast Power: 1, Slow Power: 6. Perfect for rapid trend shifts in stocks or forex. Signals align with momentum bursts—check historical flips for proof.
Deployment:
• Drop it on any chart. Backtest settings to match your asset’s volatility—tweak until it sings.
• Pair with RSI or volume spikes for killer confirmation. Pro move: Enter on flip + volume pop, exit on reverse.
• Strategy-Ready: Slap long/short logic on alerts to build a lean, mean trading machine.
Open source from SightLing Labs—grab it, hack it, profit from it. Share your tweaks in the comments and let’s outsmart the market together. Trade hard, win big!
스크립트에서 "swing"에 대해 찾기

VWAP For Loop [BackQuant]VWAP For Loop
What this tool does—in one sentence
A volume-weighted trend gauge that anchors VWAP to a calendar period (day/week/month/quarter/year) and then scores the persistence of that VWAP trend with a simple for-loop “breadth” count; the result is a clean, threshold-driven oscillator plus an optional VWAP overlay and alerts.
Plain-English overview
Instead of judging raw price alone, this indicator focuses on anchored VWAP —the market’s average price paid during your chosen institutional period. It then asks a simple question across a configurable set of lookback steps: “Is the current anchored VWAP higher than it was i bars ago—or lower?” Each “yes” adds +1, each “no” adds −1. Summing those answers creates a score that reflects how consistently the volume-weighted trend has been rising or falling. Extreme positive scores imply persistent, broad strength; deeply negative scores imply persistent weakness. Crossing predefined thresholds produces objective long/short events and color-coded context.
Under the hood
• Anchoring — VWAP using hlc3 × volume resets exactly when the selected period rolls:
Day → session change, Week → new week, Month → new month, Quarter/Year → calendar quarter/year.
• For-loop scoring — For lag steps i = , compare today’s VWAP to VWAP .
– If VWAP > VWAP , add +1.
– Else, add −1.
The final score ∈ , where N = (end − start + 1). With defaults (1→45), N = 45.
• Signal logic (stateful)
– Long when score > upper (e.g., > 40 with N = 45 → VWAP higher than ~89% of checked lags).
– Short on crossunder of lower (e.g., dropping below −10).
– A compact state variable ( out ) holds the current regime: +1 (long), −1 (short), otherwise unchanged. This “stickiness” avoids constant flipping between bars without sufficient evidence.
Why VWAP + a breadth score?
• VWAP aggregates both price and volume—where participants actually traded.
• The breadth-style count rewards consistency of the anchored trend, not one-off spikes.
• Thresholds give you binary structure when you need it (alerts, automation), without complex math.
What you’ll see on the chart
• Sub-pane oscillator — The for-loop score line, colored by regime (long/short/neutral).
• Main-pane VWAP (optional) — Even though the indicator runs off-chart, the anchored VWAP can be overlaid on price (toggle visibility and whether it inherits trend colors).
• Threshold guides — Horizontal lines for the long/short bands (toggle).
• Cosmetics — Optional candle painting and background shading by regime; adjustable line width and colors.
Input map (quick reference)
• VWAP Anchor Period — Day, Week, Month, Quarter, Year.
• Calculation Start/End — The for-loop lag window . With 1→45, you evaluate 45 comparisons.
• Long/Short Thresholds — Default upper=40, lower=−10 (asymmetric by design; see below).
• UI/Style — Show thresholds, paint candles, background color, line width, VWAP visibility and coloring, custom long/short colors.
Interpreting the score
• Near +N — Current anchored VWAP is above most historical VWAP checkpoints in the window → entrenched strength.
• Near −N — Current anchored VWAP is below most checkpoints → entrenched weakness.
• Between — Mixed, choppy, or transitioning regimes; use thresholds to avoid reacting to noise.
Why the asymmetric default thresholds?
• Long = score > upper (40) — Demands unusually broad upside persistence before declaring “long regime.”
• Short = crossunder lower (−10) — Triggers only on downward momentum events (a fresh breach), not merely being below −10. This combination tends to:
– Capture sustained uptrends only when they’re very strong.
– Flag downside turns as they occur, rather than waiting for an extreme negative breadth.
Tuning guide
Choose an anchor that matches your horizon
– Intraday scalps : Day anchor on intraday charts.
– Swing/position : Month or Quarter anchor on 1h/4h/D charts to capture institutional cycles.
Pick the for-loop window
– Larger N (bigger end) = stronger evidence requirement, smoother oscillator.
– Smaller N = faster, more reactive score.
Set achievable thresholds
– Ensure upper ≤ N and lower ≥ −N ; if N=30, an upper of 40 can never trigger.
– Symmetric setups (e.g., +20/−20) are fine if you want balanced behavior.
Match visuals to intent
– Enabling VWAP coloring lets you see regime directly on price.
– Background shading is useful for discretionary reading; turn it off for cleaner automation displays.
Playbook examples
• Trend confirmation with disciplined entries — On Month anchor, N=45, upper=38–42: when the long regime engages, use pullbacks toward anchored VWAP on the main pane for entries, with stops just beyond VWAP or a recent swing.
• Downside transition detection — Keep lower around −8…−12 and watch for crossunders; combine with price losing anchored VWAP to validate risk-off.
• Intraday bias filter — Day anchor on a 5–15m chart, N=20–30, upper ~ 16–20, lower ~ −6…−10. Only take longs while score is positive and above a midline you define (e.g., 0), and shorts only after a genuine crossunder.
Behavior around resets (important)
Anchored VWAP is hard-reset each period. Immediately after a reset, the series can be young and comparisons to pre-reset values may span two periods. If you prefer within-period evaluation only, choose end small enough not to bridge typical period length on your timeframe, or accept that the breadth test intentionally spans regimes.
Alerts included
• VWAP FL Long — Fires when the long condition is true (score > upper and not in short).
• VWAP FL Short — Fires on crossunder of the lower threshold (event-driven).
Messages include {{ticker}} and {{interval}} placeholders for routing.
Strengths
• Simple, transparent math — Easy to reason about and validate.
• Volume-aware by construction — Decisions reference VWAP, not just price.
• Robust to single-bar noise — Needs many lags to agree before flipping state (by design, via thresholds and the stateful output).
Limitations & cautions
• Threshold feasibility — If N < upper or |lower| > N, signals will never trigger; always cross-check N.
• Path dependence — The state variable persists until a new event; if you want frequent re-evaluation, lower thresholds or reduce N.
• Regime changes — Calendar resets can produce early ambiguity; expect a few bars for the breadth to mature.
• VWAP sensitivity to volume spikes — Large prints can tilt VWAP abruptly; that behavior is intentional in VWAP-based logic.
Suggested starting profiles
• Intraday trend bias : Anchor=Day, N=25 (1→25), upper=18–20, lower=−8, paint candles ON.
• Swing bias : Anchor=Month, N=45 (1→45), upper=38–42, lower=−10, VWAP coloring ON, background OFF.
• Balanced reactivity : Anchor=Week, N=30 (1→30), upper=20–22, lower=−10…−12, symmetric if desired.
Implementation notes
• The indicator runs in a separate pane (oscillator), but VWAP itself is drawn on price using forced overlay so you can see interactions (touches, reclaim/loss).
• HLC3 is used for VWAP price; that’s a common choice to dampen wick noise while still reflecting intrabar range.
• For-loop cap is kept modest (≤50) for performance and clarity.
How to use this responsibly
Treat the oscillator as a bias and persistence meter . Combine it with your entry framework (structure breaks, liquidity zones, higher-timeframe context) and risk controls. The design emphasizes clarity over complexity—its edge is in how strictly it demands agreement before declaring a regime, not in predicting specific turns.
Summary
VWAP For Loop distills the question “How broadly is the anchored, volume-weighted trend advancing or retreating?” into a single, thresholded score you can read at a glance, alert on, and color through your chart. With careful anchoring and thresholds sized to your window length, it becomes a pragmatic bias filter for both systematic and discretionary workflows.

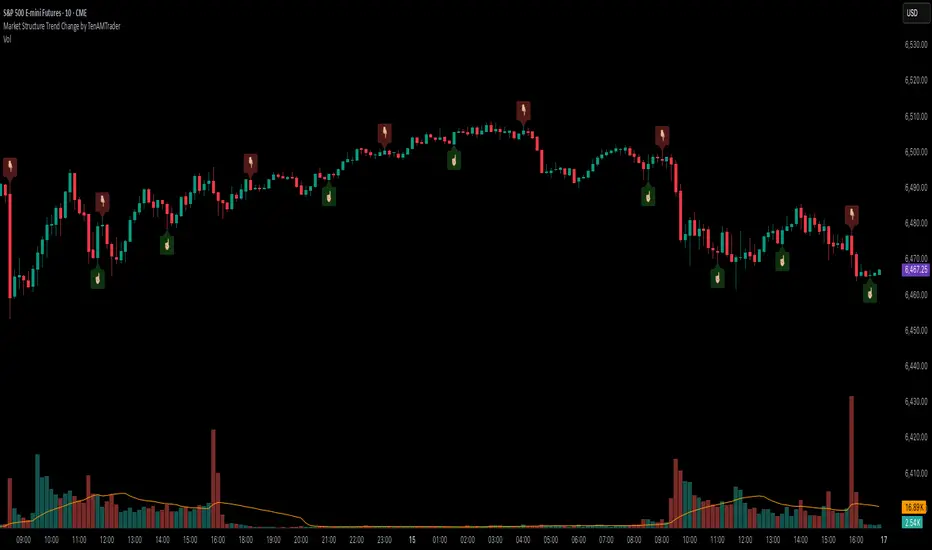
Market Structure Trend Change by TenAMTraderMarket Structure Trend Change Indicator
Description:
This indicator detects changes in market trend by analyzing swing highs and lows to identify Higher Highs (HH), Higher Lows (HL), Lower Highs (LH), and Lower Lows (LL). It helps traders quickly see potential reversals and trend continuation points.
Features:
Automatically identifies pivots based on configurable left and right bars.
Labels pivot points (HH, HL, LH, LL) directly on the chart (text-only for clarity).
Generates buy and sell signals when a trend change is detected:
Buy Signal: HL after repeated LLs.
Sell Signal: LH after repeated HHs.
Fully customizable signal appearance: arrow type, circle, label, color, and size.
Adjustable minimum number of repeated highs or lows before a trend change triggers a signal.
Alerts built in for automated notifications when buy/sell signals occur.
Default Settings:
Optimized for a 10-minute chart.
Default “Min repeats before trend change” and pivot left/right bars are set for typical 10-min price swings.
User Customization:
Adjust the “Pivot Left Bars,” “Pivot Right Bars,” and “Min repeats before trend change” to match your trading style, chart timeframe, and volatility.
Enable pivot labels for visual clarity if desired.
Set alerts to receive notifications of trend changes in real time.
How to Use:
Apply the indicator to any chart and timeframe. It works best on swing-trading or trend-following strategies.
Watch for Buy/Sell signals in conjunction with your other analysis, such as volume, support/resistance, or other indicators.
Legal Disclaimer:
This indicator is provided for educational and informational purposes only. It is not financial advice. Trading involves substantial risk, and past performance is not indicative of future results. Users should trade at their own risk and are solely responsible for any gains or losses incurred.
FlowScape PredictorFlowScape Predictor is a non-repainting, regime-aware entry qualifier that turns complex market context into two readiness scores (Long & Short, each 0/25/50/75/100) and clean, confirmed-bar signals. It blends three orthogonal pillars so you act only when trend energy, momentum, and location agree:
Regime (energy): ATR-normalized linear-regression slope of a smooth HMA → EMA baseline, gated by ADX to confirm when pressure is meaningful.
Momentum (push): RSI slope alignment so price has directional follow-through, not just drift.
Structure (location): proximity to pivot-confirmed swings, scaled by ATR, so “ready” appears near constructive pullbacks—not mid-trend chases.
A soft ATR cloud wraps the baseline for context. A yellow Predictive Baseline extends beyond the last bar to visualize near-term trajectory. It is visual-only: scores/alerts never use it.
What you see
Baseline line that turns green/red when regime is strong in that direction; gray when weak.
ATR cloud around the baseline (context for stretch and pullbacks).
Scores (Long & Short, 0–100 in steps of 25) and optional “L/S” icons on bar close.
Yellow Predictive Baseline that extends to the right for a few bars (visual trajectory of the smoothed baseline).
The scoring system (simple and transparent)
Each side (Long/Short) sums four binary checks, 25 points each:
Regime aligned: trendStrong is true and LR slope sign favors that side.
Momentum aligned: RSI side (>50 for Long, <50 for Short) and RSI slope confirms direction.
Baseline side: price is above (Long) / below (Short) the baseline.
Location constructive: distance from the last confirmed pivot is healthy (ATR-scaled; not overstretched).
Valid totals are 0, 25, 50, 75, 100.
Best-quality signal: 100/0 (your side/opposite) on bar close.
Good, still valid: 75/0, especially when the missing block is only “location” right as price re-engages the cloud/baseline.
Avoid: 75/25 or any opposition > 0 in a weak (gray) regime.
The Predictive (Kalman) line — what it is and isn’t
The yellow line is a visual forward extension of the smoothed baseline to help you see the current trajectory and time pullback resumptions. It does not predict price and is excluded from scores and alerts.
How it’s built (plain English):
We maintain a one-dimensional Kalman state x as a smoothed estimate of the baseline. Each bar we observe the current baseline z.
The filter adjusts its trust using the Kalman gain K = P / (P + R) and updates:
x := x + K*(z − x), then P := (1 − K)*P + Q.
Q (process noise): Higher Q → expects faster change → tracks turns quicker (less smoothing).
R (measurement noise): Higher R → trusts raw baseline less → smoother, steadier projection.
What you control:
Lead (how many bars forward to draw).
Kalman Q/R (visual smoothness vs. responsiveness).
Toggle the line on/off if you prefer a minimal chart.
Important: The predictive line extends the baseline, not price. It’s a visual timing aid—don’t automate off it.
How to use (step-by-step)
Keep the chart clean and use a standard OHLC/candlestick chart.
Read the regime: Prefer trades with green/red baseline (trendStrong = true).
Check scores on bar close:
Take Long 100 / Short 0 or Long 75 / Short 0 when the chart shows a tidy pullback re-engaging the cloud/baseline.
Mirror the logic for shorts.
Confirm location: If price is > ~1.5 ATR from its reference pivot, let it come back—avoid chasing.
Set alerts: Add an alert on Long Ready or Short Ready; these fire on closed bars only.
Risk management: Use ATR-buffered stops beyond the recent pivot; target fixed-R multiples (e.g., 1.5–3.0R). Manage the trade with the baseline/cloud if you trail.
Best-practice playbook (quick rules)
Green light: 100/0 (best) or 75/0 (good) on bar close in a colored (non-gray) regime.
Location first: Prefer entries near the baseline/cloud right after a pullback, not far above/below it.
Avoid mixed signals: Skip 75/25 and anything with opposition while the baseline is gray.
Use the yellow line with discretion: It helps you see rhythm; it’s not a signal source.
Timeframes & tuning (practical defaults)
Intraday indices/FX (5m–15m): Demand 100/0 in chop; allow 75/0 when ADX is awake and pullback is clean.
Crypto intraday (15m–1h): Prefer 100/0; 75/0 on the first pullback after a regime turn.
Swing (1h–4h/D1): 75/0 is often sufficient; 100/0 is excellent (fewer but cleaner signals).
If choppy: raise ADX threshold, raise the readiness bar (insist on 100/0), or lengthen the RSI slope window.
What makes FlowScape different
Energy-first regime filter: ATR-normalized LR slope + ADX gate yields a consistent read of trend quality across symbols and timeframes.
Location-aware entries: ATR-scaled pivot proximity discourages mid-air chases, encouraging pullback timing.
Separation of concerns: The predictive line is visual-only, while scores/alerts are confirmed on close for non-repainting behavior.
One simple score per side: A single 0–100 readiness figure is easier to tune than juggling multiple indicators.
Transparency & limitations
Scores are coarse by design (25-point blocks). They’re a gatekeeper, not a promise of outcomes.
Pivots confirm after right-side bars, so structure signals appear after swings form (non-repainting by design).
Avoid using non-standard chart types (Heikin Ashi, Renko, Range, etc.) for signals; use a clean, standard chart.
No lookahead, no higher-timeframe requests; alerts fire on closed bars only.

Trend+Volume Confluence IndicatorScalper and swing trading signals: use the 15–30 minute charts for scalps and the 4–8 hour charts for swings. Add the Money Flow Index (MFI) for extra confluence. In an uptrend, if the MFI is at or above the halfway mark and rising, take the long. In a downtrend, if the MFI is at or below the halfway mark and falling, take the short.

Gemini Trend Following SystemStrategy Description: The Gemini Trend Following System
Core Philosophy
This is a long-term trend-following system designed for a position trader or a patient swing trader, not a day trader. The fundamental goal is to capture the majority of a stock's major, multi-month or even multi-year uptrend.
The core principle is: "Buy weakness in a confirmed uptrend, and sell only when the uptrend's structure is fundamentally broken."
It operates on the belief that it's more profitable to ride a durable trend than to chase short-term breakouts or worry about daily price fluctuations. It prioritizes staying in a winning trade over frequent trading.
The Three Pillars of the Strategy
The script's logic is built on three distinct pillars, processed in order:
1. The Regime Filter: "Is This Stock in a Healthy Uptrend?"
Before even considering a trade, the script acts as a strict gatekeeper. It will only "watch" a stock if it meets all the criteria of a healthy, long-term uptrend. This is the most important part of the strategy as it filters out weak or speculative stocks.
A stock passes this filter if:
The 50-day Simple Moving Average (SMA) is above the 200-day SMA. This is the classic definition of a "Golden Cross" state, indicating the medium-term trend is stronger than the long-term trend—a hallmark of a bull market for the stock.
The stock's performance over the last year is positive. The Rate of Change (ROC) must be above a minimum threshold (e.g., 15%). This ensures we are only looking at stocks that have already demonstrated significant strength.
The 200-day SMA itself is rising. This is a crucial check to ensure the very foundation of the trend is solid and not flattening out or beginning to decline.
If a stock doesn't meet these conditions, the script ignores it completely.
2. The Entry Trigger: "When to Buy the Dip"
Once a stock is confirmed to be in a healthy uptrend, the script does not buy immediately. Instead, it patiently waits for a point of lower risk and higher potential reward—a pullback.
The entry trigger is a specific, two-step sequence:
The stock price first dips and closes below its 50-day SMA. This signifies a period of temporary weakness or profit-taking.
The price then recovers and closes back above the 50-day SMA within a short period (10 bars).
This sequence is a powerful signal. It suggests that institutional buyers view the 50-day SMA as a key support level and have stepped in to defend it, overpowering the sellers. The entry occurs at this point of confirmed support, marking the likely resumption of the uptrend. On the chart, this event is highlighted with a teal background.
3. The Exit Strategy: "When is the Trend Over?"
The exit logic is designed to keep you in the trade as long as possible and only sell when the trend's character has fundamentally changed. It uses a dual-exit system:
Primary Exit (Trend Failure): The main reason to sell is a "Death Cross"—when the 50-day SMA crosses below the 200-day SMA. This is a robust, albeit lagging, signal that the long-term uptrend is over and a bearish market structure is taking hold. This exit condition is designed to ignore normal market corrections and only trigger when the underlying trend has truly broken. On the chart, this is highlighted with a maroon background.
Safety-Net Exit (Catastrophic Stop-Loss): To protect against a sudden market crash or a company-specific disaster, a "safety-net" stop-loss is placed at the time of entry. This stop is set far below the entry price, typically underneath the 200-day SMA. It is a "just-in-case" measure that should only be triggered in a severe and rapid decline, protecting your capital from an unexpected black swan event.
Who is This Strategy For?
Position Traders: Investors who are comfortable holding a stock for many months to over a year.
Patient Swing Traders: Traders who want to capture large price swings over weeks and months, not days.
Investors using a Rules-Based Approach: Anyone looking to apply a disciplined, non-emotional system to their long-term portfolio.
Ideal Market Conditions
This strategy excels in markets with clear, durable trends. It performs best on strong, leading stocks during a sustained bull market. It will underperform significantly or generate losses in choppy, sideways, or range-bound markets, where the moving averages will frequently cross back and forth, leading to "whipsaw" trades.

BuySell-byALHELWANI🔱 BuySell-byALHELWANI | مؤشر التغيرات الاتجاهية الذكية
BuySell-byALHELWANI هو مؤشر احترافي متقدّم يرصد نقاط الانعكاس الحقيقية في حركة السوق، باستخدام خوارزمية تعتمد على تحليل القمم والقيعان الهيكلية للسعر (Structure-Based Detection) وليس على مؤشرات تقليدية.
المؤشر مبني على مكتبة signalLib_yashgode9 القوية، مع تخصيص كامل لأسلوب العرض والتنبيهات.
⚙️ ما يقدمه المؤشر:
🔹 إشارات واضحة للشراء والبيع تعتمد على كسر هيكل السوق.
🔹 تخصيص مرن للعمق والانحراف وخطوات التراجع (Backstep) لتحديد الدقة المطلوبة.
🔹 علامات ذكية (Labels) تظهر مباشرة على الشارت عند كل نقطة قرار.
🔹 تنبيهات تلقائية فورية عند كل تغير في الاتجاه (Buy / Sell).
🧠 الآلية المستخدمة:
DEPTH_ENGINE: يتحكم في مدى عمق النظر لحركة السعر.
DEVIATION_ENGINE: يحدد المسافة المطلوبة لتأكيد نقطة الانعكاس.
BACKSTEP_ENGINE: يضمن أن كل إشارة تستند إلى تغير هيكلي حقيقي في الاتجاه.
📌 المميزات:
✅ لا يعيد الرسم (No Repaint)
✅ يعمل على كل الأطر الزمنية وكل الأسواق (فوركس، مؤشرات، كريبتو، أسهم)
✅ تصميم بصري مرن (ألوان، حجم، شفافية)
✅ يدعم الاستخدام في السكالبينغ والسوينغ
ملاحظة:
المؤشر لا يعطي إشارات عشوائية، بل يستند إلى منطق السعر الحقيقي عبر تتبع التغيرات الحركية للسوق.
يُفضّل استخدامه مع خطة تداول واضحة وإدارة رأس مال صارمة.
🔱 BuySell-byALHELWANI | Smart Reversal Detection Indicator
BuySell-byALHELWANI is a high-precision, structure-based reversal indicator designed to identify true directional shifts in the market. Unlike traditional indicators, it doesn't rely on lagging oscillators but uses real-time swing analysis to detect institutional-level pivot points.
Powered by the robust signalLib_yashgode9, this tool is optimized for traders who seek clarity, timing, and strategic control.
⚙️ Core Engine Features:
🔹 Accurate Buy/Sell signals generated from structural highs and lows.
🔹 Adjustable sensitivity using:
DEPTH_ENGINE: Defines how deep the algorithm looks into past swings.
DEVIATION_ENGINE: Sets the deviation required to confirm a structural change.
BACKSTEP_ENGINE: Controls how many bars are validated before confirming a pivot.
🧠 What It Does:
🚩 Detects market structure shifts and confirms them visually.
🏷️ Plots clear Buy-point / Sell-point labels directly on the chart.
🔔 Sends real-time alerts when a directional change is confirmed.
🎯 No repainting – what you see is reliable and final.
✅ Key Benefits:
Works on all timeframes and all asset classes (FX, crypto, indices, stocks).
Fully customizable: colors, label size, transparency.
Ideal for scalping, swing trading, and strategy automation.
High visual clarity with minimal noise.
🔐 Note:
This script is designed for serious traders.
It highlights real market intent, especially when used with trendlines, zones, and volume analysis.
Pair it with disciplined risk management for best results.

BTC/USD Confluence Breakout Pro – IST EditionBTC/USD Confluence Breakout Pro – IST Edition is a multi-factor breakout trading system designed for intraday and swing traders.
It combines trend, momentum, price action, volume, and candlestick analysis with time-based volatility windows to deliver high-probability Buy/Sell signals.
Key Features:
Trend Filters: EMA 9/21 crossover + optional EMA 200 bias filter.
Price Action Breakouts: Detects closes above/below the last N bars’ range.
Candlestick Patterns: Bullish/Bearish engulfing, hammer, and shooting star.
Momentum Indicators: RSI (14) with configurable thresholds, MACD (12/26/9).
Volume Confirmation: Volume spike vs 20-period SMA.
IST Breakout Windows: Highlights Early London, London–US Overlap, and US Open momentum periods (Hyderabad/IST time). Optionally restricts signals to these windows.
Risk Management: ATR-based stop-loss + auto-plotted 1R, 2R, and 3R take-profit levels.
Visual Aids: EMA plots, bar coloring, shaded volatility windows, and clear entry/exit labels.
Alerts: Configurable alerts for both Buy and Sell signals.
Best Use:
Apply on 1m–15m charts for intraday trading or 1H–4H for swings.
Works best during high-volatility IST windows (London–US overlap & US open).
Ideal for BTC/USD but adaptable to other crypto or forex pairs.

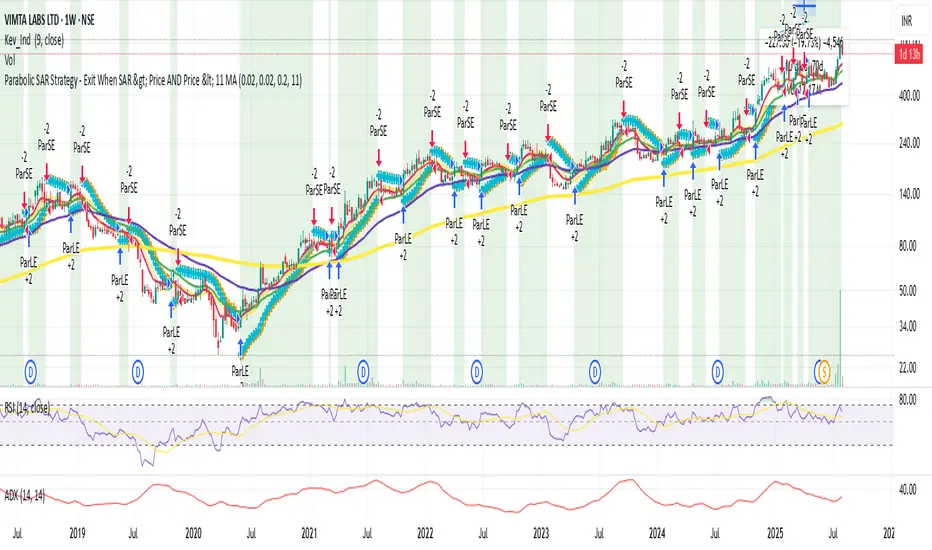
Parabolic SAR with Early Buy & MA-Based Exit Strategy📝 Strategy Description (Max SEO Impact)
This advanced Parabolic SAR-based trading strategy is designed to capture early trend reversals and exit intelligently using a dynamic moving average filter. It enters long trades when a PSAR reversal occurs, and exits only when the PSAR moves above price and the price falls below the 11-period SMA, helping avoid premature exits during volatile swings.
📌 Features:
• Custom Parabolic SAR calculation for refined trend tracking
• Background highlights during buy zones (SAR below price)
• Exit signals only when trend weakens (PSAR above + price under SMA)
• Red flag plotted on chart at exit bars for clear visual identification
• Works on all timeframes and instruments
Ideal for swing traders, trend followers, and strategy testers looking for smart PSAR-based entries with smoother exits.

SwingSignal RSI Overlay AdvancedSwingSignal RSI Overlay Advanced
By BFAS
This advanced indicator leverages the Relative Strength Index (RSI) to pinpoint critical market reversal points by highlighting key swing levels with intuitive visual markers.
Key Features:
Detects overbought and oversold levels with customizable RSI period and threshold settings.
Visually marks swing points:
Red star (HH) for Higher Highs.
Yellow star (LH) for Lower Highs.
Blue star (HL) for Higher Lows.
Green star (LL) for Lower Lows.
Connects swings with lines, aiding in the analysis of market structure.
Optimized for use on the main chart (overlay), tracking candles in real time.
This indicator provides robust visual support for traders aiming to identify price patterns related to RSI momentum, facilitating entry and exit decisions based on clear swing signals.

Internal Pivot Pattern [LuxAlgo]The Internal Pivot Pattern indicator is a novel method allowing traders to detect pivots without excessive delay on the chart timeframe, by using the lower timeframe data from a candle.
It features custom colors for candles and zigzag lines to help identify trends. A dashboard showing the accuracy of the pattern is also included.
🔶 USAGE
We define a pivot as the occurrence where the middle candle over a specific interval (for example, the most recent 21 bars) is the highest (pivot high) or the lowest (pivot low). This method commonly allows for identifying swing highs/lows on a trader's chart; however, this pattern can only be identified after a specific number of bars has been formed, rendering this pattern useless for real-time detection of swing highs/lows.
This indicator uses a different approach, removing the need to wait for candles to form on the user chart; instead, we check the lower timeframe data of the current candle and evaluate for the presence of a pivot given the internal data, effectively providing pivot confirmation at the candle close.
An internal pivot low pattern is indicative of a potential uptrend, while an internal pivot high is indicative of a potential downtrend.
Candles are colored based on the last internal pivot detected, with blue candle colors indicating that the most recent internal pivot is a pivot low, indicating an uptrend, while an orange candle color indicates that the most recent internal pivot is a pivot high, indicating a downtrend.
🔹 Timeframes
The timeframe setting allows controlling the amount of lower timeframe data to consider for the internal pivot detection. This setting must be lower than the user's chart timeframe.
Using a timeframe significantly lower than the user chart timeframe will evaluate a larger amount of data for the pivot detection, making it less frequent, while using a timeframe closer to the chart timeframe can make the internal pivot detection more frequent, and more prone to false positives.
🔹 Accuracy Dashboard
The Accuracy Dashboard allows evaluating how accurate the detected patterns are as a percentage, with a pattern being judged accurate if subsequent patterns are detected higher or lower than a previous one.
For example, an internal pivot low is judged accurate if the following internal pivot is higher than it, indicating that higher highs have been made.
This dashboard can be useful to determine the timeframe setting to maximize the respective internal pivot accuracy.
🔶 SETTINGS
Timeframe: Timeframe for detecting internal swings
Accuracy Dashboard: Enable or disable the Accuracy Dashboard.
🔹 Style
Internal Pivot High: Color of the dot displayed upon the detection of an internal pivot high
Internal Pivot Low: Color of the dot displayed upon the detection of an internal pivot low
Zig-Zag: Color of the zig-zag segments connecting each internal pivot
Candles: Enable candle coloring, with control over the color of the candles highlighting the detected trend

Advanced ICT Theory - A-ICT📊 Advanced ICT Theory (A-ICT): The Institutional Manipulation Detector
Are you tired of being the liquidity? Stop chasing shadows and start tracking the architects of price movement.
This is not another lagging indicator. This is a complete framework for viewing the market through the lens of institutional traders. Advanced ICT Theory (A-ICT) is an all-in-one, military-grade analysis engine designed to decode the complex language of "Smart Money." It automates the core tenets of Inner Circle Trader (ICT) methodology, moving beyond simple patterns to build a dynamic, real-time narrative of market manipulation, liquidity engineering, and institutional order flow.
AIT provides a living blueprint of the market, identifying high-probability zones, tracking structural shifts, and scoring the quality of setups with a sophisticated, multi-factor algorithm. This is your X-ray into the market's true intentions.
🔬 THE CORE ENGINE: DECODING THE THEORY & FORMULAS
A-ICT is built upon a sophisticated, multi-layered logic system that interprets price action as a story of cause and effect. It does not guess; it confirms. Here is the foundational theory that drives the engine:
1. Market Structure: The Blueprint of Trend
The script first establishes a deep understanding of the market's skeleton through multi-level pivot analysis. It uses ta.pivothigh and ta.pivotlow to identify significant swing points.
Internal Structure (iBOS): Minor swings that show the short-term order flow. A break of internal structure is the first whisper of a potential shift.
External Structure (eBOS): Major swing points that define the primary trend. A confirmed break of external structure is a powerful statement of trend continuation. AIT validates this with optional Volume Confirmation (volume > volumeSMA * 1.2) and Candle Confirmation to ensure the break is driven by institutional force, not just a random spike.
Change of Character (CHoCH): This is the earthquake. A CHoCH occurs when a confirmed eBOS happens against the prevailing trend (e.g., a bearish eBOS in a clear uptrend). A-ICT flags this immediately, as it is the strongest signal that the primary trend is under threat of reversal.
2. Liquidity Engineering: The Fuel of the Market
Institutions don't buy into strength; they buy into weakness. They need liquidity. A-ICT maps these liquidity pools with forensic precision:
Buyside & Sellside Liquidity (BSL/SSL): Using ta.highest and ta.lowest, AIT identifies recent highs and lows where clusters of stop-loss orders (liquidity) are resting. These are institutional targets.
Liquidity Sweeps: This is the "manipulation" part of the detector. AIT has a specific formula to detect a sweep: high > bsl and close < bsl . This signifies that institutions pushed price just high enough to trigger buy-stops before aggressively selling—a classic "stop hunt." This event dramatically increases the quality score of subsequent patterns.
3. The Element Lifecycle: From Potential to Power
This is the revolutionary heart of A-ICT. Zones are not static; they have a lifecycle. AIT tracks this with its dynamic classification engine.
Phase 1: PENDING (Yellow): The script identifies a potential zone of interest based on a specific candle formation (a "displacement"). It is marked as "Pending" because its true nature is unknown. It is a question.
Phase 2: CLASSIFICATION: After the zone is created, AIT watches what happens next. The zone's identity is defined by its actions:
ORDER BLOCK (Blue): The highest-grade element. A zone is classified as an Order Block if it directly causes a Break of Structure (BOS) . This is the footprint of institutions entering the market with enough force to validate the new trend direction.
TRAP ZONE (Orange): A zone is classified as a Trap Zone if it is directly involved in a Liquidity Sweep . This indicates the zone was used to engineer liquidity, setting a "trap" for retail traders before a reversal.
REVERSAL / S&R ZONE (Green): If a zone is not powerful enough to cause a BOS or a major sweep, but still serves as a pivot point, it's classified as a general support/resistance or reversal zone.
4. Market Inefficiencies: Gaps in the Matrix
Fair Value Gaps (FVG): AIT detects FVGs—a 3-bar pattern indicating an imbalance—with a strict formula: low > high (for a bullish FVG) and gapSize > atr14 * 0.5. This ensures only significant, volatile gaps are shown. An FVG co-located with an Order Block is a high-confluence setup.
5. Premium & Discount: The Law of Value
Institutions buy at wholesale (Discount) and sell at retail (Premium). AIT uses a pdLookback to define the current dealing range and divides it into three zones: Premium (sell zone), Discount (buy zone), and Equilibrium. An element's quality score is massively boosted if it aligns with this principle (e.g., a bullish Order Block in a Discount zone).
⚙️ THE CONTROL PANEL: A COMPLETE GUIDE TO THE INPUTS MENU
Every setting is a lever, allowing you to tune the AIT engine to your exact specifications. Master these to unlock the script's full potential.
🎯 A-ICT Detection Engine
Min Displacement Candles: Controls the sensitivity of element detection. How it works: It defines the number of subsequent candles that must be "inside" a large parent candle. Best practice: Use 2-3 for a balanced view on most timeframes. A higher number (4-5) will find only major, more significant zones, ideal for swing trading. A lower number (1) is highly sensitive, suitable for scalping.
Mitigation Method: Defines when a zone is considered "used up" or mitigated. How it works: Cross triggers as soon as price touches the zone's boundary. Close requires a candle to fully close beyond it. Best practice: Cross is more responsive for fast-moving markets. Close is more conservative and helps filter out fake-outs caused by wicks, making it safer for confirmations.
Min Element Size (ATR): A crucial noise filter. How it works: It requires a detected zone to be at least this multiple of the Average True Range (ATR). Best practice: Keep this around 0.5. If you see too many tiny, irrelevant zones, increase this value to 0.8 or 1.0. If you feel the script is missing smaller but valid zones, decrease it to 0.3.
Age Threshold & Pending Timeout: These manage visual clutter. How they work: Age Threshold removes old, mitigated elements after a set number of bars. Pending Timeout removes a "Pending" element if it isn't classified within a certain window. Best practice: The default settings are optimized. If your chart feels cluttered, reduce the Age Threshold. If pending zones disappear too quickly, increase the Pending Timeout.
Min Quality Threshold: Your primary visual filter. How it works: It hides all elements (boxes, lines, labels) that do not meet this minimum quality score (0-100). Best practice: Start with the default 30. To see only A- or B-grade setups, increase this to 60 or 70 for an exceptionally clean, high-probability view.
🏗️ Market Structure
Lookbacks (Internal, External, Major): These define the sensitivity of the trend analysis. How they work: They set the number of bars to the left and right for pivot detection. Best practice: Use smaller values for Internal (e.g., 3) to see minor structure and larger values for External (e.g., 10-15) to map the main trend. For a macro, long-term view, increase the Major Swing Lookback.
Require Volume/Candle Confirmation: Toggles for quality control on BOS/CHoCH signals. Best practice: It is highly recommended to keep these enabled. Disabling them will result in more structure signals, but many will be false alarms. They are your filter against market noise.
... (Continue this detailed breakdown for every single input group: Display Configuration, Zones Style, Levels Appearance, Colors, Dashboards, MTF, Liquidity, Premium/Discount, Sessions, and IPDA).
📊 THE INTELLIGENCE DASHBOARDS: YOUR COMMAND CENTER
The dashboards synthesize all the complex analysis into a simple, actionable intelligence briefing.
Main Dashboard (Bottom Right)
ICT Metrics & Breakdown: This is your statistical overview. Total Elements shows how much structure the script is tracking. High Quality instantly tells you if there are any A/B grade setups nearby. Unmitigated vs. Mitigated shows the balance of fresh opportunities versus resolved price action. The breakdown by Order Blocks, Trap Zones, etc., gives you a quick read on the market's recent character.
Structure & Market Context: This is your core bias. Order Flow tells you the current script-determined trend. Last BOS shows you the most recent structural event. CHoCH Active is a critical warning. HTF Bias shows if you are aligned with the higher timeframe—the checkmark (✓) for alignment is one of the most important confluence factors.
Smart Money Flow: A volume-based sentiment gauge. Net Flow shows the raw buying vs. selling pressure, while the Bias provides an interpretation (e.g., "STRONG BULLISH FLOW").
Key Guide (Large Dashboard only): A built-in legend so you never have to guess. It defines every pattern, structure type, and special level visually.
📖 Narrative Dashboard (Bottom Left)
This is the "story" of the market, updated in real-time. It's designed to build your trading thesis.
Recent Elements Table: A live list of the most recent, high-quality setups. It displays the Type , its Narrative Role (e.g., "Bullish OB caused BOS"), its raw Quality percentage, and its final Trade Score grade. This is your at-a-glance opportunity scanner.
Market Narrative Section: This is the soul of A-ICT. It combines all data points into a human-readable story:
📍 Current Phase: Tells you if you are in a high-volatility Killzone or a consolidation phase like the Asian Range.
🎯 Bias & Alignment: Your primary direction, with a clear indicator of HTF alignment or conflict.
🔗 Events: A causal sequence of recent events, like "💧 Sell-side liquidity swept →
📊 Bullish BOS → 🎯 Active Order Block".
🎯 Next Expectation: The script's logical conclusion. It provides a specific, forward-looking hypothesis, such as "📉 Pullback expected to bullish OB at 1.2345 before continuation up."
🎨 READING THE BATTLEFIELD: A VISUAL INTERPRETATION GUIDE
Every color and line is a piece of information. Learn to read them together to see the full picture.
The Core Zones (Boxes):
Blue Box (Order Block): Highest probability zone for trend continuation. Look for entries here.
Orange Box (Trap Zone): A manipulation footprint. Expect a potential reversal after price interacts with this zone.
Green Box (Reversal/S&R): A standard pivot area. A good reference point but requires more confluence.
Purple Box (FVG): A market imbalance. Acts as a magnet for price. An FVG inside an Order Block is an A+ confluence.
The Structural Lines:
Green/Red Line (eBOS): Confirms the trend direction. A break above the green line is bullish; a break below the red line is bearish.
Thick Orange Line (CHoCH): WARNING. The previous trend is now in question. The market character has changed.
Blue/Red Lines (BSL/SSL): Liquidity targets. Expect price to gravitate towards these lines. A dotted line with a checkmark (✓) means the liquidity has been "swept" or "purged."
How to Synthesize: The magic is in the confluence. A perfect setup might look like this: Price sweeps below a red SSL line , enters a green Discount Zone during the NY Killzone , and forms a blue Order Block which then causes a green eBOS . This sequence, visible at a glance, is the story of a high-probability long setup.
🔧 THE ARCHITECT'S VISION: THE DEVELOPMENT JOURNEY
A-ICT was forged from the frustration of using lagging indicators in a market that is forward-looking. Traditional tools are reactive; they tell you what happened. The vision for A-ICT was to create a proactive engine that could anticipate institutional behavior by understanding their objectives: liquidity and efficiency. The development process was centered on creating a "lifecycle" for price patterns—the idea that a zone's true meaning is only revealed by its consequence. This led to the post-breakout classification system and the narrative-building engine. It's designed not just to show you patterns, but to tell you their story.
⚠️ RISK DISCLAIMER & BEST PRACTICES
Advanced ICT Theory (A-ICT) is a professional-grade analytical tool and does not provide financial advice or direct buy/sell signals. Its analysis is based on historical price action and probabilities. All forms of trading involve substantial risk. Past performance is not indicative of future results. Always use this tool as part of a comprehensive trading plan that includes your own analysis and a robust risk management strategy. Do not trade based on this indicator alone.
観の目つよく、見の目よわく
"Kan no me tsuyoku, ken no me yowaku"
— Miyamoto Musashi, The Book of Five Rings
English: "Perceive that which cannot be seen with the eye."
— Dskyz, Trade with insight. Trade with anticipation.

Fibonacci Range Detector ║ BullVision🔬 Overview
The Fibonacci Range Mapper is a dynamic technical tool designed to identify, track, and visualize price ranges using Fibonacci levels. Whether you're trading manually or prefer automated structure recognition, this indicator helps you contextualize market moves and locate key price zones with precision.
⚙️ Core Logic
🔍 Range Detection (Auto & Manual Modes)
In Auto mode, the indicator uses an advanced ZigZag system based on ATR or percentage thresholds to confirm market swings and construct Fibonacci-based ranges.
In Manual mode, traders can define their own swing low and high to generate precise custom ranges.
📐 Fibonacci Mapping
Each detected range is automatically plotted with key Fibonacci retracement levels — 0%, 25%, 50%, 75%, 100% — along with optional extensions (127.2% and 161.8%) to anticipate price continuations or reversals.
📋 Live Data Table
An integrated info panel dynamically displays crucial metrics:
• Range size
• Current price zone (Discount / Mid / Premium)
• Position within range (%)
• Distance to range extremes
• Range status (Pending or Confirmed)
🕰️ Historical Memory
Up to 20 past ranges can be stored and visualized simultaneously, helping traders recognize repeated price behaviors and contextual support/resistance levels.
🎨 Visual Highlights
Zones of interest (0–25% = Discount, 75–100% = Premium) are color-coded with custom transparency, and labels can be toggled for clarity. The current active range updates in real time as structure evolves.
🔧 User Customization
• Detection Method: Choose between ATR or % ZigZag for automated swing identification
• Confirmation Delay: Set how many bars to wait before confirming a new high
• Manual Overrides: Select exact price levels when you want full control
• Extensions & Labels: Toggle additional lines and info to suit your charting style
• Visual Table Position: Customize where the data table appears on screen
• Color Scheme: Define your own zone gradients for better visual interpretation
📈 Use Cases
This indicator is ideal for traders who want to:
• Identify value zones within local or macro price structures
• Plan trades around Fibonacci retracement and extension levels
• Detect shifts in market structure using an adaptive ZigZag logic
• Track recurring price ranges and historical reaction points
• Enhance technical confluence with clean, visual price mapping
⚠️ Important Notes
This tool is not a buy/sell signal generator — it is a visual framework for structure-based analysis.
Use it in conjunction with your existing strategy and risk management process.
Always confirm with broader context and multi-timeframe alignment.

WT + Stoch RSI Reversal Combo📊MR.Z RSI : WT + Stochastic RSI Reversal Combo
This custom indicator combines WaveTrend oscillator and Stochastic RSI to detect high-confidence market reversal points, filtering signals so they only appear when both indicators align.
🔍 Core Components:
✅ WaveTrend Oscillator
Based on smoothed deviation from EMA (similar to TCI logic)
Plots:
WT1 (main line)
WT2 (signal line = SMA of WT1)
Uses overbought/oversold thresholds (default: ±53) to filter signals
✅ Stochastic RSI
Momentum oscillator based on RSI's stochastic value
Plots:
%K: smoothed Stoch of RSI
%D: smoothed version of %K
Adjustable oversold/overbought thresholds (default: 20/80)
🔁 Combined Reversal Signal Logic:
🔼 Buy Signal
WT1 crosses above WT2 below WT oversold level (e.g., -53)
%K crosses above %D below Stoch RSI oversold level (e.g., 20)
🔽 Sell Signal
WT1 crosses below WT2 above WT overbought level (e.g., 53)
%K crosses below %D above Stoch RSI overbought level (e.g., 80)
🔔 Signals are only plotted and alerted if both conditions are true.
📌 Features:
Toggle on/off:
WaveTrend lines and histogram
Stochastic RSI
Combined Buy/Sell signals
Horizontal reference lines (±100, OB/OS)
Fully customizable smoothing lengths and thresholds
Signal plots:
✅ Green up-triangle = Combo Buy
✅ Red down-triangle = Combo Sell
Optional: Circle/cross markers for WT-only and Stoch-only signals
🔔 Built-in alerts for Buy/Sell signals
📈 Use Cases:
Reversal Trading: Wait for both indicators to confirm momentum shift
Entry Filter: Use in combination with trend indicators (like EMA)
Scalping or Swing: Works on intraday and higher timeframes

The Kyber Cell's – TTM Wave CThe Kyber Cell’s Wave C – TTM Squeeze Macro Bias & Structural Filter
⸻
1. Introduction
Wave C is the strategic compass in the TTM Squeeze Wave system — the final layer that helps you align with the larger trend or macro context. While Wave A delivers momentum bursts and Wave B confirms active trend direction, Wave C filters trades through a broader lens, helping you avoid taking strong intraday setups that go against the dominant structure.
Wave C is designed to act as your macro bias validator — filtering out trades that contradict higher-timeframe flows or major moving average slopes. When all three waves line up, you’re no longer just reacting to signals — you’re trading with intention and structure. When in doubt, zoom out and that is what Wave C gives you.
⸻
2. Core Concept and Calculation
Wave C is built to measure high-level trend bias, either on the current chart timeframe or derived from a higher timeframe (HTF). Its logic is based on one or more of the following structural tools:
• Long-term EMA slope (e.g., 55, 89, or 200 EMA)
• HTF VWAP positioning (price above or below)
• Long-period HMA slope (e.g., HMA 144 or HMA 233)
• Directional bias from HTF TTM Squeeze or MTF trend engine
Unlike Wave A and B, which may fluctuate during normal price swings, Wave C changes more slowly. That’s the point — it gives a “big picture” backdrop against which all lower-level signals should be evaluated. It reduces false positives and helps you wait for trades in the direction of the broader trend.
⸻
3. Visual Output and Color Logic
Wave C uses a simple and deliberate color scheme to communicate macro alignment:
• Green: Bullish macro structure
• Red: Bearish macro structure
• Gray: Neutral, indecisive, or flat macro trend
This muted but firm logic encourages patient, structured trading. The goal isn’t to trigger trades directly from Wave C, but to filter out trades that contradict market posture.
• When Wave C is Green, you ideally want Wave B to be blue and Wave A to turn cyan before going long.
• When Wave C is Red, you look for Wave B to be red and Wave A to turn bright red before shorting.
• If Wave C is Gray, it may signal choppy, indecisive structure — use caution or reduce trade size.
⸻
4. Ideal Use Case
Wave C functions as your global bias filter:
1. Set your directional bias for the session or week.
2. Only take trades that agree with Wave C direction.
3. When all waves align, trade with size and confidence.
4. When Wave C disagrees, wait or downshift your trade plan.
This makes Wave C especially valuable for swing traders, position traders, or intraday traders who want to anchor their entries within a broader trend.
⸻
5. Configuration and Customization
Wave C is built with advanced users in mind, and its configuration allows multiple structural methods:
• EMA Slope Method: Set EMA length and threshold angle
• HTF Source Method: Request HTF data for squeeze trend, VWAP, or Wave B analog
• HMA Trend Filter: Longer-term smoothing to detect sustained directional flow
• Color Preferences: Customize green/red/gray scheme as needed
This flexibility allows you to tailor Wave C to your strategy — whether you’re anchoring to a Daily EMA while scalping the 5-minute chart, or aligning swing entries with the Weekly VWAP.
⸻
6. Alerts and Add-ons
Although Wave C isn’t typically used for alerts, it can be incorporated into confluence-based alert stacks. For example:
• Alert only when Wave C = Green, Wave B = Blue, and Wave A = Rising
• Alert on macro flip (e.g., Green → Red) as a possible regime change
• Alert when macro bias agrees with MTF Squeeze Panel bias
These setups are more advanced but help automate disciplined trade selection.
⸻
7. Disclaimer
This indicator is for educational and research purposes only. It is not trading advice. Wave C is most effective when used in conjunction with Wave A, Wave B, and other structural context. All trades should be executed with proper risk management and backtested methodology.

Alma SD SuperTrend | OquantAlma SD SuperTrend | Oquant
The "Alma SD SuperTrend | Oquant" is a trend-following indicator that integrates the Arnaud Legoux Moving Average (ALMA) with a SuperTrend calculation based on standard deviation (SD). Designed to quickly identify and follow market trends while reducing noise, this script provides buy and sell signals for traders across various assets and timeframes.
This script offers a unique approach by combining ALMA with a SuperTrend framework that uses standard deviation instead of the traditional Average True Range (ATR). This implementation focuses on fast trend detection with minimized noise, making it suitable for trend-following or swing trading strategies. The script’s customizable parameters allow traders to adapt it to their preferred trading style.
How It Works
Arnaud Legoux Moving Average (ALMA): ALMA is an advanced moving average that applies a Gaussian filter to smooth price data, reducing market noise while preserving responsiveness to price changes. It uses three parameters:
Length: Sets the lookback period for smoothing. Longer periods produce smoother results.
Offset: Shifts the moving average toward recent prices. Higher offsets emphasize newer data for faster trend detection.
Sigma controls the smoothness and lag of the Alma by adjusting the spread of the Gaussian distribution used in the calculation.
Standard Deviation (SD) Calculation: The script calculates the standard deviation of the price over a specified period to measure volatility. SD measures how much the prices deviate from its mean, offering a statistical perspective on market volatility. This is used to create dynamic upper and lower bands around the ALMA line, adjusted by a user-defined factor. The bands expand in volatile markets and contract in stable conditions, helping in trend detection.
SuperTrend Logic: The script generates a SuperTrend line that dynamically tracks market trends by switching between upper and lower volatility bands based on price movement. Here's how it works:
The SuperTrend line is calculated using the ALMA (Arnaud Legoux Moving Average) as a baseline, with upper and lower bands created by adding and subtracting a multiple(Factor) of the standard deviation (SD) from the ALMA.
When the price moves above the upper band, the SuperTrend line shifts to the lower band, indicating a bullish trend (potential buy signal).
When the price falls below the lower band, the SuperTrend line switches to the upper band, signaling a bearish trend (potential sell signal).
To avoid quick, unreliable changes, this script intelligently adjusts the SuperTrend bands for stability. While the SuperTrend line dynamically follows market movements, it's designed to hold at its previous level if the price doesn't cross a band or confirm a new trend direction. This approach ensures the SuperTrend quickly identifies and follows genuine market trends, providing clear signals while effectively reducing false alerts from short-term price swings.
Differences from Traditional SuperTrend:
Baseline: The traditional SuperTrend typically uses a hl2((high + low)/2)as its baseline, while this script employs ALMA for a smoother, noise-filtered trend foundation.
Volatility Measure: Instead of ATR, this script uses standard deviation to calculate the bands. Standard deviation measures how much the prices vary or spread out from its mean.
Visualization: The script plots the SuperTrend line, colors candles to match the trend, and fills the area between the price and the SuperTrend line for visual clarity, helping traders quickly identify trend direction and strength (green for bullish, purple for bearish).
How to Use It
Add to Chart: Apply the indicator to any market and timeframe.
Interpret Signals:
Green Line and Candles: Bullish trend (price above the SuperTrend line). Consider long entries.
Purple Line and Candles: Bearish trend (price below the SuperTrend line). Consider short entries.
Filled Area: The shaded area between price and the SuperTrend line highlights trend direction(green for bullish, purple for bearish).
Adjust Inputs:
Source: Select the price data to use (e.g., close, open, high, low).
Factor: Adjusts band width. Higher values widen bands, reducing sensitivity.
SD Length: Period for calculating standard deviation. Longer periods smooth volatility.
ALMA Length: Period for ALMA. Longer periods increase smoothness.
Alma Offset: Shift the moving average toward recent or older prices. Higher offsets emphasize newer data for faster trend detection.
ALMA Sigma control the smoothness and lag of the Alma by adjusting the spread of the Gaussian distribution used in the calculation.
Alerts
This indicator includes optional built-in alert conditions that notify you when the signal crosses above 0 (long signal, price above upper band) or below 0 (short signal, price below lower band). Enable these alerts to get timely updates on potential trend shifts without constantly monitoring the chart.
⚠️ Disclaimer: This indicator is intended for educational and informational purposes only. Trading/investing involves risk, and past performance does not guarantee future results. Always test and evaluate indicators/strategies before applying them in live markets. Use at your own risk.

Pattern Detector [theUltimator5]🎯 Overview
The Pattern Detector is a comprehensive technical analysis indicator that automatically identifies and visualizes multiple pattern types on your charts. Built with advanced ZigZag technology and sophisticated pattern recognition algorithms, this tool helps traders spot high-probability trading opportunities across all timeframes and markets.
✨ Key Features
🔍 Multi-Pattern Detection System
Harmonic Patterns: Butterfly, Gartley, Bat, and Crab patterns with precise Fibonacci ratios
Classic Reversal Patterns: Head & Shoulders and Inverse Head & Shoulders
Double Patterns: Double Tops and Double Bottoms with extreme validation
Wedge Patterns: Rising and Falling Wedges with volume confirmation
📊 Advanced ZigZag Engine
Customizable sensitivity (5-50 levels)
Depth multiplier for multi-timeframe analysis
Real-time pivot detection with noise filtering
Option to display ZigZag lines only for pure price action analysis
🎨 Visualization
Clean pattern lines with distinct color coding
Point labeling system (X, A, B, C, D for harmonics / LS, H, RS for H&S)
Pattern name displays with bullish/bearish direction
Price target projections with arrow indicators
Subtle pattern fills for enhanced visibility
🛠️ Settings & Configuration
Core ZigZag Settings
ZigZag Sensitivity (5-50): Controls pattern detection sensitivity. Lower values detect more patterns but may include noise. Higher values focus on major swings only.
ZigZag Depth Multiplier (1-5): Multiplies sensitivity for deeper analysis. Level 1 = most responsive, Level 5 = major swings only.
Pattern Detection Toggles
Show ZigZag Lines Only: Displays pure ZigZag without pattern detection for price structure analysis
Detect Harmonic Patterns: Enable/disable Fibonacci-based harmonic pattern detection
Detect Head & Shoulders: Toggle classic reversal pattern identification
Detect Double Tops/Bottoms: Enable double pattern detection with extreme validation
Detect Wedge Patterns: Toggle wedge pattern detection with volume confirmation
Display Options
Show Pattern Names: Display pattern names directly on chart (e.g., "Butterfly (Bullish)")
Show Point Labels: Add lettered labels at key pattern points for structure identification
Project Harmonic Targets: Show projected completion points for incomplete harmonic patterns
📈 Pattern Types Explained
Harmonic Patterns 🦋
Advanced Fibonacci-based patterns that provide high-probability reversal signals:
Butterfly: AB=0.786 XA, BC=0.382-0.886 AB, CD=1.618-2.24 BC
Gartley: AB=0.618 XA, BC=0.382-0.886 AB, CD=1.272-1.618 BC
Bat: AB=0.382-0.50 XA, BC=0.382-0.886 AB, CD=1.618-2.24 BC
Crab: AB=0.382-0.618 XA, BC=0.382-0.886 AB, CD=2.24-3.618 BC
Head & Shoulders 👤
Classic three-peak reversal pattern indicating trend exhaustion:
Standard H&S: Bearish reversal at tops
Inverse H&S: Bullish reversal at bottoms
Automatic neckline validation and price target calculation
Double Patterns 📊
Powerful reversal patterns with extreme validation:
Double Top: Two similar highs with valley between (bearish)
Double Bottom: Two similar lows with peak between (bullish)
Includes lookback period validation to ensure patterns are significant extremes
Wedge Patterns 📐
Continuation/reversal patterns with converging trend lines:
Rising Wedge: Converging upward slopes (typically bearish)
Falling Wedge: Converging downward slopes (typically bullish)
Volume confirmation required for increased accuracy
🎯 Trading Applications
Entry Signals
Harmonic Patterns: Enter at point D completion with targets at point A
H&S Patterns: Enter on neckline break with calculated targets
Double Patterns: Enter on support/resistance break with measured moves
Wedge Patterns: Enter on breakout direction with volume confirmation
Risk Management
Use pattern structure for logical stop placement
Pattern invalidation levels provide clear exit rules
Multiple pattern confirmation increases probability
Multi-Timeframe Analysis
Higher ZigZag depth for longer-term patterns
Lower sensitivity for short-term trading patterns
Combine with other timeframes for confluence
⚙️ Optimal Settings
For Day Trading (1m-15m charts)
ZigZag Sensitivity: 5-9
Depth Multiplier: 1-2
Enable all pattern types for maximum opportunities
For Swing Trading (1H-4H charts)
ZigZag Sensitivity: 9-15
Depth Multiplier: 2-3
Focus on harmonic and H&S patterns
For Position Trading (Daily+ charts)
ZigZag Sensitivity: 15-25
Depth Multiplier: 3-5
Emphasize major harmonic and double patterns
🔧 Technical Specifications
Maximum Lookback: 5000 bars for comprehensive analysis
Pattern Overlap Prevention: Intelligent filtering prevents duplicate patterns
Performance Optimized: Efficient algorithms for real-time detection
Volume Integration: Advanced volume analysis for wedge confirmation
Fibonacci Precision: 10% tolerance for harmonic ratio validation
📚 How to Use
Add to Chart: Apply indicator to any timeframe/market
Configure Settings: Adjust sensitivity based on trading style
Enable Patterns: Toggle desired pattern types
Analyze Results: Look for completed patterns with clear structure
Plan Trades: Use price targets and pattern invalidation for trade management
Perfect for both novice and experienced traders seeking systematic pattern recognition with visualization and entry/exit signals.

All SMAs Bullish/Bearish Screener (Enhanced)All SMAs Bullish/Bearish Screener Enhanced: Uncover High-Conviction Trend Alignments with Confidence
Description:
Are you ready to elevate your trading from mere guesswork to precise, data-driven decisions? The "All SMAs Bullish/Bearish Screener Enhanced" is not just another indicator; it's a sophisticated, yet user-friendly, trend-following powerhouse designed to cut through market noise and pinpoint high-probability trading opportunities. Built on the foundational strength of comprehensive Moving Average confluence and fortified with critical confirmation signals from Momentum, Volume, and Relative Strength, this script empowers you to identify truly robust trends and manage your trades with unparalleled clarity.
The Power of Multi-Factor Confluence: Beyond Simple Averages
In the unpredictable world of financial markets, true strength or weakness is rarely an isolated event. It's the harmonious alignment of multiple technical factors that signals a high-conviction move. While our original "All SMAs Bullish/Bearish Screener" intelligently identified stocks where price was consistently above or below a full spectrum of Simple Moving Averages (5, 10, 20, 50, 100, 200), this Enhanced version takes it a crucial step further.
We've integrated a powerful three-pronged confirmation system to filter out weaker signals and highlight only the most compelling setups:
Momentum (Rate of Change - ROC): A strong trend isn't just about price direction; it's about the speed and intensity of that movement. Positive momentum confirms that buyers are still aggressively pushing price higher (for bullish signals), while negative momentum validates selling pressure (for bearish signals).
Volume: No trend is truly trustworthy without the backing of smart money. Above-average volume accompanying an "All SMAs" alignment signifies strong institutional participation and conviction behind the move. It separates genuine trend starts from speculative whims.
Relative Strength Index (RSI): This versatile oscillator ensures the trend isn't just "there," but that it's developing healthily. We use RSI to confirm a bullish bias (above 50) or a bearish bias (below 50), adding another layer of confidence to the direction.
When the price aligns above ALL six critical SMAs, and is simultaneously confirmed by robust positive momentum, healthy volume, and a bullish RSI bias, you have an exceptionally strong "STRONGLY BULLISH" signal. This confluence often precedes sustained upward moves, signaling prime accumulation phases. Conversely, a "STRONGLY BEARISH" signal, where price is below ALL SMAs with negative momentum, confirming volume, and a bearish RSI bias, indicates powerful distribution and potential for significant downside.
How to Use This Enhanced Screener:
Add to Chart: Go to TradingView's Pine Editor, paste the script, and click "Add to Chart."
Customize Parameters: Fine-tune the lengths of your SMAs, RSI, Momentum, and Volume averages via the indicator's settings. Experiment to find what best suits your trading style and the assets you trade.
Choose Your Timeframe Wisely:
Daily (1D) and 4-Hour (240 min) are highly recommended. These timeframes cut through intraday noise and provide more reliable, actionable signals for swing and position trading.
Shorter timeframes (e.g., 15min, 60min) can be used by advanced day traders for very short-term entries, but be aware of increased volatility and noise.
Visual Confirmation:
Green/Red Triangles: Appear on your chart, indicating confirmed bullish or bearish signals.
Background Color: The chart background will subtly turn lime green for "STRONGLY BULLISH" and red for "STRONGLY BEARISH" conditions.
On-Chart Status Table: A clear table displays the current signal status ("STRONGLY BULLISH/BEARISH," or "SMAs Mixed") for immediate feedback.
Set Up Alerts (Your Primary Screener Tool): This is the game-changer! Create custom alerts on TradingView based on the "Confirmed Bullish Trade" and "Confirmed Bearish Trade" conditions. Receive instant notifications (email, pop-up, mobile) for any stock in your watchlist that meets these stringent criteria. This allows you to scan the entire market effortlessly and act decisively.
Strategic Stop-Loss Placement: The Trader's Lifeline
Even the most robust signals can fail. Protecting your capital is paramount. For this trend-following strategy, your stop-loss should be placed where the underlying trend structure is broken.
For a "STRONGLY BULLISH" Trade: Place your stop-loss just below the most recent significant swing low (higher low). This is the last point where buyers stepped in to support the price. If price breaks below this, your bullish thesis is invalidated.
For a "STRONGLY BEARISH" Trade: Place your stop-loss just above the most recent significant swing high (lower high). If price breaks above this, your bearish thesis is invalidated.
Alternatively, consider placing your stop-loss just below the 20-period SMA (for bullish trades) or above the 20-period SMA (for bearish trades). A significant close beyond this intermediate-term average often indicates a critical shift in momentum. Always ensure your chosen stop-loss adheres to your pre-defined risk per trade (e.g., 1-2% of capital).
Disciplined Profit Booking: Maximizing Gains
Just as important as knowing when you're wrong is knowing when to take profits.
Trailing Stop-Loss: As your trade moves into profit, trail your stop-loss upwards (for longs) or downwards (for shorts). You can trail it using:
Previous Swing Lows/Highs: Move your stop to just below each new higher low (for longs) or just above each new lower high (for shorts).
A Moving Average (e.g., 10-period or 20-period SMA): If price closes below your chosen trailing SMA, exit. This allows you to ride the trend while protecting accumulated profits.
Target Levels: Identify potential resistance levels (for longs) or support levels (for shorts) using pivot points, previous highs/lows, or Fibonacci extensions. Consider taking partial profits at these levels and letting the rest run with a trailing stop.
Loss of Confluence: If the "STRONGLY BULLISH/BEARISH" condition ceases to be met (e.g., RSI crosses below 50, or volume drops significantly), this can be a signal to reduce or exit your position, even if your stop-loss hasn't been hit.
The "All SMAs Bullish/Bearish Screener Enhanced" is your comprehensive partner in navigating the markets. By combining robust trend identification with critical confirmation signals and disciplined risk management, you're equipped to make smarter, more confident trading decisions. Add it to your favorites and unlock a new level of precision in your trading journey!
#PineScript #TradingView #SMA #MovingAverage #TrendFollowing #StockScreener #TechnicalAnalysis #Bullish #Bearish #QQQ #Momentum #Volume #RSI #SPY #TradingStrategy #Enhanced #Signals #Analysis #DayTrading #SwingTrading

Rolling Z-Score Trend [QuantAlgo]🟢 Overview
The Rolling Z-Score Trend measures how far the current price deviates from its rolling mean in terms of standard deviations. It transforms price data into standardized scores to identify overbought and oversold conditions while tracking momentum shifts.
The indicator displays a Z-Score line showing price deviation from statistical norms, with background momentum columns showing the rate of change in these deviations. This helps traders and investors identify mean reversion opportunities and momentum shifts across different asset classes and timeframes.
🟢 How It Works
The indicator uses the Z-Score formula: Z = (X - μ) / σ, where X is the current closing price, μ is the rolling mean, and σ is the rolling standard deviation over a user-defined lookback period. This creates a dynamic baseline that adapts to changing market conditions and standardizes price movements for interpretation across different assets and volatility conditions. The raw Z-Score undergoes 3-period EMA smoothing to reduce noise while maintaining responsiveness to market signals.
Beyond the basic Z-Score calculation, the indicator measures the rate of change in Z-Score values between successive bars, displayed as background momentum columns. This momentum component shows acceleration and deceleration of statistical deviations. All calculations are processed through confirmation filters, displaying signals only on confirmed bars to reduce premature signals based on incomplete price action.
🟢 How to Use
1. Z-Score Interpretation and Threshold Zones
Positive Values (Above Zero) : Price trading above statistical mean, suggesting bullish momentum or potential overbought conditions
Negative Values (Below Zero) : Price trading below statistical mean, suggesting bearish momentum or potential oversold conditions
Zero Line Crosses : Signal transitions between statistical regimes and potential trend changes
Upper Threshold Zone : Area above entry threshold (default 1.5) indicating potential overbought conditions
Lower Threshold Zone : Area below negative entry threshold (default -1.5) indicating potential oversold conditions
Extreme Values (±2.0 or higher) : Statistically significant deviations that may indicate reversal opportunities
2. Momentum Background Analysis and Info Table
Green Columns : Accelerating positive momentum in Z-Score values
Red Columns : Accelerating negative momentum in Z-Score values
Column Height : Magnitude of momentum change between bars
Momentum Divergence : When columns contradict primary Z-Score direction, often signals impending reversals
Info Table : Displays real-time numerical values for both Z-Score and momentum, including trend direction indicators and bar-to-bar change calculations for position management
3. Preconfigured Settings
Default : Balanced performance across multiple timeframes and asset classes for general trading and medium-term position management.
Scalping : Responsive setup for ultra-short-term trading on 1-15 minute charts with frequent signals and increased sensitivity to quick price movements.
Swing Trading : Optimized for multi-day positions with noise filtering, focusing on larger price swings. Most effective on 1-4 hour and daily timeframes.
Trend Following : Maximum smoothing that prioritizes established trends over short-term volatility. Generates fewer signals for daily and weekly charts.

MTF RSI MA System + Adaptive BandsMTF RSI MA System + Adaptive Bands
Overview
MTF RSI MA System + Adaptive Bands is a highly customizable Pine Script indicator for traders seeking a versatile tool for multi-timeframe (MTF) analysis. Unlike traditional RSI, it focuses on the Moving Average of RSI (RSI MA), delivering smoother and more flexible trading signals. The main screenshot displays the indicator in two panels to showcase its diverse capabilities.
Important: Timeframes do not adjust automatically – users must manually set them to match the chart’s timeframe.
Features
Core Component: Built around RSI MA, not raw RSI, for smoother trend signals.
Multi-Timeframe: Analyze RSI MA across three customizable timeframes (default: 4H, 8H, 12H).
Adaptive Bands: Three band calculation methods (Fixed, Percent, StdDev) for dynamic signals.
Flexible Signals: Generated via RSI MA crossovers, band interactions, or directional alignment across timeframes.
Background Coloring: Highlights when RSI MAs across timeframes move in the same direction, aiding trend confirmation.
Screenshot Panels Configuration
Upper Panel: Shows RSI, RSI MA, and fixed bands for reversal strategies (RSI crossing bands).
Lower Panel: Displays three RSI MAs (Alligator-style) for trend-following, with background coloring for directional alignment.
Band Calculation Methods
The indicator offers three ways to calculate bands around RSI MA, each with unique characteristics:
Fixed Bands
Set at a fixed point value (default: 10) above and below RSI MA.
Example: If RSI MA = 50, band value = 10 → upper band = 60, lower = 40.
Use Case: Best for stable markets or fixed-range preferences.
Tip: Adjust the band value to widen or narrow the range based on asset volatility.
Percent Bands
Calculated as a percentage of RSI MA (default: 10%).
Example: If RSI MA = 50, band value = 10% → upper band = 55, lower = 45.
Use Case: Ideal for assets with varying volatility, as bands scale with RSI MA.
Tip: Experiment with percentage values to match typical price swings.
Standard Deviation Bands (StdDev)
Based on RSI’s standard deviation over the MA period, multiplied by a user-defined factor (default: 10).
Example: If RSI MA = 50, standard deviation = 5, factor = 2 → upper band = 60, lower = 40.
Important: The default value (10) may produce wide bands. Reduce to 1–2 for tighter, practical bands.
Use Case: Best for dynamic markets with fluctuating volatility.
Configuration Options
RSI Length: Set RSI calculation period (default: 20).
MA Length: Set RSI MA period (default: 20).
MA Type: Choose SMA or EMA for RSI MA (default: EMA).
Timeframes: Configure three timeframes (default: 4H, 8H, 12H) for MTF analysis.
Overbought/Oversold Levels: Optionally display fixed levels (default: 70/30).
Background Coloring: Enable/disable for each timeframe to highlight directional alignment.
How to Use
Add Indicator: Load it onto your TradingView chart.
Setup:
Reversals: Configure like the upper panel (RSI, RSI MA, bands) and watch for RSI crossing bands.
Trends: Configure like the lower panel (three RSI MAs) and look for fastest MA crossovers and background coloring.
Adjust Timeframes: Manually set tf1, tf2, tf3 (e.g., 1H, 2H, 4H on a 1H chart) to suit your strategy.
Adjust Bands: Choose band type (Fixed, Percent, StdDev) and value. For StdDev, reduce to 1–2 for tighter bands.
Experiment: Test settings to match your trading style, whether scalping, swing trading, or long-term.
Notes
Timeframes: Always match tf1, tf2, tf3 to your chart’s needs, as they don’t auto-adjust.
StdDev Bands: Lower the default value (10) to avoid overly wide bands.
Versatility: Works across markets (stocks, forex, crypto).

BOS mark-out (by Lumiere)Advanced BOS Detection with Strict Swing Confirmation
This indicator implements BOS detection with several unique features:
🔹 Dual-Candle Swing Validation - Unlike most BOS indicators that use single candle swings, this uses a two-candle confirmation for swing highs/lows, analyzing both the candle wicks and body transitions.
🔹 Directional Lock System - Implements a state machine that prevents duplicate signals until an opposite-direction BOS occurs, reducing noise.
🔹 Precision Wick Analysis - Compares wicks between the reversal candle and confirmation candle to identify the true swing point.
🔹 Real-Time Update & Live Market Adaptation – The indicator continuously monitors price action and instantly updates BOS signals as new candles form, ensuring you never miss a BOS.
How It Differs From Other BOS Indicators:
Most public BOS indicators use simple HH/HL or LH/LL detection.
Many don't implement the directional locking mechanism.
Few use the two-candle wick comparison approach.
Wick-Based Precision uses the extreme wicks of two candles (not just the body).
Strict Confirmation requires a close beyond the swing point (no "wick breaks" counted).
Usage Examples:
🟦 Bullish BOS:
A green candle closes, followed by a red candle. This will be the new high, and if the next candle closes above the highest wick of those two, it will be a BOS (only if we had a bearish BOS before)
🟥 Bearish BOS:
A red candle closes, followed by a green candle. This will be the new low, and if the next candle closes below the lowest wick of those two, it will be a BOS (only if we had a Bullish BOS before)

Time LevelsTime Levels is a customizable TradingView indicator designed to mark critical intraday price levels based on specific time inputs. This tool helps traders identify significant Open/High/Low/Close (OHLC) levels, support & resistance (S&R) zones, and potential Judas Swing manipulation points—aligned with selected timeframes and adjusted to any time zone via UTC offset.
🔧 Key Features:
OHLC/OLHC Levels: Automatically draws horizontal lines at the candle’s open price for up to four specified time points. Ideal for marking session opens, closes, or key intraday levels.
Support & Resistance Zones: Highlights two time-based S&R levels that can help identify discount and premium pricing zones.
Judas Swing Detection: Marks potential liquidity grab zones (Judas Swings) at three user-defined times, assisting in identifying manipulation and smart money entry points.
Global Timezone Support: Includes a UTC offset input to align levels accurately with your trading session, regardless of your location.
Full Customization: Personalize the color, style (solid, dashed, dotted), and thickness of each line independently for OHLC, S&R, and Judas levels.
🛠️ Use Cases:
New York / London open price tracking
ICT-based SMC level marking
Predefined time-based liquidity level visualizations
Institutional-level price reactions (e.g., during specific market opens)
This indicator is best suited for intraday and short-term (especially ICT) traders looking to bring precision and consistency into their technical analysis framework.
