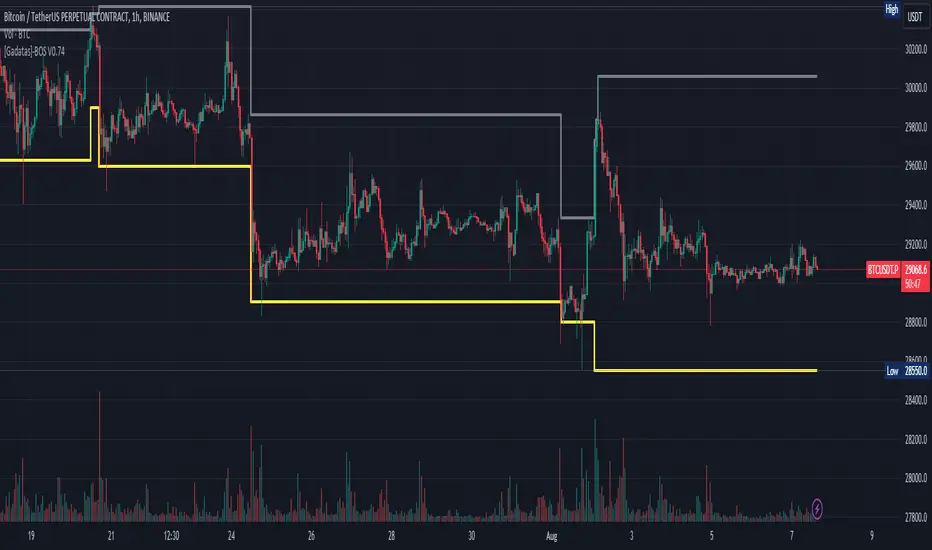
Brake Of Structure (BOS) By GadatasThis indicator is designed to identify and track swing highs and lows in a given market on any timeframe. It plots these swing highs and lows as solid lines on the chart. The indicator allows for customization of the line color and width and using another timeframe.
The indicator follows specific rules to determine when a new high or low is created. If the current range is considered bullish (meaning the most recent breakout was to the topside), the indicator will only update the low if a candle's body falls below the current low. However, if the current range is bearish (most recent breakout to the downside), the indicator will only update the high if a candle's body rises above the current high.
When a range is identified as bullish, the indicator will continue updating the high until a swing high is formed, denoting the high of the range. The high will only change if a candle's body surpasses the previous high. The low, on the other hand, will be updated based on the last time a candle's body falls below a previous candle's low. The lowest low after this condition is met will be assigned as the low of the range.
Conversely, when a range is identified as bearish, the indicator will continue updating the low until a swing low is formed, denoting the low of the range. The low will only change if a candle's body falls below the previous low. The high, in this case, will be updated based on the last time a candle's body rises above a previous candle's high. The highest high after this condition is met will be assigned as the high of the range.
Swing highs are determined by having lower highs to the left and right, while swing lows have higher lows to the left and right. These swings are used to determine the final high or low of a bullish or bearish range, respectively.
Tis Indicator differs from other indicators by incorporating this concept to track market structure. The indicator assumes that significant market players sell before making heavy purchases in bullish ranges and buy before selling heavily in bearish ranges. The lines on the chart represent prior highs and lows, as well as the current updated highs and lows based on this theory. By using this indicator, one can gain insights into the structure of price movement and potentially identify bullish or bearish continuations. It can also provide confluence when analyzing multiple timeframes to validate trend-following strategies.
스크립트에서 "swing"에 대해 찾기
Local Model Kalman Market ModeIntroduction
Heyo guys, I made a new (repainting) indicator called Local Model Kalman Market Mode.
I created it, because I wanted a reliable market mode filter for a potential mean-reversion strategy (e. g. BB Scalping).
On the screenshot you can see an example of how to use it in a BB strategy.
E.g. you would enter long when you have bullish divergence, price is under lower BB, price is under PoC and this indicator here shows range-bound market phase.
You would exit long on cross of the middle band.
Description
The indicator attempts to model the underlying market using different local models (i.e., trending, range-bound, and choppy) and combines them using the T3 Six Pole Kalman Filter to generate an overall estimate of the market.
The Fisher Transform is applied on the price to reach a Gaussian distribution, which increases the accuracy of the indicator itself.
The script first defines state variables for each local model, which include trend direction, trend strength, upper and lower bounds of the range, volatility of the range, level of choppiness, and strength of noise.
Then, likelihood functions are defined for each local model based on the state variables.
Next, the script calculates weights for each local model based on their likelihoods and uses them to calculate state variables for the overall estimate.
Finally, the script combines the state variables using the T3 Six Pole Kalman Filter to generate the overall estimate of the market, which is plotted in blue.
Fundamental Knowledge
To understand the explanation of the indicator and the script, there are a few fundamental concepts that you need to know:
Market: A market is a place where buyers and sellers come together to exchange goods or services.
In the context of trading, the market refers to the exchange where financial instruments such as stocks, currencies, and commodities are bought and sold.
Local models: Local models are statistical models that attempt to capture the characteristics of a particular market regime.
For example, a trending market may have different characteristics than a range-bound market or a choppy market.
The indicator uses different local models to capture the different market regimes.
Trend direction and strength: The trend direction refers to the direction in which the market is moving, either up or down.
The trend strength refers to the magnitude of the trend and how likely it is to continue.
Range-bound market: A range-bound market is a market where prices are trading within a specific range, with a clear upper and lower bound.
Choppiness: Choppiness refers to the degree of irregularity in price movements, often seen in sideways or range-bound markets.
Volatility: Volatility refers to the degree of variation in the price of an asset over time. High volatility implies larger price swings, while low volatility implies smaller price swings.
Kalman filter: A Kalman filter is a mathematical algorithm used to estimate an unknown variable from a series of noisy measurements.
In the context of the indicator, the Kalman filter is used to generate an overall estimate of the market by combining the local models.
T3 Six Pole Kalman Filter: The T3 Six Pole Kalman Filter is a specific type of Kalman filter that is used to smooth and filter time-series data, such as the price data of a financial instrument.
Fisher Transform: The Fisher Transform is a mathematical formula used to transform any probability distribution into a Gaussian normal distribution. It is commonly used in technical analysis to transform non-Gaussian indicators into ones that are more suitable for statistical analysis.
By understanding these fundamental concepts, you should have a basic understanding of how the indicator works and how it generates an overall estimate of the market.
Usage
You can use this indicator on every timeframe.
Users can customize the parameters of the T3 Six Pole Kalman Filter (T3 length, alpha, beta, gamma, and delta) using input functions.
Try out different parameter combinations and use the one you like most.
Thank you for checking this out. Leave me a comment or boost the script, when you wanna support me! 👌
--
Credits to:
▪@HPotter - Fisher Transform
▪@loxx - T3
▪ChatGPT - Helped me to make the research for this indicator and helped to build the core algorithm.

RedK Auto-Stepping Ladder TraderThe RedK Auto-Stepping Ladder Trader is an experimental tool to help identify trade entry and exits for various types of trades (Trend / Momentum / Breakout and Swing trades)
The underlying concept here is loosely similar to the SMAC script - in case you'd like to read some of the "script-specific" write-up . I even borrowed some of the SMAC code, but upgraded the script to Pine v5 while working. So i won't repeat write-up here on how the script works - and we'll get right into how to use in trading
How to use / trade the Ladder Trader:
-------------------------------------------------
The idea is to set the auto-stepping ladder to a higher timeframe, the "ladder view" helps simplify the price action to show a clear direction, then use the lower timeframe to find best entries (close or at the ladder line) and exits (on the ATR as TP target)
- Entries should be as close to the ladder line as possible - a trader may decide to have a small margin above or below the ladder line where they set entry limit order
- note that when stepping is enabled, the auto-stepping algo will choose the step value based on the underlying price range and the selected timeframe to move with common trader "mental values" where traders will usually gravitate
- exits can be set using the optional ATR or Pct channels - by default, there's an ATR channel (golden color) for that purpose
Possible usage scenarios of the Ladder Trader:
--------------------------------------------------------------
- Trend / long(er) term: enter position once the ladder line switches to the color corresponding to my desired direction (example: blue for long), and hold all the way until the color changes
- Swing: Take only trades in the direction of the ladder (long with blue, short with orange) - enter at the ladder line value, set TP at the desired ATR, repeat as long as the direction holds
- Feel free to experiment and share back other uses you find. There are so many settings and tweaks provided for flexibility - the downside is this adds a certain level of complexity - however, i hope this will be a valuable tool to add to your trading.
Few Notes:
-----------------------
- The Auto-stepping algo is a bit improved to be more FOREX and Crypto-friendly - i do not trade these instruments myself, but will continue to improve the auto-stepping technique in upcoming updates
- the signal line (hidden by default, and is what causes the ladder to change color) is based on my Compound Ratio Moving Average - since it's the moving average i found to provide best combination of speed and smoothness. It is used as a proxy to the price, to signal when the price is above or below the ladder level - while removing some of the whipsaws if we use the price value directly.
- Broader analysis of price action should still be made using other indicators - and possibly other chart setups - we shouldn't rely on the Ladder Trader signal only - Check for overall momentum, volume movement and market sentiment before using the Ladder Trader
- Also test your settings in PaperMoney - i noticed that different instruments may need different settings (for Ladder Type, Length, Rounding Technique, ATR multiplier..etc) for optimal setup that shows best signals.. Get very familiar with the Ladder Trader and it should hopefully become more helpful to you as a tradiing tool.
Comments and Feedback are welcome. Good luck.

[blackcat] L1 Composite RSI-DMI Reversal IndicatorLevel: 1
Background
The Relative Strength Index (RSI) developed by J. Welles Wilder is a pulse oscillator that measures the speed and change of price movements. The RSI hovers between zero and 100. Traditionally, the RSI is considered overbought when it is above 70 and oversold when below 30. Signals can be generated by looking for divergences and error fluctuations. RSI can also be used to identify the general trend.
The Directional Movement Index (DMI) is an indicator developed by J. Welles Wilder in 1978 that indicates the direction in which the price of an asset is moving. The indicator compares previous highs and lows and draws two lines: a positive directional movement line (+ DI) and a negative directional movement line (-DI). An optional third line called Directional Movement (DX) shows the difference between the lines. When + DI is above -DI there is more upward pressure than downward pressure in price. When -DI is above + DI, the price continues to fall. This indicator can help traders estimate the direction of the trend. Crossovers between the lines are also sometimes used as trading signals to buy or sell.
Function
L1 Composite RSI-DMI Reversal Indicator combines J. Welles Wilder's RSI and DMI indicators together to identify trend reversals.
Key Signal
swinglow --> swing signal
trend --> trend signal to identify top reversal
Pros and Cons
Pros:
1. it exhibit leading character
2. it can disclose top and bottom reversals
Cons:
1. noise exists
2. depends on market and trading pairs
Remarks
Composite J. Welles Wilder indicator
Readme
In real life, I am a prolific inventor. I have successfully applied for more than 60 international and regional patents in the past 12 years. But in the past two years or so, I have tried to transfer my creativity to the development of trading strategies. Tradingview is the ideal platform for me. I am selecting and contributing some of the hundreds of scripts to publish in Tradingview community. Welcome everyone to interact with me to discuss these interesting pine scripts.
The scripts posted are categorized into 5 levels according to my efforts or manhours put into these works.
Level 1 : interesting script snippets or distinctive improvement from classic indicators or strategy. Level 1 scripts can usually appear in more complex indicators as a function module or element.
Level 2 : composite indicator/strategy. By selecting or combining several independent or dependent functions or sub indicators in proper way, the composite script exhibits a resonance phenomenon which can filter out noise or fake trading signal to enhance trading confidence level.
Level 3 : comprehensive indicator/strategy. They are simple trading systems based on my strategies. They are commonly containing several or all of entry signal, close signal, stop loss, take profit, re-entry, risk management, and position sizing techniques. Even some interesting fundamental and mass psychological aspects are incorporated.
Level 4 : script snippets or functions that do not disclose source code. Interesting element that can reveal market laws and work as raw material for indicators and strategies. If you find Level 1~2 scripts are helpful, Level 4 is a private version that took me far more efforts to develop.
Level 5 : indicator/strategy that do not disclose source code. private version of Level 3 script with my accumulated script processing skills or a large number of custom functions. I had a private function library built in past two years. Level 5 scripts use many of them to achieve private trading strategy.

Double StochasticDouble Stochastic is use 2 Stochastic for monitoring price swing.
Slow Stochastic (21,3,3) for monitoring the swing of price cycle.
Fast Stochastic (5,1,1) for monitoring the swing in price ripple.
When 2 Stochastic run way from each other, separately , mean Price will move only retrace or rebound in ripple movement.
When 2 Stochastic Flip and Run break thru from overbought or oversold zone , mean Price will move to change in major direction
Useful for decision to hold position or take action
Such as Price move up and start decline, Slow Stochastic run above 80 and only Fast Stochastic swing down, mean Price just move retrace down. Price still has chance to flip and move up again. This will help we hold the Long Position or know where to open more Long position on price dip.
Or Price break down to support line and start rebound , Slow Stochastic run below 20 and only Fast Stochastic Swing Up , mean Price just move rebound to go down again. This will help we can hold Short Position or know where to open more Short position.
Wave Riders ...
Aether | SkyWalker Cloud Algo☁️ Aether | SkyWalker Cloud Algo
The SkyWalker Cloud Algo is a high-confluence trend-following system designed to filter out market noise and capture significant volatility expansions. By combining a sensitive trailing stop engine (UT Bot) with a "Tri-Factor" of momentum, volume, and trend filters, this script visualizes the market as a navigational flight path—keeping you in the clear "Blue Sky" during uptrends and alerting you to "Storms" during downtrends.
🧠 The Logic Behind the Cloud
This script is not just a buy/sell signal generator; it is a Confluence Engine. A signal is only generated when the core cloud logic aligns with specific atmospheric conditions (Filters).
1. The Core Engine: Variable Sensitivity Cloud (UT Bot)
At its heart, the script uses a modified ATR Trailing Stop (often known as the UT Bot).
Ascend (Bullish): When price breaks above the trailing "Updraft" line.
Descend (Bearish): When price breaks below the trailing "Downdraft" line.
Customization: You can tweak the Sensitivity (ATR Period) and Smoothness (Key Value) to fit any timeframe, from scalping (1m) to swing trading (4H+).
2. The Confluence Filters (The Weather System)
To prevent false signals in choppy markets, the "SkyWalker" logic checks three distinct market forces before confirming a trade:
🌬️ Prevailing Wind (Supertrend): Ensures you are trading in the direction of the macro trend. If the wind is against you, the signal is grounded.
🌡️ Atmospheric Pressure (QQE Mod): Uses a smoothed RSI with volatility bands to detect genuine momentum shifts. It ensures there is enough "pressure" to sustain the move.
💧 Vapor Flow (Chaikin Money Flow): Analyzes volume flow. A Buy signal requires positive money flow (Inflow), and a Sell requires negative money flow (Outflow).
3. Market Structure (SMC)
Optional Filter: You can enable the SMC Structure Alignment in the settings. This forces the algorithm to only take Longs when the market is making Higher Highs and Shorts when making Lower Lows, adding an extra layer of safety.
🌤️ Visuals & The "Flight Deck"
The script completely overhauls the standard chart visual to keep your focus on price action and targets.
Aether Mist: The space between the price and the trailing stop is filled with a dynamic cloud, providing an instant visual read on trend strength.
Dynamic Targets (TP/SL): When a signal fires, the script automatically projects Take Profit and Stop Loss lines on your chart based on volatility (ATR). These lines update in real-time.
The Flight Deck (Dashboard): Located in the corner of your chart, this panel provides a real-time status report of your filters (Wind, Barometer, Flow) and tracks the "Flight Accuracy" (Win Rate) of the signals on the current chart history.
🛠️ How to Use
Entry: Wait for a "🌤️ ASCEND" (Long) or "⛈️ DESCEND" (Short) label. This confirms that price has broken the cloud and all enabled filters (Supertrend, QQE, CMF) are in agreement.
Stop Loss: Place your initial stop at the dotted white line provided by the signal.
Take Profit: Aim for the dashed colored line (Dynamic TP). Alternatively, you can ride the trend until the Cloud changes color.
Trailing: If the "Show Trailing Cloud" option is on, the SL line will move with the price, locking in profits as the trend continues.
⚙️ Settings Overview
Updraft/Downdraft Sensitivity: Lower numbers = faster signals (scalping); Higher numbers = fewer signals (swinging).
Confluence Group: Toggle the Supertrend, QQE, or CMF filters on/off individually to loosen or tighten the strategy.
Visuals: Toggle the Dashboard, TP/SL lines, or the background cloud fill.

TrendlinesTrendline S&R
This indicator is an automated technical analysis tool designed to identify the most relevant Support and Resistance (S&R) zones based on market pivots. Unlike standard pivot indicators that clutter the chart with historic lines, this script uses a "Closest-to-Price" algorithm to display only the single most relevant Support (Green) and Resistance (Red) zone currently interacting with price action.
It solves common frustrations with automated trendlines—specifically the issue of lines disappearing immediately upon a breakout—by introducing a Stability Buffer.
Key Features & Importance
The script scans hundreds of potential trendlines but only draws the one geographically closest to the current price.
Importance: This ensures you are looking at the zone that matters right now. It filters out distant or irrelevant historic lines, keeping your chart clean and focused on immediate price action.
🛡️ 5-Bar Stability Buffer (Anti-Flicker)
Feature: A hardcoded 5-bar "memory" prevents the zone from disappearing the moment price touches or breaks it.
Importance: This is critical for trading breakouts. It allows you to see the zone persist while price breaches it, helping you distinguish between a true breakout, a fakeout, or a retest, without the reference level vanishing from your screen.
🔍 Dynamic Pivot Filtering
Feature: Uses a restricted Pivot Strength (5-15) and Minimum Confirmation (2-8 touches).
Importance: By enforcing these limits, the indicator ignores insignificant market noise and micro-swings, ensuring that drawn zones represent structural market levels with genuine liquidity.
🔔 Integrated Alert System
Feature: Built-in alerts for "Zone Breakout" (candle close crossing the zone) and "Zone Touch" (wick entering the zone).
Importance: Allows you to set the indicator and walk away. You will be notified instantly when price interacts with these key levels, removing the need to stare at the chart.
📉 Adaptive Tolerance (Fixed ATR)
Feature: Uses a fixed ATR multiplier internally to determine the width of the zone.
Importance: This automatically adjusts the thickness of the support/resistance zone based on the asset's volatility.
Settings Guide
Bars to Apply: How far back in history the script looks for pivots (Default: 300).
Pivot Source: Choose between calculating from "High/Low" (wicks) or "Close" (bodies).
Pivot Strength: The number of bars required on each side to define a swing point (Range: 5–15).
Min Pivot Confirmation: The minimum number of touches required to validate a trendline (Range: 2–8).
How to Use
Add the indicator to your chart.
Adjust Pivot Strength if you want to catch smaller swings (lower number) or major structures (higher number).
Set an alert in TradingView by clicking the "Clock" icon, selecting this indicator, and choosing "Zone Breakout" or "Zone Touch".

Smart Money Flow Cloud [BOSWaves]Smart Money Flow Cloud - Volume-Weighted Trend Detection with Adaptive Volatility Bands
Overview
Smart Money Flow Cloud is a volume flow-aware trend detection system that identifies directional market regimes through money flow analysis, constructing adaptive volatility bands that expand and contract based on institutional pressure intensity.
Instead of relying on traditional moving average crossovers or fixed-width channels, trend direction, band width, and signal generation are determined through volume-weighted money flow calculation, nonlinear flow strength modulation, and volatility-adaptive band construction.
This creates dynamic trend boundaries that reflect actual institutional buying and selling pressure rather than price momentum alone - tightening during periods of weak flow conviction, expanding during strong directional moves, and incorporating flow strength statistics to reveal whether regimes formed under accumulation or distribution conditions.
Price is therefore evaluated relative to adaptive bands anchored at a flow-informed baseline rather than conventional trend-following indicators.
Conceptual Framework
Smart Money Flow Cloud is founded on the principle that sustainable trends emerge where volume-weighted money flow confirms directional price movement rather than where price alone creates patterns.
Traditional trend indicators identify regime changes through price crossovers or slope analysis, which often ignore the underlying volume dynamics that validate or contradict those movements.This framework replaces price-centric logic with flow-driven regime detection informed by actual buying and selling volume.
Three core principles guide the design:
Trend direction should correspond to volume-weighted flow dominance, not price movement alone.
Band width must adapt dynamically to current flow strength and volatility conditions.
Flow intensity context reveals whether regimes formed under conviction or uncertainty.
This shifts trend analysis from static moving averages into adaptive, flow-anchored regime boundaries.
Theoretical Foundation
The indicator combines adaptive baseline smoothing, close location value (CLV) methodology, volume-weighted flow tracking, and nonlinear strength amplification.
A smoothed trend baseline (EMA or ALMA) establishes the core directional reference, while close location value measures where price settled within each bar's range. Volume weighting applies directional magnitude to flow calculation, which accumulates into a normalized money flow ratio. Flow strength undergoes nonlinear power transformation to amplify strong conviction periods and dampen weak flow environments. Average True Range (ATR) provides volatility-responsive band sizing, with final width determined by the interaction between base volatility and flow-modulated multipliers.
Four internal systems operate in tandem:
Adaptive Baseline Engine : Computes smoothed trend reference using either EMA or ALMA methodology with configurable secondary smoothing.
Money Flow Calculation System : Measures volume-weighted directional pressure through CLV analysis and ratio normalization.
Nonlinear Flow Strength Modulation : Applies power transformation to flow intensity, creating dynamic sensitivity scaling.
Volatility-Adaptive Band Construction : Scales band width using ATR measurement combined with flow-strength multipliers that range from minimum (calm) to maximum (strong flow) expansion.
This design allows bands to reflect actual institutional behavior rather than reacting mechanically to price volatility alone.
How It Works
Smart Money Flow Cloud evaluates price through a sequence of flow-aware processes:
Close Location Value (CLV) Calculation : Each bar's closing position within its high-low range is measured, creating a directional bias indicator ranging from -1 (closed at low) to +1 (closed at high).
Volume-Weighted Flow Tracking : CLV is multiplied by bar volume, then accumulated and normalized over a configurable flow window to produce a money flow ratio between -1 and +1.
Flow Smoothing and Strength Extraction : The raw money flow ratio undergoes optional smoothing, then nonlinear power transformation to amplify strong flow periods and compress weak flow environments.
Adaptive Baseline Construction : Price (both open and close) is smoothed using either EMA or ALMA methodology with optional secondary smoothing to create a stable trend reference.
Dynamic Band Sizing : ATR measurement is multiplied by a flow-strength-modulated factor that interpolates between minimum (tight) and maximum (wide) multipliers based on current flow conviction.
Regime Detection and Visualization : Price crossing above the upper band triggers bullish regime, crossing below the lower band triggers bearish regime. The baseline cloud visualizes open-close relationship within the current trend.
Retest Signal Generation : Price touching the baseline from within an established regime generates retest signals with configurable cooldown periods to prevent noise.
Together, these elements form a continuously updating trend framework anchored in volume flow reality.
Interpretation
Smart Money Flow Cloud should be interpreted as flow-confirmed trend boundaries:
Bullish Regime (Blue) : Activated when price crosses above the upper adaptive band, indicating volume-confirmed buying pressure exceeding volatility-adjusted resistance.
Bearish Regime (Red) : Established when price crosses below the lower adaptive band, identifying volume-confirmed selling pressure breaking volatility-adjusted support.
Baseline Cloud : The gap between smoothed open and smoothed close within the baseline visualizes intrabar directional bias - wider clouds indicate stronger intrabar momentum.
Adaptive Band Width : Reflects combined volatility and flow strength - wider bands during high-conviction institutional activity, tighter bands during consolidation or weak flow periods.
Buy/Sell Labels : Appear at regime switches when price crosses from one band to the other, marking potential trend inception points.
Retest Signals (✦) : Diamond markers indicate price touching the baseline within an established regime, often occurring during healthy pullbacks in trending markets.
Trend Strength Gauge : Visual meter displays current regime strength as a percentage, calculated from price position within the active band relative to baseline.
Background Gradient : Optional coloring intensity reflects flow strength magnitude, darkening during high-conviction periods.
Flow strength, band width adaptation, and baseline relationship outweigh isolated price fluctuations.
Signal Logic & Visual Cues
Smart Money Flow Cloud presents three primary interaction signals:
Regime Switch - Buy : Blue "Buy" label appears when price crosses above the upper band after previously being in a bearish regime, suggesting volume-confirmed bullish transition.
Regime Switch - Sell : Red "Sell" label displays when price crosses below the lower band after previously being in a bullish regime, indicating volume-confirmed bearish transition.
Trend Retest : Diamond (✦) markers appear when price touches the baseline within an established regime, with configurable cooldown periods to filter noise.
Alert generation covers regime switches and retest events for systematic monitoring.
Strategy Integration
Smart Money Flow Cloud fits within volume-informed and institutional flow trading approaches:
Flow-Confirmed Entry : Use regime switches as primary trend inception signals where volume validates directional breakouts.
Retest-Based Refinement : Enter on baseline retest signals within established regimes for improved risk-reward positioning during pullbacks.
Band Width Context : Expect wider price swings when bands expand (high flow strength), tighter ranges when bands contract (weak flow).
Baseline Cloud Confirmation : Favor trades where baseline cloud width confirms intrabar momentum alignment with regime direction.
Strength Gauge Filtering : Use trend strength percentage to gauge continuation probability - higher readings suggest stronger institutional conviction.
Multi-Timeframe Regime Alignment : Apply higher-timeframe regime context to filter lower-timeframe entries, taking only setups aligned with dominant flow direction.
Technical Implementation Details
Core Engine : Configurable EMA or ALMA baseline with secondary smoothing
Flow Model : Close Location Value (CLV) with volume weighting and ratio normalization
Strength Transformation : Configurable power function for nonlinear flow amplification
Band Construction : ATR-scaled width with flow-strength-interpolated multipliers
Visualization : Dual-line baseline cloud with gradient fills, regime-colored bands, and embedded strength gauge
Signal Logic : Band crossover detection with baseline retest identification and cooldown management
Performance Profile : Optimized for real-time execution with minimal computational overhead
Optimal Application Parameters
Timeframe Guidance:
1 - 5 min : Micro-structure regime detection for scalping and intraday reversals
15 - 60 min : Intraday trend identification with flow-validated swings
4H - Daily : Swing and position-level regime analysis with institutional flow context
Suggested Baseline Configuration:
Trend Length : 34
Trend Engine : EMA
Trend Smoothing : 3
Flow Window : 24
Flow Smoothing : 5
Flow Boost : 1.2
ATR Length : 14
Band Tightness (Calm) : 0.9
Band Expansion (Strong Flow) : 2.2
Reset Cooldown : 12
These suggested parameters should be used as a baseline; their effectiveness depends on the asset's volume profile, volatility characteristics, and preferred signal frequency, so fine-tuning is expected for optimal performance.
Parameter Calibration Notes
Use the following adjustments to refine behavior without altering the core logic:
Bands too wide/frequent whipsaws : Reduce "Band Expansion (Strong Flow)" to limit maximum band width, or increase "Band Tightness (Calm)" to widen minimum bands and reduce noise sensitivity.
Trend baseline too choppy : Increase "Trend Length" for smoother baseline, or increase "Trend Smoothing" for additional filtering.
Flow readings unstable : Increase "Flow Smoothing" to reduce bar-to-bar noise in money flow calculation.
Missing legitimate regime changes : Decrease "Trend Length" for faster baseline response, or reduce "Band Tightness (Calm)" for earlier breakout detection.
Too many retest signals : Increase "Reset Cooldown" to space out retest markers, or disable retest signals entirely if not using pullback entries.
Flow strength not responding : Increase "Flow Boost" (power factor) to amplify strong flow differentiation, or decrease "Flow Window" to emphasize recent volume activity.
Prefer different smoothing characteristics : Switch "Trend Engine" to ALMA and adjust "ALMA Offset" (higher = more recent weighting) and "ALMA Sigma" (higher = smoother) for alternative baseline behavior.
Adjustments should be incremental and evaluated across multiple session types rather than isolated market conditions.
Performance Characteristics
High Effectiveness:
Markets with consistent volume participation and institutional flow
Instruments where volume accurately reflects true liquidity and conviction
Trending environments where flow confirms directional price movement
Mean-reversion strategies using retest signals within established regimes
Reduced Effectiveness:
Extremely low volume environments where flow calculations become unreliable
News-driven or gapped markets with discontinuous volume patterns
Highly manipulated or thinly traded instruments with erratic volume distribution
Ranging markets where price oscillates within bands without conviction
Integration Guidelines
Confluence : Combine with BOSWaves structure, order flow analysis, or traditional volume profile
Flow Validation : Trust regime switches accompanied by strong flow readings and wide band expansion
Context Awareness : Consider whether current market regime matches historical flow patterns
Retest Discipline : Use baseline retest signals as confirmation within trends, not standalone entries
Breach Management : Exit regime-aligned positions when price crosses opposing band with volume confirmation
Disclaimer
Smart Money Flow Cloud is a professional-grade volume flow and trend analysis tool. Results depend on market conditions, volume reliability, parameter selection, and disciplined execution. BOSWaves recommends deploying this indicator within a broader analytical framework that incorporates price structure, market context, and comprehensive risk management.

Market Structure Break + RSI ExitSignal Architect™ — Developer Note
This indicator includes a limited visual preview of a proprietary power signal I have personally developed and refined across futures, algorithmic systems, options, and equity trading.
Every tool I release is built with one principle in mind:
clarity of direction without over-promising or under-delivering.
That is why all Signal Architect™ tools emphasize:
Market structure first
High-probability directional context
Clear, visual risk framing
No predictive claims, no curve-fit illusions
What you are seeing here is only a small glimpse of a much broader internal framework I actively use in live environments.
🧠 Background & Scope
Over the years, I have personally developed 800+ programs spanning:
Equities
Futures
Options
Dividend & income systems
Portfolio construction and allocation logic
This includes 40+ Nasdaq-100 trading bots, several of which operate under extremely strict rule-sets and controlled deployment conditions.
Nothing shared publicly represents my full system—only educational and analytical previews designed to demonstrate how structure and probability can be aligned visually.
🤝 Support & Collaboration
If you find value in what I share:
Please subscribe, boost, and share my scripts, Ideas, and MINDS posts
You are always welcome to message me directly with questions or if you need something built or adapted
Constructive feedback and collaboration are encouraged
For traders looking to go deeper, I offer optional memberships that include:
Access to additional signals
Early previews
Occasional free tools and upgrades to support your trading journey
🔗 Membership & Signals:
trianchor.gumroad.com
⚠️ Final Note
Everything published publicly is for educational and analytical purposes only.
Markets carry risk. Discipline and risk management always come first.
— Signal Architect™
You can Find my personally developed GBT below
chatgpt.com
chatgpt.com
chatgpt.com
********************************************************************************************************************WHAT THIS INDICATOR DOES
This indicator is a structure-first breakout engine designed around how price actually transitions between balance and expansion.
It does not predict reversals.
It waits for confirmed market structure breaks, then:
Anchors risk using recent wave extremes
Projects deterministic TP/SL zones
Tracks outcomes visually and statistically
Optionally exits early when momentum exhausts (RSI fade)
This makes it ideal for:
Directional traders
Swing continuation setups
Expansion phases after compression
🧠 CORE SIGNAL ARCHITECT LOGIC
1️⃣ Market Structure Identification
The system uses pivot highs and pivot lows to define true structural levels:
Pivot High break → Long bias
Pivot Low break → Short bias
This avoids:
Random candle breakouts
Intrabar noise
False momentum spikes
Only confirmed structural levels are traded.
2️⃣ Entry Trigger (Structure Break)
A trade is triggered only when price closes through structure:
Direction Requirement
Long Close breaks above last confirmed pivot high
Short Close breaks below last confirmed pivot low
📌 Important:
No signal fires if you are already in a trade — one position at a time, clean sequencing.
3️⃣ Stop-Loss Logic (Wave-Anchored Risk)
Stops are not arbitrary.
They are anchored to:
Recent wave low (for longs)
Recent wave high (for shorts)
This ensures:
Stops sit beyond real market structure
Risk reflects actual auction failure, not candle noise
4️⃣ Take-Profit Logic (Risk × Reward)
Take-profit is mechanically derived:
TP = Risk × Risk:Reward Ratio
Examples:
RR = 1.0 → TP = same distance as SL
RR = 1.5 → TP = 1.5× SL distance
RR = 2.0 → TP = expansion-focused swings
This keeps results comparable, repeatable, and testable.
5️⃣ Optional RSI Exit (Momentum Fade)
RSI is not used for entries.
It is used only as an optional early-exit filter:
Trade RSI Condition
Long RSI crosses down from Overbought
Short RSI crosses up from Oversold
This is designed for:
Reducing give-back during exhaustion
Tight markets where expansion stalls
Volatility contraction environments
🔕 You can disable this entirely for pure structure trading.
📦 VISUAL OUTPUTS
🔲 Risk Boxes (Core Feature)
Every trade plots:
Green box = profit zone
Red box = loss zone
Boxes:
Extend forward bar-by-bar
Stop updating once trade resolves
Allow instant visual expectancy review
🔺 Signal Arrows
Green ▲ = Structure Break Long
Red ▼ = Structure Break Short
No repainting.
No intrabar guessing.
🧮 Performance Stats Table
Tracks:
Total trades
Wins
Losses
Win rate %
📌 This is contextual feedback, not a promise of future results.
🎯 RECOMMENDED TIMEFRAMES (VERY IMPORTANT)
This indicator performs best when structure matters.
⭐ PRIMARY TIMEFRAMES (Recommended)
Timeframe Use Case
15-Minute Intraday structure breaks, clean expansions
30-Minute Session-level continuation
1-Hour Swing structure, reduced noise
2-Hour Institutional rhythm, fewer false breaks
4-Hour Macro structure legs
✔ These timeframes allow pivots to form properly
✔ Stops remain structurally meaningful
✔ RR math stays realistic
⚠️ SECONDARY / CONDITIONAL
Timeframe Notes
5-Minute Use only during trend days
Daily Works well, but slower signal frequency
🚫 NOT RECOMMENDED
Timeframe Why
1–3 Minute Too much pivot distortion
Tick / Seconds Breaks structure logic entirely
This is not a scalping indicator.
🟩 BACKGROUND BIAS SHADING
Green tint → Active long bias
Red tint → Active short bias
No tint → Neutral / flat
This helps:
Avoid over-trading
Stay aligned with active structure
Recognize when the system is waiting
🧠 HOW TO USE THIS CORRECTLY
Best Practices
✔ Trade only in expansion environments
✔ Let pivots form before expecting signals
✔ Respect the stop — it is structurally valid
✔ Journal results per timeframe
Avoid
✘ Forcing trades in chop
✘ Using this as a reversal indicator
✘ Lowering timeframe to “get more signals”
⚠️ IMPORTANT DISCLAIMER
This indicator is for educational and analytical purposes only.
It does not:
Predict markets
Guarantee profits
Replace risk management
Trading involves substantial risk and can result in loss of capital.
Past performance does not guarantee future results.

Zig Zag ++ SG (Premium)🔥 Zig Zag ++ SG
Professional Market Structure & Cycle Analyzer
Zig Zag ++ SG is an advanced, research-grade market structure indicator built on top of a refined ZigZag engine, designed for traders and investors who want to understand price cycles, not chase candles.
This is not a buy-sell arrow tool.
It is a decision-support system used to analyze trend strength, exhaustion, pullback depth, and cycle behavior across any market and timeframe.
🧠 What Makes Zig Zag ++ SG Different?
Most ZigZag indicators only draw lines.
Zig Zag ++ SG answers the real questions:
Is the trend getting stronger or weaker?
Are higher highs still meaningful?
How deep are pullbacks in percentage terms?
Which stocks recover fast vs stay weak?
Is this accumulation, distribution, or reversal?
It does this by combining:
Market Structure (HH / HL / LH / LL)
Consecutive structure counting
Gain & fall percentage per swing
Clean visual logic (no repaint confusion)
📌 Core Features
✅ 1. Automatic Market Structure Detection
Labels every major swing as:
HH – Higher High
HL – Higher Low
LH – Lower High
LL – Lower Low
This instantly shows whether the market is:
Trending
Consolidating
Distributing
Reversing
✅ 2. Consecutive Structure Count (ON by default)
Each structure type is counted sequentially:
HH (1), HH (2), HH (3)…
HL (1), HL (2)…
This reveals:
Trend maturity
Exhaustion zones
Early breakdown warnings
Example:
HH (4) = trend may be overextended
HL (3) = healthy trend continuation
✅ 3. Gain & Fall % on Every Swing (ON by default)
Every HH, HL, LH, LL shows:
Exact % move from the previous pivot
This allows you to:
Compare pullback depth across stocks
Identify leaders (shallow HLs)
Spot weak stocks (deep HLs / LHs)
Study cycle symmetry
Example label:
HL (2)
-6.4%
✅ 4. Clean, Readable Visual Design
🟩 Green labels → White text
🟥 Red labels → High-contrast white text
Optional background trend shading (OFF by default)
Works perfectly in dark & light mode
Designed for long chart study sessions, not flashy screenshots.
✅ 5. Safe Repaint Logic (Transparent by Design)
Uses ZigZag logic intentionally
No fake “non-repainting” claims
Ideal for analysis, research & planning
What you see is structurally correct
This indicator is for thinking traders, not signal chasers.
⚙️ Best Settings (Recommended)
🔹 Intraday Trading
Timeframe: 5m / 15m
Depth: 8–10
Deviation: 3–5
Backstep: 2
🔹 Swing Trading (Most Popular)
Timeframe: Daily
Depth: 12–15
Deviation: 5
Backstep: 2
🔹 Long-Term / Investing
Timeframe: Weekly
Depth: 15–20
Deviation: 5–8
Backstep: 3
💡 Tip:
Lower depth = more swings
Higher depth = cleaner, major cycles
📈 How to Use Zig Zag ++ SG (Practically)
🔹 Trend Strength
HH (3+) + HL (2–3)
→ Strong, healthy trend
🔹 Exhaustion Warning
HH (4+)
→ Risk of distribution or slowdown
🔹 Pullback Quality
HL −3% to −7%
→ Strong stock
HL −12% to −20%
→ Weak hands / fragile trend
🔹 Reversal Confirmation
LH followed by LL (2+)
→ Trend change likely
🧪 Who Is This Indicator For?
✅ Swing traders
✅ Positional traders
✅ Long-term investors
✅ Market structure students
✅ Stock researchers
✅ Anyone tired of noisy indicators
❌ Not for:
People wanting instant buy/sell arrows
Scalpers chasing 1-minute signals
“Magic indicator” seekers
💎 Why This Is Worth Purchasing
Built with Pine Script v6 best practices
Solves real market questions
Helps avoid:
Buying late
Selling early
Holding weak stocks too long
Encourages process-driven trading
One-time learning tool you’ll use for years
Most traders lose money not because of entries —
but because they misread structure and cycles.
Zig Zag ++ SG fixes that.

Gann Sacred Geometry Hexagram Ver 1.2━━━━━━━━━━━━━━━━━━━━━━━━━━━━━━━━━━━━━━━━
🔯 GANN SACRED GEOMETRY HEXAGRAM v1.2
━━━━━━━━━━━━━━━━━━━━━━━━━━━━━━━━━━━━━━━━
A comprehensive technical analysis tool combining W.D. Gann's sacred geometry principles,
hexagram patterns, and advanced confluence scoring for high-probability trade signals.
━━━━━━━━━━━━━━━━━━━━━━━━━━━━━━━━━━━━━━━━
📖 GANN THEORY BACKGROUND
━━━━━━━━━━━━━━━━━━━━━━━━━━━━━━━━━━━━━━━━
W.D. Gann (1878-1955) believed markets move in geometric patterns and that price
and time must be in balance. His methods incorporated:
- The Square of Nine
- Geometric angles (1x1, 2x1, etc.)
- Sacred geometry and natural law
- Cycle theory and time divisions
- The principle "When time and price square, a change in trend is imminent"
This indicator applies these timeless principles with modern confluence analysis.
SACRED GEOMETRY FOUNDATION:
The hexagram (six-pointed star) is formed by two overlapping equilateral triangles:
- ▲ Upward triangle = Yang energy, bullish forces, expansion
- ▼ Downward triangle = Yin energy, bearish forces, contraction
When overlapped, they create the "Star of David" - representing perfect balance
between opposing market forces. Gann believed this geometry revealed natural
support and resistance zones where price would react.
HEXAGRAM IN MARKETS:
- 6 outer points = Major reversal zones
- Center point = Balance/equilibrium price
- Inner intersections = Secondary support/resistance
- The shape itself creates "harmonic" price levels
GANN'S SQUARE PHILOSOPHY:
"When time and price square, a change in trend is imminent."
- W.D. Gann
This indicator applies the "squaring" concept:
1. SPATIAL SQUARE: Grid cells are perfect squares in price-time space
2. TEMPORAL SQUARE: Time divisions (1/4, 1/2, 3/4) create cycle points
3. PRICE SQUARE: Price divisions (25%, 50%, 75%) mirror time divisions
4. GEOMETRIC SQUARE: All geometry radiates from perfect square centers
When price reaches a corner or edge of a square at a time cycle point,
the "squaring" of price and time creates a reversal probability zone.
PHI IN GANN GEOMETRY:
The Golden Ratio appears throughout natural phenomena and market structure.
This script uses φ in two primary ways:
1. INNER TRIANGLE SCALING:
- Outer triangles span the full cell (100%)
- Inner triangles scaled by φ⁻¹ (0.618 or 61.8%)
- This creates Fibonacci retracement levels geometrically
2. HARMONIC RESONANCE:
- φ ratio divides price space into natural harmony
- Markets tend to pause/reverse at these φ-scaled levels
- Combines Fibonacci analysis with Gann geometry
MATHEMATICAL RELATIONSHIP:
Inner Triangle Height = Outer Height × 0.618
Inner Triangle Width = Outer Width × 0.618
These create the 61.8% retracement levels automatically
within each grid cell's geometry.
GANN'S COMPLETE ANGLE SYSTEM:
Gann identified 9 primary angles that price follows. Each represents a different
relationship between price movement and time passage:
╔════════════════════════════════════════════════════════════════╗
║ ANGLE │ RATIO │ DEGREES │ MEANING ║
╠════════════════════════════════════════════════════════════════╣
║ 1x8 │ 1:8 │ 7.125° │ Very slow trend (gentle) ║
║ 1x4 │ 1:4 │ 14.036° │ Slow trend ║
║ 1x3 │ 1:3 │ 18.435° │ Moderate-slow trend ║
║ 1x2 │ 1:2 │ 26.565° │ Moderate trend ║
║ 1x1 │ 1:1 │ 45.000° │ MASTER ANGLE (most important) ║
║ 2x1 │ 2:1 │ 63.435° │ Strong trend ║
║ 3x1 │ 3:1 │ 71.565° │ Very strong trend ║
║ 4x1 │ 4:1 │ 75.964° │ Extreme trend ║
║ 8x1 │ 8:1 │ 82.875° │ Parabolic trend (unsustainable)║
╚════════════════════════════════════════════════════════════════╝
THE 1x1 ANGLE - THE MASTER:
- Most important angle in Gann theory
- Represents perfect balance: 1 unit price = 1 unit time
- When price is ABOVE 1x1 = Bullish control
- When price is BELOW 1x1 = Bearish control
- Crossing 1x1 = Major trend change signal
ANGLE FANS:
- From any pivot point, all 9 angles radiate outward
- Creates a "fan" of dynamic support/resistance
- Steeper angles (4x1, 8x1) = strong momentum resistance
- Gentler angles (1x4, 1x8) = weak support in downtrends
THE SACRED DIVISIONS OF TIME:
Gann divided all cycles into 8 equal parts, based on ancient geometry
and astrological principles:
CYCLE DIVISIONS (8ths):
┌─────────────────────────────────────────────────────┐
│ 1/8 = 12.5% │ First minor turn point │
│ 2/8 = 25.0% │ First major turn (Cardinal) │
│ 3/8 = 37.5% │ Second minor turn │
│ 4/8 = 50.0% │ MID-CYCLE (most powerful) │
│ 5/8 = 62.5% │ Third minor turn │
│ 6/8 = 75.0% │ Second major turn (Cardinal) │
│ 7/8 = 87.5% │ Fourth minor turn │
│ 8/8 = 100.0% │ CYCLE COMPLETION (reversal zone) │
└─────────────────────────────────────────────────────┘
WHY EIGHTHS?
- 8 is the number of balance in sacred geometry
- Octave divisions create harmonic resonance
- 360° circle ÷ 8 = 45° (the 1x1 master angle)
- Natural cycles show 8-fold symmetry
IN THIS SCRIPT:
When current time position is within 8% of any eighth division,
the "Gann 8ths Timing" factor activates, adding confluence points.
THE CARDINAL CROSS SYSTEM:
The Cardinal Cross divides any square into four equal quadrants,
creating a cross pattern:
100% ●━━━━━━━━━━━━━●
┃ ↑ ┃
75% ┃ SELL ZONE ┃ ← Resistance quadrant
┃ ↑ ┃
50% ●━━━━━●━━━━━━● ← EQUILIBRIUM (most important)
┃ ↓ ┃
25% ┃ BUY ZONE ┃ ← Support quadrant
┃ ↓ ┃
0% ●━━━━━━━━━━━━━●
PRICE LEVELS:
- 0% = Bottom support (grid cell low)
- 25% = Lower mid-level support
- 50% = PERFECT BALANCE - most powerful level
- 75% = Upper mid-level resistance
- 100% = Top resistance (grid cell high)
TIME DIVISIONS:
- 0% = Cycle start (grid cell left edge)
- 25% = First quarter turn
- 50% = Mid-cycle (most powerful timing)
- 75% = Third quarter turn
- 100% = Cycle completion (grid cell right edge)
CONFLUENCE MAGIC:
When BOTH price AND time align at cardinal points simultaneously:
Example: Price at 50% level + Time at 50% of cycle = Maximum power
This is the "squaring" Gann referred to.
━━━━━━━━━━━━━━━━━━━━━━━━━━━━━━━━━━━━━━━━
📊 KEY FEATURES
━━━━━━━━━━━━━━━━━━━━━━━━━━━━━━━━━━━━━━━━
✅ Dynamic Grid System (1x1 to 7x7) - Automatically constructed from swing high to swing low
✅ Sacred Geometry Hexagrams - Overlapping triangles creating Star of David pattern
✅ Golden Ratio (φ = 1.618) Inner Triangles - Fibonacci harmony in geometry
✅ 9 Complete Gann Angles - 1x1, 2x1, 1x2, 3x1, 1x3, 4x1, 1x4, 8x1, 1x8
✅ Cardinal Cross Levels - 0%, 25%, 50%, 75%, 100% price divisions
✅ Gann 8ths Timing Cycles - 1/8, 1/4, 3/8, 1/2, 5/8, 3/4, 7/8 time divisions
✅ Price-Time Square Balance - Gann's principle of harmonious price-time relationship
✅ Advanced Confluence Scoring - Multi-factor signal validation (8-30 score range)
✅ Optimized Geometry Display - Shows full detail only near current price (reduces clutter)
✅ Customizable Visual Themes - Full color and thickness control
━━━━━━━━━━━━━━━━━━━━━━━━━━━━━━━━━━━━━━━━
🎯 HOW IT WORKS
━━━━━━━━━━━━━━━━━━━━━━━━━━━━━━━━━━━━━━━━
📍 GRID CONSTRUCTION:
The indicator identifies the most recent significant swing high-to-low movement using
configurable pivot periods (default: 88 bars). This creates the base "square" which is
then replicated in a grid pattern both vertically (price) and horizontally (time).
📐 SACRED GEOMETRY:
Each grid cell contains:
- Outer hexagram (Star of David) formed by two overlapping triangles
- Inner φ-ratio triangles scaled by the Golden Ratio
- Gann angles radiating from the center point
- Cardinal cross levels dividing price into quarters
🔍 CONFLUENCE SCORING SYSTEM:
Signals are generated when multiple Gann principles align:
1. Cardinal Cross Levels (0-6 points) - Price at key quarter divisions
2. Gann Angle Touches (0-5 points) - Price touching dynamic support/resistance angles
3. Angle Clustering (0-6 points) - Multiple angles converging = strong zone
4. Gann 8ths Timing (0-3 points) - At critical time cycle points
5. Price-Time Square (0-4 points) - Balanced price/time movement
6. Trend Alignment (0-3 points) - Signal direction matches trend
7. Grid Boundary Timing (0-3 points) - Near cell edges = reversal zones
8. φ Triangle Touches (0-2 points) - Golden ratio support/resistance
9. Reversal Patterns (0-2 points) - Wick rejections confirming reversal
Minimum confluence score of 15 required for signal (adjustable 8-30).
━━━━━━━━━━━━━━━━━━━━━━━━━━━━━━━━━━━━━━━━
⚙️ RECOMMENDED SETTINGS
━━━━━━━━━━━━━━━━━━━━━━━━━━━━━━━━━━━━━━━━
📊 For Daily Charts (Swing Trading):
- Gann Number: 88
- Grid Size: 4x4
- Confluence Score: 15
- Geometry Range: 5
- Trend Filter: ON
📊 For 4H Charts (Intraday):
- Gann Number: 44
- Grid Size: 3x3
- Confluence Score: 12-13
- Geometry Range: 3-4
- Trend Filter: ON
📊 For 15M Charts (Scalping):
- Gann Number: 22
- Grid Size: 2x2
- Confluence Score: 10-12
- Geometry Range: 2-3
- Allow Counter-Trend: Consider enabling
━━━━━━━━━━━━━━━━━━━━━━━━━━━━━━━━━━━━━━━━
📚 BEST PRACTICES
━━━━━━━━━━━━━━━━━━━━━━━━━━━━━━━━━━━━━━━━
✓ Use higher confluence scores (15+) for higher probability trades
✓ Combine with volume analysis for confirmation
✓ Respect trend filter - signals with trend are stronger
✓ Watch for signals at grid boundaries (time cycle completions)
✓ Higher scores (20+) indicate exceptional setups
✓ Use alerts to catch signals in real-time
✓ Works best on liquid markets with clear swings
EXAMPLE 1: Strong Buy Signal (Score: 18)
✓ Price touched 50% level (6 pts)
✓ 1x1 Gann angle support (5 pts)
✓ At Gann 8th cycle point (3 pts)
✓ Price-Time squared (4 pts)
= High probability long entry
EXAMPLE 2: Medium Sell Signal (Score: 15)
✓ Price at 75% level (4 pts)
✓ 2x1 angle resistance (3 pts)
✓ Trend aligned downward (3 pts)
✓ Near grid boundary (3 pts)
✓ Bearish wick rejection (2 pts)
= Valid short entry
━━━━━━━━━━━━━━━━━━━━━━━━━━━━━━━━━━━━━━━━
🎨 CUSTOMIZATION OPTIONS
━━━━━━━━━━━━━━━━━━━━━━━━━━━━━━━━━━━━━━━━
- Structure: Gann Number (11, 22, 44, 88, 176, 352)
- Grid: Size from 1x1 to 7x7
- Geometry: Toggle squares, triangles, angles, levels
- Optimization: Show geometry only near price (performance boost)
- Thickness: All line widths adjustable (1-5)
- Colors: Full color customization for all elements
- Scoring: Adjust all tolerance and threshold parameters
- Timing: Enable/disable Gann 8ths, Price-Time Square
- Filters: Trend filter, boundary requirement, counter-trend signals
- Display: 4 signal styles (Labels, Diamonds, Circles, Stars)
━━━━━━━━━━━━━━━━━━━━━━━━━━━━━━━━━━━━━━━━
⚠️ IMPORTANT NOTES
━━━━━━━━━━━━━━━━━━━━━━━━━━━━━━━━━━━━━━━━
- This indicator is for educational purposes
- Not financial advice - always do your own research
- Past performance does not guarantee future results
- Use proper risk management and position sizing
- Combine with other analysis methods for best results
- Grid redraws when new swing high/low forms
- Signals appear in real-time based on confluence scoring
━━━━━━━━━━━━━━━━━━━━━━━━━━━━━━━━━━━━━━━━
📞 SUPPORT & UPDATES
━━━━━━━━━━━━━━━━━━━━━━━━━━━━━━━━━━━━━━━━
Follow for updates and improvements. Feedback welcome!
Version 1.2 - January 2025
- Optimized geometry rendering
- Enhanced confluence scoring
- Improved visual clarity
- Performance optimizations
━━━━━━━━━━━━━━━━━━━━━━━━━━━━━━━━━━━━━━━━

Hull DMI - MattesHull DMI - Mattes
A Directional Movement Index enhanced with Hull Moving Average smoothing for refined trend detection.
This indicator reimagines the classic Directional Movement Index (DMI) by incorporating Hull Moving Average (HMA) smoothing on high and low prices. It calculates the +DI and -DI components based on changes in these hulled values, then derives the ADX for trend strength. The core plot displays the difference between +DI and -DI, colored to indicate bullish (blue) or bearish (purple) dominance when ADX is rising. Additionally, it overlays colored candles on the price chart to visually represent the prevailing trend direction.
Key Features:
Hull-Smoothed Inputs: Applies HMA to highs and lows before computing directional changes, reducing noise and lag compared to standard DMI.
Customizable Lengths: Adjustable periods for HMA, DI, and ADX smoothing to suit various timeframes and assets.
Trend Visualization: Plots DI difference with dynamic coloring and overlays trend-colored candles for at-a-glance analysis.
Alert Conditions: Built-in alerts for long (bullish) and short (bearish) signals when conditions shift.
How It Differs from Standard DMI/ADX:
Unlike the traditional DMI, which uses raw price changes and true range, this version employs Hull Moving Averages on highs and lows for smoother, more responsive directional calculations. This minimizes whipsaws in choppy markets while preserving sensitivity to genuine trends. The ADX is integrated to filter signals, ensuring color changes and alerts only occur during strengthening trends, setting it apart from basic oscillator-based indicators. Why It's Useful:
Enhanced Trend Identification: The HMA smoothing provides clearer signals in volatile environments, helping traders spot emerging trends earlier.
Visual Clarity: Colored DI plot and candle overlays make it easy to interpret market bias without cluttering the chart.
Versatility: Suitable for stocks, forex, crypto, and more; excels in trend-following strategies or as a filter for other systems.
Risk Management Aid: By focusing on ADX-confirmed moves, it reduces false signals, potentially improving win rates in systematic trading.
This Hull DMI variant offers several practical advantages that can directly improve trading decisions and performance:
Reduced Lag with Smoother Signals: By applying Hull Moving Average smoothing to highs and lows, the indicator responds faster to genuine trend changes than the standard DMI while filtering out much of the noise that causes false signals in ranging or choppy markets. Traders get earlier entries into trending moves without excessive whipsaws.
Built-in Trend Strength Filter: The optional ADX confirmation (enabled by default) ensures bullish signals and blue coloring only activate when trend strength is increasing (ADX rising). This helps traders avoid entering long positions during weakening or sideways trends, focusing capital on higher-probability setups.
Clear Visual Bias at a Glance: The single oscillator line (+DI – -DI) centered on zero, combined with dynamic blue/purple coloring and full candle overlay on the price chart, instantly shows the dominant trend direction. No need to interpret multiple lines—traders can quickly assess market bias across multiple charts or timeframes.
Versatile Across Markets and Styles: Works effectively on stocks, forex, futures, and cryptocurrencies. Trend-following traders can use it standalone for entries/exits, swing traders can use it for bias confirmation, and scalpers/day traders benefit on lower timeframes due to the reduced lag.
Improved Risk Management: By prioritizing ADX-confirmed directional moves, the indicator naturally filters low-conviction setups. This can lead to higher win rates and better risk-reward ratios when used systematically, especially when combined with proper stop-loss placement below/above recent swings.
Easy Integration: Built-in alert conditions and simple long/short logic make it straightforward to incorporate into automated strategies, watchlists, or as a confirming filter alongside other indicators (e.g., moving averages, RSI, volume profile).
Customizable Sensitivity: Separate inputs for Hull length, DI period, and ADX smoothing allow traders to optimize the indicator for specific assets, volatility regimes, or personal trading horizons—making it adaptable rather than one-size-fits-all.
Signals & Interpretation
The oscillator plots the difference between +DI and -DI (positive = bullish dominance, negative = bearish).
Bullish Signal (Long): +DI crosses above -DI, and (if ADX confirmation enabled) ADX is rising — triggers blue coloring, candle overlay, and long alert.
Bearish Signal (Short): -DI crosses above +DI — triggers purple coloring, candle overlay, and short alert.
Zero line acts as neutrality; crossings indicate potential trend shifts.
Best used in trending markets; ADX rising filter helps avoid whipsaws.
// Example Usage in Strategy
strategy("Hull DMI Strategy Example", overlay=true)
if L
strategy.entry("Long", strategy.long)
if S
strategy.entry("Short", strategy.short)
Great Inventions Require great care
Disclaimer: This indicator is provided for educational and informational purposes only and should not be considered as financial advice. Past performance is not indicative of future results. Always backtest thoroughly on your specific assets and timeframes, and consult a qualified financial advisor before making trading decisions. The author assumes no responsibility for any losses incurred from its use.

Classic Chartism-Market Structure- Support.ResistanceClassic Chartism – Market Structure + Support & Resistance
This indicator is designed for traditional chart-based technical analysis, relying exclusively on price action and market structure, without the use of oscillators or lagging indicators.
The script automatically detects significant swing highs and swing lows using confirmed pivots and classifies price structure according to classic market structure notation:
HH (Higher High)
HL (Higher Low)
LH (Lower High)
LL (Lower Low)
Based on these swings, the indicator plots horizontal Support & Resistance (SR) levels, representing historically significant areas of supply and demand. These levels remain active until invalidated by price, providing a clear and objective market context.
The indicator does not repaint once a swing is confirmed, making it suitable for real-time analysis and discretionary trading decisions. It performs well across cryptocurrencies, futures, indices, and equities, and is particularly useful for trend identification, pullback entries, and structure-based risk management.

Gann VooDoo LinesGann VooDoo Lines Indicator
Description
- Gann VooDoo Lines is a precise overlay indicator that applies W.D. Gann's Square of 9 mathematics to generate static horizontal support and resistance levels from a single manual anchor price. It calculates 8 key vibrational degrees (45°, 90°, 135°, 180°, 225°, 270°, 315°, 360°) both upward (resistance) and downward (support), delivering clean, timeframe-independent price zones.
Key Features
- Manual anchor price input for complete control
- Individual toggles for each of the 8 degrees
- "Both (Support + Resistance)" mode to display levels in both directions simultaneously
- Extend lines left/right or both
- Dynamic right-side labels that follow the latest bar
- Price values automatically displayed on the right price scale for all visible lines (including anchor)
- Customizable resistance, support, and anchor colors
What Makes It Unique (Compared to Other Gann Scripts)
- Unlike most Gann indicators on TradingView (which typically focus on sloping angles/fans, auto-detected swings, or limited degrees), Gann VooDoo Lines uses pure static Square of 9 horizontal levels with full individual toggles for all 8 degrees and a dedicated "Both" mode — allowing you to view support and resistance simultaneously without overlap or clutter. The combination of per-degree toggles, dynamic right-side labels, and clean price scale integration (no duplicates or repainting) sets it apart from generic Gann tools that often lack this granular control and visual clarity.
How to Use and Trade With It
- Set the anchor properly — this is the most critical step:
- Choose a major significant price extreme (all-time high/low, major swing high/low, or key psychological level).
- For higher timeframes (daily/weekly): use long-term extremes (e.g., all-time low/high) for "master" levels that influence price over months/years.
- For lower timeframes/intraday: use recent session extremes (today's open, previous close, or recent swing high/low) and update the anchor as needed for fresh levels.
- Experiment: test different anchors and observe which produces the most reactions.
Trading approach:
- Watch for price reactions (reversals, bounces, accelerations) at the lines — especially confluence with multiple degrees or right-side labels.
- Use in "Both" mode for full support/resistance picture.
- Combine with price action (candlestick patterns, volume) for entries/exits.
- Toggle off unused degrees to declutter the chart.

PA SystemPA System
短简介 Short Description(放在最上面)
中文:
PA System 是一套以 AL Brooks 价格行为为核心的策略(Strategy),将 结构(HH/HL/LH/LL)→ 回调(H1/L1)→ 二次入场(H2/L2 微平台突破) 串成完整可回测流程,并可选叠加 BoS/CHoCH 结构突破过滤 与 Liquidity Sweep(扫流动性)确认。内置风险管理:定风险仓位、部分止盈、保本、移动止损、时间止损、冷却期。
English:
PA System is an AL Brooks–inspired Price Action strategy that chains Market Structure (HH/HL/LH/LL) → Pullback (H1/L1) → Second Entry (H2/L2 via Micro Range Breakout) into a complete backtestable workflow, with optional BoS/CHoCH structure-break filtering and Liquidity Sweep confirmation. Built-in risk management includes risk-based sizing, partial exits, breakeven, trailing stops, time stop, and cooldown.
⸻
1) 核心理念 Core Idea
中文:
这不是“指标堆叠”,而是一条清晰的价格行为决策链:
结构确认 → 回调出现 → 小平台突破(二次入场)→ 风控出场。
策略把 Brooks 常见的“二次入场”思路程序化,同时用可选的结构突破与扫流动性模块提升信号质量、减少震荡误入。
English:
This is not an “indicator soup.” It’s a clear price-action decision chain:
Confirmed structure → Pullback → Micro-range breakout (second entry) → Risk-managed exits.
The system programmatically implements the Brooks-style “second entry” concept, and optionally adds structure-break and liquidity-sweep context to reduce chop and improve trade quality.
⸻
2) 主要模块 Main Modules
A. 结构识别 Market Structure (HH/HL/LH/LL)
中文:
使用 pivot 摆动点确认结构,标记 HH/HL/LH/LL,并可显示最近一组摆动水平线,方便对照结构位置。
English:
Uses confirmed pivot swings to label HH/HL/LH/LL and optionally plots the most recent swing levels for clean structure context.
B. 状态机 Market Regime (State Machine + “Always In”)
中文:
基于趋势K强度、EMA关系与波动范围,识别市场环境(Breakout/Channel/Range)以及 Always-In 方向,用于过滤不合适的交易环境。
English:
A lightweight regime engine detects Breakout/Channel/Range and an “Always In” directional bias using momentum and EMA/range context to avoid low-quality conditions.
C. 二次入场 Second Entry Engine (H1→H2 / L1→L2)
中文:
• H1/L1:回调到结构附近并出现反转迹象
• H2/L2:在 H1/L1 后等待最小 bars,然后触发 Micro Range Breakout(小平台突破)并要求信号K收盘强度达标
这一段是策略的“主发动机”。
English:
• H1/L1: Pullback into structure with reversal intent
• H2/L2: After a minimum wait, triggers on Micro Range Breakout plus a configurable close-strength filter
This is the main “entry engine.”
D. 可选过滤器 Optional Filters (Quality Boost)
BoS/CHoCH(结构突破过滤)
中文: 可识别 BoS / CHoCH,并可要求“入场前最近 N bars 必须有同向 break”。
English: Detects BoS/CHoCH and can require a recent same-direction break within N bars.
Liquidity Sweeps(扫流动性确认)
中文: 画出 pivot 高/低的流动性水平线,检测“刺破后收回”的 sweep,并可要求入场前出现同向 sweep。
English: Tracks pivot-based liquidity levels, confirms sweeps (pierce-and-reclaim), and can require a recent sweep before entry.
E. FVG 可视化 FVG Visualization
中文: 提供 FVG 区域盒子与管理模式(仅保留未回补 / 仅保留最近N),主要用于区域理解与复盘,不作为强制入场条件(可自行扩展)。
English: Displays FVG boxes with retention modes (unfilled-only or last-N). Primarily for context/analysis; not required for entries (you can extend it as a filter/target).
⸻
3) 风险管理 Risk Management (Built-In)
中文:
• 定风险仓位:按账户权益百分比计算仓位
• SL/TP:基于结构 + ATR 缓冲,且限制最大止损 ATR 倍
• 部分止盈:到达指定 R 后减仓
• 保本:到达指定 R 后推到 BE
• 移动止损:到达指定 R 后开始跟随
• 时间止损:持仓太久不动则退出
• 冷却期:出场后等待 N bars 再允许新单
English:
• Risk-based sizing: position size from equity risk %
• SL/TP: structure + ATR buffer with max ATR risk cap
• Partial exits at an R threshold
• Breakeven at an R threshold
• Trailing stop activation at an R threshold
• Time stop to reduce chop damage
• Cooldown after exit to avoid rapid re-entries
⸻
4) 推荐使用方式 Recommended Usage
中文:
• 推荐从 5m / 15m / 1H 开始测试
• 想更稳:开启 EMA Filter + Break Filter + Sweep Filter,并提高 Close Strength
• 想更多信号:关闭 Break/Sweep 过滤或降低 Swing Length / Close Strength
• 回测时务必设置合理的手续费与滑点,尤其是期货/指数
English:
• Start testing on 5m / 15m / 1H
• For higher quality: enable EMA Filter + Break Filter + Sweep Filter and increase Close Strength
• For more signals: disable Break/Sweep filters or reduce Swing Length / Close Strength
• Use realistic commissions/slippage in backtests (especially for futures/indices)
⸻
5) 重要说明 Notes
中文:
结构 pivot 需要右侧确认 bars,因此结构点存在天然滞后(确认后不会再变)。策略逻辑尽量避免不必要的对象堆叠,并对数组/对象做了稳定管理,适合长期运行与复盘。
English:
Pivot-based structure requires right-side confirmation (inherent lag; once confirmed it won’t change). The script is designed for stability and resource-safe object management, suitable for long sessions and review.
⸻
免责声明 Disclaimer(建议原样保留)
中文:
本脚本仅用于教育与研究目的,不构成任何投资建议。策略回测结果受市场条件、手续费、滑点、交易时段、数据质量等影响显著。使用者需自行验证并承担全部风险。过往表现不代表未来结果。
English:
This script is for educational and research purposes only and does not constitute financial advice. Backtest results are highly sensitive to market conditions, fees, slippage, session settings, and data quality. Use at your own risk. Past performance is not indicative of future results.

Next Candle PredictorAdvanced TradingView Indicator for Precise Buy and Sell Signals
Overview:
The Predicta Futures - Next Candle Predictor is a cutting-edge TradingView indicator designed to forecast the next candle's direction in futures and cryptocurrency markets. Leveraging a multi-indicator confluence strategy, this tool provides traders with actionable long and short prediction percentages, enhanced by dynamic ADX-based thresholds and visual projection candles. Ideal for scalping, day trading, or swing trading on platforms like MEXC or Binance futures, it combines Supertrend, MACD, RSI, Stochastic, ADX, and volume analysis to deliver high-probability buy and sell signals while minimizing false positives.
Key Features:
• Multi-Indicator Confluence Scoring:
Integrates Supertrend for trend direction, EMAs (8, 21, 50) for alignment, MACD for momentum crossovers, RSI for overbought/oversold conditions, Stochastic for divergence detection, ADX for trend strength, and volume ratios for confirmation. A customizable confluence score (0-6) ensures signals meet user-defined criteria, reducing whipsaws in volatile markets.
• Dynamic Prediction Thresholds:
ADX-driven adjustments lower the required prediction percentage (e.g., 60% in strong trends) for "PERFECT TIME" entries, adapting to market conditions like ranging or trending phases.
• Visual Analysis Table:
A sleek, color-coded dashboard displays progress bars for each indicator, prediction percentages, and status (e.g., "PERFECT TIME" or "WAIT"). Supports long and short analyses with intuitive ASCII bars for quick scans.
• Projection Candles:
Simulates potential next-candle outcomes with volatility-scaled (via Bollinger Bands width) green long and red short candles, aiding in visualizing price targets.
• Buy/Sell Signals and Alerts:
Generates labeled "BUY" and "SELL" arrows on EMA crossovers within confirmed trends, with separate alerts for basic signals and high-confluence "PERFECT TIME" opportunities.
• Customizable Inputs:
Adjust ATR periods, Supertrend factors, minimum confluence scores, and volume ratios to tailor the indicator for stocks, forex, or crypto perpetual futures.
How It Works:
This TradingView script calculates long and short scores using weighted contributions from key indicators, normalizing them into prediction percentages. A confluence check—factoring trend, EMA alignment, MACD, Stochastic, volume, and ADX—triggers "PERFECT TIME" only when conditions align robustly. For example:
• In a downtrend (Supertrend red), with bearish MACD and Stochastic, and sufficient volume, the indicator highlights short opportunities.
• Dynamic thresholds ensure aggressive entries in strong trends (ADX >25) and conservative ones in weak trends.
• Backtested for reliability, it excels in identifying reversals and continuations, making it a must-have for traders seeking an edge in futures trading strategies.
Usage Instructions:
1. Add the indicator to your TradingView chart. (Search: Next Candle Predictor)
2. Customize settings via the inputs panel (e.g., set minConfluence to 5 for stricter signals).
3. Monitor the analysis table for predictions and confluence scores.
4. Act on "BUY/SELL" labels or "PERFECT TIME" alerts, combining with your risk management.
5. Enable projection candles for visual forecasting of the next bar.
Compatible with all timeframes, from 1-minute scalping to daily swings. Note: This is not financial advice; always verify signals with additional analysis.
Join thousands of traders enhancing their strategies—add it to your charts today and elevate your trading performance!
Please rate and review if it boosts your trades!
Thank you!

SMC Post-Analysis Lab [PhenLabs]📊 SMC Post-Analysis Lab
Version: PineScript™ v6
📌 Description
The SMC Post-Analysis Lab is a dedicated hindsight analysis tool built for traders who want to understand what really happened during any historical trading period. Unlike forward-looking indicators, this tool lets you scroll back through time and instantly receive algorithmic classification of market states using Smart Money Concepts methodology.
Whether you’re reviewing a losing trade, studying a successful session, or building your pattern recognition skills, this indicator provides immediate context. The expansion-aware algorithm processes price action within your selected window and outputs clear, actionable classifications ranging from Parabolic Expansion to Consolidation Inducements.
Stop relying on subjective post-trade analysis. Let the algorithm objectively tell you whether institutional players were accumulating, distributing, or running inducements during your trades.
🚀 Points of Innovation
First indicator specifically designed for SMC-based post-trade review rather than live signal generation
Dual-mode analysis system allowing both dynamic scrollback and precise date selection
Expansion-aware classification algorithm that weighs range position against net displacement
Real-time efficiency metrics calculating directional quality of price movement
Integrated visual FVG detection within the analysis window only
Interactive table with clickable date range adjustment via chart interface
🔧 Core Components
Pivot Detection Engine: Uses configurable pivot length to identify significant swing highs and lows for structure break detection
Window Calculator: Determines active analysis zone based on either bar offset or timestamp boundaries
Data Aggregator: Tracks window open, high, low, close and counts bullish/bearish structure break events
State Classification Algorithm: Applies hierarchical logic to determine market state from six possible classifications
Visual Renderer: Draws structure breaks, FVG boxes, and window highlighting within the active zone
🔥 Key Features
Sliding Window Mode: Use the Scroll Back slider to dynamically move your analysis zone backwards through history bar-by-bar
Date Range Mode: Select specific start and end timestamps for precise session or trade review
Six Market State Classifications: Parabolic Expansion (Bull/Bear), Bullish/Bearish Order Flow, Accumulation/Distribution Reversal, and Consolidation/Inducement
Range Position Percentile: See exactly where price closed relative to the window’s high-low range as a percentage
Bull/Bear Event Counter: Quantified count of structure breaks in each direction during the analysis period
Efficiency Calculation: Net move divided by total range reveals trending quality versus chop
🎨 Visualization
Blue Window Highlight: Active analysis zone is clearly marked with blue background shading on the chart
Structure Break Lines: Dashed lines appear at each bullish or bearish structure break within the window
FVG Boxes: Fair Value Gaps automatically render as semi-transparent boxes in bullish or bearish colors
Dashboard Table: Top-right positioned table displays State, Analysis description, and Metrics in real-time
Color-Coded States: Each classification uses distinct coloring for immediate visual recognition
Interactive Tip Row: Optional help text guides users on clicking the table to adjust date range
📖 Usage Guidelines
General Configuration
Analysis Mode: Default is Sliding Window. Choose Date Range for specific timestamp analysis.
Sliding Window Settings
Scroll Back (Bars): Default 0. Increase to move window backwards into history.
Window Width (Bars): Default 100. Range 20-50 for scalping, 100+ for swing analysis.
Date Range Settings
Start Date: Select the beginning timestamp for your analysis period.
End Date: Select the ending timestamp for your analysis period.
Visual Settings
Show Help Tip: Default true. Toggle to hide instructional row in dashboard.
Bullish Color: Default teal. Customize for bullish elements.
Bearish Color: Default red. Customize for bearish elements.
SMC Parameters
Pivot Length: Default 5. Lower values (3-5) catch minor breaks. Higher values (10+) focus on major swings.
✅ Best Use Cases
Post-trade review to understand why entries succeeded or failed
Session analysis to identify institutional activity patterns
Trade journaling with objective algorithmic classifications
Pattern recognition training through historical scrollback
Identifying whether stop hunts were inducements or legitimate breaks
Comparing your real-time read versus what the algorithm detected
⚠️ Limitations
Designed for historical analysis only, not live trade signals
Classification accuracy depends on appropriate pivot length for the timeframe
FVG detection uses simple gap logic without mitigation tracking
State classification is based on window data only, not broader context
Requires manual scrolling or date input to review different periods
💡 What Makes This Unique
Purpose-Built for Review: Unlike most indicators focused on live signals, this is designed specifically for post-trade analysis
Expansion-Aware Logic: Algorithm weighs both position in range AND directional efficiency for accurate state detection
Interactive Date Control: Click the dashboard table to reveal draggable anchors for window adjustment directly on chart
🔬 How It Works
1. Window Definition:
User selects either Sliding Window or Date Range mode
System calculates which bars fall within the active analysis zone
Active zone receives blue background highlighting
2. Data Collection:
Algorithm captures window open, running high, running low, and current close
Structure breaks are detected when price crosses above last pivot high or below last pivot low
Bullish and bearish events are counted separately
3. State Classification:
Range Position calculates where close sits as percentage of high-low range
Efficiency calculates net move divided by total range
Hierarchical logic applies priority rules from Parabolic states down to Consolidation
4. Output Rendering:
Dashboard table updates with State title, Analysis description, and Metrics
Visual elements render within window only to keep chart clean
Colors reflect bullish, bearish, or neutral classification
💡 Note:
This indicator is intended for educational and review purposes. Use it to develop your understanding of Smart Money Concepts by analyzing what institutional order flow looked like during historical periods. Combine insights with your own analysis methodology for best results.

Order Flow: Structural Sniper [Profile + Signals]Overview
This script is a comprehensive tool designed to bridge the gap between Market Structure and Order Flow analysis. It aims to eliminate the subjectivity of static support and resistance lines by focusing on dynamic liquidity and the behavior of aggressive versus passive market participants.
Unlike traditional indicators that plot static data, the Structural Delta Map dynamically anchors its analysis to the start of the current trend (Pivots), providing a clear "X-Ray" view of how volume was distributed during the current price swing.
How it Works
The indicator combines three distinct technical concepts into a single system:
1. Market Structure (Pivots):
It uses a pivot detection algorithm to identify significant Swing Highs and Swing Lows. This determines the market bias and anchors the analysis to the origin of the movement.
2. Anchored VWAP (Fair Price):
It automatically calculates the Volume Weighted Average Price (VWAP) starting from the last confirmed pivot. This yellow line acts as the "spine" of the trend, serving as dynamic institutional support/resistance.
3. Delta Profile & Heatmap:
A Volume Profile is plotted on the left side, anchored to the pivot.
Split Delta: Instead of a single color, bars are split into Green (Buying Volume) and Red (Selling Volume) based on price action estimation.
Heatmap Logic: The opacity of the bars adjusts automatically. Bright/Solid bars represent High Volume Nodes (HVN), while transparent bars represent Low Volume Nodes (LVN) or liquidity voids.
How to Use (Strategy)
The indicator provides both visual context and specific entry signals:
1. Visual Context:
Profile: Look for reactions at bright, wide bars (High Volume Nodes). These act as magnets or barriers.
Yellow Line (VWAP): In an uptrend, look for buy opportunities when price retraces to this line. In a downtrend, look for shorts on the retest.
2. Aggression Signals (Triangle "AGR"):
Type: Trend Continuation / Pullback.
Logic: Triggers when price retraces to the structural value zone (near VWAP), rejects it with higher-than-average volume, and closes in the direction of the trend.
3. Absorption Signals (Cross "ABS"):
Type: Reversal / Trap.
Logic:
Bullish Absorption: Price makes a new local low with high volume (selling pressure), but the candle closes bullish (leaving a long bottom wick). Passive buyers absorbed the aggression.
Bearish Absorption: Price makes a new local high with high volume, but closes bearish. Passive sellers absorbed the buying pressure.
Settings
Pivot Sensitivity: Adjusts how the script detects trend changes.
Profile Resolution: Controls the number of rows in the histogram.
Signal Filters: Enable/Disable signals and adjust the Volume Multiplier threshold.
Technical Disclaimer
This indicator estimates "Delta" (Buy vs. Sell volume) based on OHLC price action and bar volume, as Pine Script does not grant access to historical tick-by-tick data. While this approximation is highly effective for identifying aggression and absorption, it differs slightly from Level 2 footprint data found on platforms like Sierra Chart. Accuracy depends on the volume data provided by your exchange.

VD FRFS PRO
VD FRFS PRO
This trader centric, multi-functional indicator built on **Pine Script™ v6** that seamlessly integrates four of the most critical price and volatility tools into a single overlay. Designed for day traders, swing traders, and institutional analysts, this tool provides a comprehensive view of volatility, trend, volume-based pricing, and structure, all without chart clutter.
Overview & Concept
The VD FRFS PRO is engineered for efficiency and clarity. Instead of layering four separate indicators, which can lead to performance issues and confusion, this script combines the calculations into one, allowing traders to execute complex technical analysis rapidly.
It serves as a powerful foundation for strategies that require:
1. Volatility Assessment (Bollinger Bands)
2. Volume-Weighted Fair Value (VWAP)
3. Price Structure & Swings (Zig Zag)
4. Dynamic Trend Filtering (Configurable SMA)
Customization & Settings
All inputs are logically grouped for ease of use in the indicator's settings menu.
Bollinger Bands
BB Length: Period for the Basis SMA and StdDev calculation (default: 20).
BB Source: Price series for the calculation (default: `close`).
BB StdDev Multiplier: Multiplier for the Standard Deviation (default: 2.0).
BB Offset: Shifts the bands horizontally (default: 0).
VWAP Settings
VWAP Source: Price series for the VWAP calculation (default: `hlc3`).
Zig Zag Settings
Zig Zag High/Low Length: Lookback period for determining swing points (default: 3).
SMA Settings
SMA Period: Lookback period for the configurable SMA (default: 20).
Show SMA: Checkbox to toggle the visibility of this SMA (default: `true`).
Disclaimer
Feel free to reach out for suggestions and modification requests.
Daily Fib Levels Clean (Retrace + Extension)This indicator automatically detects the latest Daily Swing High and Swing Low and plots clean Fibonacci retracement levels based on those swings.
Even if you switch to 4H, 1H, 15m, or 5m, the levels remain locked to the Daily timeframe, giving you consistent higher-timeframe structure on any chart.

Long Only EMA Strategy (9/20 with 200 EMA Filter)Details:
This strategy is built around a very simple idea: follow the primary trend and enter only when momentum supports it.
It uses three EMAs on a standard candlestick chart:
1. 9‑period EMA – short‑term momentum
2. 20‑period EMA – medium‑term structure
3. 200‑period EMA – long‑term trend filter
The strategy is ** long‑only ** and is mainly designed for swing trading and positional trading.
It avoids counter‑trend trades by taking entries only when price is trading ** above the 200 EMA **, which is commonly used as a long‑term trend reference.
The rules are deliberately kept simple so that they are easy to understand, modify, and test on different markets and timeframes.
---
Key Features
1. **Trend‑Filtered Entries**
- Fresh long positions are considered only when:
- The 9 EMA crosses above the 20 EMA
- The closing price is **above** the 200 EMA
- This attempts to combine short‑term momentum with a higher‑timeframe trend filter.
2. **Clean Exit Logic**
- The long position is exited when the closing price crosses **below** the 20 EMA.
- This creates an objective, rule‑based way to trail the trade as long as the medium‑term structure remains intact.
3. **Long‑Only, No Short Selling**
- The script intentionally ignores short setups.
- This makes it suitable for markets or accounts where short selling is restricted, or for traders who prefer to participate only on the long side of the market.
4. **Simple Visuals**
- All three EMAs are plotted directly on the chart:
- 9 EMA (fast)
- 20 EMA (medium)
- 200 EMA (trend)
- Trade entries and exits are handled by TradingView’s strategy engine, so users can see results in the Strategy Tester as well as directly on the chart.
5. **Backtest‑Friendly Structure**
- Uses TradingView’s built‑in `strategy()` framework.
- Can be applied to different symbols, timeframes, and markets (equities, indices, crypto, etc.).
- Works on standard candlestick charts, which are supported by TradingView’s backtesting engine.
6. **Configurable in Code**
- The EMA periods are defined in the code and can be easily adjusted.
- Users can tailor the parameters to fit their own style (for example, faster EMAs for intraday trading, slower EMAs for positional trades).
---
How to Use
1. **Add the Strategy to Your Chart**
1. Open any symbol and select a **standard candlestick chart**.
2. Apply the strategy from your “My Scripts” section.
3. Make sure it is enabled so that the trades and results appear.
2. **Select Timeframe**
- The logic can be tested on various timeframes:
- Higher timeframes (1H, 4H, 1D) for swing and positional setups.
- Lower timeframes (5m, 15m) for more active trading, if desired.
- Users should experiment and see where the strategy behaves more consistently for their chosen market.
3. **Read the Signals**
- **Entry:**
- A long trade is opened when the 9 EMA crosses above the 20 EMA while the closing price is above the 200 EMA.
- **Exit:**
- The open long position is closed when the closing price crosses below the 20 EMA.
- All orders are generated automatically once the strategy is attached to the chart.
4. **Use the Strategy Tester**
- Go to the **Strategy Tester** tab in TradingView.
- Check:
- Net profit / drawdown
- Win rate and average trade
- List of trades and the equity curve
- Change the date range and timeframe to see how stable the results are over different periods.
5. **Adjust Parameters if Needed**
- Advanced users can open the code and experiment with:
- EMA lengths (for example 8/21 with 200, or 10/30 with 200)
- Risk sizing and capital settings within the `strategy()` call
- Any changes should be thoroughly re‑tested before considering real‑world application.
---
Practical Applications
1. **Swing Trading on Daily Charts**
- Can be applied to stocks, indices, or ETFs on the daily timeframe.
- The 200 EMA acts as a trend filter to stay aligned with the broad direction, while the 9/20 crossover helps catch medium‑term swings inside that trend.
2. **Positional Trades on Higher Timeframes**
- On 4H or 1D charts, this approach can help in holding trades for several days to weeks.
- The exit rule based on the 20 EMA crossing helps avoid emotional decisions and provides a rules‑based way to trail the trend.
3. **Trend‑Following Filter**
- Even if used purely as a filter, the 200 EMA condition can help traders:
- Avoid taking long trades when the market is in a clear downtrend.
- Focus only on instruments that are trading above their long‑term average.
4. **Educational Use**
- The script is intentionally kept straightforward so that newer users can:
- Learn how a moving average crossover strategy works.
- See how to combine a short‑term signal with a long‑term filter.
- Understand how TradingView’s strategy engine handles entries and exits.
5. **Basis for Further Development**
- This can serve as a starting point for more advanced systems.
- Traders can extend it by adding:
- Additional filters (RSI, volume, volatility filters, time‑of‑day filters, etc.)
- Risk management rules (fixed stop loss, take profit, trailing stops).
- The current version is kept minimal on purpose, so modifications are easy to implement and test.
---
Important Notes & Disclaimer
1. This strategy is provided **for testing, research, and educational purposes only**.
2. It is ** not ** a recommendation to buy or sell any financial instrument.
3. Past performance on historical data does not guarantee similar results in live markets.
4. Markets are risky and trading can lead to financial loss; users should always do their own research, manage risk appropriately, and consult a qualified financial professional if needed.
5. Before using any strategy with real capital, it is strongly advised to:
- Forward test it on a demo / paper trading account.
- Check how it behaves during different market phases (trending, sideways, high‑volatility conditions).
You are free to modify the parameters and logic to better align it with your own trading style and risk tolerance.

MTF RSI Stacked + AI + Gradient MTF RSI Stacked + AI + Gradient
Quick-start guide & best-practice rules
What the indicator does
Multi-Time-Frame RSI in one pane
• 10 time-frames (1 m → 1 M) are stacked 100 points apart (0, 100, 200 … 900).
• Each RSI is plotted with a smooth red-yellow-green gradient:
– Red = RSI below 30 (oversold)
– Yellow = RSI near 50
– Green = RSI above 70 (overbought)
• Grey 30-70 bands are drawn for every TF so you can see extremities at a glance.
Built-in AI (KNN) signal
• On every close of the chosen AI-time-frame the script:
– Takes the last 14-period RSI + normalised ATR as “features”
– Compares them to the last N bars (default 1 000)
– Votes of the k = 5 closest neighbours → BUY / SELL / NEUTRAL
• Confidence % is shown in the badge (top-right).
• A thick vertical line (green/red) is printed once when the signal flips.
How to read it
• Gradient colour tells you instantly which TFs are overbought/obove sold.
• When all or most gradients are green → broad momentum up; look for shorts only on lower-TF pullbacks.
• When most are red → broad momentum down; favour longs only on lower-TF bounces.
• Use the AI signal as a confluence filter, not a stand-alone entry:
– If AI = BUY and 3+ higher-TF RSIs just crossed > 50 → consider long.
– If AI = SELL and 3+ higher-TF RSIs just crossed < 50 → consider short.
• Divergences: price makes a higher high but 1 h/4 h RSI (gradient) makes a lower high → possible reversal.
Settings you can tweak
AI timeframe – leave empty = same as chart, or pick a higher TF (e.g. “15” or “60”) to slow the signal down.
Training bars – 500-2 000 is the sweet spot; bigger = slower but more stable.
K neighbours – 3-7; lower = more signals, higher = smoother.
RSI length – 14 is standard; 9 gives earlier turns, 21 gives fewer false swings.
Practical trading workflow
Open the symbol on your execution TF (e.g. 5 m).
Set AI timeframe to 3-5× execution TF (e.g. 15 m or 30 m) so the signal survives market noise.
Wait for AI signal to align with gradient extremes on at least one higher TF.
Enter on the first gradient reversal inside the 30-70 band on the execution TF.
Place stop beyond the swing that caused the gradient flip; target next opposing 70/30 level on the same TF or trail with structure.
Colour cheat-sheet
Bright green → RSI ≥ 70 (overbought)
Bright red → RSI ≤ 30 (oversold)
Muted colours → RSI near 50 (neutral, momentum pause)
That’s it—one pane, ten time-frames, colour-coded extremes and an AI confluence layer.
Keep the chart clean, use price action for precise entries, and let the gradient tell you when the wind is at your back.

Prime-Time × Vortex (3/6/9) — Ace (clean v3)1️⃣ Prime-Time Index (PT)
A bar becomes Prime-Time when the count satisfies the formula:
4·n − 3 is a perfect square
This generates the sequence:
1, 3, 7, 13, 21, 31, 43, 57, 73, 91, …
These are time windows where price is more likely to form:
Shifts in market structure
Impulses
Reversals
Liquidity expansions
These PT bars are drawn as small circles above the candle.
If labels are enabled, the counter value (n) is also shown.
2️⃣ Vortex 3/6/9 Digital-Root Timing
Every bar also has a digital root, calculated from the counter:
If n → digitalRoot(n) = 3, 6, or 9,
the bar is considered a Vortex bar.
These moments often align with:
Swing highs / swing lows
Micro shifts
Mini-reversals
Minor liquidity grabs
When a Prime-Time bar is also a 3/6/9 bar → high-probability timing.
These bars are highlighted in green by default.
3️⃣ Filters & Display
You can customize:
Anchor time → when counting begins
Reset daily → restart counter each new trading day
Show only 3/6/9 → hides normal PT hits
Label offset → distance above the candle
Color themes
This makes the indicator usable on:
1Min
5Min
15Min
1H
Any timeframe you want
4️⃣ How To Apply It in Trading
Use it as a time confluence tool, not a signal generator.
✔ Best ways to use:
Look for MSS, sweeps, OB retests, FVG reactions when
they occur on or near a Prime-Time or 3/6/9 bar
Expect volatility increases after PT bars
Use 3/6/9 hits to anticipate internal turning points
Combine with:
Session High/Low
Killzones (London, NYO, PM)
Purge Protocol
MMXM Execution
✔ Example:
If price sweeps a level and prints a 3/6/9 vortex bar inside a PT window →
you have a very strong timing alignment for reversal.
5️⃣ Simple Summary
Feature Meaning
Prime-Time Hit (PT) Major time window where price often shifts
3/6/9 Vortex Bar Micro-timing for internal swings
PT + 3/6/9 together High-probability timing for entries
Reset Daily Perfect for intraday models like NYO & London
Anchor Time Defines the entire cycle structure
