Swing High Swing Low ChannelSimple channel that automatically adjusts its width based on historical swings.
스크립트에서 "swing high"에 대해 찾기

Swing High Low Price Channel V.1You should buy/sell small order at small plot zone or after small plot. And, Buy/sell big order at big plot zone or after big plot.
Recommended, You should use this with Fibonacci Retracement, Price Action or Graph Pattern.

RSI Fibonacci Flow [JOAT]RSI Fibonacci Flow - Advanced Fibonacci Retracement with RSI Confluence
Introduction
RSI Fibonacci Flow is an open-source overlay indicator that combines automatic Fibonacci retracement levels with RSI momentum analysis to identify high-probability trading zones. The indicator automatically detects swing highs and lows, draws Fibonacci levels, and generates confluence signals when RSI conditions align with key Fibonacci zones.
This indicator is designed for traders who use Fibonacci retracements but want additional confirmation from momentum analysis before entering trades.
Originality and Purpose
This indicator is NOT a simple mashup of RSI and Fibonacci tools. It is an original implementation that creates a synergistic relationship between two complementary analysis methods:
Why Combine RSI with Fibonacci? Fibonacci retracements identify WHERE price might reverse, but they don't tell you WHEN. RSI provides the timing component by showing momentum exhaustion. When price reaches the Golden Zone (50%-61.8%) AND RSI shows oversold conditions, the probability of a successful bounce increases significantly.
Original Confluence Scoring System: The indicator calculates a 0-5 confluence score that weights multiple factors: Golden Zone presence (+2), entry zone presence (+1), RSI extreme alignment (+1), RSI divergence (+1), and strong RSI momentum (+1). This scoring system is original to this indicator.
Automatic Pivot Detection: Unlike manual Fibonacci tools, this indicator automatically detects swing highs and lows using a configurable pivot algorithm, then draws Fibonacci levels accordingly. The pivot detection uses a center-bar comparison method that checks if a bar's high/low is the highest/lowest within the specified depth on both sides.
Dynamic Trend Awareness: The indicator determines trend direction based on pivot sequence (last pivot was high or low) and adjusts Fibonacci orientation accordingly. In uptrends, 0% is at swing low; in downtrends, 0% is at swing high.
Each component serves a specific purpose:
Fibonacci levels identify potential reversal zones based on natural price ratios
RSI provides momentum context to filter out low-probability setups
Confluence scoring quantifies setup quality for position sizing decisions
Automatic pivot detection removes subjectivity from level placement
Core Concept: RSI-Fibonacci Confluence
The most powerful trading setups occur when multiple factors align. RSI Fibonacci Flow identifies these moments by:
Automatically detecting price pivots and drawing Fibonacci levels
Tracking which Fibonacci zone the current price occupies
Monitoring RSI for overbought/oversold conditions
Generating signals when RSI extremes coincide with key Fibonacci levels
Scoring confluence strength on a 0-5 scale
When price reaches the Golden Zone (50%-61.8%) while RSI shows oversold conditions in an uptrend, the probability of a bounce increases significantly.
Fibonacci Levels Explained
The indicator draws nine Fibonacci levels based on the most recent swing:
0% (Swing Low/High): The starting point of the move
23.6%: Shallow retracement - often seen in strong trends
38.2%: First significant support/resistance level
50%: Psychological midpoint of the move
61.8% (Golden Ratio): The most important Fibonacci level
78.6%: Deep retracement - last defense before trend failure
100% (Swing High/Low): The end point of the move
127.2% (TP1): First extension target for take profit
161.8% (TP2): Second extension target for take profit
The Golden Zone
The area between 50% and 61.8% is highlighted as the "Golden Zone" because:
It represents the optimal retracement depth for trend continuation
Institutional traders often place orders in this zone
It offers favorable risk-to-reward ratios
Price frequently bounces from this area in healthy trends
When price enters the Golden Zone, the indicator highlights it with a semi-transparent box and optional background coloring.
Pivot Detection System
The indicator uses a configurable pivot detection algorithm:
pivotDetect(float src, int len, bool isHigh) =>
int halfLen = len / 2
float centerVal = nz(src , src)
bool isPivot = true
for i = 0 to len - 1
if isHigh
if nz(src , src) > centerVal
isPivot := false
break
else
if nz(src , src) < centerVal
isPivot := false
break
isPivot ? centerVal : float(na)
This identifies swing highs and lows by checking if a bar's high/low is the highest/lowest within the specified depth on both sides.
Visual Components
1. Fibonacci Lines
Horizontal lines at each Fibonacci level:
Solid lines for major levels (0%, 50%, 61.8%, 100%)
Dashed lines for secondary levels (23.6%, 38.2%, 78.6%)
Dotted lines for extension levels (127.2%, 161.8%)
Color-coded for easy identification
Configurable line width
2. Fibonacci Labels
Price labels at each level showing:
Fibonacci percentage
Actual price at that level
Golden Zone label highlighted
TP1 and TP2 labels for targets
3. Golden Zone Box
A semi-transparent box highlighting the 50%-61.8% zone:
Gold colored border and fill
Extends from swing start to current bar (or beyond if extended)
Provides clear visual of the optimal entry zone
4. ZigZag Lines
Connecting lines between detected pivots:
Cyan for moves from low to high
Orange for moves from high to low
Helps visualize market structure
Configurable line width
5. Pivot Markers
Small labels at detected swing points:
"HH" (Higher High) at swing highs
"LL" (Lower Low) at swing lows
Helps track market structure
6. Entry Signals
BUY and SELL labels when confluence conditions are met:
BUY: RSI oversold + price in entry zone + uptrend + positive momentum
SELL: RSI overbought + price in entry zone + downtrend + negative momentum
Labels include "RSI+FIB" to indicate confluence
Confluence Scoring System
The indicator calculates a confluence score from 0 to 5:
+2 points: Price is in the Golden Zone (50%-61.8%)
+1 point: Price is in the entry zone (38.2%-61.8%)
+1 point: RSI is oversold in uptrend OR overbought in downtrend
+1 point: RSI divergence detected (bullish or bearish)
+1 point: Strong RSI momentum (change > 2 points)
Confluence ratings:
STRONG (4-5): Multiple factors align - high probability setup
MODERATE (2-3): Some factors align - proceed with caution
WEAK (0-1): Few factors align - wait for better setup
Dashboard Panel
The 10-row dashboard provides comprehensive analysis:
RSI Value: Current RSI reading (large text)
RSI State: OVERBOUGHT, OVERSOLD, BULLISH, BEARISH, or NEUTRAL
Fib Trend: UPTREND or DOWNTREND based on last pivot sequence
Price Zone: Current Fibonacci zone (e.g., "GOLDEN ZONE", "38.2% - 50%")
Price: Current close price (large text)
Confluence: Score rating with numeric value (e.g., "STRONG (4/5)")
Nearest Fib: Closest key Fibonacci level with price
TP1 (127.2%): First take profit target price
TP2 (161.8%): Second take profit target price
Input Parameters
Pivot Detection:
Pivot Depth: Bars to look back for swing detection (default: 10)
Min Deviation %: Minimum price move to confirm pivot (default: 1.0)
RSI Settings:
RSI Length: Period for RSI calculation (default: 14)
Source: Price source (default: close)
Overbought: Upper threshold (default: 70)
Oversold: Lower threshold (default: 30)
Fibonacci Display:
Show Fib Lines: Toggle Fibonacci lines (default: enabled)
Show Fib Labels: Toggle price labels (default: enabled)
Show Golden Zone Box: Toggle zone highlight (default: enabled)
Line Width: Thickness of Fibonacci lines (default: 2)
Extend Fib Lines: Extend lines into future (default: enabled)
ZigZag:
Show ZigZag: Toggle connecting lines (default: enabled)
ZigZag Width: Line thickness (default: 2)
Signals:
Show Entry Signals: Toggle BUY/SELL labels (default: enabled)
Show TP Levels: Toggle take profit in dashboard (default: enabled)
Show RSI-Fib Confluence: Toggle confluence analysis (default: enabled)
Dashboard:
Show Dashboard: Toggle information panel (default: enabled)
Position: Choose corner placement
Colors:
Bullish: Color for bullish elements (default: cyan)
Bearish: Color for bearish elements (default: orange)
Neutral: Color for neutral elements (default: gray)
Golden Zone: Color for Golden Zone highlight (default: gold)
How to Use RSI Fibonacci Flow
Identifying Entry Zones:
Wait for price to retrace to the 38.2%-61.8% zone
Check if RSI is approaching oversold (for longs) or overbought (for shorts)
Look for STRONG confluence rating in the dashboard
Enter when BUY or SELL signal appears
Setting Take Profit Targets:
TP1 at 127.2% extension for conservative target
TP2 at 161.8% extension for aggressive target
Consider scaling out at each level
Using the Price Zone:
"BELOW 23.6%" - Price hasn't retraced much; wait for deeper pullback
"23.6% - 38.2%" - Shallow retracement; strong trend continuation possible
"38.2% - 50%" - Good entry zone for trend trades
"GOLDEN ZONE" - Optimal entry zone; highest probability
"61.8% - 78.6%" - Deep retracement; trend may be weakening
"78.6% - 100%" - Very deep; trend reversal possible
"ABOVE/BELOW 100%" - Trend has likely reversed
Confluence Trading Strategy:
Only take trades with confluence score of 3 or higher
STRONG confluence (4-5) warrants larger position size
MODERATE confluence (2-3) warrants smaller position size
WEAK confluence (0-1) - wait for better setup
Alert Conditions
Ten alert conditions are available:
RSI-Fib BUY Signal: Strong bullish confluence detected
RSI-Fib SELL Signal: Strong bearish confluence detected
Price in Golden Zone: Price enters 50%-61.8% zone
New Pivot High: Swing high detected
New Pivot Low: Swing low detected
RSI Overbought: RSI crosses above overbought threshold
RSI Oversold: RSI crosses below oversold threshold
Bullish Divergence: Potential bullish RSI divergence
Bearish Divergence: Potential bearish RSI divergence
Strong Confluence: Confluence score reaches 4 or higher
Understanding Trend Direction
The indicator determines trend based on pivot sequence:
UPTREND: Last pivot was a low after a high (expecting move up)
DOWNTREND: Last pivot was a high after a low (expecting move down)
Fibonacci levels are drawn accordingly:
In uptrend: 0% at swing low, 100% at swing high
In downtrend: 0% at swing high, 100% at swing low
Bar Coloring
When confluence features are enabled:
Cyan bars on strong bullish signals
Orange bars on strong bearish signals
Gold-tinted bars when price is in Golden Zone
Best Practices
Use on 1H timeframe or higher for more reliable pivots
Adjust Pivot Depth based on timeframe (higher for longer timeframes)
Wait for price to enter Golden Zone before considering entries
Confirm RSI is in favorable territory before trading
Use extension levels (127.2%, 161.8%) for realistic profit targets
Combine with support/resistance and candlestick patterns
Higher confluence scores indicate higher probability setups
Limitations
Pivot detection has inherent lag (must wait for confirmation)
Fibonacci levels are subjective - different swings produce different levels
Works best in trending markets with clear swings
RSI can remain overbought/oversold in strong trends
Not all Golden Zone entries will be successful
The source code is open and available for review and modification.
Disclaimer
This indicator is provided for educational and informational purposes only. It is not financial advice. Trading involves substantial risk of loss. Past performance does not guarantee future results. Fibonacci levels are not guaranteed support/resistance - they are probability zones based on historical price behavior. Always conduct your own analysis and use proper risk management.
- Made with passion by officialjackofalltrades :D

Order Blocks Volume Delta 3D | Flux ChartsGENERAL OVERVIEW:
Order Blocks Volume Delta 3D by Flux Charts is a rule-based order block and volume delta visualization tool. It detects bullish and bearish order blocks using a profile-of-price approach: the indicator finds the most actively traded price area (Point of Control, or POC) between a swing high/low and the Break of Structure (BOS), then anchors the order block to the earliest still-valid candle that traded through that POC band. From there, it tracks all candles that continue to interact with that zone and overlays both 2D and 3D volume delta views directly inside the order block.
Unlike traditional order block tools that simply use candle bodies or wicks, this indicator is volume-aware. It lets you optionally pull volume from a lower timeframe feed (for example, using 1-minute data while watching a 5-minute chart) to build a much more accurate picture of how buyers and sellers actually traded inside the zone. This makes every block not just a price box, but a volume story: which side dominated, where, and by how much.
All order blocks printed by this indicator are confirmed: BOS and retests are evaluated strictly on closed candles. Nothing is drawn or alerted on partially formed bars, which helps avoid repaint-style flicker and keeps the signals clean and stable.
What is the theory behind the indicator?:
The core idea behind Order Blocks Volume Delta 3D is that not all price levels inside an order block are equal. Some prices are barely touched, while others act like magnets where candles repeatedly trade and heavy volume passes through.
The indicator first finds a swing high or swing low, waits for a clear Break of Structure (BOS), then scans the candles between the swing point and the BOS to find the price level that was touched the most. That level is treated as the POC.
From all candles in the swing-to-BOS range that interact with this POC band, the indicator looks for the earliest candle that is not already mitigated and uses that as the anchor candle for the order block:
The top of the block equals the anchor candle’s high (for a bearish OB) or the top of its wick zone.
The bottom equals the anchor candle’s low (for a bullish OB) or the bottom of its wick zone.
This “earliest valid POC-touching candle” rule makes it easier to visualize how price and volume developed from the very start of a meaningful zone, while ignoring POC touches that are already fully mitigated by the time the structure is confirmed. On top of that, each candle is split into bullish and bearish volume. If you choose a lower timeframe volume input, the tool aggregates lower timeframe candles into your chart timeframe, giving a more granular bull-versus-bear breakdown for each bar. The result is
an order block that not only shows where price moved but also which side pushed it, how aggressively, and how that balance shifted over time.
ORDER BLOCKS VOLUME DELTA 3D FEATURES:
The Order Blocks Volume Delta 3D indicator includes 4 main features:
1. Order Blocks
2. Volume Delta
3. 3D Visualization
4. Alerts
ORDER BLOCKS:
🔹What is an Order Block
An order block is a price zone where a clear displacement move began after liquidity was taken. It usually forms around the last consolidation or cluster of candles before price breaks structure with a strong move.
In this indicator, order blocks are defined as structured zones that:
Begin at the earliest unmitigated candle that interacted with the most-touched price level (POC) between swing and BOS.
Extend through the full wick range of that anchor candle.
Stretch forward in time, tracking how price continues to trade through, respect, retest, or invalidate the zone.
Are only printed once the BOS is fully confirmed on closed candles (confirmed order blocks only).
Example of bullish and bearish order blocks anchored at the earliest unmitigated candle in the POC zone:
🔹How are Order Blocks detected
The indicator uses a step-by-step, rules-based process to detect bullish and bearish order blocks. The logic is designed to match discretionary Smart Money concepts but with strict, repeatable rules.
Step 1: Detect swing highs and swing lows
Swing High: a candle whose high is higher than the highs of surrounding candles.
Swing Low: a candle whose low is lower than the lows of surrounding candles.
The Swing Length input controls how many candles are checked to the left and right.
Example of swing high and swing low detection:
Step 2: Confirm Break of Structure (BOS)
Once a swing is confirmed, the indicator waits for price to break past that swing:
Bullish BOS: price closes above a previous swing high.
Bearish BOS: price closes below a previous swing low.
To avoid “live” flicker, BOS logic is evaluated based on the previous closed candle. The order block is only confirmed once the BOS candle has fully closed and the next bar has opened. This is one of the reasons the script only shows confirmed, non-repainting order blocks.
Example of bullish BOS and bearish BOS:
Step 3: Build the POC range between swing and BOS
Between the swing candle and the BOS candle, the indicator:
Scans all candles in that range.
Tracks every price level touched using binning (POC bins).
Counts how many times each price band was touched by candle wicks.
The bin with the highest touch count becomes the POC band. This is where price traded most often, not necessarily where volume was highest.
Example of the POC band between swing and BOS.
Step 4 – Anchor the order block to the earliest valid POC candle
From all candles in the swing-to-BOS range, the indicator finds the earliest candle whose high/low overlaps the POC band and whose zone is not already mitigated. That candle becomes the anchor candle for the order block:
For a bearish OB, the block spans the anchor candle’s full wick range, with its top at the high.
For a bullish OB, the block spans the anchor candle’s full wick range, with its bottom at the low.
By requiring the anchor to be the earliest unmitigated interaction with POC, the script avoids building blocks from price action that has already been fully traded through and is less relevant.
Step 5: Extend and manage the order block
Once created, the block:
Extends to the right by a configurable number of candles (Extend Zones).
Continues until it is invalidated by wick or close, depending on the chosen method.
Can show retest labels when price revisits the zone after creation.
Is included or excluded from display depending on the Show Nearest and Hide Invalidated Zones settings.
Example of active and invalidated OB.
🔹Order Block Settings
◇ Swing Length
Swing Length controls how sensitive swing highs and lows are.
Lower Swing Length: Swings form more frequently, which leads to more frequent BOS events and order block formations.
Higher Swing Length: Only larger, more meaningful swings are detected, which leads to less frequent BOS events and less order block formations.
◇ Invalidation
Invalidation determines how an order block is considered “mitigated” or no longer valid.
Wick: For bullish OBs, if price wicks completely through the bottom of the zone, the order block is invalidated. For bearish OBs, if price wicks completely through the top, the order block is invalidated.
Close: For bullish OBs, the block is invalidated only when a candle closes below the bottom. For bearish OBs, it is invalidated only when a candle closes above the top.
Example of wick invalidation:
Example of close invalidation:
◇ Show Nearest
Show Nearest limits how many active order blocks are displayed based on proximity to current price. For example, a value of 2 will display only the two nearest bullish order blocks and two nearest bearish order blocks.
Chart with Show Nearest set to 3:
◇ Extend Zones
Extend Zones define how many candles forward each order block should project beyond the right most candle on the chart.
Chart with Extend Zones set to 10:
◇ Retest Labels
When enabled, the indicator prints labels on every clean retest of an active order block, as long as that block remains valid. Key points:
A retest label is only printed once the retest candle has fully closed – you always see confirmed retests, not intrabar tests.
Retest labels are positioned on the actual retest candle so you can visually see which bar interacted with the zone.
In addition, if multiple retests occur in quick succession, the indicator applies a built-in three-candle buffer between retests. That means only the first valid retest within each three-bar window is labeled (and can trigger an alert), helping to reduce clutter while still highlighting meaningful interactions with the zone.
Example of retest labels on bullish and bearish order blocks.
◇ Hide Invalidated Zones
Hide Invalidated Zones controls whether mitigated/invalidated blocks stay drawn.
Enabled: Only currently valid, unmitigated order blocks are shown (subject to Show Nearest)
Disabled: Both active and invalidated order blocks are displayed.
VOLUME DELTA:
🔹What is Volume Delta
Volume delta measures the difference between buying and selling volume. Instead of only showing “how much volume traded”, it separates volume into bullish and bearish components.
In this indicator:
Bullish volume = volume from candles (or lower timeframe candles) that closed higher.
Bearish volume = volume from candles that closed lower.
Delta % shows how dominant one side was compared to the total.
Example of bullish and bearish order blocks with volume delta and total volume.
🔹How is Volume Delta calculated?
The indicator uses a flexible, timeframe-aware volume engine.
1. Choose a Volume Delta Timeframe.
If the selected timeframe is equal to or higher than the chart timeframe, the indicator simply uses chart-volume per candle.
If the selected timeframe is lower than the chart timeframe (for example, 1‑minute volume on a 5‑minute chart), the indicator pulls all lower timeframe candles for each chart bar and sums them.
2. Split each bar into bull and bear volume.
For each contributing candle:
If close > open → its volume is added to bullish volume.
If close < open → its volume is added to bearish volume.
If close == open → its volume is split evenly between bullish and bearish.
3. Aggregate for each order block.
For each order block:
The indicator loops once from the swing candle to the BOS candle.
It records every candle that touches the POC band.
For each touching candle, it adds its bull and bear volumes (either directly from chart candles or from aggregated lower timeframe candles).
Total volume = bullish volume + bearish volume
Delta % = (bullish volume or bearish volume / total volume ) * 100, depending on which side is dominant.
🔹Volume Delta Settings:
◇ Display Style
Display Style controls how the volume delta is drawn inside each order block:
Horizontal:
Bullish and bearish fills extend horizontally from left to right.
The filled strip sits along the base of the block, with a bull vs bear gradient.
Vertical:
Bullish and bearish fills stretch vertically inside the zone.
The bullish percentage controls how much of the block is filled with the “dominant” color.
Example of Horizontal display style.
Example of Vertical display style.
◇ Volume Delta Timeframe
Volume Delta Timeframe tells the indicator whether to use chart volume or lower timeframe volume. When set to a lower timeframe, the indicator aggregates all lower timeframe candles that fall inside each chart bar, splitting their volume into bullish and bearish components before summing.
Using a lower timeframe:
Increases precision for how volume truly behaved inside each bar.
Helps reveal hidden absorption and aggressive flows that a higher timeframe candle might hide.
Example of volume delta based on chart timeframe.
Example of volume delta based on lower timeframe than chart(same OB as above)
◇ Display Total Volume
When enabled, the indicator prints the total volume for each order block as a label positioned inside the zone, near the bottom-right corner. This total is the sum of bullish and bearish volume used in the delta calculation and gives you a quick sense of how “heavy” the trading was in that block compared to others.
Example of total volume label inside multiple order blocks.
◇ Show Delta %
Show Delta % draws a small text label on the strip of the block that displays the dominant side’s percentage. For example, a bullish block might show “72%” if 72% of all volume inside that POC band came from bullish volume.
Example of Delta %:
3D VISUALIZATION:
The 3D Visualization feature turns each order block into a 3D plot.
🔹What the 3D Visualization does:
Wraps the order block with side faces and a top face to create a 3D bar effect.
Uses delta percentages to tilt the top face toward the dominant side.
Projects blocks into the future using Extend Zones, making the 3D blocks visually stand out.
🔹How it works:
The front face of the OB shows the standard 2D zone.
The side face extends forward in time based on the 3D depth setting.
The top face is angled depending on the Display Style and bull vs bear delta, making strong bullish blocks “rise” and strong bearish blocks “sink”.
🔹How the 3D depth setting affects visuals
Lower 3D depth:
Shorter side faces.
Subtle 3D effect.
Higher 3D depth:
Longer side faces projecting further into the future.
Stronger 3D effect that visually highlights key zones.
Example of lower 3D depth:
Example of higher 3D depth:
ALERTS:
The indicator supports alert conditions through TradingView’s AnyAlert() engine, allowing you to set alerts for the following:
New Bullish Order Block formed
New Bearish Order Block formed
Bullish OB Retest
Bearish OB Retest
Important alert behavior:
Order block alerts only fire when a new block is confirmed (after BOS closes and the next bar opens).
Retest alerts only fire when a retest candle has completely finished, matching the behavior of the visual retest labels.
IMPORTANT NOTES:
3D faces for order blocks are built using polylines. In some situations, especially when an order block’s starting point (its left edge) is beyond the chart’s left-most visible bar, the top 3D face may appear slightly irregular, skewed, or incomplete. This is purely a drawing limitation related to how the chart engine handles off-screen polyline points. Once the starting point of that order block comes into view (by zooming out or scrolling back), the 3D top face corrects itself and the visual becomes fully consistent. This issue affects only the 3D top face drawing, not the actual order-block box itself. The underlying zone, prices, and volume calculations remain accurate at all times.
If all conditions are met to create a new order block but the resulting zone would overlap an existing active order block, the new block is intentionally not created. A built-in guard prevents overlapping active zones to keep the structure clean and easier to interpret.
3D face drawing is implemented using an adaptive polyline method, which can be relatively calculation-heavy on certain symbols, timeframes, or chart histories. In some cases this may lead to calculation timeout error from TradingView.
UNIQUENESS:
This indicator is unique because it:
Anchors each order block to the earliest unmitigated candle that traded through the most-touched POC band between swing and BOS, rather than a generic “last up/down candle” or a random volume spike.
Builds a dedicated volume engine that can pull either chart timeframe volume or aggregated lower timeframe volume, then splits it into bull and bear components.
Adds 3D visualization on top of standard zones, turning each OB into a visually weighted slab rather than a flat rectangle.
Provides clean toggles (Show Nearest, Hide Invalidated Zones, Extend Zones, Display Style, Delta %, and total volume labels) so you can dial the indicator from extremely minimal to fully detailed, depending on your trading workflow.
Combined, these features make the indicator not just an order block plotter, but a complete volume‑informed structure tool tailored for traders who want to see where price actually traded and whether bulls or bears truly controlled the move inside each order block.

Mars Signals - Ultimate Institutional Suite v3.0(Joker)Comprehensive Trading Manual
Mars Signals – Ultimate Institutional Suite v3.0 (Joker)
## Chapter 1 – Philosophy & System Architecture
This script is not a simple “buy/sell” indicator.
Mars Signals – UIS v3.0 (Joker) is designed as an institutional-style analytical assistant that layers several methodologies into a single, coherent framework.
The system is built on four core pillars:
1. Smart Money Concepts (SMC)
- Detection of Order Blocks (professional demand/supply zones).
- Detection of Fair Value Gaps (FVGs) (price imbalances).
2. Smart DCA Strategy
- Combination of RSI and Bollinger Bands
- Identifies statistically discounted zones for scaling into spot positions or exiting shorts.
3. Volume Profile (Visible Range Simulation)
- Distribution of volume by price, not by time.
- Identification of POC (Point of Control) and high-/low-volume areas.
4. Wyckoff Helper – Spring
- Detection of bear traps, liquidity grabs, and sharp bullish reversals.
All four pillars feed into a Confluence Engine (Scoring System).
The final output is presented in the Dashboard, with a clear, human-readable signal:
- STRONG LONG 🚀
- WEAK LONG ↗
- NEUTRAL / WAIT
- WEAK SHORT ↘
- STRONG SHORT 🩸
This allows the trader to see *how many* and *which* layers of the system support a bullish or bearish bias at any given time.
## Chapter 2 – Settings Overview
### 2.1 General & Dashboard Group
- Show Dashboard Panel (`show_dash`)
Turns the dashboard table in the corner of the chart ON/OFF.
- Show Signal Recommendation (`show_rec`)
- If enabled, the textual signal (STRONG LONG, WEAK SHORT, etc.) is displayed.
- If disabled, you only see feature status (ON/OFF) and the current price.
- Dashboard Position (`dash_pos`)
Determines where the dashboard appears on the chart:
- `Top Right`
- `Bottom Right`
- `Top Left`
### 2.2 Smart Money (SMC) Group
- Enable SMC Strategy (`show_smc`)
Globally enables or disables the Order Block and FVG logic.
- Order Block Pivot Lookback (`ob_period`)
Main parameter for detecting key pivot highs/lows (swing points).
- Default value: 5
- Concept:
A bar is considered a pivot low if its low is lower than the lows of the previous 5 and the next 5 bars.
Similarly, a pivot high has a high higher than the previous 5 and the next 5 bars.
These pivots are used as anchors for Order Blocks.
- Increasing `ob_period`:
- Fewer levels.
- But levels tend to be more significant and reliable.
- In highly volatile markets (major news, war events, FOMC, etc.),
using values 7–10 is recommended to filter out weak levels.
- Show Fair Value Gaps (`show_fvg`)
Enables/disables the drawing of FVG zones (imbalances).
- Bullish OB Color (`c_ob_bull`)
- Color of Bullish Order Blocks (Demand Zones).
- Default: semi-transparent green (transparency ≈ 80).
- Bearish OB Color (`c_ob_bear`)
- Color of Bearish Order Blocks (Supply Zones).
- Default: semi-transparent red.
- Bullish FVG Color (`c_fvg_bull`)
- Color of Bullish FVG (upward imbalance), typically yellow.
- Bearish FVG Color (`c_fvg_bear`)
- Color of Bearish FVG (downward imbalance), typically purple.
### 2.3 Smart DCA Strategy Group
- Enable DCA Zones (`show_dca`)
Enables the Smart DCA logic and visual labels.
- RSI Length (`rsi_len`)
Lookback period for RSI (default: 14).
- Shorter → more sensitive, more noise.
- Longer → fewer signals, higher reliability.
- Bollinger Bands Length (`bb_len`)
Moving average period for Bollinger Bands (default: 20).
- BB Multiplier (`bb_mult`)
Standard deviation multiplier for Bollinger Bands (default: 2.0).
- For extremely volatile markets, values like 2.5–3.0 can be used so that only extreme deviations trigger a DCA signal.
### 2.4 Volume Profile (Visible Range Sim) Group
- Show Volume Profile (`show_vp`)
Enables the simulated Volume Profile bars on the right side of the chart.
- Volume Lookback Bars (`vp_lookback`)
Number of bars used to compute the Volume Profile (default: 150).
- Higher values → broader historical context, heavier computation.
- Row Count (`vp_rows`)
Number of vertical price segments (rows) to divide the total price range into (default: 30).
- Width (%) (`vp_width`)
Relative width of each volume bar as a percentage.
In the code, bar widths are scaled relative to the row with the maximum volume.
> Technical note: Volume Profile calculations are executed only on the last bar (`barstate.islast`) to keep the script performant even on higher timeframes.
### 2.5 Wyckoff Helper Group
- Show Wyckoff Events (`show_wyc`)
Enables detection and plotting of Wyckoff Spring events.
- Volume MA Length (`vol_ma_len`)
Length of the moving average on volume.
A bar is considered to have Ultra Volume if its volume is more than 2× the volume MA.
## Chapter 3 – Smart Money Strategy (Order Blocks & FVG)
### 3.1 What Is an Order Block?
An Order Block (OB) represents the footprint of large institutional orders:
- Bullish Order Block (Demand Zone)
The last selling region (bearish candle/cluster) before a strong upward move.
- Bearish Order Block (Supply Zone)
The last buying region (bullish candle/cluster) before a strong downward move.
Institutions and large players place heavy orders in these regions. Typical price behavior:
- Price moves away from the zone.
- Later returns to the same zone to fill unfilled orders.
- Then continues the larger trend.
In the script:
- If `pl` (pivot low) forms → a Bullish OB is created.
- If `ph` (pivot high) forms → a Bearish OB is created.
The box is drawn:
- From `bar_index ` to `bar_index`.
- Between `low ` and `high `.
- `extend=extend.right` extends the OB into the future, so it acts as a dynamic support/resistance zone.
- Only the last 4 OB boxes are kept to avoid clutter.
### 3.2 Order Block Color Guide
- Semi-transparent Green (`c_ob_bull`)
- Represents a Bullish Order Block (Demand Zone).
- Interpretation: a price region with a high probability of bullish reaction.
- Semi-transparent Red (`c_ob_bear`)
- Represents a Bearish Order Block (Supply Zone).
- Interpretation: a price region with a high probability of bearish reaction.
Overlap (Multiple OBs in the Same Area)
When two or more Order Blocks overlap:
- The shared area appears visually denser/stronger.
- This suggests higher order density.
- Such zones can be treated as high-priority levels for entries, exits, and stop-loss placement.
### 3.3 Demand/Supply Logic in the Scoring Engine
is_in_demand = low <= ta.lowest(low, 20)
is_in_supply = high >= ta.highest(high, 20)
- If current price is near the lowest lows of the last 20 bars, it is considered in a Demand Zone → positive impact on score.
- If current price is near the highest highs of the last 20 bars, it is considered in a Supply Zone → negative impact on score.
This logic complements Order Blocks and helps the Dashboard distinguish whether:
- Market is currently in a statistically cheap (long-friendly) area, or
- In a statistically expensive (short-friendly) area.
### 3.4 Fair Value Gaps (FVG)
#### Concept
When the market moves aggressively:
- Some price levels are skipped and never traded.
- A gap between wicks/shadows of consecutive candles appears.
- These regions are called Fair Value Gaps (FVGs) or Imbalances.
The market generally “dislikes” imbalance and often:
- Returns to these zones in the future.
- Fills the gap (rebalance).
- Then resumes its dominant direction.
#### Implementation in the Code
Bullish FVG (Yellow)
fvg_bull_cond = show_smc and show_fvg and low > high and close > high
if fvg_bull_cond
box.new(bar_index , high , bar_index, low, ...)
Core condition:
`low > high ` → the current low is above the high of two bars ago; the space between them is an untraded gap.
Bearish FVG (Purple)
fvg_bear_cond = show_smc and show_fvg and high < low and close < low
if fvg_bear_cond
box.new(bar_index , low , bar_index, high, ...)
Core condition:
`high < low ` → the current high is below the low of two bars ago; again a price gap exists.
#### FVG Color Guide
- Transparent Yellow (`c_fvg_bull`) – Bullish FVG
Often acts like a magnet for price:
- Price tends to retrace into this zone,
- Fill the imbalance,
- And then continue higher.
- Transparent Purple (`c_fvg_bear`) – Bearish FVG
Price tends to:
- Retrace upward into the purple area,
- Fill the imbalance,
- And then resume downward movement.
#### Trading with FVGs
- FVGs are *not* standalone entry signals.
They are best used as:
- Targets (take-profit zones), or
- Reaction areas where you expect a pause or reversal.
Examples:
- If you are long, a bearish FVG above is often an excellent take-profit zone.
- If you are short, a bullish FVG below is often a good cover/exit zone.
### 3.5 Core SMC Trading Templates
#### Reversal Long
1. Price trades down into a green Order Block (Demand Zone).
2. A bullish confirmation candle (Close > Open) forms inside or just above the OB.
3. If this zone is close to or aligned with a bullish FVG (yellow), the signal is reinforced.
4. Entry:
- At the close of the confirmation candle, or
- Using a limit order near the upper boundary of the OB.
5. Stop-loss:
- Slightly below the OB.
- If the OB is broken decisively and price consolidates below it, the zone loses validity.
6. Targets:
- The next FVG,
- Or the next red Order Block (Supply Zone) above.
#### Reversal Short
The mirror scenario:
- Price rallies into a red Order Block (Supply).
- A bearish confirmation candle forms (Close < Open).
- FVG/premium structure above can act as a confluence.
- Stop-loss goes above the OB.
- Targets: lower FVGs or subsequent green OBs below.
## Chapter 4 – Smart DCA Strategy (RSI + Bollinger Bands)
### 4.1 Smart DCA Concept
- Classic DCA = buying at fixed time intervals regardless of price.
- Smart DCA = scaling in only when:
- Price is statistically cheaper than usual, and
- The market is in a clear oversold condition.
Code logic:
rsi_val = ta.rsi(close, rsi_len)
= ta.bb(close, bb_len, bb_mult)
dca_buy = show_dca and rsi_val < 30 and close < bb_lower
dca_sell = show_dca and rsi_val > 70 and close > bb_upper
Conditions:
- DCA Buy – Smart Scale-In Zone
- RSI < 30 → oversold.
- Close < lower Bollinger Band → price has broken below its typical volatility envelope.
- DCA Sell – Overbought/Distribution Zone
- RSI > 70 → overbought.
- Close > upper Bollinger Band → price is extended far above the mean.
### 4.2 Visual Representation on the Chart
- Green “DCA” Label Below Candle
- Shape: `labelup`.
- Color: lime background, white text.
- Meaning: statistically attractive level for laddered spot entries or short exits.
- Red “SELL” Label Above Candle
- Warning that the market is in an extended, overbought condition.
- Suitable for profit-taking on longs or considering short entries (with proper confluence and risk management).
- Light Green Background (`bgcolor`)
- When `dca_buy` is true, the candle background turns very light green (high transparency).
- This helps visually identify DCA Zones across the chart at a glance.
### 4.3 Practical Use in Trading
#### Spot Trading
Used to build a better average entry price:
- Every time a DCA label appears, allocate a fixed portion of capital (e.g., 2–5%).
- Combining DCA signals with:
- Green OBs (Demand Zones), and/or
- The Volume Profile POC
makes the zone structurally more important.
#### Futures Trading
- Longs
- Use DCA Buy signals as low-risk zones for opening or adding to longs when:
- Price is inside a green OB, or
- The Dashboard already leans LONG.
- Shorts
- Use DCA Sell signals as:
- Exit zones for longs, or
- Areas to initiate shorts with stops above structural highs.
## Chapter 5 – Volume Profile (Visible Range Simulation)
### 5.1 Concept
Traditional volume (histogram under the chart) shows volume over time.
Volume Profile shows volume by price level:
- At which prices has the highest trading activity occurred?
- Where did buyers and sellers agree the most (High Volume Nodes – HVNs)?
- Where did price move quickly due to low participation (Low Volume Nodes – LVNs)?
### 5.2 Implementation in the Script
Executed only when `show_vp` is enabled and on the last bar:
1. The last `vp_lookback` bars (default 150) are processed.
2. The minimum low and maximum high over this window define the price range.
3. This price range is divided into `vp_rows` segments (e.g., 30 rows).
4. For each row:
- All bars are scanned.
- If the mid-price `(high + low ) / 2` falls inside a row, that bar’s volume is added to the row total.
5. The row with the greatest volume is stored as `max_vol_idx` (the POC row).
6. For each row, a volume box is drawn on the right side of the chart.
### 5.3 Color Scheme
- Semi-transparent Orange
- The row with the maximum volume – the Point of Control (POC).
- Represents the strongest support/resistance level from a volume perspective.
- Semi-transparent Blue
- Other volume rows.
- The taller the bar → the higher the volume → the stronger the interest at that price band.
### 5.4 Trading Applications
- If price is above POC and retraces back into it:
→ POC often acts as support, suitable for long setups.
- If price is below POC and rallies into it:
→ POC often acts as resistance, suitable for short setups or profit-taking.
HVNs (Tall Blue Bars)
- Represent areas of equilibrium where the market has spent time and traded heavily.
- Price tends to consolidate here before choosing a direction.
LVNs (Short or Nearly Empty Bars)
- Represent low participation zones.
- Price often moves quickly through these areas – useful for targeting fast moves.
## Chapter 6 – Wyckoff Helper – Spring
### 6.1 Spring Concept
In the Wyckoff framework:
- A Spring is a false break of support.
- The market briefly trades below a well-defined support level, triggers stop losses,
then sharply reverses upward as institutional buyers absorb liquidity.
This movement:
- Clears out weak hands (retail sellers).
- Provides large players with liquidity to enter long positions.
- Often initiates a new uptrend.
### 6.2 Code Logic
Conditions for a Spring:
1. The current low is lower than the lowest low of the previous 50 bars
→ apparent break of a long-standing support.
2. The bar closes bullish (Close > Open)
→ the breakdown was rejected.
3. Volume is significantly elevated:
→ `volume > 2 × volume_MA` (Ultra Volume).
When all conditions are met and `show_wyc` is enabled:
- A pink diamond is plotted below the bar,
- With the label “Spring” – one of the strongest long signals in this system.
### 6.3 Trading Use
- After a valid Spring, markets frequently enter a meaningful bullish phase.
- The highest quality setups occur when:
- The Spring forms inside a green Order Block, and
- Near or on the Volume Profile POC.
Entries:
- At the close of the Spring bar, or
- On the first pullback into the mid-range of the Spring candle.
Stop-loss:
- Slightly below the Spring’s lowest point (wick low plus a small buffer).
## Chapter 7 – Confluence Engine & Dashboard
### 7.1 Scoring Logic
For each bar, the script:
1. Resets `score` to 0.
2. Adjusts the score based on different signals.
SMC Contribution
if show_smc
if is_in_demand
score += 1
if is_in_supply
score -= 1
- Being in Demand → `+1`
- Being in Supply → `-1`
DCA Contribution
if show_dca
if dca_buy
score += 2
if dca_sell
score -= 2
- DCA Buy → `+2` (strong, statistically driven long signal)
- DCA Sell → `-2`
Wyckoff Spring Contribution
if show_wyc
if wyc_spring
score += 2
- Spring → `+2` (entry of strong money)
### 7.2 Mapping Score to Dashboard Signal
- score ≥ 2 → STRONG LONG 🚀
Multiple bullish conditions aligned.
- score = 1 → WEAK LONG ↗
Some bullish bias, but only one layer clearly positive.
- score = 0 → NEUTRAL / WAIT
Rough balance between buying and selling forces; staying flat is usually preferable.
- score = -1 → WEAK SHORT ↘
Mild bearish bias, suited for cautious or short-term plays.
- score ≤ -2 → STRONG SHORT 🩸
Convergence of several bearish signals.
### 7.3 Dashboard Structure
The dashboard is a two-column table:
- Row 0
- Column 0: `"Mars Signals"` – black background, white text.
- Column 1: `"UIS v3.0"` – black background, yellow text.
- Row 1
- Column 0: `"Price:"` (light grey background).
- Column 1: current closing price (`close`) with a semi-transparent blue background.
- Row 2
- Column 0: `"SMC:"`
- Column 1:
- `"ON"` (green) if `show_smc = true`
- `"OFF"` (grey) otherwise.
- Row 3
- Column 0: `"DCA:"`
- Column 1:
- `"ON"` (green) if `show_dca = true`
- `"OFF"` (grey) otherwise.
- Row 4
- Column 0: `"Signal:"`
- Column 1: signal text (`status_txt`) with background color `status_col`
(green, red, teal, maroon, etc.)
- If `show_rec = false`, these cells are cleared.
## Chapter 8 – Visual Legend (Colors, Shapes & Actions)
For quick reading inside TradingView, the visual elements are described line by line instead of a table.
Chart Element: Green Box
Color / Shape: Transparent green rectangle
Core Meaning: Bullish Order Block (Demand Zone)
Suggested Trader Response: Look for longs, Smart DCA adds, closing or reducing shorts.
Chart Element: Red Box
Color / Shape: Transparent red rectangle
Core Meaning: Bearish Order Block (Supply Zone)
Suggested Trader Response: Look for shorts, or take profit on existing longs.
Chart Element: Yellow Area
Color / Shape: Transparent yellow zone
Core Meaning: Bullish FVG / upside imbalance
Suggested Trader Response: Short take-profit zone or expected rebalance area.
Chart Element: Purple Area
Color / Shape: Transparent purple zone
Core Meaning: Bearish FVG / downside imbalance
Suggested Trader Response: Long take-profit zone or temporary supply region.
Chart Element: Green "DCA" Label
Color / Shape: Green label with white text, plotted below the candle
Core Meaning: Smart ladder-in buy zone, DCA buy opportunity
Suggested Trader Response: Spot DCA entry, partial short exit.
Chart Element: Red "SELL" Label
Color / Shape: Red label with white text, plotted above the candle
Core Meaning: Overbought / distribution zone
Suggested Trader Response: Take profit on longs, consider initiating shorts.
Chart Element: Light Green Background (bgcolor)
Color / Shape: Very transparent light-green background behind bars
Core Meaning: Active DCA Buy zone
Suggested Trader Response: Treat as a discount zone on the chart.
Chart Element: Orange Bar on Right
Color / Shape: Transparent orange horizontal bar in the volume profile
Core Meaning: POC – price with highest traded volume
Suggested Trader Response: Strong support or resistance; key reference level.
Chart Element: Blue Bars on Right
Color / Shape: Transparent blue horizontal bars in the volume profile
Core Meaning: Other volume levels, showing high-volume and low-volume nodes
Suggested Trader Response: Use to identify balance zones (HVN) and fast-move corridors (LVN).
Chart Element: Pink "Spring" Diamond
Color / Shape: Pink diamond with white text below the candle
Core Meaning: Wyckoff Spring – liquidity grab and potential major bullish reversal
Suggested Trader Response: One of the strongest long signals in the suite; look for high-quality long setups with tight risk.
Chart Element: STRONG LONG in Dashboard
Color / Shape: Green background, white text in the Signal row
Core Meaning: Multiple bullish layers in confluence
Suggested Trader Response: Consider initiating or increasing longs with strict risk management.
Chart Element: STRONG SHORT in Dashboard
Color / Shape: Red background, white text in the Signal row
Core Meaning: Multiple bearish layers in confluence
Suggested Trader Response: Consider initiating or increasing shorts with a logical, well-placed stop.
## Chapter 9 – Timeframe-Based Trading Playbook
### 9.1 Timeframe Selection
- Scalping
- Timeframes: 1M, 5M, 15M
- Objective: fast intraday moves (minutes to a few hours).
- Recommendation: focus on SMC + Wyckoff.
Smart DCA on very low timeframes may introduce excessive noise.
- Day Trading
- Timeframes: 15M, 1H, 4H
- Provides a good balance between signal quality and frequency.
- Recommendation: use the full stack – SMC + DCA + Volume Profile + Wyckoff + Dashboard.
- Swing Trading & Position Investing
- Timeframes: Daily, Weekly
- Emphasis on Smart DCA + Volume Profile.
- SMC and Wyckoff are used mainly to fine-tune swing entries within larger trends.
### 9.2 Scenario A – Scalping Long
Example: 5-Minute Chart
1. Price is declining into a green OB (Bullish Demand).
2. A candle with a long lower wick and bullish close (Pin Bar / Rejection) forms inside the OB.
3. A Spring diamond appears below the same candle → very strong confluence.
4. The Dashboard shows at least WEAK LONG ↗, ideally STRONG LONG 🚀.
5. Entry:
- On the close of the confirmation candle, or
- On the first pullback into the mid-range of that candle.
6. Stop-loss:
- Slightly below the OB.
7. Targets:
- Nearby bearish FVG above, and/or
- The next red OB.
### 9.3 Scenario B – Day-Trading Short
Recommended Timeframes: 1H or 4H
1. The market completes a strong impulsive move upward.
2. Price enters a red Order Block (Supply).
3. In the same zone, a purple FVG appears or remains unfilled.
4. On a lower timeframe (e.g., 15M), RSI enters overbought territory and a DCA Sell signal appears.
5. The main timeframe Dashboard (1H) shows WEAK SHORT ↘ or STRONG SHORT 🩸.
Trade Plan
- Open a short near the upper boundary of the red OB.
- Place the stop above the OB or above the last swing high.
- Targets:
- A yellow FVG lower on the chart, and/or
- The next green OB (Demand) below.
### 9.4 Scenario C – Swing / Investment with Smart DCA
Timeframes: Daily / Weekly
1. On the daily or weekly chart, each time a green “DCA” label appears:
- Allocate a fixed fraction of your capital (e.g., 3–5%) to that asset.
2. Check whether this DCA zone aligns with the orange POC of the Volume Profile:
- If yes → the quality of the entry zone is significantly higher.
3. If the DCA signal sits inside a daily green OB, the probability of a medium-term bottom increases.
4. Always build the position laddered, never all-in at a single price.
Exits for investors:
- Near weekly red OBs or large purple FVG zones.
- Ideally via partial profit-taking rather than closing 100% at once.
### 9.5 Case Study 1 – BTCUSDT (15-Minute)
- Context: Price has sold off down towards 65,000 USD.
- A green OB had previously formed at that level.
- Near the lower boundary of this OB, a partially filled yellow FVG is present.
- As price returns to this region, a Spring appears.
- The Dashboard shifts from NEUTRAL / WAIT to WEAK LONG ↗.
Plan
- Enter a long near the OB low.
- Place stop below the Spring low.
- First target: a purple FVG around 66,200.
- Second (optional) target: the first red OB above that level.
### 9.6 Case Study 2 – Meme Coin (PEPE – 4H)
- After a strong pump, price enters a corrective phase.
- On the 4H chart, RSI drops below 30; price breaks below the lower Bollinger Band → a DCA label prints.
- The Volume Profile shows the POC at approximately the same level.
- The Dashboard displays STRONG LONG 🚀.
Plan
- Execute laddered buys in the combined DCA + POC zone.
- Place a protective stop below the last significant swing low.
- Target: an expected 20–30% upside move towards the next red OB or purple FVG.
## Chapter 10 – Risk Management, Psychology & Advanced Tuning
### 10.1 Risk Management
No signal, regardless of its strength, replaces risk control.
Recommendations:
- In futures, do not expose more than 1–3% of account equity to risk per trade.
- Adjust leverage to the volatility of the instrument (lower leverage for highly volatile altcoins).
- Place stop-losses in zones where the idea is clearly invalidated:
- Below/above the relevant Order Block or Spring, not randomly in the middle of the structure.
### 10.2 Market-Specific Parameter Tuning
- Calmer Markets (e.g., major FX pairs)
- `ob_period`: 3–5.
- `bb_mult`: 2.0 is usually sufficient.
- Highly Volatile Markets (Crypto, news-driven assets)
- `ob_period`: 7–10 to highlight only the most robust OBs.
- `bb_mult`: 2.5–3.0 so that only extreme deviations trigger DCA.
- `vol_ma_len`: increase (e.g., to ~30) so that Spring triggers only on truly exceptional
volume spikes.
### 10.3 Trading Psychology
- STRONG LONG 🚀 does not mean “risk-free”.
It means the probability of a successful long, given the model’s logic, is higher than average.
- Treat Mars Signals as a confirmation and context system, not a full replacement for your own decision-making.
- Example of disciplined thinking:
- The Dashboard prints STRONG LONG,
- But price is simultaneously testing a multi-month macro resistance or a major negative news event is imminent,
- In such cases, trade smaller, widen stops appropriately, or skip the trade.
## Chapter 11 – Technical Notes & FAQ
### 11.1 Does the Script Repaint?
- Order Blocks and Springs are based on completed pivot structures and confirmed candles.
- Until a pivot is confirmed, an OB does not exist; after confirmation, behavior is stable under classic SMC assumptions.
- The script is designed to be structurally consistent rather than repainting signals arbitrarily.
### 11.2 Computational Load of Volume Profile
- On the last bar, the script processes up to `vp_lookback` bars × `vp_rows` rows.
- On very low timeframes with heavy zooming, this can become demanding.
- If you experience performance issues:
- Reduce `vp_lookback` or `vp_rows`, or
- Temporarily disable Volume Profile (`show_vp = false`).
### 11.3 Multi-Timeframe Behavior
- This version of the script is not internally multi-timeframe.
All logic (OB, DCA, Spring, Volume Profile) is computed on the active timeframe only.
- Practical workflow:
- Analyze overall structure and key zones on higher timeframes (4H / Daily).
- Use lower timeframes (15M / 1H) with the same tool for timing entries and exits.
## Conclusion
Mars Signals – Ultimate Institutional Suite v3.0 (Joker) is a multi-layer trading framework that unifies:
- Price structure (Order Blocks & FVG),
- Statistical behavior (Smart DCA via RSI + Bollinger),
- Volume distribution by price (Volume Profile with POC, HVN, LVN),
- Liquidity events (Wyckoff Spring),
into a single, coherent system driven by a transparent Confluence Scoring Engine.
The final output is presented in clear, actionable language:
> STRONG LONG / WEAK LONG / NEUTRAL / WEAK SHORT / STRONG SHORT
The system is designed to support professional decision-making, not to replace it.
Used together with strict risk management and disciplined execution,
Mars Signals – UIS v3.0 (Joker) can serve as a central reference manual and operational guide
for your trading workflow, from scalping to swing and investment positioning.

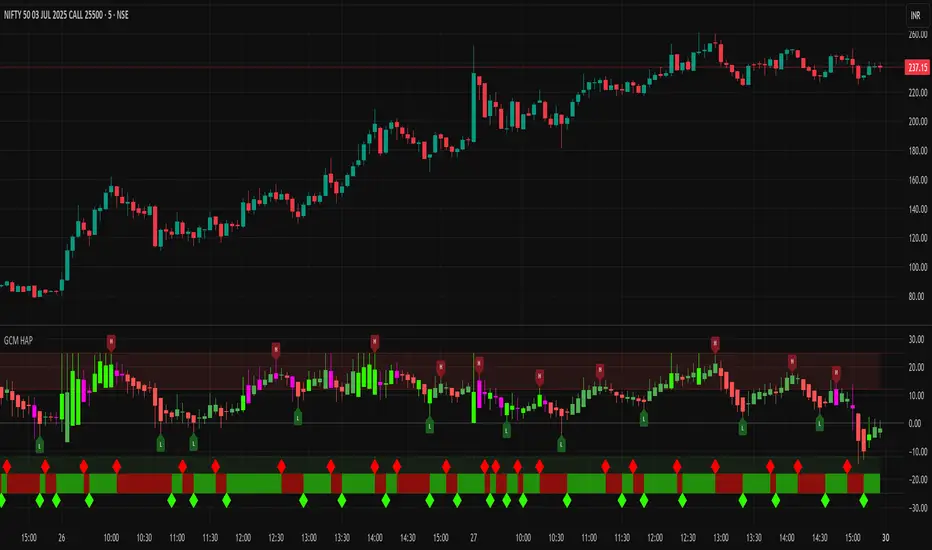
GCM Heikin Ashi with PivotsTitle: GCM Heikin Ashi with Pivots
Description:
Overview
This indicator provides a powerful combination of trend visualization, precise reversal signals, and volume confirmation in a clean, customizable sub-chart. It is designed to help traders identify trend momentum using Heikin Ashi candles, pinpoint confirmed swing highs and lows (pivots), and spot surges in buying pressure with our unique Volume Rate-of-Change (VROC) highlighter.
The key feature of this script is its non-repainting pivot signals. A pivot high or low is only confirmed and plotted after a specific number of subsequent bars have closed, ensuring the signals are reliable and do not change after they appear.
Key Features
Heikin Ashi Sub-Chart: Displays smoothed Heikin Ashi candles in a separate pane to clearly visualize trend strength and direction without cluttering the main price chart.
Non-Repainting Pivot Signals: Uses ta.pivothigh and ta.pivotlow to identify confirmed swing points. The signals will not repaint or move once they are printed on the chart.
Smart Volume Spike Analysis (VROC): A Heikin Ashi candle will be highlighted in a distinct bright green (#2dff00) when the volume increases significantly on a bullish price candle. This "volume-confirmed" candle can signal strong conviction behind a move.
Complete Label Customization: Take full control over the look and feel of your signals:
Label Mode: Choose between "High & Low" (H/L) or "Buy & Sell" (B/S) to match your trading terminology.
Custom Colors: Set unique colors for both the high and low pivot labels.
Label Style: Select from various shapes like boxes, circles, diamonds, or squares.
Label Size: Adjust the size of the labels from Tiny to Huge for perfect visibility.
Adjustable Pivot Sensitivity: Fine-tune the pivot detection algorithm by setting the number of bars required to the left (strength) and right (confirmation) of a pivot point.
How to Use & Interpret the Signals
Assess the Trend with Heikin Ashi:
A series of green HA candles with little to no lower wicks indicates strong bullish momentum.
A series of red HA candles with little to no upper wicks indicates strong bearish momentum.
Look for Volume Confirmation:
A bright green highlighted candle signals a surge in buying pressure (VROC spike). This adds significant weight to bullish moves and can act as a leading indicator for a new leg up.
Identify Entry/Exit Points with Pivot Labels:
An "L" or "B" label marks a confirmed swing low. This is a potential buying opportunity, especially if it is followed by green Heikin Ashi candles and, ideally, a bright green VROC spike candle.
An "H" or "S" label marks a confirmed swing high. This is a potential selling/shorting opportunity, especially as HA candles turn red.
Example Strategy (High-Confluence)
A powerful way to use this indicator is to look for a sequence of events:
Wait for a "Buy" (B) or "Low" (L) signal to appear, confirming a bottom has likely formed.
Wait for the first bright green VROC spike candle to appear after the signal. This confirms that buyers are stepping in with conviction.
Consider an entry based on this high-confluence setup, using the swing low as a potential stop-loss area.
Settings Explained
Pivot Detection:
Left Bars (Strength): Number of bars to the left of a pivot. A higher number finds more significant pivots.
Right Bars (Confirmation): Number of bars to the right required to confirm a pivot. This creates a lag for reliability.
Volume Spike Detection (VROC):
Enable Volume Spike Highlighting: Turn the bright green candle highlight on or off.
VROC Length: The lookback period for calculating the volume's rate of change.
VROC Threshold %: The percentage volume must increase to trigger a highlight.
Label Customization:
Label Text Mode: Choose between "High & Low" or "Buy & Sell".
Label Color, Style, and Size: Full cosmetic control for the pivot labels.
Final Note
This indicator is a tool to aid in technical analysis and should not be used as a standalone trading system. Always use it in conjunction with other analysis methods, proper risk management, and a sound trading plan.
Enjoy!
DTFX Algo Zones [SamuraiJack Mod]CME_MINI:NQ1!
Credits
This indicator is a modified version of an open-source tool originally developed by Lux Algo. I literally modded their indicator to create the DTFX Algo Zones version, incorporating additional features and refinements. Special thanks to Lux Algo for their original work and for providing the open-source code that made this development possible.
Introduction
DTFX Algo Zones is a technical analysis indicator designed to automatically identify key supply and demand zones on your chart using market structure and Fibonacci retracements. It helps traders spot high-probability reversal areas and important support/resistance levels at a glance. By detecting shifts in market structure (such as Break of Structure and Change of Character) and highlighting bullish or bearish zones dynamically, this tool provides an intuitive framework for planning trades. The goal is to save traders time and improve decision-making by focusing attention on the most critical price zones where market bias may confirm or reverse.
Logic & Features
• Market Structure Shift Detection (BOS & CHoCH): The indicator continuously monitors price swings and marks significant structure shifts. A Break of Structure (BOS) occurs when price breaks above a previous swing high or below a swing low, indicating a continuation of the current trend. A Change of Character (ChoCH) is detected when price breaks in the opposite direction of the prior trend, often signaling an early trend reversal. These moments are visually marked on the chart, serving as anchor points for new zones. By identifying BOS and ChoCH in real-time, the DTFX Algo Zones indicator ensures you’re aware of key trend changes as they happen.
• Auto-Drawn Fibonacci Supply/Demand Zones: Upon a valid structure shift, the indicator plots a Fibonacci-based zone between the breakout point and the preceding swing high/low (the source of the move). This creates a shaded area or band of Fibonacci retracement levels (for example 38.2%, 50%, 61.8%, etc.) representing a potential support zone in an uptrend or resistance zone in a downtrend. These supply/demand zones are derived from the natural retracement of the breakout move, highlighting where price is likely to pull back. Each zone is essentially an auto-generated Fibonacci retracement region tied to a market structure event, which traders can use to anticipate where the next pullback or bounce might occur.
• Dynamic Bullish and Bearish Zones: The DTFX Algo Zones indicator distinguishes bullish vs. bearish zones and updates them dynamically as new price action unfolds. Bullish zones (formed after bullish BOS/ChoCH) are typically highlighted in one color (e.g. green or blue) to indicate areas of demand/support where price may bounce upward. Bearish zones (formed after bearish BOS/ChoCH) are shown in another color (e.g. red/orange) to mark supply/resistance where price may stall or reverse downward. This color-coding and real-time updating allow traders to instantly recognize the market bias: for instance, a series of bullish zones implies an uptrend with multiple support levels on pullbacks, while consecutive bearish zones indicate a downtrend with resistance overhead. As old zones get invalidated or new ones appear, the chart remains current with the latest key levels, eliminating clutter from outdated levels.
• Flexible Customization: The indicator comes with several options to tailor the zones to your trading style. You can filter which zones to display – for example, show only the most recent N zones or limit to only bullish or only bearish zones – helping declutter the chart and focus on recent, relevant levels. There are settings to control zone extension (how far into the future the zones are drawn) and to automatically invalidate zones once they’re no longer relevant (for instance, if price fully breaks through a zone or a new structure shift occurs that supersedes it). Additionally, the Fibonacci retracement levels within each zone are customizable: you can choose which retracement percentages to plot, adjust their colors or line styles, and decide whether to fill the zone area for visibility. This flexibility ensures the DTFX Algo Zones can be tuned for different markets and strategies, whether you want a clean minimalist look or detailed zones with multiple internal levels.
Best Use Cases
DTFX Algo Zones is a versatile indicator that can enhance various trading strategies. Some of its best use cases include:
• Identifying High-Probability Reversal Zones: Each zone marks an area where price has a higher likelihood of stalling or reversing because it reflects a significant prior swing and Fibonacci retracement. Traders can watch these zones for entry opportunities when the market approaches them, as they often coincide with order block or strong supply/demand areas. This is especially useful for catching trend reversals or pullbacks at points where risk is lower and potential reward is higher.
• Spotting Key Support and Resistance: The automatically drawn zones act as dynamic support (below price) and resistance (above price) levels. Instead of manually drawing Fibonacci retracements or support/resistance lines, you get an instant map of the key levels derived from recent price action. This helps in quickly identifying where the next bounce (support) or rejection (resistance) might occur. Swing traders and intraday traders alike can use these zones to set alerts or anticipate reaction areas as the market moves.
• Trend-Following Entries: In a trending market, the indicator’s zones provide ideal areas to join the trend on pullbacks. For example, in an uptrend, when a new bullish zone is drawn after a BOS, it indicates a fresh demand zone – buying near the lower end of that zone on a pullback can offer a low-risk entry to ride the next leg up. Similarly, in a downtrend, selling rallies into the highlighted supply zones can position you in the direction of the prevailing trend. The zones effectively serve as a roadmap of the trend’s structure, allowing trend traders to buy dips and sell rallies with greater confidence.
• Mean-Reversion and Range Trading: Even in choppy or range-bound markets, DTFX Algo Zones can help find mean-reversion trades. If price is oscillating sideways, the zones at extremes of the range might mark where momentum is shifting (ChoCH) and price could swing back toward the mean. A trader might fade an extended move when it reaches a strong zone, anticipating a reversion. Additionally, if multiple zones cluster in an area across time (creating a zone overlap), it often signifies a particularly robust support/resistance level ideal for range trading strategies.
In all these use cases, the indicator’s ability to filter out noise and highlight structurally important levels means traders can focus on higher-probability setups and make more informed trading decisions.
Strategy – Pullback Trading with DTFX Algo Zones
One of the most effective ways to use the DTFX Algo Zones indicator is trading pullbacks in the direction of the trend. Below is a step-by-step strategy to capitalize on pullbacks using the zones, combining the indicator’s signals with sound price action analysis and risk management:
1. Identify a Market Structure Shift and Trend Bias: First, observe the chart for a recent BOS or ChoCH signal from the indicator. This will tell you the current trend bias. For instance, a bullish BOS/ChoCH means the market momentum has shifted upward (bullish bias), and a new demand zone will be drawn. A bearish structure break indicates downward momentum and creates a supply zone. Make sure the broader context supports the bias (e.g., if multiple higher timeframe zones are bullish, focus on long trades).
2. Wait for the Pullback into the Zone: Once a new zone appears, don’t chase the price immediately. Instead, wait for price to retrace back into that highlighted zone. Patience is key – let the market come to you. For a bullish setup, allow price to dip into the Fibonacci retracement zone (demand area); for a bearish setup, watch for a rally into the supply zone. Often, the middle of the zone (around the 50% retracement level) can be an optimal area where price might slow down and pivot, but it’s wise to observe price behavior across the entire zone.
3. Confirm the Entry with Price Action & Confluence: As price tests the zone, look for confirmation signals before entering the trade. This can include bullish reversal candlestick patterns (for longs) or bearish patterns (for shorts) such as engulfing candles, hammers/shooting stars, or doji indicating indecision turning to reversal. Additionally, incorporate confluence factors to strengthen the setup: for example, check if the zone overlaps with a key moving average, a round number price level, or an old support/resistance line from a higher timeframe. You might also use an oscillator (like RSI or Stochastic) to see if the pullback has reached oversold conditions in a bullish zone (or overbought in a bearish zone), suggesting a bounce is likely. The more factors aligning at the zone, the more confidence you can have in the trade. Only proceed with an entry once you see clear evidence of buyers defending a demand zone or sellers defending a supply zone.
4. Enter the Trade and Manage Risk: When you’re satisfied with the confirmation (e.g., price starts to react positively off a demand zone or shows rejection wicks in a supply zone), execute your entry in the direction of the original trend. Immediately set a stop-loss order to control risk: for a long trade, a common placement is just below the demand zone (a few ticks/pips under the swing low that formed the zone); for a short trade, place the stop just above the supply zone’s high. This way, if the zone fails and price continues beyond it, your loss is limited. Position size the trade so that this stop-loss distance corresponds to a risk you are comfortable with (for example, 1-2% of your trading capital).
5. Take Profit Strategically: Plan your take-profit targets in advance. A conservative approach is to target the origin of the move – for instance, in a long trade, you might take profit as price moves back up to the swing high (the 0% Fibonacci level of the zone) or the next significant zone or resistance level above. This often yields at least a 1:1 reward-to-risk ratio if you entered around mid-zone. More aggressive trend-following traders may leave a portion of the position running beyond the initial target, aiming for a larger move in line with the trend (for example, new higher highs in an uptrend). You can also trail your stop-loss upward behind new higher lows (for longs) or lower highs (for shorts) as the trend progresses, locking in profit while allowing for further gains.
6. Monitor Zone Invalidation: Even after entering, keep an eye on the behavior around the zone and any new zones that may form. If price fails to bounce and instead breaks decisively through the entire zone, respect that as an invalidation – the market may be signaling a deeper reversal or that the signal was false. In such a case, it’s better to exit early or stick to your stop-loss than to hold onto a losing position. The indicator will often mark or no longer highlight zones that have been invalidated by price, guiding you to shift focus to the next opportunity.
Risk Management Tips:
• Always use a stop-loss and don’t move it farther out in hope. Placing the stop just beyond the zone’s far end (the swing point) helps protect you if the pullback turns into a larger reversal.
• Aim for a favorable risk-to-reward ratio. With pullback entries near the middle or far end of a zone, you can often achieve a reward that equals or exceeds your risk. For example, risking 20 pips to make 20+ pips (1:1 or better) is a prudent starting point. Adjust targets based on market structure – if the next resistance is 50 pips away, consider that upside against your risk.
• Use confluence and context: Don’t take every zone signal in isolation. The highest probability trades come when the DTFX Algo Zone aligns with other analysis (trend direction, chart patterns, higher timeframe support/resistance, etc.). This filtered approach will reduce trades taken in weak zones or counter-trend traps.
• Embrace patience and selectivity: Not all zones are equal. It can be wise to skip very narrow or insignificant zones and wait for those that form after a strong BOS/ChoCH (indicating a powerful move). Larger zones or zones formed during high-volume times tend to produce more reliable pullback opportunities.
• Review and adapt: After each trade, note how price behaved around the zone. If you notice certain Fib levels (like 50% or 61.8%) within the zone consistently provide the best entries, you can refine your approach to focus on those. Similarly, adjust the indicator’s settings if needed – for example, if too many minor zones are cluttering your screen, limit to the last few or increase the structure length parameter to capture only more significant swings.
⸻
By combining the DTFX Algo Zones indicator with disciplined confirmation and risk management, traders can improve their timing on pullback entries and avoid chasing moves. This indicator shines in helping you trade what you see, not what you feel – the clearly marked zones and structure shifts keep you grounded in price action reality. Whether you’re a trend trader looking to buy the dip/sell the rally, or a reversal trader hunting for exhaustion points, DTFX Algo Zones provides a robust visual aid to elevate your trading decisions. Use it as a complementary tool in your analysis to stay on the right side of the market’s structure and enhance your trading performance.

Dow waveform analyzerDow Waveform Analyzer
1. Overview and Features of the Indicator
This indicator is a tool designed to analyze chart waveforms based on Dow Theory, identifying swing lows (support) and swing highs (resistance). It allows users to quickly and consistently determine trend direction. Compared to manual analysis, it provides more efficient and accurate results.
By using swing lows and swing highs, the indicator offers a more detailed understanding of trends than simple updates to highs and lows, aiding in the creation of effective trading strategies.
2. Identifying Wave Lows and Highs
Stock prices do not move in straight lines; instead, they rise and fall in waves. This indicator starts by identifying the wave lows and wave highs.
- Wave Low: The lowest point during a temporary price decline.
- Wave High: The highest point during a temporary price increase.
These are automatically identified using Pine Script’s built-in functions `pivotlow` and `pivothigh`.
3. Drawing the Waveform
The identified wave lows and highs are alternately connected to draw the waveform. However, there are cases where wave lows or highs occur consecutively:
- Consecutive Wave Lows: The lower low is used for drawing the waveform.
- Consecutive Wave Highs: The higher high is used for drawing the waveform.
4. Tracking Swing Lows/Highs and Trend Determination
Swing lows and swing highs are crucial markers that indicate the state of wave progression:
- Swing Low: The starting point of a wave (wave low) when the closing price exceeds the previous wave high.
- Swing High: The starting point of a wave (wave high) when the closing price falls below the previous wave low.
The changes in swing lows and swing highs as the waves progress allow for trend state determination.
5. Examples of Trend States
During an Uptrend:
- When the price surpasses a wave high, the swing low is updated, confirming the continuation of the uptrend.
End of an Uptrend:
- When the price falls below the swing low, the swing low disappears, and a swing high appears, signaling the end of the uptrend.
Sideways Movement:
- Swing lows and swing highs alternately appear, indicating a sideways trend.
Start of a Downtrend:
- When the price breaks below a wave low for the first time, the swing high is updated, confirming the start of the downtrend.
During a Downtrend:
- When the price breaks below a wave low, the swing high is updated, confirming the continuation of the downtrend.
End of a Downtrend:
- When the price surpasses a wave high, the swing high disappears, and a swing low reappears, signaling the end of the downtrend.
Restart of an Uptrend:
- When the swing low is updated, the uptrend resumes. The uptrend begins when the price surpasses a wave high, and the swing low is updated for the first time.
6. Applications
Trade Entries and Exits:
- Set stop orders for entry at the price level where a trend starts.
- Set stop orders for exit at the price level where a trend ends.
Trend Filtering:
- Use the indicator to confirm whether market conditions are suitable for entry based on the trend state. Analyze waveforms to aid trading strategies.
Guide for Drawing Trendlines:
- Utilize wave lows and highs as starting and ending points when drawing trendlines with drawing tools.
7. Parameters and Display Items
Pivot Points:
- Wave lows are marked with circles below the candlestick’s low, and wave highs are marked with circles above the candlestick’s high.
Number of Bars for Pivot Calculation:
- Specify the number of bars on either side used to identify highs (default: 2).
Waveform:
- Specify the color (default: blue) or toggle its visibility (default: visible).
Swing Lows/Highs:
- Displayed as large circles. The rightmost large circle on the chart indicates the current swing low or swing high. Historical swing points are also displayed to show the progression of state changes. Specify the color (default: green) or toggle visibility (default: visible).
1. インジケーターの概要と特徴
このインジケーターは、ダウ理論を基にチャートの波形を分析し、押し安値や戻り高値を特定するツールです。これにより、トレンドの方向を迅速かつ一貫して判断できます。手動での分析と比較して、効率的かつ精度の高い結果が得られる点が特徴です。
押し安値や戻り高値を利用することで、単純な高値・安値の更新よりも詳細にトレンドの状況を把握し、効果的な取引戦略の構築に役立ちます。
2. 波の谷と波の頂の特定
株価は直線的に動くのではなく、波を描きながら上昇や下落を繰り返します。このインジケーターは、まず波の谷と波の頂を特定するところから始まります。
波の谷: 一時的な下落の最安値
波の頂: 一時的な上昇の最高値
これらを Pine Script の内蔵関数(ピボットローとピボットハイ)を用いて自動的に特定しています。
3. 波形の描画方法
特定した波の谷と波の頂を交互に結んで波形を描画します。ただし、波の谷や頂が連続する場合があります。
波の谷が連続する場合: より低い谷を採用して波形を描く
波の頂が連続する場合: より高い頂を採用して波形を描く
4. 押し安値・戻り高値の追跡とトレンド判断
押し安値と戻り高値は、波の進行状況を示す重要な指標です。
押し安値: 終値が前回の高値を超えた際の波の谷
戻り高値: 終値が前回の安値を割り込んだ際の波の頂
波の進行に伴う押し安値・戻り高値の変化から、トレンドの状態を判断します。
5. トレンド状態の具体例
上昇トレンド中:
波の頂を株価が上抜け押し安値が更新され続けることで上昇トレンドを継続。
上昇トレンドの終了:
株価が押し安値を割ると、押し安値が消え、戻り高値が新たに出現して、上昇トレンドを終了。
横ばい状態:
押し安値と戻り高値が交互に切り替わる。
下降トレンドの開始:
波の谷を株価が下抜け戻り高値がはじめて更新されることで下降トレンド開始を確認。
下降トレンド中:
波の谷を株価が下抜け戻り高値が更新され続けることで下降トレンドを継続。
下降トレンドの終了:
株価が波の頂を超えると、戻り高値が消え、押し安値が再び出現して、下降トレンドを終了。
横ばい状態:
押し安値と戻り高値が交互に切り替わる。
上昇トレンドの再開:
押し安値が更新されることで上昇トレンドを確認。
波の頂を株価が上抜け押し安値がはじめて更新されることで上昇トレンド開始を確認。
6. 応用例
トレードのエントリーとエグジット:
トレンド発生の価格に逆指値を設定してエントリー。
トレンド終了の価格に逆指値を設定してエグジット。
トレンドフィルターとして活用:
エントリーに適したトレンド状況かを確認。波形を分析してトレード戦略の参考に。
トレンドラインを描く時の参考として活用:
波の谷と頂を描画ツールを使ってトレンドラインを描く時の起点や終点として活用。
7. パラメーターと表示項目
ピボット: 波の谷はローソク足の安値にサークルを表示、波の頂はローソク足の高値にサークルを表示。
ピボット計算用のバーの数: 高値を特定するために左右何本のローソク足を使用するかを設定(初期値: 2)。
波形: 色(初期値: 青)や表示(初期値: 表示)の指定。
押し安値・戻り高値: 大きなサークルで表示。チャートの一番右の大きなサークルが現在のもの。過去のものも状態変化の経緯を示すために表示。色(初期値: 緑)や表示(初期値: 表示)の指定。

MarketStructureLibrary "MarketStructure"
This library contains functions for identifying Lows and Highs in a rule-based way, and deriving useful information from them.
f_simpleLowHigh()
This function finds Local Lows and Highs, but NOT in order. A Local High is any candle that has its Low taken out on close by a subsequent candle (and vice-versa for Local Lows).
The Local High does NOT have to be the candle with the highest High out of recent candles. It does NOT have to be a Williams High. It is not necessarily a swing high or a reversal or anything else.
It doesn't have to be "the" high, so don't be confused.
By the rules, Local Lows and Highs must alternate. In this function they do not, so I'm calling them Simple Lows and Highs.
Simple Highs and Lows, by the above definition, can be useful for entries and stops. Because I intend to use them for stops, I want them all, not just the ones that alternate in strict order.
@param - there are no parameters. The function uses the chart OHLC.
@returns boolean values for whether this bar confirms a Simple Low/High, and ints for the bar_index of that Low/High.
f_localLowHigh()
This function finds Local Lows and Highs, in order. A Local High is any candle that has its Low taken out on close by a subsequent candle (and vice-versa for Local Lows).
The Local High does NOT have to be the candle with the highest High out of recent candles. It does NOT have to be a Williams High. It is not necessarily a swing high or a reversal or anything else.
By the rules, Local Lows and Highs must alternate, and in this function they do.
@param - there are no parameters. The function uses the chart OHLC.
@returns boolean values for whether this bar confirms a Local Low/High, and ints for the bar_index of that Low/High.
f_enhancedSimpleLowHigh()
This function finds Local Lows and Highs, but NOT in order. A Local High is any candle that has its Low taken out on close by a subsequent candle (and vice-versa for Local Lows).
The Local High does NOT have to be the candle with the highest High out of recent candles. It does NOT have to be a Williams High. It is not necessarily a swing high or a reversal or anything else.
By the rules, Local Lows and Highs must alternate. In this function they do not, so I'm calling them Simple Lows and Highs.
Simple Highs and Lows, by the above definition, can be useful for entries and stops. Because I intend to use them for trailing stops, I want them all, not just the ones that alternate in strict order.
The difference between this function and f_simpleLowHigh() is that it also tracks the lowest/highest recent level. This level can be useful for trailing stops.
In effect, these are like more "normal" highs and lows that you would pick by eye, but confirmed faster in many cases than by waiting for the low/high of that particular candle to be taken out on close,
because they are instead confirmed by ANY subsequent candle having its low/high exceeded. Hence, I call these Enhanced Simple Lows/Highs.
The levels are taken from the extreme highs/lows, but the bar indexes are given for the candles that were actually used to confirm the Low/High.
This is by design, because it might be misleading to label the extreme, since we didn't use that candle to confirm the Low/High..
@param - there are no parameters. The function uses the chart OHLC.
@returns - boolean values for whether this bar confirms an Enhanced Simple Low/High
ints for the bar_index of that Low/High
floats for the values of the recent high/low levels
floats for the trailing high/low levels (for debug/post-processing)
bools for market structure bias
f_trueLowHigh()
This function finds True Lows and Highs.
A True High is the candle with the highest recent high, which then has its low taken out on close by a subsequent candle (and vice-versa for True Lows).
The difference between this and an Enhanced High is that confirmation requires not just any Simple High, but confirmation of the very candle that has the highest high.
Because of this, confirmation is often later, and multiple Simple Highs and Lows can develop within ranges formed by a single big candle without any of them being confirmed. This is by design.
A True High looks like the intuitive "real high" when you look at the chart. True Lows and Highs must alternate.
@param - there are no parameters. The function uses the chart OHLC.
@returns - boolean values for whether this bar confirms an Enhanced Simple Low/High
ints for the bar_index of that Low/High
floats for the values of the recent high/low levels
floats for the trailing high/low levels (for debug/post-processing)
bools for market structure bias

Smart Fixed Volume Profile [MarkitTick]💡 This comprehensive analysis suite integrates Auction Market Theory, structural gap analysis, and statistical liquidity strain modeling into a single, cohesive toolkit. Designed for traders who require a granular view of institutional order flow, this indicator overlays a Fixed Range Volume Profile with intelligent price gap classification and a volatility-adjusted exhaustion detector. By combining these three distinct analytical dimensions, it allows users to identify value consensus, structural breakouts, and potential market turns driven by liquidity shortages.
✨ Originality and Utility
While standard Volume Profiles display where trading occurred, this script advances the concept by contextually analyzing *how* price arrived at those levels. It solves the problem of isolated analysis by fusing three disparate methodologies:
Contextual Integration: It does not merely show support and resistance; it qualifies moves using "Smart Gaps" (classifying gaps based on market structure) and "Liquidity Strain" (identifying unsustainable price velocity).
Institutional Footprint: The inclusion of an "Unusual Volume" highlighter within the profile bars helps traders spot hidden institutional accumulation or distribution blocks that standard profiles miss.
Hybrid Logic: By combining a fixed-time profile (anchored to specific dates) with dynamic, developing gap analysis, it provides both a static roadmap of the past and a dynamic interpretation of current price action.
🔬 Methodology and Concepts
• Fixed Volume Profile Engine
The core of the indicator constructs a volume distribution histogram over a user-defined time window. It utilizes a custom aggregation engine that:
Fetches higher-timeframe volume and price data to ensure accuracy.
Segments the price range into specific "bins" or rows.
Allocates volume to these bins based on price action within the bar, separating Buying Volume (Up bars) from Selling Volume (Down bars).
Calculates the Point of Control (POC) —the price level with the highest traded volume—and the Value Area , which contains 70% (customizable) of the total volume centered around the POC.
• Smart Gap Logic
The script systematically identifies price gaps and classifies them based on their location relative to market pivots (Highs/Lows):
Breakaway Gaps: Occur when price gaps beyond a significant structural pivot (Lookback High/Low), signaling a potential trend initiation.
Runaway Gaps: Occur within an existing trend without breaking structure, indicating trend continuation.
Exhaustion Gaps: Identified when a gap occurs late in a mature trend (measured by bar count since the last pivot) accompanied by a volume spike, suggesting the trend is overextended.
• Liquidity Strain Detector
This module utilizes a statistical approach to measure market stress. It calculates "Illiquidity" by analyzing the ratio of True Range to Volume (Price Impact).
It applies a Logarithmic transformation to normalize the data.
It calculates a Z-Score (Standard Deviation from the mean) of this impact.
If the Z-Score exceeds a threshold (e.g., 2.0 Sigma) while the trend opposes the price move, it triggers an exhaustion signal, indicating that price is moving too easily on too little volume (thin liquidity).
🎨 Visual Guide
• Volume Profile Elements
Histogram Bars: Horizontal bars representing volume at price. Cyan indicates bullish volume; Red indicates bearish volume.
Unusual Volume Highlight: Bars with volume exceeding the average by a set factor (default 2x) are highlighted with brighter, distinct overlays to denote institutional interest.
POC Line: A solid Yellow line marking the price level with the highest volume.
VAH / VAL Lines: Dashed Blue lines marking the Value Area High and Value Area Low.
Background Box: A grey shaded area encapsulating the entire time and price range of the profile.
• Smart Gap Boxes
Blue Box (Breakaway): Marks the start of a new structural move.
Orange Box (Runaway): Marks continuation gaps in the middle of a trend.
Red Box (Exhaustion): Marks potential trend termination points.
Dotted Lines: Extend from the center of gap boxes to serve as future support/resistance levels. These boxes are automatically deleted if price "fills" or violates the gap level.
Note: This tool incorporates core components from [ Smart Gap Concepts ], optimized for this specific strategy.
• Liquidity Signals
Green Label (SE): "Seller Exhaustion" – Appears below bars in a downtrend when selling pressure is statistically overextended.
Red Label (BE): "Buyer Exhaustion" – Appears above bars in an uptrend when buying pressure is statistically overextended.
Note: This tool incorporates core components from [ Liquidity Strain Detector ], optimized for this specific strategy.
📖 How to Use
• Interactive Range Selection: This indicator features a flexible, interactive input system. Upon adding the script to your chart, execution is paused until the analysis range is defined. You will be prompted to click on the chart twice: first to establish the Start Date and second to establish the End Date. Once these anchor points are confirmed, the indicator will automatically load the data and generate the profile for the selected specific period.
● Strategies for Optimal Anchoring
the optimal starting and ending points for high-probability setups:
Swing Highs and Lows (Trend Analysis):
Anchor the Start Date at a major structural swing high or low and the End Date at the current price using the Extend to Present feature. This identifies the "Fair Value" for the entire price move .
Consolidation/Range Anchoring:
Set the Start Date at the first bar of a sideways range and the End Date at the breakout candle. This reveals the high-node volume clusters that will act as future support or resistance.
Session-Based Anchoring (Intraday):
Align the Start Date with the session open (e.g., London or New York open) to track institutional flow for that specific day .
Event-Driven Anchoring:
Place the Start Date on a significant news event or a Breakaway Gap identified by the script's Gap Engine. This helps determine if the new volume supports the direction of the gap.
Correction Cycles:
During a pullback, anchor the Start Date at the start of the correction to find the Value Area Low (VAL), which often serves as a tactical entry point for a trend continuation.
• Identifying Value:
Use the Value Area to gauge market consensus. Acceptance of price within the VA indicates balance. A breakout above VAH or below VAL suggests the market is searching for new value. The POC often acts as a magnet for price correction.
• Trading Breakouts:
Watch for Breakaway Gaps (Blue) that align with a move out of the Volume Profile's Value Area. This confluence increases the probability of a sustained trend.
• Spotting Reversals:
Combine Exhaustion Gaps (Red) with Liquidity Strain Signals (SE/BE) . If price gaps up into a low-volume node on the profile and prints a "Buyer Exhaustion" signal, it suggests the move is unsupported by liquidity and liable to reverse.
• Support and Resistance:
The extended dotted lines from the Smart Gap boxes act as dynamic support/resistance. A retest of a "Runaway Gap" is often a viable entry point for trend continuation.
⚙️ Inputs and Settings
• Global Profile:
Start/End Date: Define the exact window for the volume profile calculation.
Extend to Present: If checked, the profile updates with live data beyond the end date.
• Profile Settings:
Number of Rows: Determines the vertical resolution (granularity) of the histogram.
Value Area %: Default is 70%, representing one standard deviation of volume distribution.
Placement: Position the profile on the Left or Right of the defined range.
• Liquidity & Gaps:
Unusual Threshold: Multiplier of average volume to highlight institutional bars (default 2.0x).
Structure Lookback: Adjusts the sensitivity of pivot detection for gap classification.
Stress Threshold (Sigma): The Z-Score limit for triggering Liquidity Strain signals (default 2.0).
🔍 Deconstruction of the Underlying Scientific and Academic Framework
• Auction Market Theory (AMT):
The script is grounded in AMT, which posits that the market's primary function is to facilitate trade. The Volume Profile visualizes this by displaying a bell curve of price distribution. The Value Area (typically 70%) corresponds to the First Standard Deviation in a normal Gaussian distribution, representing the area of "Fair Value" where buyers and sellers agree.
• Market Microstructure & Kyle’s Lambda:
The Liquidity Strain module draws conceptually from Kyle’s Lambda, a metric in market microstructure that measures market depth and price impact (Illiquidity). By calculating the ratio of price change (True Range) to Volume, the script approximates the "cost" of moving the market.
• Statistical Z-Score Normalization:
To make the liquidity data actionable, the script applies Z-Score normalization: Z = (X - μ) / σ . This converts raw illiquidity values into standard deviations from the mean. A Z-Score above +2.0 signifies a statistically significant anomaly—an outlier event where price moved excessively relative to the volume traded, often preceding a mean-reversion event.
⚠️ Disclaimer
All provided scripts and indicators are strictly for educational exploration and must not be interpreted as financial advice or a recommendation to execute trades. I expressly disclaim all liability for any financial losses or damages that may result, directly or indirectly, from the reliance on or application of these tools. Market participation carries inherent risk where past performance never guarantees future returns, leaving all investment decisions and due diligence solely at your own discretion.

Pivot Regime Anchored VWAP [CHE] Pivot Regime Anchored VWAP — Detects body-based pivot regimes to classify swing highs and lows, anchoring volume-weighted average price lines directly at higher highs and lower lows for adaptive reference levels.
Summary
This indicator identifies shifts between top and bottom regimes through breakouts in candle body highs and lows, labeling swing points as higher highs, lower highs, lower lows, or higher lows. It then draws anchored volume-weighted average price lines starting from the most recent higher high and lower low, providing dynamic support and resistance that evolve with volume flow. These anchored lines differ from standard volume-weighted averages by resetting only at confirmed swing extremes, reducing noise in ranging markets while highlighting momentum shifts in trends.
Motivation: Why this design?
Traders often struggle with static reference lines that fail to adapt to changing market structures, leading to false breaks in volatile conditions or missed continuations in trends. By anchoring volume-weighted average price calculations to body pivot regimes—specifically at higher highs for resistance and lower lows for support—this design creates reference levels tied directly to price structure extremes. This approach addresses the problem of generic moving averages lagging behind swing confirmations, offering a more context-aware tool for intraday or swing trading.
What’s different vs. standard approaches?
- Baseline reference: Traditional volume-weighted average price indicators compute a running total from session start or fixed periods, often ignoring price structure.
- Architecture differences:
- Regime detection via body breakout logic switches between high and low focus dynamically.
- Anchoring limited to confirmed higher highs and lower lows, with historical recalculation for accurate line drawing.
- Polyline rendering rebuilds only on the last bar to manage performance.
- Practical effect: Charts show fewer, more meaningful lines that start at swing points, making it easier to spot confluences with structure breaks rather than cluttered overlays from continuous calculations.
How it works (technical)
The indicator first calculates the maximum and minimum of each candle's open and close to define body highs and lows. It then scans a lookback window for the highest body high and lowest body low. A top regime triggers when the body high from the lookback period exceeds the window's highest, and a bottom regime when the body low falls below the window's lowest. These regime shifts confirm pivots only when crossing from one state to the other.
For top pivots, it compares the new body high against the previous swing high: if greater, it marks a higher high and anchors a new line; otherwise, a lower high. The same logic applies inversely for bottom pivots. Anchored lines use cumulative price-volume products and volumes from the anchor bar onward, subtracting prior cumulatives to isolate the segment. On pivot confirmation, it loops backward from the current bar to the anchor, computing and storing points for the line. New points append as bars advance, ensuring the line reflects ongoing volume weighting.
Initialization uses persistent variables to track the last swing values and anchor bars, starting with neutral states. Data flows from regime detection to pivot classification, then to anchoring and point accumulation, with lines rendered globally on the final bar.
Parameter Guide
Pivot Length — Controls the lookback window for detecting body breakouts, influencing pivot frequency and sensitivity to recent action. Shorter values catch more pivots in choppy conditions; longer smooths for major swings. Default: 30 (bars). Trade-offs/Tips: Min 1; for intraday, try 10–20 to reduce lag but watch for noise; on daily, 50+ for stability.
Show Pivot Labels — Toggles display of text markers at swing points, aiding quick identification of higher highs, lower highs, lower lows, or higher lows. Default: true. Trade-offs/Tips: Disable in multi-indicator setups to declutter; useful for backtesting structure.
HH Color — Sets the line and label color for higher high anchored lines, distinguishing resistance levels. Default: Red (solid). Trade-offs/Tips: Choose contrasting hues for dark/light themes; pair with opacity for fills if added later.
LL Color — Sets the line and label color for lower low anchored lines, distinguishing support levels. Default: Lime (solid). Trade-offs/Tips: As above; green shades work well for bullish contexts without overpowering candles.
Reading & Interpretation
Higher high labels and red lines indicate potential resistance zones where volume weighting begins at a new swing top, suggesting sellers may defend prior highs. Lower low labels and lime lines mark support from a fresh swing bottom, with the line's slope reflecting buyer commitment via volume. Lower highs or higher lows appear as labels without new anchors, signaling possible range-bound action. Line proximity to price shows overextension; crosses may hint at regime shifts, but confirm with volume spikes.
Practical Workflows & Combinations
- Trend following: Enter longs above a rising lower low anchored line after higher low confirmation; filter with rising higher highs for uptrends. Use line breaks as trailing stops.
- Exits/Stops: In downtrends, exit shorts below a higher high line; set aggressive stops above it for scalps, conservative below for swings. Pair with momentum oscillators for divergence.
- Multi-asset/Multi-TF: Defaults suit forex/stocks on 1H–4H; on crypto 15M, shorten length to 15. Scale colors for dark themes; combine with higher timeframe anchors for confluence.
Behavior, Constraints & Performance
Closed-bar logic ensures pivots confirm after the lookback period, with no repainting on historical bars—live bars may adjust until regime shift. No higher timeframe calls, so minimal repaint risk beyond standard delays. Resources include a 2000-bar history limit, label/polyline caps at 200/50, and loops for historical point filling (up to current bar count from anchor, typically under 500 iterations). Known limits: In extreme gaps or low-volume periods, anchors may skew; lines absent until first pivots.
Sensible Defaults & Quick Tuning
Start with the 30-bar length for balanced pivot detection across most assets. For too-frequent pivots in ranges, increase to 50 for fewer signals. If lines lag in trends, reduce to 20 and enable labels for visual cues. In low-volatility assets, widen color contrasts; test on 100-bar history to verify stability.
What this indicator is—and isn’t
This is a structure-aware visualization layer for anchoring volume-weighted references at swing extremes, enhancing manual analysis of regimes and levels. It is not a standalone signal generator or predictive model—always integrate with broader context like order flow or news. Use alongside risk management and position sizing, not as isolated buy/sell triggers.
Many thanks to LuxAlgo for the original script "McDonald's Pattern ". The implementation for body pivots instead of wicks uses a = max(open, close), b = min(open, close) and then highest(a, length) / lowest(b, length). This filters noise from the wicks and detects breakouts over/under bodies. Unusual and targeted, super innovative.
Disclaimer
The content provided, including all code and materials, is strictly for educational and informational purposes only. It is not intended as, and should not be interpreted as, financial advice, a recommendation to buy or sell any financial instrument, or an offer of any financial product or service. All strategies, tools, and examples discussed are provided for illustrative purposes to demonstrate coding techniques and the functionality of Pine Script within a trading context.
Any results from strategies or tools provided are hypothetical, and past performance is not indicative of future results. Trading and investing involve high risk, including the potential loss of principal, and may not be suitable for all individuals. Before making any trading decisions, please consult with a qualified financial professional to understand the risks involved.
By using this script, you acknowledge and agree that any trading decisions are made solely at your discretion and risk.
Do not use this indicator on Heikin-Ashi, Renko, Kagi, Point-and-Figure, or Range charts, as these chart types can produce unrealistic results for signal markers and alerts.
Best regards and happy trading
Chervolino

Smart Structure Breaks & Order BlocksOverview (What it does)
The indicator “Smart Structure Breaks & Order Blocks” detects market structure using swing highs and lows, identifies Break of Structure (BOS) events, and automatically draws order blocks (OBs) from the origin candle. These zones extend to the right and change color/outline when mitigated or invalidated. By formalizing and automating part of discretionary analysis, it provides consistent zone recognition.
Main Components
Swing Detection: ta.pivothigh/ta.pivotlow identify confirmed swing points.
BOS Detection: Determines if the recent swing high/low is broken by close (strict mode) or crossover.
OB Creation: After a BOS, the opposite candle (bearish for bullish BOS, bullish for bearish BOS) is used to generate an order block zone.
Zone Management: Limits the number of zones, extends them to the right, and tracks tagged (mitigated) or invalidated states.
Input Parameters
Left/Right Pivot (default 6/6): Number of bars required on each side to confirm a swing. Higher values = smoother swings.
Max Zones (default 4): Maximum zones stored per direction (bull/bear). Oldest zones are overwritten.
Zone Confirmation Lookback (default 3): Ensures OB origin candle validity by checking recent highs/lows.
Show Swing Points (default ON): Displays triangles on swing highs/lows.
Require close for BOS? (default ON): Strict BOS (close required) vs loose BOS (line crossover).
Use candle body for zones (default OFF): Zones drawn from candle body (ON) or wick (OFF).
Signal Definition & Logic
Swing Updates: Latest confirmed pivots update lastHighLevel / lastLowLevel.
BOS (Break of Structure):
Bullish – close breaks last swing high.
Bearish – close breaks last swing low.
Only one valid BOS per swing (avoids duplicates).
OB Detection:
Bullish BOS → previous bearish candle with lowest low forms the OB.
Bearish BOS → previous bullish candle with highest high forms the OB.
Zones: Bull = green, Bear = red, semi-transparent, extended to the right.
Zone States:
Mitigated: Price touches the zone → border highlighted.
Invalidated:
Bull zone → close below → turns red.
Bear zone → close above → turns green.
Chart Appearance
Swing High: red triangle above bar
Swing Low: green triangle below bar
Bull OB: green zone (border highlighted on touch)
Bear OB: red zone (border highlighted on touch)
Invalid Zones: Bull zones turn reddish, Bear zones turn greenish
Practical Use (Trading Assistance)
Trend Following Entries: Buy pullbacks into green OBs in uptrends, sell rallies into red OBs in downtrends.
Focus on First Touch: First mitigation after BOS often has higher reaction probability.
Confluence: Combine with higher timeframe trend, volume, session levels, key price levels (previous highs/lows, VWAP, etc.).
Stops/Targets:
Bull – stop below zone, partial take profit at swing high or resistance.
Bear – stop above zone, partial take profit at swing low or support.
Parameter Tuning (per market/timeframe)
Pivot (6/6 → 4/4/8/8): Lower for scalping (3–5), medium for day trading (5–8), higher for swing trading (8–14). Increase to reduce noise.
Strict Break: ON to reduce false breaks in ranging markets; OFF for earlier signals.
Body Zones: ON for assets with long wicks, OFF for cleaner OBs in liquid instruments.
Zone Confirmation (default 3): Increase for stricter OB origin, fewer zones.
Max Zones (default 4 → 6–10): Increase for higher volatility, decrease to avoid clutter.
Strengths
Standardizes BOS and OB detection that is usually subjective.
Tracks mitigation and invalidation automatically.
Adaptable: allows body/wick zone switching for different instruments.
Limitations
Pivot-based: Signals appear only after pivots confirm (slight lag).
Zones reflect past balance: Can fail after new events (news, earnings, macro data).
Range-heavy markets: More false BOS; consider stricter settings.
Backtesting: This script is for drawing/visual aid; trading rules must be defined separately.
Workflow Example
Identify higher timeframe trend (4H/Daily).
On lower TF (15–60m), wait for BOS and new OB.
Enter on first mitigation with confirmation candle.
Stop beyond zone; targets based on R multiples and swing points.
FAQ
Q: Why are zones invalidated quickly?
A: Flow reversal after BOS. Adjust pivots higher, enable Strict mode, or switch to Body zones to reduce noise.
Q: What does “tagged” mean?
A: Price touched the zone once = mitigated. Implies some orders in that zone may have been filled.
Q: Body or Wick zones?
A: Wick zones are fine in clean markets. For volatile pairs with long wicks, body zones provide more realistic areas.
Customization Tips (Code perspective)
Zone storage: Currently ring buffer ((idx+1) % zoneLimit). Could prioritize keeping unmitigated zones.
Automated testing: Add strategy.entry/exit for rule-based backtests.
Multi-timeframe: Use request.security() for higher timeframe swings/BOS.
Visualization: Add labels for BOS bars, tag zones with IDs, count touches.
Summary
This indicator formalizes the cycle Swing → BOS → OB creation → Mitigation/Invalidation, providing consistent structure analysis and zone tracking. By tuning sensitivity and strictness, and combining with higher timeframe context, it enhances pullback/continuation trading setups. Always combine with proper risk management.

Dynamic Market Structure DetectorTitle: Dynamic Market Structure Detector – Real-Time BoS & ChoCH Signals
Short Description:
Identify market structure dynamically with real-time Break of Structure (BoS) and Change of Character (ChoCH) signals. Highlight untested support and resistance zones to improve trading precision.
Full Description:
The Dynamic Market Structure Detector is a powerful TradingView indicator designed for traders who want to automate the identification of key market structure levels. This indicator simplifies market analysis by dynamically tracking swing highs and lows, marking critical Break of Structure (BoS) and Change of Character (ChoCH) points, and highlighting untested support and resistance zones.
Key Features:
1. Real-Time Signals:
• Marks Break of Structure (BoS) and Change of Character (ChoCH) points as they occur.
• Automatically updates as the market evolves.
2. Dynamic Swing Highs and Lows:
• Tracks swing highs and lows based on user-defined sensitivity (Swing Length).
• Adjust swing length to tailor signals for intraday or swing trading.
3. Untested Zones Highlight:
• Visualize untested support and resistance zones dynamically.
• Opacity settings allow customization for better chart readability.
4. Customizable Inputs:
• Swing Length:
Adjust the sensitivity of BoS and ChoCH signals.
• Smaller Swing Length values (e.g., 3–5): Capture short-term market movements, ideal for intraday trading.
• Larger Swing Length values (e.g., 10–20): Focus on significant market structure changes for swing or positional trading.
Experiment with these values to find the best fit for your trading style.
• Untested Zone Opacity:
Control the visibility of highlighted support and resistance zones.
• Lower opacity values (e.g., 10–50): Make the zones more prominent, helpful for darker chart backgrounds.
• Higher opacity values (e.g., 70–90): Provide subtle highlights, better suited for lighter chart setups.
• A value of 100% renders the zones completely transparent (invisible).
Use this setting to customize the visual appearance of your chart while still retaining key zone information.
5. User-Friendly Visualization:
• Color-coded labels for BoS (Green) and ChoCH (Red).
• Highlight zones for untested areas using customizable colors (Support: Blue, Resistance: Orange).
Why Use This Indicator?
• Simplifies market structure analysis by automating key calculations.
• Helps traders identify potential trend reversals and continuation points.
• Reduces the need for manual charting, saving time and effort.
• Provides visual clarity on untested zones for better decision-making.
Recommended Usage:
• Intraday Traders: Use smaller Swing Length values (e.g., 3–5) to capture short-term market movements.
• Swing Traders: Opt for higher Swing Length values (e.g., 10–20) to focus on larger market structure changes.
• Monitor untested zones for potential price reactions, enhancing your trade entries and exits.
Notes :
This indicator is best suited for traders who prefer price action trading and market structure analysis. While the indicator provides reliable insights, it is recommended to use it in conjunction with other analysis tools for a holistic trading approach.
Credits:
Developed by TradeTech Analysis to empower traders with automated tools for smarter trading decisions.

BUZARA// © Buzzara
// =================================
// PLEASE SUPPORT THE TEAM
// =================================
//
// Telegram: t.me
// =================================
//@version=5
VERSION = ' Buzzara2.0'
strategy('ALGOX V6_1_24', shorttitle = '🚀〄 Buzzara2.0 〄🚀'+ VERSION, overlay = true, explicit_plot_zorder = true, pyramiding = 0, default_qty_type = strategy.percent_of_equity, initial_capital = 1000, default_qty_value = 1, calc_on_every_tick = false, process_orders_on_close = true)
G_SCRIPT01 = '■ ' + 'SAIYAN OCC'
//#region ———— <↓↓↓ G_SCRIPT01 ↓↓↓> {
// === INPUTS ===
res = input.timeframe('15', 'TIMEFRAME', group ="NON REPAINT")
useRes = input(true, 'Use Alternate Signals')
intRes = input(10, 'Multiplier for Alernate Signals')
basisType = input.string('ALMA', 'MA Type: ', options= )
basisLen = input.int(50, 'MA Period', minval=1)
offsetSigma = input.int(5, 'Offset for LSMA / Sigma for ALMA', minval=0)
offsetALMA = input.float(2, 'Offset for ALMA', minval=0, step=0.01)
scolor = input(false, 'Show coloured Bars to indicate Trend?')
delayOffset = input.int(0, 'Delay Open/Close MA', minval=0, step=1,
tooltip = 'Forces Non-Repainting')
tradeType = input.string('BOTH', 'What trades should be taken : ',
options = )
//=== /INPUTS ===
h = input(false, 'Signals for Heikin Ashi Candles')
//INDICATOR SETTINGS
swing_length = input.int(10, 'Swing High/Low Length', group = 'Settings', minval = 1, maxval = 50)
history_of_demand_to_keep = input.int(20, 'History To Keep', minval = 5, maxval = 50)
box_width = input.float(2.5, 'Supply/Demand Box Width', group = 'Settings', minval = 1, maxval = 10, step = 0.5)
//INDICATOR VISUAL SETTINGS
show_zigzag = input.bool(false, 'Show Zig Zag', group = 'Visual Settings', inline = '1')
show_price_action_labels = input.bool(false, 'Show Price Action Labels', group = 'Visual Settings', inline = '2')
supply_color = input.color(#00000000, 'Supply', group = 'Visual Settings', inline = '3')
supply_outline_color = input.color(#00000000, 'Outline', group = 'Visual Settings', inline = '3')
demand_color = input.color(#00000000, 'Demand', group = 'Visual Settings', inline = '4')
demand_outline_color = input.color(#00000000, 'Outline', group = 'Visual Settings', inline = '4')
bos_label_color = input.color(#00000000, 'BOS Label', group = 'Visual Settings', inline = '5')
poi_label_color = input.color(#00000000, 'POI Label', group = 'Visual Settings', inline = '7')
poi_border_color = input.color(#00000000, 'POI border', group = 'Visual Settings', inline = '7')
swing_type_color = input.color(#00000000, 'Price Action Label', group = 'Visual Settings', inline = '8')
zigzag_color = input.color(#00000000, 'Zig Zag', group = 'Visual Settings', inline = '9')
//END SETTINGS
// FUNCTION TO ADD NEW AND REMOVE LAST IN ARRAY
f_array_add_pop(array, new_value_to_add) =>
array.unshift(array, new_value_to_add)
array.pop(array)
// FUNCTION SWING H & L LABELS
f_sh_sl_labels(array, swing_type) =>
var string label_text = na
if swing_type == 1
if array.get(array, 0) >= array.get(array, 1)
label_text := 'HH'
else
label_text := 'LH'
label.new(
bar_index - swing_length,
array.get(array,0),
text = label_text,
style = label.style_label_down,
textcolor = swing_type_color,
color = swing_type_color,
size = size.tiny)
else if swing_type == -1
if array.get(array, 0) >= array.get(array, 1)
label_text := 'HL'
else
label_text := 'LL'
label.new(
bar_index - swing_length,
array.get(array,0),
text = label_text,
style = label.style_label_up,
textcolor = swing_type_color,
color = swing_type_color,
size = size.tiny)
// FUNCTION MAKE SURE SUPPLY ISNT OVERLAPPING
f_check_overlapping(new_poi, box_array, atrValue) =>
atr_threshold = atrValue * 2
okay_to_draw = true
for i = 0 to array.size(box_array) - 1
top = box.get_top(array.get(box_array, i))
bottom = box.get_bottom(array.get(box_array, i))
poi = (top + bottom) / 2
upper_boundary = poi + atr_threshold
lower_boundary = poi - atr_threshold
if new_poi >= lower_boundary and new_poi <= upper_boundary
okay_to_draw := false
break
else
okay_to_draw := true
okay_to_draw
// FUNCTION TO DRAW SUPPLY OR DEMAND ZONE
f_supply_demand(value_array, bn_array, box_array, label_array, box_type, atrValue) =>
atr_buffer = atrValue * (box_width / 10)
box_left = array.get(bn_array, 0)
box_right = bar_index
var float box_top = 0.00
var float box_bottom = 0.00
var float poi = 0.00
if box_type == 1
box_top := array.get(value_array, 0)
box_bottom := box_top - atr_buffer
poi := (box_top + box_bottom) / 2
else if box_type == -1
box_bottom := array.get(value_array, 0)
box_top := box_bottom + atr_buffer
poi := (box_top + box_bottom) / 2
okay_to_draw = f_check_overlapping(poi, box_array, atrValue)
// okay_to_draw = true
//delete oldest box, and then create a new box and add it to the array
if box_type == 1 and okay_to_draw
box.delete( array.get(box_array, array.size(box_array) - 1) )
f_array_add_pop(box_array, box.new( left = box_left, top = box_top, right = box_right, bottom = box_bottom, border_color = supply_outline_color,
bgcolor = supply_color, extend = extend.right, text = 'SUPPLY', text_halign = text.align_center, text_valign = text.align_center, text_color = poi_label_color, text_size = size.small, xloc = xloc.bar_index))
box.delete( array.get(label_array, array.size(label_array) - 1) )
f_array_add_pop(label_array, box.new( left = box_left, top = poi, right = box_right, bottom = poi, border_color = poi_border_color,
bgcolor = poi_border_color, extend = extend.right, text = 'POI', text_halign = text.align_left, text_valign = text.align_center, text_color = poi_label_color, text_size = size.small, xloc = xloc.bar_index))
else if box_type == -1 and okay_to_draw
box.delete( array.get(box_array, array.size(box_array) - 1) )
f_array_add_pop(box_array, box.new( left = box_left, top = box_top, right = box_right, bottom = box_bottom, border_color = demand_outline_color,
bgcolor = demand_color, extend = extend.right, text = 'DEMAND', text_halign = text.align_center, text_valign = text.align_center, text_color = poi_label_color, text_size = size.small, xloc = xloc.bar_index))
box.delete( array.get(label_array, array.size(label_array) - 1) )
f_array_add_pop(label_array, box.new( left = box_left, top = poi, right = box_right, bottom = poi, border_color = poi_border_color,
bgcolor = poi_border_color, extend = extend.right, text = 'POI', text_halign = text.align_left, text_valign = text.align_center, text_color = poi_label_color, text_size = size.small, xloc = xloc.bar_index))
// FUNCTION TO CHANGE SUPPLY/DEMAND TO A BOS IF BROKEN
f_sd_to_bos(box_array, bos_array, label_array, zone_type) =>
if zone_type == 1
for i = 0 to array.size(box_array) - 1
level_to_break = box.get_top(array.get(box_array,i))
// if ta.crossover(close, level_to_break)
if close >= level_to_break
copied_box = box.copy(array.get(box_array,i))
f_array_add_pop(bos_array, copied_box)
mid = (box.get_top(array.get(box_array,i)) + box.get_bottom(array.get(box_array,i))) / 2
box.set_top(array.get(bos_array,0), mid)
box.set_bottom(array.get(bos_array,0), mid)
box.set_extend( array.get(bos_array,0), extend.none)
box.set_right( array.get(bos_array,0), bar_index)
box.set_text( array.get(bos_array,0), 'BOS' )
box.set_text_color( array.get(bos_array,0), bos_label_color)
box.set_text_size( array.get(bos_array,0), size.small)
box.set_text_halign( array.get(bos_array,0), text.align_center)
box.set_text_valign( array.get(bos_array,0), text.align_center)
box.delete(array.get(box_array, i))
box.delete(array.get(label_array, i))
if zone_type == -1
for i = 0 to array.size(box_array) - 1
level_to_break = box.get_bottom(array.get(box_array,i))
// if ta.crossunder(close, level_to_break)
if close <= level_to_break
copied_box = box.copy(array.get(box_array,i))
f_array_add_pop(bos_array, copied_box)
mid = (box.get_top(array.get(box_array,i)) + box.get_bottom(array.get(box_array,i))) / 2
box.set_top(array.get(bos_array,0), mid)
box.set_bottom(array.get(bos_array,0), mid)
box.set_extend( array.get(bos_array,0), extend.none)
box.set_right( array.get(bos_array,0), bar_index)
box.set_text( array.get(bos_array,0), 'BOS' )
box.set_text_color( array.get(bos_array,0), bos_label_color)
box.set_text_size( array.get(bos_array,0), size.small)
box.set_text_halign( array.get(bos_array,0), text.align_center)
box.set_text_valign( array.get(bos_array,0), text.align_center)
box.delete(array.get(box_array, i))
box.delete(array.get(label_array, i))
// FUNCTION MANAGE CURRENT BOXES BY CHANGING ENDPOINT
f_extend_box_endpoint(box_array) =>
for i = 0 to array.size(box_array) - 1
box.set_right(array.get(box_array, i), bar_index + 100)
//
stratRes = timeframe.ismonthly ? str.tostring(timeframe.multiplier * intRes, '###M') :
timeframe.isweekly ? str.tostring(timeframe.multiplier * intRes, '###W') :
timeframe.isdaily ? str.tostring(timeframe.multiplier * intRes, '###D') :
timeframe.isintraday ? str.tostring(timeframe.multiplier * intRes, '####') :
'60'
src = h ? request.security(ticker.heikinashi(syminfo.tickerid),
timeframe.period, close, lookahead = barmerge.lookahead_off) : close
// CALCULATE ATR
atrValue = ta.atr(50)
// CALCULATE SWING HIGHS & SWING LOWS
swing_high = ta.pivothigh(high, swing_length, swing_length)
swing_low = ta.pivotlow(low, swing_length, swing_length)
// ARRAYS FOR SWING H/L & BN
var swing_high_values = array.new_float(5,0.00)
var swing_low_values = array.new_float(5,0.00)
var swing_high_bns = array.new_int(5,0)
var swing_low_bns = array.new_int(5,0)
// ARRAYS FOR SUPPLY / DEMAND
var current_supply_box = array.new_box(history_of_demand_to_keep, na)
var current_demand_box = array.new_box(history_of_demand_to_keep, na)
// ARRAYS FOR SUPPLY / DEMAND POI LABELS
var current_supply_poi = array.new_box(history_of_demand_to_keep, na)
var current_demand_poi = array.new_box(history_of_demand_to_keep, na)
// ARRAYS FOR BOS
var supply_bos = array.new_box(5, na)
var demand_bos = array.new_box(5, na)
//END CALCULATIONS
// NEW SWING HIGH
if not na(swing_high)
//MANAGE SWING HIGH VALUES
f_array_add_pop(swing_high_values, swing_high)
f_array_add_pop(swing_high_bns, bar_index )
if show_price_action_labels
f_sh_sl_labels(swing_high_values, 1)
f_supply_demand(swing_high_values, swing_high_bns, current_supply_box, current_supply_poi, 1, atrValue)
// NEW SWING LOW
else if not na(swing_low)
//MANAGE SWING LOW VALUES
f_array_add_pop(swing_low_values, swing_low)
f_array_add_pop(swing_low_bns, bar_index )
if show_price_action_labels
f_sh_sl_labels(swing_low_values, -1)
f_supply_demand(swing_low_values, swing_low_bns, current_demand_box, current_demand_poi, -1, atrValue)
f_sd_to_bos(current_supply_box, supply_bos, current_supply_poi, 1)
f_sd_to_bos(current_demand_box, demand_bos, current_demand_poi, -1)
f_extend_box_endpoint(current_supply_box)
f_extend_box_endpoint(current_demand_box)
channelBal = input.bool(false, "Channel Balance", group = "CHART")
lr_slope(_src, _len) =>
x = 0.0, y = 0.0, x2 = 0.0, xy = 0.0
for i = 0 to _len - 1
val = _src
per = i + 1
x += per
y += val
x2 += per * per
xy += val * per
_slp = (_len * xy - x * y) / (_len * x2 - x * x)
_avg = y / _len
_int = _avg - _slp * x / _len + _slp
lr_dev(_src, _len, _slp, _avg, _int) =>
upDev = 0.0, dnDev = 0.0
val = _int
for j = 0 to _len - 1
price = high - val
if price > upDev
upDev := price
price := val - low
if price > dnDev
dnDev := price
price := _src
val += _slp
//
= ta.kc(close, 80, 10.5)
= ta.kc(close, 80, 9.5)
= ta.kc(close, 80, 8)
= ta.kc(close, 80, 3)
barsL = 10
barsR = 10
pivotHigh = fixnan(ta.pivothigh(barsL, barsR) )
pivotLow = fixnan(ta.pivotlow(barsL, barsR) )
source = close, period = 150
= lr_slope(source, period)
= lr_dev(source, period, s, a, i)
y1 = low - (ta.atr(30) * 2), y1B = low - ta.atr(30)
y2 = high + (ta.atr(30) * 2), y2B = high + ta.atr(30)
x1 = bar_index - period + 1, _y1 = i + s * (period - 1), x2 = bar_index, _y2 = i
//Functions
//Line Style function
get_line_style(style) =>
out = switch style
'???' => line.style_solid
'----' => line.style_dashed
' ' => line.style_dotted
//Function to get order block coordinates
get_coordinates(condition, top, btm, ob_val)=>
var ob_top = array.new_float(0)
var ob_btm = array.new_float(0)
var ob_avg = array.new_float(0)
var ob_left = array.new_int(0)
float ob = na
//Append coordinates to arrays
if condition
avg = math.avg(top, btm)
array.unshift(ob_top, top)
array.unshift(ob_btm, btm)
array.unshift(ob_avg, avg)
ob := ob_val
//Function to remove mitigated order blocks from coordinate arrays
remove_mitigated(ob_top, ob_btm, ob_left, ob_avg, target, bull)=>
mitigated = false
target_array = bull ? ob_btm : ob_top
for element in target_array
idx = array.indexof(target_array, element)
if (bull ? target < element : target > element)
mitigated := true
array.remove(ob_top, idx)
array.remove(ob_btm, idx)
array.remove(ob_avg, idx)
array.remove(ob_left, idx)
mitigated
//Function to set order blocks
set_order_blocks(ob_top, ob_btm, ob_left, ob_avg, ext_last, bg_css, border_css, lvl_css)=>
var ob_box = array.new_box(0)
var ob_lvl = array.new_line(0)
//Global elements
var os = 0
var target_bull = 0.
var target_bear = 0.
// Create non-repainting security function
rp_security(_symbol, _res, _src) =>
request.security(_symbol, _res, _src )
htfHigh = rp_security(syminfo.tickerid, res, high)
htfLow = rp_security(syminfo.tickerid, res, low)
// Main Indicator
// Functions
smoothrng(x, t, m) =>
wper = t * 2 - 1
avrng = ta.ema(math.abs(x - x ), t)
smoothrng = ta.ema(avrng, wper) * m
rngfilt(x, r) =>
rngfilt = x
rngfilt := x > nz(rngfilt ) ? x - r < nz(rngfilt ) ? nz(rngfilt ) : x - r : x + r > nz(rngfilt ) ? nz(rngfilt ) : x + r
percWidth(len, perc) => (ta.highest(len) - ta.lowest(len)) * perc / 100
securityNoRep(sym, res, src) => request.security(sym, res, src, barmerge.gaps_off, barmerge.lookahead_on)
swingPoints(prd) =>
pivHi = ta.pivothigh(prd, prd)
pivLo = ta.pivotlow (prd, prd)
last_pivHi = ta.valuewhen(pivHi, pivHi, 1)
last_pivLo = ta.valuewhen(pivLo, pivLo, 1)
hh = pivHi and pivHi > last_pivHi ? pivHi : na
lh = pivHi and pivHi < last_pivHi ? pivHi : na
hl = pivLo and pivLo > last_pivLo ? pivLo : na
ll = pivLo and pivLo < last_pivLo ? pivLo : na
f_chartTfInMinutes() =>
float _resInMinutes = timeframe.multiplier * (
timeframe.isseconds ? 1 :
timeframe.isminutes ? 1. :
timeframe.isdaily ? 60. * 24 :
timeframe.isweekly ? 60. * 24 * 7 :
timeframe.ismonthly ? 60. * 24 * 30.4375 : na)
f_kc(src, len, sensitivity) =>
basis = ta.sma(src, len)
span = ta.atr(len)
wavetrend(src, chlLen, avgLen) =>
esa = ta.ema(src, chlLen)
d = ta.ema(math.abs(src - esa), chlLen)
ci = (src - esa) / (0.015 * d)
wt1 = ta.ema(ci, avgLen)
wt2 = ta.sma(wt1, 3)
f_top_fractal(_src) => _src < _src and _src < _src and _src > _src and _src > _src
f_bot_fractal(_src) => _src > _src and _src > _src and _src < _src and _src < _src
top_fractal = f_top_fractal(src)
bot_fractal = f_bot_fractal(src)
f_fractalize (_src) => top_fractal ? 1 : bot_fractal ? -1 : 0
f_findDivs(src, topLimit, botLimit) =>
fractalTop = f_fractalize(src) > 0 and src >= topLimit ? src : na
fractalBot = f_fractalize(src) < 0 and src <= botLimit ? src : na
highPrev = ta.valuewhen(fractalTop, src , 0)
highPrice = ta.valuewhen(fractalTop, high , 0)
lowPrev = ta.valuewhen(fractalBot, src , 0)
lowPrice = ta.valuewhen(fractalBot, low , 0)
bearSignal = fractalTop and high > highPrice and src < highPrev
bullSignal = fractalBot and low < lowPrice and src > lowPrev
// Get user input
enableSR = input(false , "SR On/Off", group="SR")
colorSup = input(#00000000 , "Support Color", group="SR")
colorRes = input(#00000000 , "Resistance Color", group="SR")
strengthSR = input.int(2 , "S/R Strength", 1, group="SR")
lineStyle = input.string("Dotted", "Line Style", , group="SR")
lineWidth = input.int(2 , "S/R Line Width", 1, group="SR")
useZones = input(true , "Zones On/Off", group="SR")
useHLZones = input(true , "High Low Zones On/Off", group="SR")
zoneWidth = input.int(2 , "Zone Width %", 0,
tooltip = "it's calculated using % of the distance between highest/lowest in last 300 bars", group="SR")
expandSR = input(true , "Expand SR")
// Get components
rb = 10
prd = 284
ChannelW = 10
label_loc = 55
style = lineStyle == "Solid" ? line.style_solid :
lineStyle == "Dotted" ? line.style_dotted : line.style_dashed
ph = ta.pivothigh(rb, rb)
pl = ta.pivotlow (rb, rb)
sr_levels = array.new_float(21, na)
prdhighest = ta.highest(prd)
prdlowest = ta.lowest(prd)
cwidth = percWidth(prd, ChannelW)
zonePerc = percWidth(300, zoneWidth)
aas = array.new_bool(41, true)
u1 = 0.0, u1 := nz(u1 )
d1 = 0.0, d1 := nz(d1 )
highestph = 0.0, highestph := highestph
lowestpl = 0.0, lowestpl := lowestpl
var sr_levs = array.new_float(21, na)
label hlabel = na, label.delete(hlabel )
label llabel = na, label.delete(llabel )
var sr_lines = array.new_line(21, na)
var sr_linesH = array.new_line(21, na)
var sr_linesL = array.new_line(21, na)
var sr_linesF = array.new_linefill(21, na)
var sr_labels = array.new_label(21, na)
if (not na(ph) or not na(pl))
for x = 0 to array.size(sr_levels) - 1
array.set(sr_levels, x, na)
highestph := prdlowest
lowestpl := prdhighest
countpp = 0
for x = 0 to prd
if na(close )
break
if not na(ph ) or not na(pl )
highestph := math.max(highestph, nz(ph , prdlowest), nz(pl , prdlowest))
lowestpl := math.min(lowestpl, nz(ph , prdhighest), nz(pl , prdhighest))
countpp += 1
if countpp > 40
break
if array.get(aas, countpp)
upl = (not na(ph ) and (ph != 0) ? high : low ) + cwidth
dnl = (not na(ph ) and (ph != 0) ? high : low ) - cwidth
u1 := countpp == 1 ? upl : u1
d1 := countpp == 1 ? dnl : d1
tmp = array.new_bool(41, true)
cnt = 0
tpoint = 0
for xx = 0 to prd
if na(close )
break
if not na(ph ) or not na(pl )
chg = false
cnt += 1
if cnt > 40
break
if array.get(aas, cnt)
if not na(ph )
if high <= upl and high >= dnl
tpoint += 1
chg := true
if not na(pl )
if low <= upl and low >= dnl
tpoint += 1
chg := true
if chg and cnt < 41
array.set(tmp, cnt, false)
if tpoint >= strengthSR
for g = 0 to 40 by 1
if not array.get(tmp, g)
array.set(aas, g, false)
if (not na(ph ) and countpp < 21)
array.set(sr_levels, countpp, high )
if (not na(pl ) and countpp < 21)
array.set(sr_levels, countpp, low )
// Plot
var line highest_ = na, line.delete(highest_)
var line lowest_ = na, line.delete(lowest_)
var line highest_fill1 = na, line.delete(highest_fill1)
var line highest_fill2 = na, line.delete(highest_fill2)
var line lowest_fill1 = na, line.delete(lowest_fill1)
var line lowest_fill2 = na, line.delete(lowest_fill2)
hi_col = close >= highestph ? colorSup : colorRes
lo_col = close >= lowestpl ? colorSup : colorRes
if enableSR
highest_ := line.new(bar_index - 311, highestph, bar_index, highestph, xloc.bar_index, expandSR ? extend.both : extend.right, hi_col, style, lineWidth)
lowest_ := line.new(bar_index - 311, lowestpl , bar_index, lowestpl , xloc.bar_index, expandSR ? extend.both : extend.right, lo_col, style, lineWidth)
if useHLZones
highest_fill1 := line.new(bar_index - 311, highestph + zonePerc, bar_index, highestph + zonePerc, xloc.bar_index, expandSR ? extend.both : extend.right, na)
highest_fill2 := line.new(bar_index - 311, highestph - zonePerc, bar_index, highestph - zonePerc, xloc.bar_index, expandSR ? extend.both : extend.right, na)
lowest_fill1 := line.new(bar_index - 311, lowestpl + zonePerc , bar_index, lowestpl + zonePerc , xloc.bar_index, expandSR ? extend.both : extend.right, na)
lowest_fill2 := line.new(bar_index - 311, lowestpl - zonePerc , bar_index, lowestpl - zonePerc , xloc.bar_index, expandSR ? extend.both : extend.right, na)
linefill.new(highest_fill1, highest_fill2, hi_col)
linefill.new(lowest_fill1 , lowest_fill2 , lo_col)
if (not na(ph) or not na(pl))
for x = 0 to array.size(sr_lines) - 1
array.set(sr_levs, x, array.get(sr_levels, x))
for x = 0 to array.size(sr_lines) - 1
line.delete(array.get(sr_lines, x))
line.delete(array.get(sr_linesH, x))
line.delete(array.get(sr_linesL, x))
linefill.delete(array.get(sr_linesF, x))
if (not na(array.get(sr_levs, x)) and enableSR)
line_col = close >= array.get(sr_levs, x) ? colorSup : colorRes
array.set(sr_lines, x, line.new(bar_index - 355, array.get(sr_levs, x), bar_index, array.get(sr_levs, x), xloc.bar_index, expandSR ? extend.both : extend.right, line_col, style, lineWidth))
if useZones
array.set(sr_linesH, x, line.new(bar_index - 355, array.get(sr_levs, x) + zonePerc, bar_index, array.get(sr_levs, x) + zonePerc, xloc.bar_index, expandSR ? extend.both : extend.right, na))
array.set(sr_linesL, x, line.new(bar_index - 355, array.get(sr_levs, x) - zonePerc, bar_index, array.get(sr_levs, x) - zonePerc, xloc.bar_index, expandSR ? extend.both : extend.right, na))
array.set(sr_linesF, x, linefill.new(array.get(sr_linesH, x), array.get(sr_linesL, x), line_col))
for x = 0 to array.size(sr_labels) - 1
label.delete(array.get(sr_labels, x))
if (not na(array.get(sr_levs, x)) and enableSR)
lab_loc = close >= array.get(sr_levs, x) ? label.style_label_up : label.style_label_down
lab_col = close >= array.get(sr_levs, x) ? colorSup : colorRes
array.set(sr_labels, x, label.new(bar_index + label_loc, array.get(sr_levs, x), str.tostring(math.round_to_mintick(array.get(sr_levs, x))), color=lab_col , textcolor=#000000, style=lab_loc))
hlabel := enableSR ? label.new(bar_index + label_loc + math.round(math.sign(label_loc)) * 20, highestph, "High Level : " + str.tostring(highestph), color=hi_col, textcolor=#000000, style=label.style_label_down) : na
llabel := enableSR ? label.new(bar_index + label_loc + math.round(math.sign(label_loc)) * 20, lowestpl , "Low Level : " + str.tostring(lowestpl) , color=lo_col, textcolor=#000000, style=label.style_label_up ) : na
// Get components
rsi = ta.rsi(close, 28)
//rsiOb = rsi > 78 and rsi > ta.ema(rsi, 10)
//rsiOs = rsi < 27 and rsi < ta.ema(rsi, 10)
rsiOb = rsi > 65 and rsi > ta.ema(rsi, 10)
rsiOs = rsi < 35 and rsi < ta.ema(rsi, 10)
dHigh = securityNoRep(syminfo.tickerid, "D", high )
dLow = securityNoRep(syminfo.tickerid, "D", low )
dClose = securityNoRep(syminfo.tickerid, "D", close )
ema = ta.ema(close, 144)
emaBull = close > ema
equal_tf(res) => str.tonumber(res) == f_chartTfInMinutes() and not timeframe.isseconds
higher_tf(res) => str.tonumber(res) > f_chartTfInMinutes() or timeframe.isseconds
too_small_tf(res) => (timeframe.isweekly and res=="1") or (timeframe.ismonthly and str.tonumber(res) < 10)
securityNoRep1(sym, res, src) =>
bool bull_ = na
bull_ := equal_tf(res) ? src : bull_
bull_ := higher_tf(res) ? request.security(sym, res, src, barmerge.gaps_off, barmerge.lookahead_on) : bull_
bull_array = request.security_lower_tf(syminfo.tickerid, higher_tf(res) ? str.tostring(f_chartTfInMinutes()) + (timeframe.isseconds ? "S" : "") : too_small_tf(res) ? (timeframe.isweekly ? "3" : "10") : res, src)
if array.size(bull_array) > 1 and not equal_tf(res) and not higher_tf(res)
bull_ := array.pop(bull_array)
array.clear(bull_array)
bull_
// === BASE FUNCTIONS ===
// Returns MA input selection variant, default to SMA if blank or typo.
variant(type, src, len, offSig, offALMA) =>
v1 = ta.sma(src, len) // Simple
v2 = ta.ema(src, len) // Exponential
v3 = 2 * v2 - ta.ema(v2, len) // Double Exponential
v4 = 3 * (v2 - ta.ema(v2, len)) + ta.ema(ta.ema(v2, len), len) // Triple Exponential
v5 = ta.wma(src, len) // Weighted
v6 = ta.vwma(src, len) // Volume Weighted
v7 = 0.0
sma_1 = ta.sma(src, len) // Smoothed
v7 := na(v7 ) ? sma_1 : (v7 * (len - 1) + src) / len
v8 = ta.wma(2 * ta.wma(src, len / 2) - ta.wma(src, len), math.round(math.sqrt(len))) // Hull
v9 = ta.linreg(src, len, offSig) // Least Squares
v10 = ta.alma(src, len, offALMA, offSig) // Arnaud Legoux
v11 = ta.sma(v1, len) // Triangular (extreme smooth)
// SuperSmoother filter
// 2013 John F. Ehlers
a1 = math.exp(-1.414 * 3.14159 / len)
b1 = 2 * a1 * math.cos(1.414 * 3.14159 / len)
c2 = b1
c3 = -a1 * a1
c1 = 1 - c2 - c3
v12 = 0.0
v12 := c1 * (src + nz(src )) / 2 + c2 * nz(v12 ) + c3 * nz(v12 )
type == 'EMA' ? v2 : type == 'DEMA' ? v3 : type == 'TEMA' ? v4 : type == 'WMA' ? v5 : type == 'VWMA' ? v6 : type == 'SMMA' ? v7 : type == 'HullMA' ? v8 : type == 'LSMA' ? v9 : type == 'ALMA' ? v10 : type == 'TMA' ? v11 : type == 'SSMA' ? v12 : v1
// security wrapper for repeat calls
reso(exp, use, res) =>
security_1 = request.security(syminfo.tickerid, res, exp, gaps = barmerge.gaps_off, lookahead = barmerge.lookahead_on)
use ? security_1 : exp
// === /BASE FUNCTIONS ===
// === SERIES SETUP ===
closeSeries = variant(basisType, close , basisLen, offsetSigma, offsetALMA)
openSeries = variant(basisType, open , basisLen, offsetSigma, offsetALMA)
// === /SERIES ===
// Get Alternate resolution Series if selected.
closeSeriesAlt = reso(closeSeries, useRes, stratRes)
openSeriesAlt = reso(openSeries, useRes, stratRes)
//
lxTrigger = false
sxTrigger = false
leTrigger = ta.crossover (closeSeriesAlt, openSeriesAlt)
seTrigger = ta.crossunder(closeSeriesAlt, openSeriesAlt)
G_RISK = '■ ' + 'Risk Management'
//#region ———— <↓↓↓ G_RISK ↓↓↓> {
// ———————————
//Tooltip
T_LVL = '(%) Exit Level'
T_QTY = '(%) Adjust trade exit volume'
T_MSG = 'Paste JSON message for your bot'
//Webhook Message
O_LEMSG = 'Long Entry'
O_LXMSGSL = 'Long SL'
O_LXMSGTP1 = 'Long TP1'
O_LXMSGTP2 = 'Long TP2'
O_LXMSGTP3 = 'Long TP3'
O_LXMSG = 'Long Exit'
O_SEMSG = 'Short Entry'
O_SXMSGSL = 'Short SL'
O_SXMSGA = 'Short TP1'
O_SXMSGB = 'Short TP2'
O_SXMSGC = 'Short TP3'
O_SXMSGX = 'Short Exit'
// ——————————— | | | Line length guide |
i_lxLvlTP1 = input.float (0.2, 'Level TP1' , group = G_RISK,
tooltip = T_LVL)
i_lxQtyTP1 = input.float (80.0, 'Qty TP1' , group = G_RISK,
tooltip = T_QTY)
i_lxLvlTP2 = input.float (0.5, 'Level TP2' , group = G_RISK,
tooltip = T_LVL)
i_lxQtyTP2 = input.float (10.0, 'Qty TP2' , group = G_RISK,
tooltip = T_QTY)
i_lxLvlTP3 = input.float (7.0, 'Level TP3' , group = G_RISK,
tooltip = T_LVL)
i_lxQtyTP3 = input.float (2, 'Qty TP3' , group = G_RISK,
tooltip = T_QTY)
i_lxLvlSL = input.float (0.5, 'Stop Loss' , group = G_RISK,
tooltip = T_LVL)
i_sxLvlTP1 = i_lxLvlTP1
i_sxQtyTP1 = i_lxQtyTP1
i_sxLvlTP2 = i_lxLvlTP2
i_sxQtyTP2 = i_lxQtyTP2
i_sxLvlTP3 = i_lxLvlTP3
i_sxQtyTP3 = i_lxQtyTP3
i_sxLvlSL = i_lxLvlSL
G_MSG = '■ ' + 'Webhook Message'
i_leMsg = input.string (O_LEMSG ,'Long Entry' , group = G_MSG, tooltip = T_MSG)
i_lxMsgSL = input.string (O_LXMSGSL ,'Long SL' , group = G_MSG, tooltip = T_MSG)
i_lxMsgTP1 = input.string (O_LXMSGTP1,'Long TP1' , group = G_MSG, tooltip = T_MSG)
i_lxMsgTP2 = input.string (O_LXMSGTP2,'Long TP2' , group = G_MSG, tooltip = T_MSG)
i_lxMsgTP3 = input.string (O_LXMSGTP3,'Long TP3' , group = G_MSG, tooltip = T_MSG)
i_lxMsg = input.string (O_LXMSG ,'Long Exit' , group = G_MSG, tooltip = T_MSG)
i_seMsg = input.string (O_SEMSG ,'Short Entry' , group = G_MSG, tooltip = T_MSG)
i_sxMsgSL = input.string (O_SXMSGSL ,'Short SL' , group = G_MSG, tooltip = T_MSG)
i_sxMsgTP1 = input.string (O_SXMSGA ,'Short TP1' , group = G_MSG, tooltip = T_MSG)
i_sxMsgTP2 = input.string (O_SXMSGB ,'Short TP2' , group = G_MSG, tooltip = T_MSG)
i_sxMsgTP3 = input.string (O_SXMSGC ,'Short TP3' , group = G_MSG, tooltip = T_MSG)
i_sxMsg = input.string (O_SXMSGX ,'Short Exit' , group = G_MSG, tooltip = T_MSG)
i_src = close
G_DISPLAY = 'Display'
//
i_alertOn = input.bool (true, 'Alert Labels On/Off' , group = G_DISPLAY)
i_barColOn = input.bool (true, 'Bar Color On/Off' , group = G_DISPLAY)
// ———————————
// @function Calculate the Take Profit line, and the crossover or crossunder
f_tp(_condition, _conditionValue, _leTrigger, _seTrigger, _src, _lxLvlTP, _sxLvlTP)=>
var float _tpLine = 0.0
_topLvl = _src + (_src * (_lxLvlTP / 100))
_botLvl = _src - (_src * (_sxLvlTP / 100))
_tpLine := _condition != _conditionValue and _leTrigger ? _topLvl :
_condition != -_conditionValue and _seTrigger ? _botLvl :
nz(_tpLine )
// @function Similar to "ta.crossover" or "ta.crossunder"
f_cross(_scr1, _scr2, _over)=>
_cross = _over ? _scr1 > _scr2 and _scr1 < _scr2 :
_scr1 < _scr2 and _scr1 > _scr2
// ———————————
//
var float condition = 0.0
var float slLine = 0.0
var float entryLine = 0.0
//
entryLine := leTrigger and condition <= 0.0 ? close :
seTrigger and condition >= 0.0 ? close : nz(entryLine )
//
slTopLvl = i_src + (i_src * (i_lxLvlSL / 100))
slBotLvl = i_src - (i_src * (i_sxLvlSL / 100))
slLine := condition <= 0.0 and leTrigger ? slBotLvl :
condition >= 0.0 and seTrigger ? slTopLvl : nz(slLine )
slLong = f_cross(low, slLine, false)
slShort = f_cross(high, slLine, true )
//
= f_tp(condition, 1.2,leTrigger, seTrigger, i_src, i_lxLvlTP3, i_sxLvlTP3)
= f_tp(condition, 1.1,leTrigger, seTrigger, i_src, i_lxLvlTP2, i_sxLvlTP2)
= f_tp(condition, 1.0,leTrigger, seTrigger, i_src, i_lxLvlTP1, i_sxLvlTP1)
tp3Long = f_cross(high, tp3Line, true )
tp3Short = f_cross(low, tp3Line, false)
tp2Long = f_cross(high, tp2Line, true )
tp2Short = f_cross(low, tp2Line, false)
tp1Long = f_cross(high, tp1Line, true )
tp1Short = f_cross(low, tp1Line, false)
switch
leTrigger and condition <= 0.0 => condition := 1.0
seTrigger and condition >= 0.0 => condition := -1.0
tp3Long and condition == 1.2 => condition := 1.3
tp3Short and condition == -1.2 => condition := -1.3
tp2Long and condition == 1.1 => condition := 1.2
tp2Short and condition == -1.1 => condition := -1.2
tp1Long and condition == 1.0 => condition := 1.1
tp1Short and condition == -1.0 => condition := -1.1
slLong and condition >= 1.0 => condition := 0.0
slShort and condition <= -1.0 => condition := 0.0
lxTrigger and condition >= 1.0 => condition := 0.0
sxTrigger and condition <= -1.0 => condition := 0.0
longE = leTrigger and condition <= 0.0 and condition == 1.0
shortE = seTrigger and condition >= 0.0 and condition == -1.0
longX = lxTrigger and condition >= 1.0 and condition == 0.0
shortX = sxTrigger and condition <= -1.0 and condition == 0.0
longSL = slLong and condition >= 1.0 and condition == 0.0
shortSL = slShort and condition <= -1.0 and condition == 0.0
longTP3 = tp3Long and condition == 1.2 and condition == 1.3
shortTP3 = tp3Short and condition == -1.2 and condition == -1.3
longTP2 = tp2Long and condition == 1.1 and condition == 1.2
shortTP2 = tp2Short and condition == -1.1 and condition == -1.2
longTP1 = tp1Long and condition == 1.0 and condition == 1.1
shortTP1 = tp1Short and condition == -1.0 and condition == -1.1
// ——————————— {
//
if strategy.position_size <= 0 and longE and barstate.isconfirmed
strategy.entry(
'Long',
strategy.long,
alert_message = i_leMsg,
comment = 'LE')
if strategy.position_size > 0 and condition == 1.0
strategy.exit(
id = 'LXTP1',
from_entry = 'Long',
qty_percent = i_lxQtyTP1,
limit = tp1Line,
stop = slLine,
comment_profit = 'LXTP1',
comment_loss = 'SL',
alert_profit = i_lxMsgTP1,
alert_loss = i_lxMsgSL)
if strategy.position_size > 0 and condition == 1.1
strategy.exit(
id = 'LXTP2',
from_entry = 'Long',
qty_percent = i_lxQtyTP2,
limit = tp2Line,
stop = slLine,
comment_profit = 'LXTP2',
comment_loss = 'SL',
alert_profit = i_lxMsgTP2,
alert_loss = i_lxMsgSL)
if strategy.position_size > 0 and condition == 1.2
strategy.exit(
id = 'LXTP3',
from_entry = 'Long',
qty_percent = i_lxQtyTP3,
limit = tp3Line,
stop = slLine,
comment_profit = 'LXTP3',
comment_loss = 'SL',
alert_profit = i_lxMsgTP3,
alert_loss = i_lxMsgSL)
if longX
strategy.close(
'Long',
alert_message = i_lxMsg,
comment = 'LX')
//
if strategy.position_size >= 0 and shortE and barstate.isconfirmed
strategy.entry(
'Short',
strategy.short,
alert_message = i_leMsg,
comment = 'SE')
if strategy.position_size < 0 and condition == -1.0
strategy.exit(
id = 'SXTP1',
from_entry = 'Short',
qty_percent = i_sxQtyTP1,
limit = tp1Line,
stop = slLine,
comment_profit = 'SXTP1',
comment_loss = 'SL',
alert_profit = i_sxMsgTP1,
alert_loss = i_sxMsgSL)
if strategy.position_size < 0 and condition == -1.1
strategy.exit(
id = 'SXTP2',
from_entry = 'Short',
qty_percent = i_sxQtyTP2,
limit = tp2Line,
stop = slLine,
comment_profit = 'SXTP2',
comment_loss = 'SL',
alert_profit = i_sxMsgTP2,
alert_loss = i_sxMsgSL)
if strategy.position_size < 0 and condition == -1.2
strategy.exit(
id = 'SXTP3',
from_entry = 'Short',
qty_percent = i_sxQtyTP3,
limit = tp3Line,
stop = slLine,
comment_profit = 'SXTP3',
comment_loss = 'SL',
alert_profit = i_sxMsgTP3,
alert_loss = i_sxMsgSL)
if shortX
strategy.close(
'Short',
alert_message = i_sxMsg,
comment = 'SX')
// ———————————
c_tp = leTrigger or seTrigger ? na :
condition == 0.0 ? na : color.green
c_entry = leTrigger or seTrigger ? na :
condition == 0.0 ? na : color.blue
c_sl = leTrigger or seTrigger ? na :
condition == 0.0 ? na : color.red
p_tp1Line = plot (
condition == 1.0 or
condition == -1.0 ? tp1Line : na,
title = "TP Line 1",
color = c_tp,
linewidth = 1,
style = plot.style_linebr)
p_tp2Line = plot (
condition == 1.0 or
condition == -1.0 or
condition == 1.1 or
condition == -1.1 ? tp2Line : na,
title = "TP Line 2",
color = c_tp,
linewidth = 1,
style = plot.style_linebr)
p_tp3Line = plot (
condition == 1.0 or
condition == -1.0 or
condition == 1.1 or
condition == -1.1 or
condition == 1.2 or
condition == -1.2 ? tp3Line : na,
title = "TP Line 3",
color = c_tp,
linewidth = 1,
style = plot.style_linebr)
p_entryLine = plot (
condition >= 1.0 or
condition <= -1.0 ? entryLine : na,
title = "Entry Line",
color = c_entry,
linewidth = 1,
style = plot.style_linebr)
p_slLine = plot (
condition == 1.0 or
condition == -1.0 or
condition == 1.1 or
condition == -1.1 or
condition == 1.2 or
condition == -1.2 ? slLine : na,
title = "SL Line",
color = c_sl,
linewidth = 1,
style = plot.style_linebr)
fill(
p_tp3Line, p_entryLine,
color = leTrigger or seTrigger ? na :color.new(color.green, 90))
fill(
p_entryLine, p_slLine,
color = leTrigger or seTrigger ? na :color.new(color.red, 90))
//
plotshape(
i_alertOn and longE,
title = 'Long',
text = 'Long',
textcolor = color.white,
color = color.green,
style = shape.labelup,
size = size.tiny,
location = location.belowbar)
plotshape(
i_alertOn and shortE,
title = 'Short',
text = 'Short',
textcolor = color.white,
color = color.red,
style = shape.labeldown,
size = size.tiny,
location = location.abovebar)
plotshape(
i_alertOn and (longX or shortX) ? close : na,
title = 'Close',
text = 'Close',
textcolor = color.white,
color = color.gray,
style = shape.labelup,
size = size.tiny,
location = location.absolute)
l_tp = i_alertOn and (longTP1 or shortTP1) ? close : na
plotshape(
l_tp,
title = "TP1 Cross",
text = "TP1",
textcolor = color.white,
color = color.olive,
style = shape.labelup,
size = size.tiny,
location = location.absolute)
plotshape(
i_alertOn and (longTP2 or shortTP2) ? close : na,
title = "TP2 Cross",
text = "TP2",
textcolor = color.white,
color = color.olive,
style = shape.labelup,
size = size.tiny,
location = location.absolute)
plotshape(
i_alertOn and (longTP3 or shortTP3) ? close : na,
title = "TP3 Cross",
text = "TP3",
textcolor = color.white,
color = color.olive,
style = shape.labelup,
size = size.tiny,
location = location.absolute)
plotshape(
i_alertOn and (longSL or shortSL) ? close : na,
title = "SL Cross",
text = "SL",
textcolor = color.white,
color = color.maroon,
style = shape.labelup,
size = size.tiny,
location = location.absolute)
//
plot(
na,
title = "─── ───",
editable = false,
display = display.data_window)
plot(
condition,
title = "condition",
editable = false,
display = display.data_window)
plot(
strategy.position_size * 100,
title = ".position_size",
editable = false,
display = display.data_window)
//#endregion }
// ——————————— <↑↑↑ G_RISK ↑↑↑>
//#region ———— <↓↓↓ G_SCRIPT02 ↓↓↓> {
// @function Queues a new element in an array and de-queues its first element.
f_qDq(_array, _val) =>
array.push(_array, _val)
_return = array.shift(_array)
_return
var line a_slLine = array.new_line(1)
var line a_entryLine = array.new_line(1)
var line a_tp3Line = array.new_line(1)
var line a_tp2Line = array.new_line(1)
var line a_tp1Line = array.new_line(1)
var label a_slLabel = array.new_label(1)
var label a_tp3label = array.new_label(1)
var label a_tp2label = array.new_label(1)
var label a_tp1label = array.new_label(1)
var label a_entryLabel = array.new_label(1)
newEntry = longE or shortE
entryIndex = 1
entryIndex := newEntry ? bar_index : nz(entryIndex )
lasTrade = bar_index >= entryIndex
l_right = 10
line.delete(
f_qDq(a_slLine,
line.new(
entryIndex,
slLine,
last_bar_index + l_right,
slLine,
style = line.style_solid,
color = c_sl)))
line.delete(
f_qDq(a_entryLine,
line.new(
entryIndex,
entryLine,
last_bar_index + l_right,
entryLine,
style = line.style_solid,
color = color.blue)))
line.delete(
f_qDq(a_tp3Line,
line.new(
entryIndex,
tp3Line,
last_bar_index + l_right,
tp3Line,
style = line.style_solid,
color = c_tp)))
line.delete(
f_qDq(a_tp2Line,
line.new(
entryIndex,
tp2Line,
last_bar_index + l_right,
tp2Line,
style = line.style_solid,
color = c_tp)))
line.delete(
f_qDq(a_tp1Line,
line.new(
entryIndex,
tp1Line,
last_bar_index + l_right,
tp1Line,
style = line.style_solid,
color = c_tp)))
label.delete(
f_qDq(a_slLabel,
label.new(
last_bar_index + l_right,
slLine,
'SL: ' + str.tostring(slLine, '##.###'),
style = label.style_label_left,
textcolor = color.white,
color = c_sl)))
label.delete(
f_qDq(a_entryLabel,
label.new(
last_bar_index + l_right,
entryLine,
'Entry: ' + str.tostring(entryLine, '##.###'),
style = label.style_label_left,
textcolor = color.white,
color = color.blue)))
label.delete(
f_qDq(a_tp3label,
label.new(
last_bar_index + l_right,
tp3Line,
'TP3: ' + str.tostring(tp3Line, '##.###'),
style = label.style_label_left,
textcolor = color.white,
color = c_tp)))
label.delete(
f_qDq(a_tp2label,
label.new(
last_bar_index + l_right,
tp2Line,
'TP2: ' + str.tostring(tp2Line, '##.###'),
style = label.style_label_left,
textcolor = color.white,
color = c_tp)))
label.delete(
f_qDq(a_tp1label,
label.new(
last_bar_index + l_right,
tp1Line,
'TP1: ' + str.tostring(tp1Line, '##.###'),
style = label.style_label_left,
textcolor = color.white,
color = c_tp)))
// ———————————
//
if longE or shortE or longX or shortX
alert(message = 'Any Alert', freq = alert.freq_once_per_bar_close)
if longE
alert(message = 'Long Entry', freq = alert.freq_once_per_bar_close)
if shortE
alert(message = 'Short Entry', freq = alert.freq_once_per_bar_close)
if longX
alert(message = 'Long Exit', freq = alert.freq_once_per_bar_close)
if shortX
alert(message = 'Short Exit', freq = alert.freq_once_per_bar_close)
//#endregion }
// ——————————— <↑↑↑ G_SCRIPT03 ↑↑↑>

Volume Profile VisionVolume Profile Vision - Complete Description
Overview
Volume Profile Vision (VPV) is an advanced volume profile indicator that visualizes where trading activity has occurred at different price levels over a specified time period. Unlike traditional volume indicators that show volume over time, this indicator displays volume distribution across price levels, helping traders identify key support/resistance zones, fair value areas, and potential reversal points.
What Makes This Indicator Original
Volume Profile Vision introduces several unique features not found in standard volume profile tools:
Dual-Direction Histogram Display:
Unlike conventional volume profiles that only show bars extending in one direction, VPV displays volume bars extending both left (into historical candles) and right (as a traditional histogram). This bi-directional approach allows traders to see exactly where historical price action intersected with high-volume nodes.
Real-Time Candle Highlighting: The indicator dynamically highlights volume bars that intersect with the current candle's price range, making it immediately obvious which volume levels are currently in play.
Four Professional Color Schemes: Each color scheme uses distinct gradient algorithms and visual encoding systems:
Traffic Light: Uses red (POC), green (VA boundaries), yellow (HVN), with grayscale gradients outside the value area
Aurora Glass: Modern cyan-to-magenta gradient with hot magenta POC highlighting
Obsidian Precision: Professional dark theme with white POC and electric cyan accents
Black Ice: Monochromatic cyan family with graduated intensity
Adaptive Transparency System: Automatically adjusts bar transparency based on position relative to value area, with special handling for each color scheme to maintain visual clarity.
Core Concepts & Calculations
Volume Distribution Analysis
The indicator divides the visible price range into user-defined price levels (default: 80 levels) and calculates the total volume traded at each level by:
Scanning back through the specified lookback period (customizable or visible range)
For each historical bar, determining which price levels the bar's high/low range intersects
Accumulating volume for each intersected price level
Optionally filtering by bullish/bearish volume only
Point of Control (POC)
The POC is the price level with the highest traded volume during the analyzed period. This represents the "fairest" price where most traders agreed on value. The indicator marks this with distinct coloring (red in Traffic Light, magenta in Aurora Glass, white in Obsidian Precision, cyan in Black Ice).
Trading Significance: POC acts as a strong magnet for price - markets tend to return to fair value. When price is away from POC, traders watch for:
Mean reversion opportunities when price is far from POC
Rejection signals when price tests POC from above/below
Breakout confirmation when price breaks through and holds beyond POC
Value Area (VA)
The Value Area encompasses the price range where a specified percentage (default: 68%) of all volume traded. This represents the range of "accepted value" by market participants.
Calculation Method:
Start at the POC (highest volume level)
Expand upward and downward, adding adjacent price levels
Always add the level with higher volume next
Continue until accumulated volume reaches the VA percentage threshold
Value Area High (VAH): Upper boundary of accepted value - acts as resistance
Value Area Low (VAL): Lower boundary of accepted value - acts as support
Trading Significance:
Price spending time inside VA indicates market equilibrium
Breakouts above VAH suggest bullish momentum shift
Breakdowns below VAL suggest bearish momentum shift
Returns to VA boundaries often provide high-probability entry zones
High Volume Nodes (HVN)
Price levels with volume exceeding a threshold percentage (default: 80%) of POC volume. These represent areas of strong agreement and consolidation.
Trading Significance:
HVNs act as strong support/resistance zones
Price tends to consolidate at HVNs before making directional moves
Breaking through an HVN often signals strong momentum
Low Volume Nodes (LVN)
Price levels within the Value Area with volume ≤30% of POC volume. These are zones price moved through quickly with minimal consolidation.
Trading Significance:
LVNs represent areas of rejection - price finds little acceptance
Price tends to move rapidly through LVN zones
Useful for setting stop-losses (below LVN for longs, above for shorts)
Can identify potential gaps or "air pockets" in the market structure
Grayscale POC Detection
A secondary POC detection system identifies the highest volume level outside the Value Area (with a 2-level buffer to avoid confusion). This helps identify significant volume accumulation zones that exist beyond the main value area.
How to Use This Indicator
Setup
Choose Lookback Period:
Enable "Use Visible Range" to analyze only what's on your chart
Or set "Fixed Range Lookback Depth" (default: 200 bars) for consistent analysis
Adjust Profile Resolution:
"Number of Price Levels" (default: 80) - higher = more granular analysis, lower = broader zones
Select Color Scheme:
Traffic Light: Best for clear POC/VA/HVN identification
Aurora Glass: Modern aesthetic for dark charts
Obsidian Precision: Professional trader preference
Black Ice: Minimalist single-color family
Visual Customization
Left Extension: How far back the left-side histogram extends into historical candles (default: 490 bars)
Right Extension: Width of the traditional histogram bars on the right (default: 50 bars)
Right Margin: Space between current price bar and histogram (default: 0 for flush alignment)
Left Profile Gap: Space between left-side histogram and candles (default: 0)
Trading Strategies
Strategy 1: Value Area Mean Reversion
Wait for price to move outside the Value Area (above VAH or below VAL)
Look for rejection signals (wicks, bearish/bullish candles)
Enter trades toward the POC
Take profits as price returns to POC or opposite VA boundary
Strategy 2: Breakout Confirmation
Identify when price is consolidating within the Value Area
Wait for a strong close above VAH (bullish) or below VAL (bearish)
Enter on the breakout or on first pullback to the VA boundary
Target previous HVNs or swing highs/lows outside the VA
Strategy 3: POC Support/Resistance
Watch for price approaching the POC level
If approaching from below, look for bullish reversal patterns at POC (support)
If approaching from above, look for bearish reversal patterns at POC (resistance)
Trade in the direction of the bounce with stops beyond the POC
Strategy 4: LVN Fast Movement Zones
Identify LVN zones within the Value Area (marked with "LVN" label)
When price enters an LVN, expect rapid movement through the zone
Avoid entering trades within LVNs
Use LVNs as confirmation of directional momentum
Alert System
The indicator includes 7 customizable alert conditions:
POC Touch: Alerts when price comes within 0.5 ATR of POC
VAH/VAL Touch: Alerts at Value Area boundaries
VA Breakout: Alerts on breakouts above VAH or below VAL
HVN Touch: Alerts when price contacts High Volume Nodes
LVN Entry: Alerts when entering Low Volume zones
POC Shift: Alerts when POC moves to a new price level
Reading the Profile
Price Labels (shown on the right side):
POC: Point of Control - highest volume price level
VAH: Value Area High - upper boundary of accepted value
VAL: Value Area Low - lower boundary of accepted value
LVN: Low Volume Node - expect fast movement through this zone
Color Intensity Interpretation:
Brighter colors = higher volume concentration
Dimmer colors = lower volume
Abrupt color changes = transition between volume zones
Gaps in the histogram = price levels with no trading activity
Technical Details
Volume Accumulation Logic:
For each bar in lookback period:
For each price level:
If bar's high/low range intersects price level:
Add bar's volume to that price level's total
Gradient Algorithm:
Traffic Light: Dual-range piecewise gradient (0-50% and 50-100% volume intensity)
Aurora Glass: Linear cyan-to-magenta interpolation
Obsidian Precision: Dark blue gradient with cyan highlights
Black Ice: Three-stage cyan intensity progression
Real-Time Updates:
The profile recalculates on every bar, including real-time tick data, ensuring the volume distribution always reflects current market structure.
Best Practices
Timeframe Selection: Use higher timeframes (4H, Daily) for swing trading, lower timeframes (5min, 15min) for day trading
Combine with Price Action: Volume profile shows WHERE, price action shows WHEN
Multiple Timeframe Analysis: Check daily VP for major levels, then drill down to intraday for entries
Volume Type Selection: Use "Bullish" volume in uptrends, "Bearish" in downtrends, or "Both" for complete picture
Adjust VA Percentage: 68% (default) captures one standard deviation; try 70% for tighter or 60% for broader value areas
Performance Notes
Maximum bars back: 5000 (handles deep historical analysis)
Maximum boxes: 500 (handles complex profiles)
Optimized calculation: Only recalculates on last bar for efficiency
Real-time capable: Updates as new ticks arrive

Quasimodo (QML) Pattern [Kodexius]Quasimodo (QML) Pattern is a market structure indicator that automatically detects Bullish and Bearish Quasimodo formations using confirmed swing pivots, then visualizes the full structure directly on the chart. The script focuses on the classic liquidity-grab narrative of the QML: a sweep beyond a prior swing (the Head) followed by a decisive market structure break (MSB), leaving behind a clearly defined reaction zone between the Left Shoulder and the Head.
Detection is built on pivot highs and lows, so patterns are evaluated only after swing points are validated. Once a valid 4 pivot sequence is identified, the indicator draws the pattern legs, highlights the internal triangle area to emphasize the grab, marks the MSB leg, and projects a QML zone that can be used as a potential area of interest for retests.
This tool is designed for traders who work with structure, liquidity concepts, and reversal/continuation triggers, and who want a clean, repeatable QML visualization without manually marking swings.
🔹 Features
🔸 Confirmed Pivot Based Structure Mapping
The script uses classic built-in pivot logic to detect swing highs and swing lows.
🔸 Automatic Bullish and Bearish QML Detection
The indicator evaluates the most recent 4 pivots and checks for a valid alternating sequence (High-Low-High-Low or Low-High-Low-High). When the sequence matches QML requirements, the script classifies the setup as bullish or bearish:
Bullish logic (structure reversal up):
- Left Shoulder is a pivot Low
- Head is a lower Low than the Left Shoulder (liquidity sweep)
- MSB pivot exceeds the Reaction pivot
Bearish logic (structure reversal down):
- Left Shoulder is a pivot High
- Head is a higher High than the Left Shoulder (liquidity sweep)
- MSB pivot breaks below the Reaction pivot
🔸 Full Pattern Visualization (Legs + Highlighted Core)
When a pattern triggers, the script draws:
Three main legs: Left Shoulder to Reaction, Reaction to Head, Head to MSB
A shaded triangular highlight over the internal structure to make the liquidity-grab shape easy to spot at a glance
🔸 QML Zone Projection
A QML Zone box is drawn using the price range defined between the Left Shoulder and the Head, then extended to the right to remain visible as price develops. This zone is intended to act as a practical reference area for potential retests and reaction planning after MSB confirmation.
🔸 MSB Emphasis
A dotted MSB line is drawn between the Reaction point and the MSB point to visually emphasize the confirmation leg that completes the pattern logic.
🔸 Clean Point Tagging and Directional Labeling
Key points are labeled directly on the chart:
- “LS” at the Left Shoulder
- “Head” at the sweep pivot
- “MSB” at the break pivot
A directional label (“Bullish QML” or “Bearish QML”) is also printed to quickly identify the detected bias.
🔸 Configurable Visual Style
All main visual components are user configurable:
- Bullish and bearish colors
- Line width
- Label size
🔸 Efficient Update Logic
Pattern checks are only performed when a new pivot is confirmed, avoiding unnecessary repeated calculations on every bar. The most recent pattern’s projected elements (zone and label positioning) are updated as new bars print to keep the latest setup readable.
🔹 Calculations
This section summarizes the core logic used for detection and plotting.
1. Pivot Detection (Swing Highs and Lows)
The script relies on confirmed pivots using the user inputs:
Left Bars: how many bars must exist to the left of the pivot
Right Bars: how many bars must exist to the right to confirm it
float ph = ta.pivothigh(leftLen, rightLen)
float pl = ta.pivotlow(leftLen, rightLen)
When a pivot is confirmed, its true bar index is the pivot bar, not the current bar, so the script stores:
bar_index
2. Pivot Storage and History Window
Each pivot is stored as a structured object containing:
- price
- index
- isHigh (true for pivot high, false for pivot low)
A rolling history is maintained (up to 50 pivots) to keep processing stable and memory usage controlled.
3. Sequence Validation (Alternation Check)
The pattern evaluation always uses the latest 4 pivots:
p0: Left Shoulder candidate
p1: Reaction candidate
p2: Head candidate
p3: MSB candidate
Before checking bullish/bearish rules, the script enforces alternating pivot types:
bool correctSequence =
(p0.isHigh != p1.isHigh) and
(p1.isHigh != p2.isHigh) and
(p2.isHigh != p3.isHigh)
This prevents invalid structures like consecutive highs or consecutive lows from being interpreted as QML.
4. Bullish QML Conditions
A bullish QML is evaluated when the Left Shoulder is a Low:
Head must be lower than Left Shoulder (sweep)
MSB must be higher than Reaction (break)
if not p0.isHigh
if p2.price < p0.price and p3.price > p1.price
// Bullish QML confirmed
Interpretation:
p2 < p0 represents the liquidity grab below the prior swing low
p3 > p1 represents the market structure break above the reaction high
5. Bearish QML Conditions
A bearish QML is evaluated when the Left Shoulder is a High:
Head must be higher than Left Shoulder (sweep)
MSB must be lower than Reaction (break)
if p0.isHigh
if p2.price > p0.price and p3.price < p1.price
// Bearish QML confirmed
Interpretation:
p2 > p0 represents the liquidity grab above the prior swing high
p3 < p1 represents the market structure break below the reaction low
6. Drawing Logic (Structure, Highlight, Zone, Labels)
When confirmed, the script draws:
Three connecting legs (LS to Reaction, Reaction to Head, Head to MSB)
A shaded triangle using a transparent “ghost” line to enable filling
A dotted MSB emphasis line between Reaction and MSB
A QML Zone box spanning the LS to Head price range and projecting to the right
Point labels: LS, Head, MSB
A direction label: “Bullish QML” or “Bearish QML”
7. Latest Pattern Extension
To keep the newest setup readable, the script updates the most recently detected pattern by extending its projected elements as new bars print:
QML zone right edge is pushed forward
The main label x position is pushed forward
This keeps the last identified QML zone visible as price evolves, without having to redraw historical patterns on every bar.

LiquidityThe liquidity swings indicator highlights swing areas with existent trading activity. The number of times price revisited a swing area is highlighted by a zone delimiting the swing areas. Additionally, the accumulated volume within swing areas is highlighted by labels on the chart. An option to filter out swing areas with volume/counts not reaching a user-set threshold is also included.
This indicator by its very nature is not real-time and is meant for descriptive analysis alongside other components of the script. This is normal behavior for scripts detecting pivots as a part of a system and it is important you are aware the pivot labels are not designed to be traded in real-time themselves.
🔶 USAGE
The indicator can be used to highlight significant swing areas, these can be accumulation/distribution zones on lower timeframes and might play a role as future support or resistance.
Swing levels are also highlighted, when a swing level is broken it is displayed as a dashed line. A broken swing high is a bullish indication, while a broken swing low is a bearish indication.
Filtering swing areas by volume allows to only show significant swing areas with an higher degree of liquidity. These swing areas can be wider, highlighting higher volatility, or might have been visited by the price more frequently.
🔶 SETTINGS
Pivot Lookback : Lookback period used for the calculation of pivot points.
Swing Area : Determine how the swing area is calculated, "Wick Extremity" will use the range from price high to the maximum between price close/open in case of a swing high, and the range from price low to the minimum between price close/open in case of a swing low. "Full Range" will use the full candle range as swing area.
Intrabar Precision : Use intrabar data to calculate the accumulated volume within a swing area, this allows obtaining more precise results.
Filter Areas By : Determine how swing areas are filtered out, "Count" will filter out swing areas where price visited the area a number of time inferior to the user set threshold. "Volume" will filter out swing areas where the accumulated volume within the area is inferior to the user set threshold.
🔹 Style
Swing High : Show swing highs.
Swing Low : Show swing lows.
Label Size : Size of the labels on the chart.

RSI Divergence (Regular + Hidden, @darshakssc)This indicator detects regular and hidden divergence between price and RSI, using confirmed swing highs and swing lows (pivots) on both series. It is designed as a visual analysis tool, not as a signal generator or trading system.
The goal is to highlight moments where price action and RSI momentum move in different directions, which some traders study as potential early warnings of trend exhaustion or trend continuation. All divergence signals are only drawn after a pivot is fully confirmed, helping to avoid repainting.
The script supports four divergence types:
Regular Bullish Divergence
Regular Bearish Divergence
Hidden Bullish Divergence
Hidden Bearish Divergence
Each type is drawn with a different color and labeled clearly on the chart.
Core Concepts Used
1. RSI (Relative Strength Index)
The script uses standard RSI, calculated on a configurable input source (default: close) and length (default: 14).
RSI is treated purely as a momentum oscillator – the script does not enforce oversold/overbought interpretations.
2. Pivots / Swings
The indicator defines swing highs and swing lows using ta.pivothigh() and ta.pivotlow():
A swing high forms when a bar’s high is higher than a specified number of bars to the left and to the right.
A swing low forms when a bar’s low is lower than a specified number of bars to the left and to the right.
The same pivot logic is applied to both price and RSI.
Because pivots require “right side” bars to form, the indicator:
Waits for the full pivot to be confirmed (no forward-looking referencing beyond the rightBars parameter).
Only then considers that pivot for divergence detection.
This helps prevent repainting of divergence signals.
How Divergence Is Detected
The script always uses the two most recent confirmed pivots for both price and RSI. It tracks:
Last two swing lows in price and RSI
Last two swing highs in price and RSI
Their pivot bar indexes and values
A basic minimum distance filter between the pivots (in bars) is also applied to reduce noise.
1. Regular Bullish Divergence
Condition:
Price makes a lower low (LL) between the last two lows
RSI makes a higher low (HL) over the same two pivot lows
The RSI difference between the two lows is greater than or equal to the user-defined minimum (Min RSI Difference)
The two low pivots are separated by at least Min Bars Between Swings
Interpretation:
Some traders view this as bearish momentum weakening while price prints a new low. The script only marks this structure; it does not assume any outcome.
On the chart:
Drawn between the previous and current price swing lows
Labeled: “Regular Bullish”
Color: Green (by default in the script)
2. Regular Bearish Divergence
Condition:
Price makes a higher high (HH) between the last two highs
RSI makes a lower high (LH) over the same two pivot highs
RSI difference exceeds Min RSI Difference
Pivots are separated by at least Min Bars Between Swings
Interpretation:
Some traders see this as bullish momentum weakening while price prints a new high. Again, the indicator simply highlights this divergence.
On the chart:
Drawn between the previous and current price swing highs
Labeled: “Regular Bearish”
Color: Red
3. Hidden Bullish Divergence
Condition:
Price makes a higher low (HL) between the last two lows
RSI makes a lower low (LL) over the same two lows
RSI difference exceeds Min RSI Difference
Pivots meet the minimum distance requirement
Interpretation:
Some traders interpret hidden bullish divergence as a potential trend continuation signal within an existing uptrend. The indicator does not classify trends; it just tags the pattern when price and RSI pivots meet the conditions.
On the chart:
Drawn between the previous and current price swing lows
Labeled: “Hidden Bullish”
Color: Teal
4. Hidden Bearish Divergence
Condition:
Price makes a lower high (LH) between the last two highs
RSI makes a higher high (HH) over those highs
RSI difference exceeds Min RSI Difference
Pivots meet the minimum distance filter
Interpretation:
Some traders associate hidden bearish divergence with potential downtrend continuation, but again, this script only visualizes the structure.
On the chart:
Drawn between the previous and current price swing highs
Labeled: “Hidden Bearish”
Color: Orange
Inputs and Settings
1. RSI Settings
RSI Source – Price source for RSI (default: close).
RSI Length – Period for RSI calculation (default: 14).
These control the responsiveness of the RSI. Shorter lengths may show more frequent divergence; longer lengths smooth the signal.
2. Swing / Pivot Settings
Left Swing Bars (leftBars)
Right Swing Bars (rightBars)
These define how strict the pivot detection is:
Higher values → fewer, more significant swings
Lower values → more swings, more signals
Because the script uses ta.pivothigh / ta.pivotlow, a pivot is only confirmed once rightBars candles have closed after the candidate bar. This is an intentional design to reduce repainting and make pivots stable.
3. Divergence Filters
Min Bars Between Swings (Min Bars Between Swings)
Requires a minimum bar distance between the two pivots used to form divergence.
Helps avoid clutter from pivots that are too close to each other.
Min RSI Difference (Min RSI Difference)
Requires a minimum absolute difference between RSI values at the two pivots.
Filters out very minor changes in RSI that may not be meaningful.
4. Visibility Toggles
Show Regular Divergence
Show Hidden Divergence
You can choose to display:
Both regular and hidden divergence, or
Only regular divergence, or
Only hidden divergence
This is useful if you prefer to focus on one type of structure.
5. Alerts
Enable Alerts
When enabled, the script exposes four alert conditions:
Regular Bullish Divergence Confirmed
Regular Bearish Divergence Confirmed
Hidden Bullish Divergence Confirmed
Hidden Bearish Divergence Confirmed
Each alert fires after the corresponding divergence has been fully confirmed based on the pivot and bar confirmation logic. The script does not issue rapid or intrabar signals; it uses confirmed historical conditions.
You can set these in the TradingView Alerts dialog by choosing this indicator and selecting the desired condition.
Visual Elements
On the main price chart, the indicator:
Draws a line between the two price pivots involved in the divergence.
Adds a small label at the latest pivot, describing the divergence type.
Colors are used to differentiate divergence categories (Green/Red/Teal/Orange).
This makes it easy to visually scan the chart for zones where price and RSI have diverged.
What to Look For (Analytical Use)
This indicator is intended as a visual helper, especially when:
You want to quickly see where price made new highs or lows while RSI did not confirm them in the same way.
You are studying momentum exhaustion, shifts, or continuation using RSI divergence as one of many tools.
You want to compare divergence occurrences across different timeframes or instruments.
Important:
The indicator does not tell you when to enter or exit trades.
It does not rank or validate the “quality” of a divergence.
Divergence can persist or fail; it is not a guarantee of reversal or continuation.
Many traders combine divergence analysis with:
Higher timeframe context
Trend filters (moving averages, structure)
Support/resistance zones or liquidity areas
Volume, structure breaks, or other confirmations
Disclaimer
This script is provided for educational and analytical purposes only.
It does not constitute financial advice, trading advice, or investment recommendations.
No part of this indicator is intended to suggest, encourage, or guarantee any specific trading outcome.
Users are solely responsible for their own decisions and risk management.

Price Action Smart Money Concepts [BigBeluga]THE SMART MONEY CONCEPTS Toolkit
The Smart Money Concepts [ BigBeluga ] is a comprehensive toolkit built around the principles of "smart money" behavior, which refers to the actions and strategies of institutional investors.
The Smart Money Concepts Toolkit brings together a suite of advanced indicators that are all interconnected and built around a unified concept: understanding and trading like institutional investors, or "smart money." These indicators are not just randomly chosen tools; they are features of a single overarching framework, which is why having them all in one place creates such a powerful system.
This all-in-one toolkit provides the user with a unique experience by automating most of the basic and advanced concepts on the chart, saving them time and improving their trading ideas.
Real-time market structure analysis simplifies complex trends by pinpointing key support, resistance, and breakout levels.
Advanced order block analysis leverages detailed volume data to pinpoint high-demand zones, revealing internal market sentiment and predicting potential reversals. This analysis utilizes bid/ask zones to provide supply/demand insights, empowering informed trading decisions.
Imbalance Concepts (FVG and Breakers) allows traders to identify potential market weaknesses and areas where price might be attracted to fill the gap, creating opportunities for entry and exit.
Swing failure patterns help traders identify potential entry points and rejection zones based on price swings.
Liquidity Concepts, our advanced liquidity algorithm, pinpoints high-impact events, allowing you to predict market shifts, strong price reactions, and potential stop-loss hunting zones. This gives traders an edge to make informed trading decisions based on liquidity dynamics.
🔵 FEATURES
The indicator has quite a lot of features that are provided below:
Swing market structure
Internal market structure
Mapping structure
Adjustable market structure
Strong/Weak H&L
Sweep
Volumetric Order block / Breakers
Fair Value Gaps / Breakers (multi-timeframe)
Swing Failure Patterns (multi-timeframe)
Deviation area
Equal H&L
Liquidity Prints
Buyside & Sellside
Sweep Area
Highs and Lows (multi-timeframe)
🔵 BASIC DEMONSTRATION OF ALL FEATURES
1. MARKET STRUCTURE
The preceding image illustrates the market structure functionality within the Smart Money Concepts indicator.
➤ Solid lines: These represent the core indicator's internal structure, forming the foundation for most other components. They visually depict the overall market direction and identify major reversal points marked by significant price movements (denoted as 'x').
➤ Internal Structure: These represent an alternative internal structure with the potential to drive more rapid market shifts. This is particularly relevant when a significant gap exists in the established swing structure, specifically between the Break of Structure (BOS) and the most recent Change of High/Low (CHoCH). Identifying these formations can offer opportunities for quicker entries and potential short-term reversals.
➤ Sweeps (x): These signify potential turning points in the market where liquidity is removed from the structure. This suggests a possible trend reversal and presents crucial entry opportunities. Sweeps are identified within both swing and internal structures, providing valuable insights for informed trading decisions.
➤ Mapping structure: A tool that automatically identifies and connects significant price highs and lows, creating a zig-zag pattern. It visualizes market structure, highlights trends, support/resistance levels, and potential breakouts. Helps traders quickly grasp price action patterns and make informed decisions.
➤ Color-coded candles based on market structure: These colors visually represent the underlying market structure, making it easier for traders to quickly identify trends.
➤ Extreme H&L: It visualizes market structure with extreme high and lows, which gives perspective for macro Market Structure.
2. VOLUMETRIC ORDER BLOCKS
Order blocks are specific areas on a financial chart where significant buying or selling activity has occurred. These are not just simple zones; they contain valuable information about market dynamics. Within each of these order blocks, volume bars represent the actual buying and selling activity that took place. These volume bars offer deeper insights into the strength of the order block by showing how much buying or selling power is concentrated in that specific zone.
Additionally, these order blocks can be transformed into Breaker Blocks. When an order block fails—meaning the price breaks through this zone without reversing—it becomes a breaker block. Breaker blocks are particularly useful for trading breakouts, as they signal that the market has shifted beyond a previously established zone, offering opportunities for traders to enter in the direction of the breakout.
Here's a breakdown:
➤ Bear Order Blocks (Red): These are zones where a lot of selling happened. Traders see these areas as places where sellers were strong, pushing the price down. When the price returns to these zones, it might face resistance and drop again.
➤ Bull Order Blocks (Green): These are zones where a lot of buying happened. Traders see these areas as places where buyers were strong, pushing the price up. When the price returns to these zones, it might find support and rise again.
These Order Blocks help traders identify potential areas for entering or exiting trades based on past market activity. The volume bars inside blocks show the amount of trading activity that occurred in these blocks, giving an idea of the strength of buying or selling pressure.
➤ Breaker Block: When an order block fails, meaning the price breaks through this zone without reversing, it becomes a breaker block. This indicates a significant shift in market liquidity and structure.
➤ A bearish breaker block occurs after a bullish order block fails. This typically happens when there's an upward trend, and a certain level that was expected to support the market's rise instead gives way, leading to a sharp decline. This decline indicates that sellers have overcome the buyers, absorbing liquidity and shifting the sentiment from bullish to bearish.
Conversely, a bullish breaker block is formed from the failure of a bearish order block. In a downtrend, when a level that was expected to act as resistance is breached, and the price shoots up, it signifies that buyers have taken control, overpowering the sellers.
3. FAIR VALUE GAPS:
A fair value gap (FVG), also referred to as an imbalance, is an essential concept in Smart Money trading. It highlights the supply and demand dynamics. This gap arises when there's a notable difference between the volume of buy and sell orders. FVGs can be found across various asset classes, including forex, commodities, stocks, and cryptocurrencies.
FVGs in this toolkit have the ability to detect raids of FVG which helps to identify potential price reversals.
Mitigation option helps to change from what source FVGs will be identified: Close, Wicks or AVG.
4. SWING FAILURE PATTERN (SFP):
The Swing Failure Pattern is a liquidity engineering pattern, generally used to fill large orders. This means, the SFP generally occurs when larger players push the price into liquidity pockets with the sole objective of filling their own positions.
SFP is a technical analysis tool designed to identify potential market reversals. It works by detecting instances where the price briefly breaks a previous high or low but fails to maintain that breakout, quickly reversing direction.
How it works:
Pattern Detection: The indicator scans for price movements that breach recent highs or lows.
Reversal Confirmation: If the price quickly reverses after breaching these levels, it's identified as an SFP.
➤ SFP Display:
Bullish SFP: Marked with a green symbol when price drops below a recent low before reversing upwards.
Bearish SFP: Marked with a red symbol when price rises above a recent high before reversing downwards.
➤ Deviation Levels: After detecting an SFP, the indicator projects white lines showing potential price deviation:
For bullish SFPs, the deviation line appears above the current price.
For bearish SFPs, the deviation line appears below the current price.
These deviation levels can serve as a potential trading opportunity or areas where the reversal might lose momentum.
With Volume Threshold and Filtering of SFP traders can adjust their trading style:
Volume Threshold: This setting allows traders to filter SFPs based on the volume of the reversal candle. By setting a higher volume threshold, traders can focus on potentially more significant reversals that are backed by higher trading activity.
SFP Filtering: This feature enables traders to filter SFP detection. It includes parameters such as:
5. LIQUIDITY CONCEPTS:
➤ Equal Lows (EQL) and Equal Highs (EQH) are important concepts in liquidity-based trading.
EQL: A series of two or more swing lows that occur at approximately the same price level.
EQH: A series of two or more swing highs that occur at approximately the same price level.
EQLs and EQHs are seen as potential liquidity pools where a large number of stop loss orders or limit orders may be clustered. They can be used as potential reverse points for trades.
This multi-period feature allows traders to select less and more significant EQL and EQH:
➤ Liquidity wicks:
Liquidity wicks are a minor representation of a stop-loss hunt during the retracement of a pivot point:
➤ Buy and Sell side liquidity:
The buy side liquidity represents a concentration of potential buy orders below the current price level. When price moves into this area, it can lead to increased buying pressure due to the execution of these orders.
The sell side liquidity indicates a pool of potential sell orders below the current price level. Price movement into this area can result in increased selling pressure as these orders are executed.
➤ Sweep Liquidation Zones:
Sweep Liquidation Zones are crucial for understanding market structure and potential future price movements. They provide insights into areas where significant market participants have been forced out of their positions, potentially setting up new trading opportunities.
🔵 USAGE & EXAMPLES
The core principle behind the success of this toolkit lies in identifying "confluence." This refers to the convergence of multiple trading indicators all signaling the same information at a specific point or area. By seeking such alignment, traders can significantly enhance the likelihood of successful trades.
MS + OBs
The chart illustrates a highly bullish setup where the price is rejecting from a bullish order block (POC), while simultaneously forming a bullish Swing Failure Pattern (SFP). This occurs after an internal structure change, marked by a bullish Change of Character (CHoCH). The price broke through a bearish order block, transforming it into a breaker block, further confirming the bullish momentum.
The combination of these elements—bullish order blocks, SFP, and CHoCH—creates a powerful bullish signal, reinforcing the potential for upward movement in the market.
SFP + Bear OB
This chart above displays a bearish setup with a high probability of a price move lower. The price is currently rejecting from a bear order block, which represents a key resistance area where significant selling pressure has previously occurred. A Swing Failure Pattern (SFP) has also formed near this bear order block, indicating that the price briefly attempted to break above a recent high but failed to sustain that upward movement. This failure suggests that buyers are losing momentum, and the market could be preparing for a move to the downside.
Additionally, we can toggle on the Deviation Area in the SFP section to highlight potential levels where price deviation might occur. These deviation areas represent zones where the price is likely to react after the Swing Failure Pattern:
BUY – SELL sides + EQL
The chart showcases a bullish setup with a high probability of price breaking out of the current sell-side resistance level. The market structure indicates a formation of Equal Lows (EQL), which often suggests a build-up of liquidity that could drive the price higher.
The presence of strong buy-side pressure (69%), indicated by the green zone at the bottom, reinforces this bullish outlook. This area represents a key support zone where buyers are outpacing sellers, providing the foundation for a potential upward breakout.
EQL + Bull ChoCh
This chart illustrates a potential bullish setup, driven by the formation of Equal Lows (EQL) followed by a bullish Change of Character (CHoCH). The presence of Equal Lows often signals a liquidity build-up, which can lead to a reversal when combined with additional bullish signals.
Liquidity grab + Bull ChoCh + FVGs
This chart demonstrates a strong bullish scenario, where several important market dynamics are at play. The price begins its upward momentum from Liquidity grab following a bullish Change of Character (CHoCH), signaling the transition from a bearish phase to a bullish one.
As the price progresses, it performs liquidity grabs, which serve to gather the necessary fuel for further movement. These liquidity grabs often occur before significant price surges, as large market participants exploit these areas to accumulate positions before pushing the price higher.
The chart also highlights a market imbalance area, showing strong momentum as the price moves swiftly through this zone.
In this examples, we see how the combination of multiple “smart money” tools helps identify a potential trade opportunities. This is just one of the many scenarios that traders can spot using this toolkit. Other combinations—such as order blocks, liquidity grabs, fair value gaps, and Swing Failure Patterns (SFPs)—can also be layered on top of these concepts to further refine your trading strategy.
🔵 SETTINGS
Window: limit calculation period
Swing: limit drawing function
Mapping structure: show structural points
Algorithmic Logic: (Extreme-Adjusted) Use max high/low or pivot point calculation
Algorithmic loopback: pivot point look back
Show Last: Amount of Order block to display
Hide Overlap: hide overlapping order blocks
Construction: Size of the order blocks
Fair value gaps: Choose between normal FVG or Breaker FVG
Mitigation: (close - wick - avg) point to mitigate the order block/imbalance
SFP lookback: find a higher / lower point to improve accuracy
Threshold: remove less relevant SFP
Equal H&L: (short-mid-long term) display longer term
Liquidity Prints: Shows wicks of candles where liquidity was grabbed
Sweep Area: Identify Sweep Liquidation areas
By combining these indicators in one toolkit, traders are equipped with a comprehensive suite of tools that address every angle of the Smart Money Concept. Instead of relying on disparate tools spread across various platforms, having them integrated into a single, cohesive system allows traders to easily see confluence and make more informed trading decisions.

Liquidity Swings [LuxAlgo]The liquidity swings indicator highlights swing areas with existent trading activity. The number of times price revisited a swing area is highlighted by a zone delimiting the swing areas. Additionally, the accumulated volume within swing areas is highlighted by labels on the chart. An option to filter out swing areas with volume/counts not reaching a user-set threshold is also included.
This indicator by its very nature is not real-time and is meant for descriptive analysis alongside other components of the script. This is normal behavior for scripts detecting pivots as a part of a system and it is important you are aware the pivot labels are not designed to be traded in real-time themselves.
🔶 USAGE
The indicator can be used to highlight significant swing areas, these can be accumulation/distribution zones on lower timeframes and might play a role as future support or resistance.
Swing levels are also highlighted, when a swing level is broken it is displayed as a dashed line. A broken swing high is a bullish indication, while a broken swing low is a bearish indication.
Filtering swing areas by volume allows to only show significant swing areas with an higher degree of liquidity. These swing areas can be wider, highlighting higher volatility, or might have been visited by the price more frequently.
🔶 SETTINGS
Pivot Lookback : Lookback period used for the calculation of pivot points.
Swing Area : Determine how the swing area is calculated, "Wick Extremity" will use the range from price high to the maximum between price close/open in case of a swing high, and the range from price low to the minimum between price close/open in case of a swing low. "Full Range" will use the full candle range as swing area.
Intrabar Precision : Use intrabar data to calculate the accumulated volume within a swing area, this allows obtaining more precise results.
Filter Areas By : Determine how swing areas are filtered out, "Count" will filter out swing areas where price visited the area a number of time inferior to the user set threshold. "Volume" will filter out swing areas where the accumulated volume within the area is inferior to the user set threshold.
🔹 Style
Swing High : Show swing highs.
Swing Low : Show swing lows.
Label Size : Size of the labels on the chart.
Note that swing points are confirmed after Pivot Lookback bars, as such all elements are displayed retrospectively.
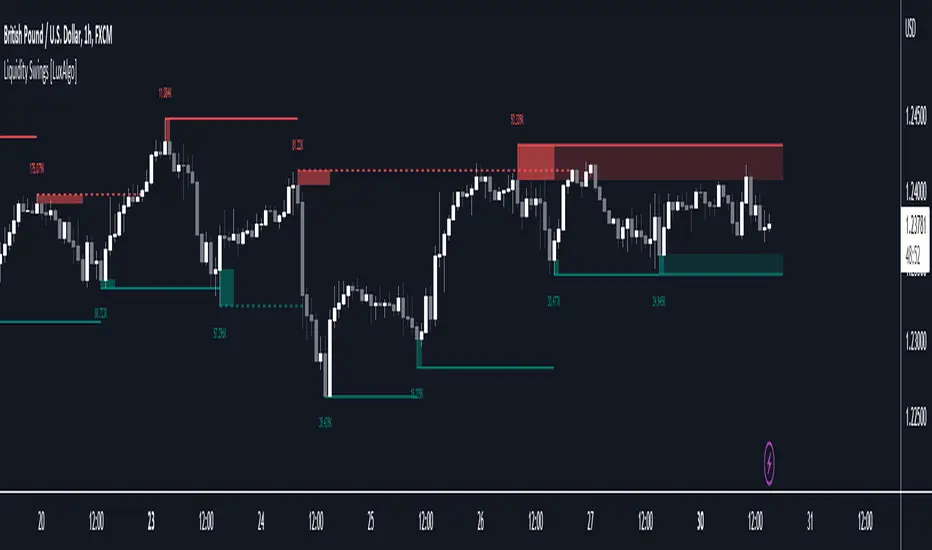
LiquidityPulse Higher Timeframe Consecutive Candle Run LevelsLiquidityPulse Higher Timeframe Consecutive Candle Run Levels
Research suggests that financial markets can alternate between trend-persistence and mean-reversion regimes, particularly at short (intraday) or very long timeframes. Extended directional moves, whether prolonged intraday rallies or sell-offs, also carry a statistically higher chance of retracing or reversing (Safari & Schmidhuber, 2025). In addition, studies examining support and resistance behaviour show that swing highs or lows formed after strong directional moves may act as structurally and psychologically important price levels, where subsequent price interactions have an increased likelihood of stalling or bouncing rather than passing through directly (Chung & Bellotti, 2021). By highlighting higher-timeframe candle runs and marking their extremal levels, this indicator aims to display areas where directional momentum previously stopped, providing contextual "watch levels" that traders may incorporate into their broader analysis.
How this information is used in the indicator:
When a sequence of consecutive higher-timeframe candles prints in the same direction, the indicator highlights the lower-timeframe chart with a green or red background, depending on whether the higher-timeframe run was bullish or bearish. The highest high (for a bull run) or lowest low (for a bear run) of that sequence forms a recent extremum, and this value is plotted as a swing-high or swing-low level. These levels appear only after the required number of consecutive higher-timeframe candles (set by the user) have closed, and they continue updating as long as the higher-timeframe streak remains intact. A level "freezes" and stops updating only when an opposite-colour higher-timeframe candle closes (e.g., a red candle ending a bull run, or a green candle ending a bear run). Once frozen, the level remains fixed to preserve that structural information for future analysis or retests. The number of past bull/bear levels displayed on the chart is also adjustable in the settings.
Why capture a level after a long directional run:
When price moves in one direction for several consecutive candles (e.g. 4, 5, or more), it reflects strong directional bias, often associated with momentum, liquidity imbalance, or liquidity grabs. Once that sequence breaks, the final level reached marks a point of exhaustion or structural resistance/support, where that bias failed to continue. These inflection points are often used by traders and trading algorithms to assess potential reversals, retests, or breakout setups. By freezing these levels once the run ends, the indicator creates a map of historically significant price zones, allowing traders to observe how price behaves around them over time.
Additional information displayed by the indicator:
Each detected run includes a label showing the run length (the number of consecutive higher-timeframe candles in the streak) along with the source timeframe used for detection. The indicator also displays an overstretch marker: this numerical value appears when the total size of the candle bodies within the run exceeds a user-defined multiple of the average higher-timeframe body size (default: 1.5x). This helps highlight runs that were unusually strong or extended relative to typical volatility. You can also enable alerts that trigger when this overstretch ratio exceeds a higher threshold.
Key Settings
Timeframe: Choose which HTF to analyse (e.g., 15m, 1h, 4h)
Minimum Candle Run Length: Define how many consecutive candles are needed to trigger a level (e.g., 4)
Overstretch Settings: Customize detection threshold and alert trigger (in multiples of average body size)
Background Tints: Enable/disable visual highlights for bull and bear runs
Display Capacity: Choose how many past bull/bear levels to show
How Traders Can Use This Indicator
Traders can:
-Watch levels for retests, reversals, breakouts, or consolidation
-Identify areas where price showed strong directional conviction
-Spot extended or aggressive moves based on overstretch detection
-Monitor how price reacts when retesting prior run levels
-Build confluence with your existing levels, zones, or indicators
Disclaimer
This tool does not reflect true order flow, liquidity, or institutional positioning. It is a visual aid that highlights specific candle behaviour patterns and does not produce predictive signals. All analysis is subject to interpretation, and past price behaviour does not imply future outcomes.
References:
Trends and Reversion in Financial Markets on Time Scales from Minutes to Decades (Sara A. Safari & Christof Schmidhuber, 2025)
Evidence and Behaviour of Support and Resistance Levels in Financial Time Series (Chung & Bellotti, 2021)

EMA Market Structure [BOSWaves]EMA Market Structure - Trend-Driven Structural Mapping with Adaptive Swing Detection
Overview
The EMA Market Structure indicator provides an advanced framework for visualizing market structure through dynamically filtered trend and swing analysis.
Unlike conventional EMA overlays, which merely indicate average price direction, this model integrates trend acceleration, swing highs/lows, and break-of-structure (BOS) logic into a unified, visually intuitive display.
Each element adapts in real time to price movement, offering traders a living map of support, resistance, and trend bias that reacts fluidly to market momentum.
The result is a comprehensive, trend-aware representation of price structure.
EMA slope and acceleration guide trend perception, while swing points identify key inflection zones.
Breaks of prior highs or lows are highlighted with visual BOS labels and stop-loss projections, giving traders actionable context for continuation or reversal setups.
Unlike static lines or simple moving averages, the EMA Market Structure indicator fuses dynamic trend analysis with structural awareness to provide a clear picture of market bias and potential turning points.
Theoretical Foundation
The EMA Market Structure builds on principles of momentum filtering and structural analysis.
Standard moving averages track average price but ignore acceleration and context; this indicator captures both the directional slope of the EMA and its rate of change, providing a proxy for trend strength.
Simultaneously, swing detection identifies statistically significant highs and lows, while BOS logic flags decisive breaks in structure, aligned with trend direction.
At its core are three interacting components:
EMA Trend & Acceleration : Smooths price data while highlighting acceleration changes, producing gradient-driven color cues for trend momentum.
Swing Detection Engine : Identifies swing highs and lows over configurable bar lengths, ensuring key turning points are captured with minimal clutter.
Break-of-Structure Logic : Detects price breaches of previous swings and aligns them with EMA trend for actionable BOS signals, including projected stop-loss levels for tactical decision-making.
By integrating these elements, the system scales effectively across timeframes and assets, maintaining structural clarity while visualizing trend dynamics in real time. Traders receive both macro and micro perspectives of market movement, with clear cues for trend continuation or reversal.
How It Works
The EMA Market Structure indicator operates through layered processing stages:
EMA Slope & Acceleration : Calculates the EMA and its rate of change, normalizing via ATR and a smoothing function to produce gradient color coding. This allows instant visual identification of bullish or bearish momentum.
Swing Identification : Swing highs and lows are computed using configurable left/right bar lengths, filtered through a cool-off mechanism to prevent redundant signals and maintain chart clarity.
Structural Lines & Zones : Swing points are connected with lines, and shaded zones are drawn between successive highs/lows to highlight key support and resistance regions.
Break-of-Structure Detection : BOS events occur when price breaches a prior swing in alignment with the EMA trend. Bullish and bearish BOS signals include enhanced label effects and projected stop-loss lines and zones, providing immediate tactical reference.
Dynamic Background Mapping : The chart background adapts to EMA trend direction, reinforcing trend context with subtle visual cues.
Through these processes, the indicator creates a living, adaptive map of market structure that reflects both trend strength and swing-based inflection points.
Interpretation
The EMA Market Structure reframes market reading from simple trend following to structured awareness of price behavior:
Uptrend Phases : EMA is rising with positive acceleration, swings confirm higher lows, and BOS events occur above prior highs, signaling trend continuation.
Downtrend Phases : EMA slope is negative, swings form lower highs, and BOS events occur below prior lows, confirming bearish bias.
Trend Reversals : Flat or decelerating EMA with BOS failures may indicate impending structural change.
Critical Zones : Swing-based lines and shaded zones highlight areas where price may pause, reverse, or accelerate, providing high-probability decision points.
Visually, EMA color gradients, structural lines, and BOS labels combine to provide both statistical trend confirmation and actionable structural cues.
Strategy Integration
EMA Market Structure integrates seamlessly into trend-following and swing-based trading systems:
Trend Alignment : Confirm higher-timeframe EMA slope before entering continuation trades.
BOS Entry Triggers : Use BOS events aligned with EMA trend for tactical entries and stop placement.
Support/Resistance Mapping : Swing lines and zones help define areas for scaling, exits, or reversals.
Volatility Context : ATR-based smoothing and stop-loss buffers accommodate varying market volatility, ensuring robustness across conditions.
Multi-Timeframe Coordination : Combine higher-timeframe EMA trend and swings with lower-timeframe structural events for precision entries.
Technical Implementation Details
Core Engine : EMA slope and ATR-normalized acceleration for gradient-driven trend visualization.
Swing Framework : Pivot-based high/low detection with configurable bar lengths and cool-off intervals.
Structural Visualization : Lines, zones, and labels for high-fidelity mapping of support/resistance and BOS events.
BOS Engine : Detects structural breaks aligned with EMA trend, automatically plotting stop-loss lines and visual cues.
Performance Profile : Lightweight, optimized for real-time responsiveness across multiple timeframes.
Optimal Application Parameters
Timeframe Guidance:
1 - 5 min : Ideal for intraday swing spotting and microstructure trend tracking.
15 - 60 min : Medium-range structural analysis and BOS-driven entries.
4H - Daily : Macro trend mapping and key swing-based support/resistance identification.
Suggested Configuration:
EMA Length : 50
Swing Length : 5
Swing Cooloff : 10 bars
BOS Cooloff : 15 bars
SL Buffer : 0.1%
These suggested parameters should be used as a baseline; their effectiveness depends on the asset volatility, liquidity, and preferred entry frequency, so fine-tuning is expected for optimal performance.
Performance Characteristics
High Effectiveness:
Trending markets with defined swings and structural consistency.
Markets where EMA slope and acceleration reliably indicate momentum changes.
Reduced Effectiveness:
Choppy or sideways markets with minimal swing definition.
Random walk assets lacking clear structural anchors.
Integration Guidelines
Confluence Framework : Combine with volume, momentum, or BOSWaves structural indicators
to validate entries.
Directional Control: Follow EMA slope and BOS alignment for high-conviction trades.
Risk Calibration: Use SL projections for disciplined exposure management.
Multi-Timeframe Synergy: Confirm higher-timeframe trend before executing lower-timeframe structural trades.
Disclaimer
The EMA Market Structure is a professional-grade trend and structure visualization tool. It is not predictive or guaranteed profitable; performance depends on parameter tuning, market regime, and disciplined execution. BOSWaves recommends using it as part of a comprehensive analytical stack integrating trend, liquidity, and structural context.
