ILD inverse liquidity Divergence StrategyDetermine Bias (Bullish):
H4 chart shows an uptrend with higher highs and higher lows.
Identify a swing high where resting liquidity (buy-side) is likely above.
Look for SMT Divergence (Lower Timeframes):
On M15, EUR/USD makes a higher high while GBP/USD fails to, signaling potential manipulation.
Spot an Inverse Fair Value Gap (IFVG):
Price has impulsively moved up, leaving a fair value gap below.
Wait for a Retracement (Entry):
Price retraces into the IFVG near a Fibonacci 61.8% retracement level.
Enter long here with a SL below the gap.
Set Risk-to-Reward:
SL = 10 pips below the entry.
TP = 20 pips above (1:2 R:R), targeting a resting liquidity zone above a recent swing high.
Monitor and Exit:
Price moves into the liquidity zone, hits TP, and completes the trade.
스크립트에서 "swing high"에 대해 찾기

ENIGMA Signals with Retests Select higher Time FrameENIGMA Signals with Retests – Script Description
The "ENIGMA Signals with Retests" script is a unique indicator designed for traders who prefer precision trading based on price action retests of key levels derived from higher timeframes. This tool is ideal for those employing multi-timeframe analysis strategies, helping them detect high-probability trade entries when the price interacts with significant support and resistance levels.
What Does This Script Do?
This indicator identifies key levels from a higher timeframe selected by the user (e.g., 4-hour or daily), then tracks price action on lower timeframes to provide actionable buy and sell signals when the price retests these levels. It visually plots the key levels on the chart and triggers alerts for potential trade opportunities when conditions are met.
How It Works
Key Level Detection:
The script uses custom functions to detect recent swing highs and swing lows on the selected higher timeframe (such as 4H or Daily). These levels represent potential areas of support and resistance where price reactions are likely to occur.
Multi-Timeframe Analysis:
The indicator leverages the request.security() function to retrieve price data from the user-defined higher timeframe and plots horizontal lines on the chart for the most recent swing highs and lows.
Retest-Based Signals:
Once the key levels are plotted, the script continuously monitors the price on the lower timeframe:
A Buy Signal is triggered when the price closes below a key high level and then moves back above it, indicating a potential bullish retest.
A Sell Signal is triggered when the price closes above a key low level and then moves back below it, indicating a potential bearish retest.
These retest signals are displayed as green and red arrows on the chart, helping traders identify optimal entry points.
Alerts for Retests:
The script includes built-in alert conditions that notify traders when a valid retest signal occurs. This allows traders to react promptly without constantly monitoring the chart.
How to Use the Script
Select Your Key Timeframe:
From the input settings, choose a higher timeframe that suits your trading style (e.g., 4H for intraday trading or Daily for swing trading).
Adjust Visual Preferences:
Customize the line style (solid, dashed, or dotted) and length of the plotted levels.
Toggle labels for the levels on or off as per your preference.
Trade Execution:
Once a retest signal appears on the lower timeframe, consider entering a trade in the direction of the signal. The buy signal suggests a potential long entry, while the sell signal indicates a potential short entry.
Set Alerts:
Use the alert conditions provided to get notified whenever a valid retest occurs. This helps in reducing screen time and improving trading efficiency.
Underlying Concepts
This script is grounded in the principles of support and resistance, retests, and breakout trading. By focusing on multi-timeframe key levels, it aligns with widely used trading concepts like:
Breakout and Retest: Entering trades after a confirmed breakout and successful retest of a significant level.
Swing Highs and Lows: Recognizing swing points to identify strong price reaction zones.
Multi-Timeframe Confluence: Enhancing trade probability by ensuring that the signals on lower timeframes correspond with key levels from higher timeframes.
Why This Script Is Unique
Unlike many generic trend-following or scalping indicators, "ENIGMA Signals with Retests" offers:
Precision Signals: It only provides signals when specific retest conditions are met, reducing false signals and noise.
Multi-Timeframe Customization: Users can tailor the higher timeframe to their strategy, making it versatile for various trading styles.
Alert Functionality: Alerts are integrated, allowing traders to stay updated without constantly monitoring the charts.
This script is perfect for traders looking for a systematic way to trade retests of key levels across multiple timeframes. Whether you're a scalper, day trader, or swing trader, "ENIGMA Signals with Retests" can help improve your precision and timing in the market.

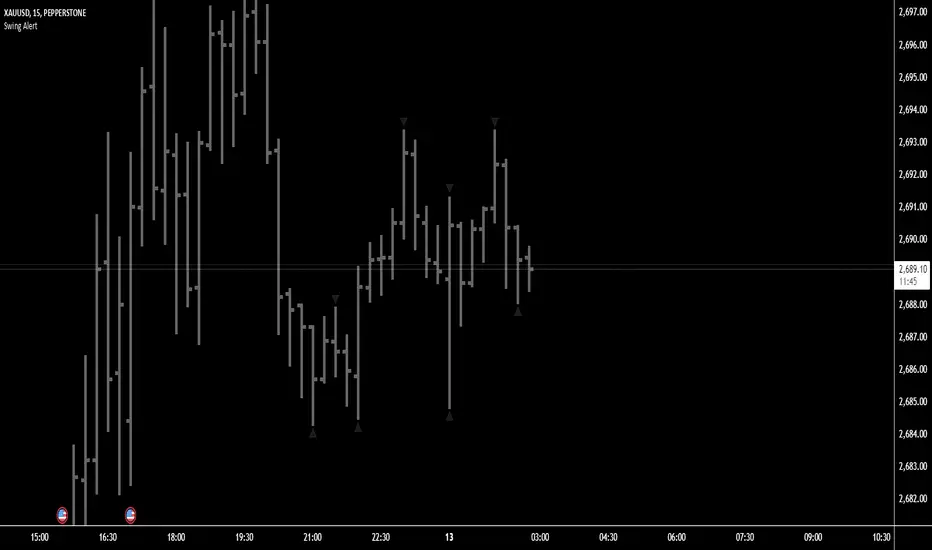
Swing Points AlertSwing Points Alert with Adjustable Delay
Description:
This script is designed to detect and alert traders about significant swing highs and lows on the chart. The script is equipped with customizable pivot detection settings and an innovative **Alert Delay** mechanism, allowing users to fine-tune their notifications to reduce noise and focus on key price movements.
Key Features:
1. **Swing High/Low Detection:**
- Identifies swing highs and lows based on user-defined pivot length.
- Visualizes these points with customizable labels for clarity.
2. **Customizable Alerts:**
- Enables real-time alerts for swing highs and lows.
- Users can adjust the delay for alerts to avoid false signals during volatile periods.
3. **Dynamic Label Management:**
- Automatically manages the number of displayed swing point labels.
- Removes crossed or outdated labels based on user preferences.
4. **Flexible Label Styling:**
- Provides multiple label styles (e.g., triangles, circles, arrows) and color customization for both swing highs and lows.
How the Alert Delay Works:
The **Alert Delay** helps filter signals by introducing a delay before triggering alerts. The delay is calculated as follows:
**Alert Delay (%) x Time Frame = Alert Delay in Time Frame Units**
For example:
- If the **Alert Delay** is set to 30% and the timeframe is **15 minutes**, the alert will be triggered after a delay of:
\
This ensures the alert is triggered only if the swing high/low condition remains valid for at least 4.5 minutes.
Important Notes:
1. **Timeframe Sensitivity:**
- This script is optimized for use across various timeframes, but users must adjust the **Alert Delay** percentage to match their trading style and timeframe.
- For example, higher timeframes may require lower delay percentages for timely alerts.
2. **Customization Options:**
- Easily customize pivot detection length, alert delay, label styles, and colors to suit your preferences.
3. **Support:**
- If you encounter any challenges or need help optimizing the script for your specific trading scenario, feel free to reach out for assistance.
lib_smcLibrary "lib_smc"
This is an adaptation of LuxAlgo's Smart Money Concepts indicator with numerous changes. Main changes include integration of object based plotting, plenty of performance improvements, live tracking of Order Blocks, integration of volume profiles to refine Order Blocks, and many more.
This is a library for developers, if you want this converted into a working strategy, let me know.
buffer(item, len, force_rotate)
Parameters:
item (float)
len (int)
force_rotate (bool)
buffer(item, len, force_rotate)
Parameters:
item (int)
len (int)
force_rotate (bool)
buffer(item, len, force_rotate)
Parameters:
item (Profile type from robbatt/lib_profile/32)
len (int)
force_rotate (bool)
swings(len)
INTERNAL: detect swing points (HH and LL) in given range
Parameters:
len (simple int) : range to check for new swing points
Returns: values are the price level where and if a new HH or LL was detected, else na
method init(this)
Namespace types: OrderBlockConfig
Parameters:
this (OrderBlockConfig)
method delete(this)
Namespace types: OrderBlock
Parameters:
this (OrderBlock)
method clear_broken(this, broken_buffer)
INTERNAL: delete internal order blocks box coordinates if top/bottom is broken
Namespace types: map
Parameters:
this (map)
broken_buffer (map)
Returns: any_bull_ob_broken, any_bear_ob_broken, broken signals are true if an according order block was broken/mitigated, broken contains the broken block(s)
create_ob(id, mode, start_t, start_i, top, end_t, end_i, bottom, break_price, early_confirmation_price, config, init_plot, force_overlay)
INTERNAL: set internal order block coordinates
Parameters:
id (int)
mode (int) : 1: bullish, -1 bearish block
start_t (int)
start_i (int)
top (float)
end_t (int)
end_i (int)
bottom (float)
break_price (float)
early_confirmation_price (float)
config (OrderBlockConfig)
init_plot (bool)
force_overlay (bool)
Returns: signals are true if an according order block was broken/mitigated
method align_to_profile(block, align_edge, align_break_price)
Namespace types: OrderBlock
Parameters:
block (OrderBlock)
align_edge (bool)
align_break_price (bool)
method create_profile(block, opens, tops, bottoms, closes, values, resolution, vah_pc, val_pc, args, init_calculated, init_plot, force_overlay)
Namespace types: OrderBlock
Parameters:
block (OrderBlock)
opens (array)
tops (array)
bottoms (array)
closes (array)
values (array)
resolution (int)
vah_pc (float)
val_pc (float)
args (ProfileArgs type from robbatt/lib_profile/32)
init_calculated (bool)
init_plot (bool)
force_overlay (bool)
method create_profile(block, resolution, vah_pc, val_pc, args, init_calculated, init_plot, force_overlay)
Namespace types: OrderBlock
Parameters:
block (OrderBlock)
resolution (int)
vah_pc (float)
val_pc (float)
args (ProfileArgs type from robbatt/lib_profile/32)
init_calculated (bool)
init_plot (bool)
force_overlay (bool)
track_obs(swing_len, hh, ll, top, btm, bull_bos_alert, bull_choch_alert, bear_bos_alert, bear_choch_alert, min_block_size, max_block_size, config_bull, config_bear, init_plot, force_overlay, enabled, extend_blocks, clear_broken_buffer_before, align_edge_to_value_area, align_break_price_to_poc, profile_args_bull, profile_args_bear, use_soft_confirm, soft_confirm_offset, use_retracements_with_FVG_out)
Parameters:
swing_len (int)
hh (float)
ll (float)
top (float)
btm (float)
bull_bos_alert (bool)
bull_choch_alert (bool)
bear_bos_alert (bool)
bear_choch_alert (bool)
min_block_size (float)
max_block_size (float)
config_bull (OrderBlockConfig)
config_bear (OrderBlockConfig)
init_plot (bool)
force_overlay (bool)
enabled (bool)
extend_blocks (simple bool)
clear_broken_buffer_before (simple bool)
align_edge_to_value_area (simple bool)
align_break_price_to_poc (simple bool)
profile_args_bull (ProfileArgs type from robbatt/lib_profile/32)
profile_args_bear (ProfileArgs type from robbatt/lib_profile/32)
use_soft_confirm (simple bool)
soft_confirm_offset (float)
use_retracements_with_FVG_out (simple bool)
method draw(this, config, extend_only)
Namespace types: OrderBlock
Parameters:
this (OrderBlock)
config (OrderBlockConfig)
extend_only (bool)
method draw(blocks, config)
INTERNAL: plot order blocks
Namespace types: array
Parameters:
blocks (array)
config (OrderBlockConfig)
method draw(blocks, config)
INTERNAL: plot order blocks
Namespace types: map
Parameters:
blocks (map)
config (OrderBlockConfig)
method cleanup(this, ob_bull, ob_bear)
removes all Profiles that are older than the latest OrderBlock from this profile buffer
Namespace types: array
Parameters:
this (array type from robbatt/lib_profile/32)
ob_bull (OrderBlock)
ob_bear (OrderBlock)
_plot_swing_points(mode, x, y, show_swing_points, linecolor_swings, keep_history, show_latest_swings_levels, trail_x, trail_y, trend)
INTERNAL: plot swing points
Parameters:
mode (int) : 1: bullish, -1 bearish block
x (int) : x-coordingate of swing point to plot (bar_index)
y (float) : y-coordingate of swing point to plot (price)
show_swing_points (bool) : switch to enable/disable plotting of swing point labels
linecolor_swings (color) : color for swing point labels and lates level lines
keep_history (bool) : weater to remove older swing point labels and only keep the most recent
show_latest_swings_levels (bool)
trail_x (int) : x-coordinate for latest swing point (bar_index)
trail_y (float) : y-coordinate for latest swing point (price)
trend (int) : the current trend 1: bullish, -1: bearish, to determine Strong/Weak Low/Highs
_pivot_lvl(mode, trend, hhll_x, hhll, super_hhll, filter_insignificant_internal_breaks)
INTERNAL: detect whether a structural level has been broken and if it was in trend direction (BoS) or against trend direction (ChoCh), also track the latest high and low swing points
Parameters:
mode (simple int) : detect 1: bullish, -1 bearish pivot points
trend (int) : current trend direction
hhll_x (int) : x-coordinate of newly detected hh/ll (bar_index)
hhll (float) : y-coordinate of newly detected hh/ll (price)
super_hhll (float) : level/y-coordinate of superior hhll (if this is an internal structure pivot level)
filter_insignificant_internal_breaks (bool) : if true pivot points / internal structure will be ignored where the wick in trend direction is longer than the opposite (likely to push further in direction of main trend)
Returns: coordinates of internal structure that has been broken (x,y): start of structure, (trail_x, trail_y): tracking hh/ll after structure break, (bos_alert, choch_alert): signal whether a structural level has been broken
_plot_structure(x, y, is_bos, is_choch, line_color, line_style, label_style, label_size, keep_history)
INTERNAL: plot structural breaks (BoS/ChoCh)
Parameters:
x (int) : x-coordinate of newly broken structure (bar_index)
y (float) : y-coordinate of newly broken structure (price)
is_bos (bool) : whether this structural break was in trend direction
is_choch (bool) : whether this structural break was against trend direction
line_color (color) : color for the line connecting the structural level and the breaking candle
line_style (string) : style (line.style_dashed/solid) for the line connecting the structural level and the breaking candle
label_style (string) : style (label.style_label_down/up) for the label above/below the line connecting the structural level and the breaking candle
label_size (string) : size (size.small/tiny) for the label above/below the line connecting the structural level and the breaking candle
keep_history (bool) : weater to remove older swing point labels and only keep the most recent
structure_values(length, super_hh, super_ll, filter_insignificant_internal_breaks)
detect (and plot) structural breaks and the resulting new trend
Parameters:
length (simple int) : lookback period for swing point detection
super_hh (float) : level/y-coordinate of superior hh (for internal structure detection)
super_ll (float) : level/y-coordinate of superior ll (for internal structure detection)
filter_insignificant_internal_breaks (bool) : if true pivot points / internal structure will be ignored where the wick in trend direction is longer than the opposite (likely to push further in direction of main trend)
Returns: trend: direction 1:bullish -1:bearish, (bull_bos_alert, bull_choch_alert, top_x, top_y, trail_up_x, trail_up): whether and which level broke in a bullish direction, trailing high, (bbear_bos_alert, bear_choch_alert, tm_x, btm_y, trail_dn_x, trail_dn): same in bearish direction
structure_plot(trend, bull_bos_alert, bull_choch_alert, top_x, top_y, trail_up_x, trail_up, hh, bear_bos_alert, bear_choch_alert, btm_x, btm_y, trail_dn_x, trail_dn, ll, color_bull, color_bear, show_swing_points, show_latest_swings_levels, show_bos, show_choch, line_style, label_size, keep_history)
detect (and plot) structural breaks and the resulting new trend
Parameters:
trend (int) : crrent trend 1: bullish, -1: bearish
bull_bos_alert (bool) : if there was a bullish bos alert -> plot it
bull_choch_alert (bool) : if there was a bullish choch alert -> plot it
top_x (int) : latest shwing high x
top_y (float) : latest swing high y
trail_up_x (int) : trailing high x
trail_up (float) : trailing high y
hh (float) : if there was a higher high
bear_bos_alert (bool) : if there was a bearish bos alert -> plot it
bear_choch_alert (bool) : if there was a bearish chock alert -> plot it
btm_x (int) : latest swing low x
btm_y (float) : latest swing low y
trail_dn_x (int) : trailing low x
trail_dn (float) : trailing low y
ll (float) : if there was a lower low
color_bull (color) : color for bullish BoS/ChoCh levels
color_bear (color) : color for bearish BoS/ChoCh levels
show_swing_points (bool) : whether to plot swing point labels
show_latest_swings_levels (bool) : whether to track and plot latest swing point levels with lines
show_bos (bool) : whether to plot BoS levels
show_choch (bool) : whether to plot ChoCh levels
line_style (string) : whether to plot BoS levels
label_size (string) : label size of plotted BoS/ChoCh levels
keep_history (bool) : weater to remove older swing point labels and only keep the most recent
structure(length, color_bull, color_bear, super_hh, super_ll, filter_insignificant_internal_breaks, show_swing_points, show_latest_swings_levels, show_bos, show_choch, line_style, label_size, keep_history, enabled)
detect (and plot) structural breaks and the resulting new trend
Parameters:
length (simple int) : lookback period for swing point detection
color_bull (color) : color for bullish BoS/ChoCh levels
color_bear (color) : color for bearish BoS/ChoCh levels
super_hh (float) : level/y-coordinate of superior hh (for internal structure detection)
super_ll (float) : level/y-coordinate of superior ll (for internal structure detection)
filter_insignificant_internal_breaks (bool) : if true pivot points / internal structure will be ignored where the wick in trend direction is longer than the opposite (likely to push further in direction of main trend)
show_swing_points (bool) : whether to plot swing point labels
show_latest_swings_levels (bool) : whether to track and plot latest swing point levels with lines
show_bos (bool) : whether to plot BoS levels
show_choch (bool) : whether to plot ChoCh levels
line_style (string) : whether to plot BoS levels
label_size (string) : label size of plotted BoS/ChoCh levels
keep_history (bool) : weater to remove older swing point labels and only keep the most recent
enabled (bool)
_check_equal_level(mode, len, eq_threshold, enabled)
INTERNAL: detect equal levels (double top/bottom)
Parameters:
mode (int) : detect 1: bullish/high, -1 bearish/low pivot points
len (int) : lookback period for equal level (swing point) detection
eq_threshold (float) : maximum price offset for a level to be considered equal
enabled (bool)
Returns: eq_alert whether an equal level was detected and coordinates of the first and the second level/swing point
_plot_equal_level(show_eq, x1, y1, x2, y2, label_txt, label_style, label_size, line_color, line_style, keep_history)
INTERNAL: plot equal levels (double top/bottom)
Parameters:
show_eq (bool) : whether to plot the level or not
x1 (int) : x-coordinate of the first level / swing point
y1 (float) : y-coordinate of the first level / swing point
x2 (int) : x-coordinate of the second level / swing point
y2 (float) : y-coordinate of the second level / swing point
label_txt (string) : text for the label above/below the line connecting the equal levels
label_style (string) : style (label.style_label_down/up) for the label above/below the line connecting the equal levels
label_size (string) : size (size.tiny) for the label above/below the line connecting the equal levels
line_color (color) : color for the line connecting the equal levels (and it's label)
line_style (string) : style (line.style_dotted) for the line connecting the equal levels
keep_history (bool) : weater to remove older swing point labels and only keep the most recent
equal_levels_values(len, threshold, enabled)
detect (and plot) equal levels (double top/bottom), returns coordinates
Parameters:
len (int) : lookback period for equal level (swing point) detection
threshold (float) : maximum price offset for a level to be considered equal
enabled (bool) : whether detection is enabled
Returns: (eqh_alert, eqh_x1, eqh_y1, eqh_x2, eqh_y2) whether an equal high was detected and coordinates of the first and the second level/swing point, (eql_alert, eql_x1, eql_y1, eql_x2, eql_y2) same for equal lows
equal_levels_plot(eqh_x1, eqh_y1, eqh_x2, eqh_y2, eql_x1, eql_y1, eql_x2, eql_y2, color_eqh, color_eql, show, keep_history)
detect (and plot) equal levels (double top/bottom), returns coordinates
Parameters:
eqh_x1 (int) : coordinates of first point of equal high
eqh_y1 (float) : coordinates of first point of equal high
eqh_x2 (int) : coordinates of second point of equal high
eqh_y2 (float) : coordinates of second point of equal high
eql_x1 (int) : coordinates of first point of equal low
eql_y1 (float) : coordinates of first point of equal low
eql_x2 (int) : coordinates of second point of equal low
eql_y2 (float) : coordinates of second point of equal low
color_eqh (color) : color for the line connecting the equal highs (and it's label)
color_eql (color) : color for the line connecting the equal lows (and it's label)
show (bool) : whether plotting is enabled
keep_history (bool) : weater to remove older swing point labels and only keep the most recent
Returns: (eqh_alert, eqh_x1, eqh_y1, eqh_x2, eqh_y2) whether an equal high was detected and coordinates of the first and the second level/swing point, (eql_alert, eql_x1, eql_y1, eql_x2, eql_y2) same for equal lows
equal_levels(len, threshold, color_eqh, color_eql, enabled, show, keep_history)
detect (and plot) equal levels (double top/bottom)
Parameters:
len (int) : lookback period for equal level (swing point) detection
threshold (float) : maximum price offset for a level to be considered equal
color_eqh (color) : color for the line connecting the equal highs (and it's label)
color_eql (color) : color for the line connecting the equal lows (and it's label)
enabled (bool) : whether detection is enabled
show (bool) : whether plotting is enabled
keep_history (bool) : weater to remove older swing point labels and only keep the most recent
Returns: (eqh_alert) whether an equal high was detected, (eql_alert) same for equal lows
_detect_fvg(mode, enabled, o, h, l, c, filter_insignificant_fvgs, change_tf)
INTERNAL: detect FVG (fair value gap)
Parameters:
mode (int) : detect 1: bullish, -1 bearish gaps
enabled (bool) : whether detection is enabled
o (float) : reference source open
h (float) : reference source high
l (float) : reference source low
c (float) : reference source close
filter_insignificant_fvgs (bool) : whether to calculate and filter small/insignificant gaps
change_tf (bool) : signal when the previous reference timeframe closed, triggers new calculation
Returns: whether a new FVG was detected and its top/mid/bottom levels
_clear_broken_fvg(mode, upper_boxes, lower_boxes)
INTERNAL: clear mitigated FVGs (fair value gaps)
Parameters:
mode (int) : detect 1: bullish, -1 bearish gaps
upper_boxes (array) : array that stores the upper parts of the FVG boxes
lower_boxes (array) : array that stores the lower parts of the FVG boxes
_plot_fvg(mode, show, top, mid, btm, border_color, extend_box)
INTERNAL: plot (and clear broken) FVG (fair value gap)
Parameters:
mode (int) : plot 1: bullish, -1 bearish gap
show (bool) : whether plotting is enabled
top (float) : top level of fvg
mid (float) : center level of fvg
btm (float) : bottom level of fvg
border_color (color) : color for the FVG box
extend_box (int) : how many bars into the future the FVG box should be extended after detection
fvgs_values(o, h, l, c, filter_insignificant_fvgs, change_tf, enabled)
detect (and plot / clear broken) FVGs (fair value gaps), and return alerts and level values
Parameters:
o (float) : reference source open
h (float) : reference source high
l (float) : reference source low
c (float) : reference source close
filter_insignificant_fvgs (bool) : whether to calculate and filter small/insignificant gaps
change_tf (bool) : signal when the previous reference timeframe closed, triggers new calculation
enabled (bool) : whether detection is enabled
Returns: (bullish_fvg_alert, bull_top, bull_mid, bull_btm): whether a new bullish FVG was detected and its top/mid/bottom levels, (bearish_fvg_alert, bear_top, bear_mid, bear_btm): same for bearish FVGs
fvgs_plot(bullish_fvg_alert, bull_top, bull_mid, bull_btm, bearish_fvg_alert, bear_top, bear_mid, bear_btm, color_bull, color_bear, extend_box, show)
Parameters:
bullish_fvg_alert (bool)
bull_top (float)
bull_mid (float)
bull_btm (float)
bearish_fvg_alert (bool)
bear_top (float)
bear_mid (float)
bear_btm (float)
color_bull (color) : color for bullish FVG boxes
color_bear (color) : color for bearish FVG boxes
extend_box (int) : how many bars into the future the FVG box should be extended after detection
show (bool) : whether plotting is enabled
Returns: (bullish_fvg_alert, bull_top, bull_mid, bull_btm): whether a new bullish FVG was detected and its top/mid/bottom levels, (bearish_fvg_alert, bear_top, bear_mid, bear_btm): same for bearish FVGs
fvgs(o, h, l, c, filter_insignificant_fvgs, change_tf, color_bull, color_bear, extend_box, enabled, show)
detect (and plot / clear broken) FVGs (fair value gaps)
Parameters:
o (float) : reference source open
h (float) : reference source high
l (float) : reference source low
c (float) : reference source close
filter_insignificant_fvgs (bool) : whether to calculate and filter small/insignificant gaps
change_tf (bool) : signal when the previous reference timeframe closed, triggers new calculation
color_bull (color) : color for bullish FVG boxes
color_bear (color) : color for bearish FVG boxes
extend_box (int) : how many bars into the future the FVG box should be extended after detection
enabled (bool) : whether detection is enabled
show (bool) : whether plotting is enabled
Returns: (bullish_fvg_alert): whether a new bullish FVG was detected, (bearish_fvg_alert): same for bearish FVGs
OrderBlock
Fields:
id (series int)
dir (series int)
left_top (chart.point)
right_bottom (chart.point)
break_price (series float)
early_confirmation_price (series float)
ltf_high (array)
ltf_low (array)
ltf_volume (array)
plot (Box type from robbatt/lib_plot_objects/49)
profile (Profile type from robbatt/lib_profile/32)
trailing (series bool)
extending (series bool)
awaiting_confirmation (series bool)
touched_break_price_before_confirmation (series bool)
soft_confirmed (series bool)
has_fvg_out (series bool)
hidden (series bool)
broken (series bool)
OrderBlockConfig
Fields:
show (series bool)
show_last (series int)
show_id (series bool)
show_profile (series bool)
args (BoxArgs type from robbatt/lib_plot_objects/49)
txt (series string)
txt_args (BoxTextArgs type from robbatt/lib_plot_objects/49)
delete_when_broken (series bool)
broken_args (BoxArgs type from robbatt/lib_plot_objects/49)
broken_txt (series string)
broken_txt_args (BoxTextArgs type from robbatt/lib_plot_objects/49)
broken_profile_args (ProfileArgs type from robbatt/lib_profile/32)
use_profile (series bool)
profile_args (ProfileArgs type from robbatt/lib_profile/32)

SMC StrategyThis Pine Script strategy is based on Smart Money Concepts (SMC), designed for TradingView. Here's a brief summary of what the script does:
1. Swing High and Low Calculation: It identifies recent swing highs and lows, which are used to define key zones.
2. Equilibrium, Premium, and Discount Zones:
- Equilibrium is the midpoint between the swing high and low.
- Premium Zone is above the equilibrium, indicating a potential resistance area (sell zone).
- Discount Zone is below the equilibrium, indicating a potential support area (buy zone).
3. Simple Moving Average (SMA): It uses a 50-period SMA to determine the trend direction. If the price is above the SMA, the trend is bullish; if it's below, the trend is bearish.
4. Buy and Sell Signals:
- Buy Signal: Generated when the price is in the discount zone and above the equilibrium, with the price also above the SMA.
- Sell Signal: Triggered when the price is in the premium zone and below the equilibrium, with the price also below the SMA.
5. Order Blocks: It detects basic order blocks by identifying the highest high and lowest low within the last 20 bars. These levels help confirm the buy and sell signals.
6. Liquidity Zones: It marks the swing high and low as potential liquidity zones, indicating where price may reverse due to institutional players' activity.
The strategy then executes trades based on these signals, plotting buy and sell markers on the chart and showing the key levels (zones) and trend direction.

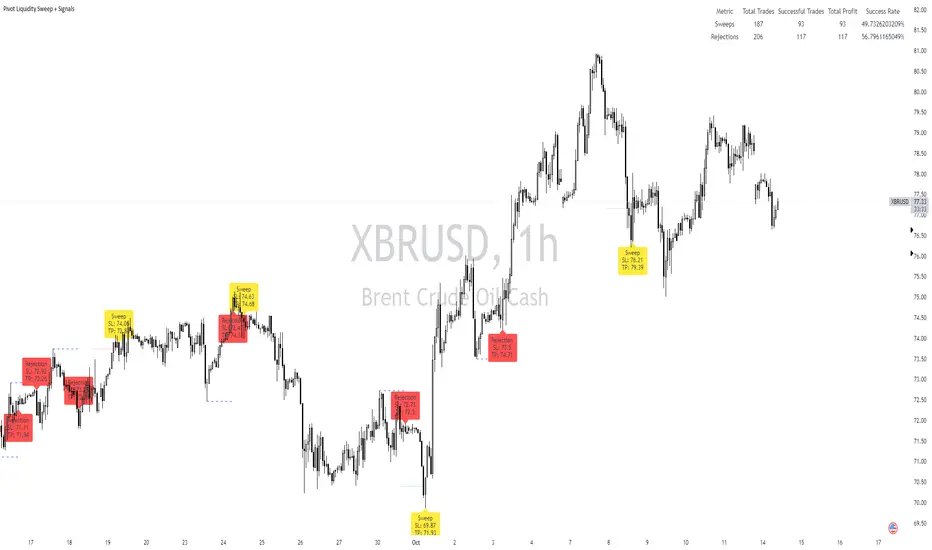
Pivot Liquidity Sweep + SignalsCore Functionalities:
Sweep Signals:
The indicator identifies sweeps of liquidity by detecting when price exceeds recent pivot highs (swing highs) or pivot lows (swing lows) and then reverses direction. It draws attention to these scenarios by labeling them on the chart.
For bullish sweep signals, the entry point is the closing price of the sweep candle, with the stop loss placed at the highest point between the sweep candle and the previous candle.
For bearish sweeps, the entry point is similarly identified, with the stop loss being the lowest price of the sweep candle and the candle before it. The profit target is dynamically set to the low or high of the closest valid pivot depending on the direction of the trade.
Rejection Signals:
Rejection signals are identified when price attempts to break a pivot high or low but fails, causing a rejection.
Bullish rejections involve price trying to break a pivot low but closing back above it, indicating potential for a bounce.
Bearish rejections follow a similar pattern, with price attempting to break a pivot high but failing to hold above it, signaling a potential bearish move.
High-Precision Intrabar Data:
The "Intrabar Precision" feature allows the indicator to use lower timeframe data to accurately plot sweeps and rejections, providing traders with precise entry and exit points.
The intrabar settings are particularly useful for traders looking for high-precision trades, such as scalpers who want to capture small yet consistent moves.
ATR and Percentage-Based Filters:
The indicator allows for customizable filters to ensure signals meet certain thresholds before being validated. Traders can use ATR (Average True Range) or percentage-based conditions to filter out low-quality signals, ensuring that the trades captured have enough volatility or price movement potential.
Dashboard:
The built-in dashboard provides a quick overview of trades executed using the indicator, displaying metrics such as the total number of sweep and rejection trades, their success rates, and total profit in points.
The dashboard is color-coded for easy reading and offers traders insights into the overall performance of their strategy, helping with ongoing evaluation and optimization.
Labeling and Alerts:
Every time a sweep or rejection signal is detected, the indicator automatically labels the chart to help traders quickly identify the trading opportunities.
Alerts are also generated for each trading signal, providing the trader with real-time notifications, which can be useful for those who are not constantly monitoring their charts.
Stop Loss and Target Adaptation:
The stop loss levels are adjusted dynamically based on the recent pivot points, and the target profit is derived from valid subsequent pivot levels to ensure realistic and efficient trade exits.
Change in State of Delivery (CISD) [LuxAlgo]The Change In State Of Delivery (CISD) indicator detects and displays Change in State Of Delivery, a concept related to market structures.
Users can choose between two different CISD detection methods. Various filtering options are also included to filter out less significant CISDs.
🔶 USAGE
A Change in State of Delivery (CISD) is a concept closely related to market structures, where price breaks a level of interest, confirming trends and their continuations from the resulting breakouts.
Unlike more traditional market structures which rely on swing points, CISDs rely on a persistent sequence of candles, using the sequence extremes as breakout levels.
CISDs are detected as follows:
Bullish: The price closes above the opening price of the first candle in a sequence of bearish candles (or its own opening price if it's the only candle).
Bearish: The price closes below the opening price of the first candle in a sequence of bullish candles (or its own opening price if it's the only candle).
If a newly detected CISD aligns with the indicator's current established trend, this confirms a trend continuation (represented with a dashed line).
On the other hand, if a newly detected CISD is in the opposite direction to the detected trend it can confirm a trend reversal (represented with a solid line).
🔹 Liquidity Sweep Detection Method
Using Liquidity Sweeps to update CISD breakout levels allows us to obtain less frequent and more relevant levels that are less sensitive to noisy price variations.
Sweeps are obtained from detected Swing Points , with a higher Swing Length allowing us to obtain longer-term swing levels and potentially more detected sweeps from a specific level over time.
Note: The 'Swing Length' setting is only applicable on the Liquidity Sweep Detection Method and will only change the Liquidity levels.
A Liquidity Sweep is valid when the price reaches an important liquidity level , after which the price closes below/above this level.
Bullish scenario: The price goes below a previous unbroken Swing Low but closes above.
Bearish scenario: The price goes above a previous unbroken Swing High but closes below.
After a Liquidity Sweep has been detected, the last level of importance acts as support/resistance . Breaking this level in the other direction changes the state of delivery .
Users must keep observing the price and significant levels, as highlighted by the white rectangle in the above example.
🔹 CISD Filtering
Users can adjust the following two settings:
Minimum CISD Duration: The minimum length of the 'CISD' line
Maximum Swing Validity: The maximum length of the 'CISD' line; potential CISD lines that aren't broken are deleted when exceeding the limit.
The chart can get cluttered when the Minimum CISD Duration is low. Users could focus on a switch in trend (first solid line CISD ), where the following dashed CISD lines can be seen as extra opportunities/confirmations.
🔶 DETAIL
🔹 Using Different Timeframes
When an important liquidity level (Previous Swing high/low, FVG, etc.) is reached on the higher timeframe, the user can move to a lower timeframe to check whether there is a CISD .
Above example:
The high of the last candle breaches a liquidity level (previous Swing High). The opening price of the last candle acts as a trigger/confirmation level.
A confirmed CISD is seen in a lower timeframe, just after this Liquidity Sweep. This could be an early opportunity.
Later, a confirmed CISD on the higher timeframe is established.
🔶 SETTINGS
Detection Method: Classic or Liquidity Sweep
Swing Length: Period used for the swing detection, with higher values returning longer-term Swing Levels.
Minimum CISD Duration: The minimum length of the CISD line
Maximum Swing Validity: The maximum length of the CISD line; potential CISD lines that aren't broken are deleted when exceeding the limit.

MTF Candle Multi HubMTF Candle Multi Hub Indicator - Guide 日本語解説は下記
Introduction
The "MTF Candle Multi Hub" indicator is a versatile and comprehensive tool designed to visualize multiple timeframes' candlestick data, Heikin Ashi candles, and moving averages on a single chart. This indicator also includes a Zigzag feature with the ability to draw horizontal lines at significant swing points, making it a powerful tool for technical analysis.
Key Features
Multi-Timeframe Candlestick Display:
The indicator allows you to display candlesticks from different timeframes, including 5-minute, 15-minute, 1-hour, 4-hour, daily, and weekly timeframes.
Each timeframe's candlestick can be toggled on or off using the settings panel.
Candlesticks are color-coded based on whether the close is higher or lower than the open, with customizable colors for bullish and bearish candles.
Heikin Ashi Candlesticks:
Heikin Ashi candlesticks are also available for 5-minute, 15-minute, 1-hour, 4-hour, daily, and weekly timeframes.
Like the standard candlesticks, these can be toggled on or off, and their colors are customizable.
Moving Averages (MA):
The indicator supports up to four different moving averages, which can be either Simple Moving Average (SMA) or Exponential Moving Average (EMA).
The user can toggle each moving average on or off and adjust the period and type from the settings panel.
An additional feature allows the space between two moving averages to be filled with a color, indicating the relative position of the MAs.
Zigzag Indicator with Horizontal Lines:
The Zigzag feature plots lines between significant swing highs and lows, helping identify trends and potential reversal points.
Two Zigzag lines can be configured, each with customizable swing length, line color, style, and width.
The indicator also offers the ability to draw horizontal lines at the start and end of each Zigzag swing. These horizontal lines can be customized in terms of color, style, width, and length.
The number of horizontal lines to be drawn can be set, allowing for focused analysis of the most recent swings.
Label and Comment Display:
The indicator provides the option to display custom labels and comments on the chart.
You can enter up to ten different comments, which will be displayed in a label at the last candlestick of the chart.
The label's position, background color, text color, and text size are fully customizable.
Trading Strategy
Trend Following with Multi-Timeframe Analysis:
Use the multi-timeframe candlestick and Heikin Ashi features to assess the trend across different timeframes. For example, if both the daily and 4-hour Heikin Ashi candles are bullish, it may indicate a strong uptrend.
Entry and Exit Signals:
Use the Zigzag indicator to identify potential entry points by looking for a new swing high or low.
Horizontal lines from the Zigzag can be used as support and resistance levels, helping to determine potential entry and exit points.
Moving Average Crossovers:
Monitor the crossovers of the moving averages. For example, when a shorter-term MA crosses above a longer-term MA, it may signal a potential buy opportunity.
Confluence of Signals:
The best trading opportunities may arise when multiple signals align. For example, a bullish Zigzag swing, supported by bullish Heikin Ashi candles and a moving average crossover, could provide a strong buy signal.
Disclaimer
For Educational Purposes Only: This indicator is provided for educational purposes and should not be used as the sole basis for any trading decisions.
No Guarantees: The indicator is provided "as is" without any guarantees of accuracy or completeness. Market conditions can change rapidly, and this indicator may not always reflect the most accurate market state.
Test Thoroughly: Bugs may exist in the script. It is highly recommended to test this script on a demo account before using it in live trading.
Use with Caution: Always use this indicator in conjunction with other analysis tools. Do not rely solely on this indicator for making trading decisions.
Sudden Changes or Removal: The indicator may be subject to sudden changes or removal without prior notice. The developer is not responsible for any issues this may cause.
By using this indicator, you agree to these terms.
MTF Candle Multi Hub インジケーター - ガイド
はじめに
「MTF Candle Multi Hub」インジケーターは、複数の時間枠のローソク足データ、平均足、移動平均線を1つのチャート上で視覚化するために設計された多用途かつ包括的なツールです。このインジケーターには、水平線を描画する機能を備えたジグザグ機能も含まれており、テクニカル分析において強力なツールとなります。
主な機能
マルチタイムフレームのローソク足表示:
5分足、15分足、1時間足、4時間足、日足、週足のローソク足を表示することができます。
各時間枠のローソク足は設定パネルでオンまたはオフに切り替えることができます。
ローソク足は、終値が始値より高いか低いかに基づいて色分けされており、強気と弱気のローソク足の色をカスタマイズできます。
平均足ローソク足:
5分足、15分足、1時間足、4時間足、日足、週足の平均足ローソク足を表示することができます。
標準のローソク足と同様に、これらをオンまたはオフに切り替え、色をカスタマイズすることが可能です。
移動平均線(MA):
このインジケーターは、単純移動平均線(SMA)または指数移動平均線(EMA)のいずれかを選択できる4つの移動平均線をサポートしています。
各移動平均線をオンまたはオフに切り替え、期間やタイプを設定パネルから調整できます。
また、2本の移動平均線の間に色を塗ることで、MAの相対的な位置を視覚的に表示する機能もあります。
ジグザグインジケーターと水平線:
ジグザグ機能は、重要なスイングの高値と安値の間に線を引き、トレンドや潜在的な反転ポイントを識別するのに役立ちます。
2本のジグザグラインを設定することができ、それぞれのスイングの長さ、線の色、スタイル、幅をカスタマイズできます。
また、ジグザグのスイングの始点と終点に水平線を描画する機能も提供されています。これらの水平線は、色、スタイル、幅、長さをカスタマイズできます。
描画する水平線の本数を設定でき、最新のスイングに焦点を当てた分析が可能です。
ラベルとコメントの表示:
インジケーターは、チャート上にカスタムラベルとコメントを表示するオプションを提供します。
最大10個の異なるコメントを入力することができ、これらはチャートの最新のローソク足にラベルとして表示されます。
ラベルの位置、背景色、テキストの色、テキストのサイズは完全にカスタマイズ可能です。
トレード戦略
マルチタイムフレーム分析を使用したトレンドフォロー:
マルチタイムフレームのローソク足や平均足の機能を使用して、異なる時間枠でのトレンドを評価します。例えば、日足と4時間足の平均足が共に強気であれば、強い上昇トレンドを示している可能性があります。
エントリーとエグジットシグナル:
ジグザグインジケーターを使用して、新たなスイング高値または安値を確認し、エントリーポイントを見極めます。
ジグザグの水平線をサポートおよびレジスタンスレベルとして使用し、エントリーやエグジットのタイミングを判断します。
移動平均線のクロスオーバー:
移動平均線のクロスオーバーを監視します。例えば、短期の移動平均線が長期の移動平均線を上抜けた場合、買いのシグナルとなる可能性があります。
シグナルのコンフルエンス:
複数のシグナルが一致する場合、最も良いトレード機会が生まれるかもしれません。例えば、強気のジグザグスイング、強気の平均足、移動平均線のクロスオーバーが揃うと、強力な買いシグナルとなる可能性があります。
免責事項
教育目的のみ: このインジケーターは教育目的で提供されており、トレードの決定を行う際の唯一の基準として使用すべきではありません。
保証なし: インジケーターは「現状のまま」提供されており、その正確性や完全性についての保証はありません。市場の状況は急速に変化する可能性があり、このインジケーターが常に最も正確な市場状況を反映するとは限りません。
十分なテストを: このスクリプトにはバグが存在する可能性があります。実際のトレードで使用する前に、デモ口座で十分にテストすることを強くお勧めします。
慎重に使用: このインジケーターを他の分析ツールと併用して使用してください。このインジケーターだけに頼ってトレードの決定を行うべきではありません。
突然の変更や削除の可能性: このインジケーターは予告なく変更や削除が行われる場合があります。そのため、利用者に不利益が生じる可能性がありますが、開発者はその責任を負いません。
このインジケーターを使用することで、これらの条件に同意したものとみなされます。

Pure Price Action Liquidity Sweeps [LuxAlgo]The Pure Price Action Liquidity Sweeps indicator is a pure price action adaptation of our previously published and highly popular Liquidity-Sweeps script.
Similar to its earlier version, this indicator detects the presence of liquidity sweeps on the user's chart, while also identifying potential areas of support/resistance or entry when liquidity levels are taken. The key difference, however, is that this price action version relies solely on price patterns, eliminating the need for numerical swing length settings.
🔶 USAGE
A Liquidity Sweep occurs when the price breaks through a liquidity level , after which the price returns below/above the liquidity level , forming a wick.
The examples below show a bullish and bearish scenario of "a wick passing through a liquidity level where the price quickly comes back".
Short-term liquidity sweep detection is based on short-term swing levels. Some of these short-term levels, depending on further market developments, may evolve into intermediate-term levels and, in the long run, become long-term levels. Therefore, enabling short-term detection with the script means showing all levels, including minor and temporal ones. Depending on the trader's style, some of these levels may be considered noise. Enabling intermediate and long-term levels can help filter out this noise and provide more significant levels for trading decisions. For further details on how swing levels are identified please refer to the details section.
The Intermediate-term option selection for the same chart as above, filters out minor or noisy levels, providing clearer and more significant levels for traders to observe.
🔶 DETAILS
The swing points detection feature relies exclusively on price action, eliminating the need for numerical user-defined settings.
The first step involves detecting short-term swing points, where a short-term swing high (STH) is identified as a price peak surrounded by lower highs on both sides. Similarly, a short-term swing low is recognized as a price trough surrounded by higher lows on both sides.
Intermediate-term swing and long-term swing points are detected using the same approach but with a slight modification. Instead of directly analyzing price candles, we now utilize the previously detected short-term swing points. For intermediate-term swing points, we rely on short-term swing points, while for long-term swing points, we use the intermediate-term ones.
🔶 SETTINGS
Detection: Period options of the detected swing points.
🔶 RELATED SCRIPTS
Pure-Price-Action-Structures.
Liquidity-Sweeps.

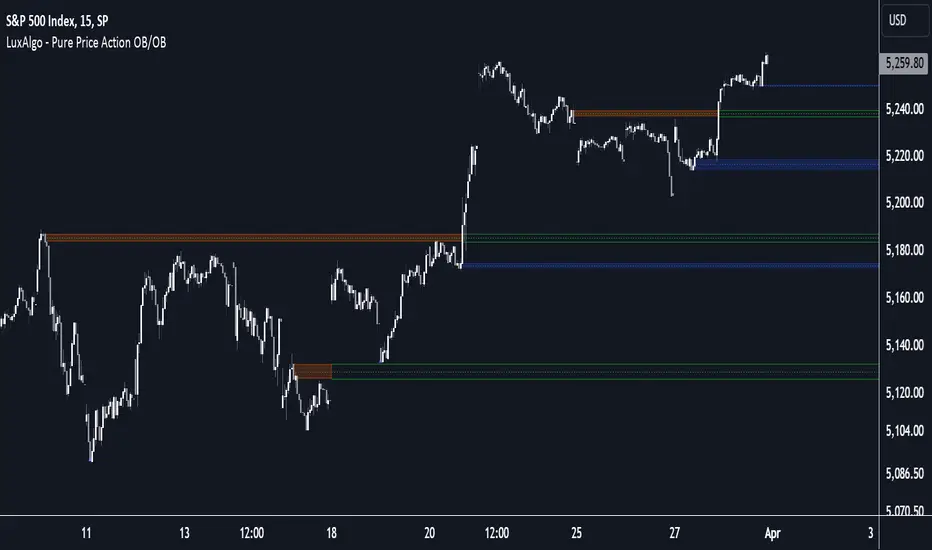
Pure Price Action Order & Breaker Blocks [LuxAlgo]The Pure Price Action Order & Breaker Blocks indicator is a pure price action adaptation of our previously published and highly popular Order-Blocks-Breaker-Blocks script.
Similar to its earlier version, this indicator detects order blocks that can automatically turn into breaker blocks on the chart once mitigated. However, the key difference/uniqueness is that the pure price action version relies solely on price patterns, eliminating the need for length definitions. In other words, it removes the limitation of user-defined inputs, ensuring a robust and objective analysis of market dynamics.
🔶 USAGE
An order block is a significant area on a price chart where there was a notable accumulation or distribution of orders, often identified by a strong price move followed by consolidation. Traders use order blocks to identify potential support or resistance levels.
A mitigated order block refers to an order block that has been invalidated due to subsequent market movements. It may no longer hold the same significance in the current market context. However, when the price mitigates an order block, a breaker block is confirmed. It is possible that the price might trade back to this breaker block, potentially offering a new trading opportunity.
Users can optionally enable the "Historical Polarity Changes" labels within the settings menu to see where breaker blocks might have previously provided effective trade setups.
This feature is most effective when using replay mode. Please note that these labels are subject to backpainting.
🔶 DETAILS
The swing points detection feature relies exclusively on price action, eliminating the need for numerical user-defined settings.
The first step involves detecting short-term swing points, where a short-term swing high (STH) is identified as a price peak surrounded by lower highs on both sides. Similarly, a short-term swing low is recognized as a price trough surrounded by higher lows on both sides.
Intermediate-term swing and long-term swing points are detected using the same approach but with a slight modification. Instead of directly analyzing price candles, we now utilize the previously detected short-term swing points. For intermediate-term swing points, we rely on short-term swing points, while for long-term swing points, we use the intermediate-term ones.
🔶 SETTINGS
Detection: Market structure used to detect swing points for creating order blocks.
Show Last Bullish OB: Number of the most recent bullish order/breaker blocks to display on the chart.
Show Last Bearish OB: Number of the most recent bearish order/breaker blocks to display on the chart.
Use Candle Body: Allows users to use candle bodies as order block areas instead of the full candle range.
🔹 Style
Show Historical Polarity Changes: Allows users to see labels indicating where a swing high/low previously occurred within a breaker block.
🔶 RELATED SCRIPTS
Pure-Price-Action-Structures.
Order-Blocks-Breaker-Blocks.
FVG (ICT) with Swing LevelsThis indicator, called "Fair Value Gaps (ICT) with Swing Levels", overlays on the main chart and does the following:
Initial Setup:
It defines user-adjustable parameters:
lookback: Lookback period to keep FVGs visible.
swingPeriod: Period for calculating swing highs and lows.
bullColor and bearColor: Colors for bullish and bearish FVGs.
Fair Value Gaps (FVGs) Detection:
Uses a function to identify FVGs by comparing candle high and low prices.
A bullish FVG forms when the low of two candles ago is higher than the high of the current candle.
A bearish FVG forms when the high of two candles ago is lower than the low of the current candle.
Swing Levels Calculation:
Calculates swing highs and lows over the specified period.
These swing levels define the current market range.
Current Range Verification:
Implements a function to check if an FVG is within the range defined by swing levels.
This ensures only the most relevant FVGs for the current market situation are displayed.
FVG Drawing:
When it detects an FVG (bullish or bearish) within the current range, it draws a box on the chart.
Boxes extend from the bar where the FVG formed to the current bar.
Bullish FVGs are drawn in green and bearish in red (colors are customizable).
Old FVGs Management:
On each new bar, the indicator checks all existing FVG boxes.
It removes boxes that are outside the specified lookback period.
It also removes boxes that are no longer within the current range of swing levels.
Swing Levels Visualization:
Draws lines on the chart to show swing highs (in blue) and swing lows (in purple).
These lines help visualize the current market range.
Continuous Update:
The indicator updates on each new candle, constantly refreshing FVGs and swing levels.
In summary, this indicator identifies and visualizes Fair Value Gaps according to the ICT methodology, filtering them based on higher timeframe swing levels. This helps traders focus on the most significant FVGs within the current market context, reducing visual noise and potentially improving trading decision-making.

ZigZag Library [TradingFinder]🔵 Introduction
The "Zig Zag" indicator is an analytical tool that emerges from pricing changes. Essentially, it connects consecutive high and low points in an oscillatory manner. This method helps decipher price changes and can also be useful in identifying traditional patterns.
By sifting through partial price changes, "Zig Zag" can effectively pinpoint price fluctuations within defined time intervals.
🔵 Key Features
1. Drawing the Zig Zag based on Pivot points :
The algorithm is based on pivots that operate consecutively and alternately (switch between high and low swing). In this way, zigzag lines are connected from a swing high to a swing low and from a swing low to a swing high.
Also, with a very low probability, it is possible to have both low pivots and high pivots in one candle. In these cases, the algorithm tries to make the best decision to make the most suitable choice.
You can control what period these decisions are based on through the "PiPe" parameter.
2.Naming and labeling each pivot based on its position as "Higher High" (HH), "Lower Low" (LL), "Higher Low" (HL), and "Lower High" (LH).
Additionally, classic patterns such as HH, LH, LL, and HL can be recognized. All traders analyzing financial markets using classic patterns and Elliot Waves can benefit from the "zigzag" indicator to facilitate their analysis.
" HH ": When the price is higher than the previous peak (Higher High).
" HL ": When the price is higher than the previous low (Higher Low).
" LH ": When the price is lower than the previous peak (Lower High).
" LL ": When the price is lower than the previous low (Lower Low).
🔵 How to Use
First, you can add the library to your code as shown in the example below.
import TFlab/ZigZagLibrary_TradingFinder/1 as ZZ
Function "ZigZag" Parameters :
🟣 Logical Parameters
1. HIGH : You should place the "high" value here. High is a float variable.
2. LOW : You should place the "low" value here. Low is a float variable.
3. BAR_INDEX : You should place the "bar_index" value here. Bar_index is an integer variable.
4. PiPe : The desired pivot period for plotting Zig Zag is placed in this parameter. For example, if you intend to draw a Zig Zag with a Swing Period of 5, you should input 5.
PiPe is an integer variable.
Important :
Apart from the "PiPe" indicator, which is part of the customization capabilities of this indicator, you can create a multi-time frame mode for the indicator using 3 parameters "High", "Low" and "BAR_INDEX". In this way, instead of the data of the current time frame, use the data of other time frames.
Note that it is better to use the current time frame data, because using the multi-time frame mode is associated with challenges that may cause bugs in your code.
🟣 Setting Parameters
5. SHOW_LINE : It's a boolean variable. When true, the Zig Zag line is displayed, and when false, the Zig Zag line display is disabled.
6. STYLE_LINE : In this variable, you can determine the style of the Zig Zag line. You can input one of the 3 options: line.style_solid, line.style_dotted, line.style_dashed. STYLE_LINE is a constant string variable.
7. COLOR_LINE : This variable takes the input of the line color.
8. WIDTH_LINE : The input for this variable is a number from 1 to 3, which is used to adjust the thickness of the line that draws the Zig Zag. WIDTH_LINE is an integer variable.
9. SHOW_LABEL : It's a boolean variable. When true, labels are displayed, and when false, label display is disabled.
10. COLOR_LABEL : The color of the labels is set in this variable.
11. SIZE_LABEL : The size of the labels is set in this variable. You should input one of the following options: size.auto, size.tiny, size.small, size.normal, size.large, size.huge.
12. Show_Support : It's a boolean variable that, when true, plots the last support line, and when false, disables its plotting.
13. Show_Resistance : It's a boolean variable that, when true, plots the last resistance line, and when false, disables its plotting.
Suggestion :
You can use the following code snippet to import Zig Zag into your code for time efficiency.
//import Library
import TFlab/ZigZagLibrary_TradingFinder/1 as ZZ
// Input and Setting
// Zig Zag Line
ShZ = input.bool(true , 'Show Zig Zag Line', group = 'Zig Zag') //Show Zig Zag
PPZ = input.int(5 ,'Pivot Period Zig Zag Line' , group = 'Zig Zag') //Pivot Period Zig Zag
ZLS = input.string(line.style_dashed , 'Zig Zag Line Style' , options = , group = 'Zig Zag' )
//Zig Zag Line Style
ZLC = input.color(color.rgb(0, 0, 0) , 'Zig Zag Line Color' , group = 'Zig Zag') //Zig Zag Line Color
ZLW = input.int(1 , 'Zig Zag Line Width' , group = 'Zig Zag')//Zig Zag Line Width
// Label
ShL = input.bool(true , 'Label', group = 'Label') //Show Label
LC = input.color(color.rgb(0, 0, 0) , 'Label Color' , group = 'Label')//Label Color
LS = input.string(size.tiny , 'Label size' , options = , group = 'Label' )//Label size
Show_Support= input.bool(false, 'Show Last Support',
tooltip = 'Last Support' , group = 'Support and Resistance')
Show_Resistance = input.bool(false, 'Show Last Resistance',
tooltip = 'Last Resistance' , group = 'Support and Resistance')
//Call Function
ZZ.ZigZag(high ,low ,bar_index ,PPZ , ShZ ,ZLS , ZLC, ZLW ,ShL , LC , LS , Show_Support , Show_Resistance )

Zigzag Fibonacci Golden Zone [UAlgo]🔶 Description:
The "Zigzag Fibonacci Golden Zone" aims to identify potential trend pullback points by utilizing a combination of zigzag patterns and Fibonacci "Golden Zone (0.618 - 0.786)" retracement levels. It plots zigzag lines on the price chart, highlighting significant swing highs and swing lows, and overlays Fibonacci retracement levels to indicate potential support and resistance zones. Additionally, it provides options to display buy and sell signals based on specific criteria.
🔶 Key Features:
Zigzag Lines: The indicator plots zigzag lines on the price chart, marking significant swing highs and swing lows. These lines help traders visualize the direction and magnitude of price swings.
Fibonacci Retracement Levels: The indicator overlays Fibonacci retracement levels on the chart, indicating potential support and resistance levels. These levels are derived from the Fibonacci sequence and are commonly used by traders to identify reversal points.
Fibonacci occurs again when a new zigzag low or high is created :
Before new zigzag low pivot appears,
After new Zigzag low pivot appears,
As you see new fibonacci created after new pivot found also price bounced from retracement zone.
Customization Options: Traders can customize various parameters of the indicator, such as the length of the zigzag pattern, color preferences for different elements, and visibility of price labels and buy/sell signals.
Buy/Sell Signals: The indicator generates buy and sell signals based on predefined criteria, such as price movements relative to Fibonacci levels and other market conditions. These signals can help traders identify potential entry and exit points in the market.
Example :
Disclaimer :
Please note that trading involves significant risk, and past performance is not indicative of future results. The "Zigzag Fibonacci Golden Zone" indicator is provided for informational purposes only and should not be considered financial advice. Traders should conduct their own research and analysis before making any investment decisions. Additionally, the indicator's performance may vary depending on market conditions and other factors. Users are encouraged to use the indicator as part of a comprehensive trading strategy and to exercise caution when trading in the financial markets.

Swing IdentifierThe "Swing Identifier" is a custom Pine Script indicator designed for use in the TradingView platform. It serves to visually identify and mark swing highs and swing lows on a trading chart, which are key concepts in technical analysis. This script is comprehensive and customizable, making it a useful tool for traders looking to pinpoint potential trend reversals and support or resistance areas.
**Key Features of the 'Swing Identifier' Indicator:**
1. **Swing Range Input:**
- This input determines the number of bars to the left and right of the current bar that the script will examine to identify a swing high or low. A larger value will look for swings over a broader range, potentially identifying more significant swings but at the expense of sensitivity.
2. **Swing Strength Input:**
- The swing strength is set as a percentage and is used to filter out insignificant price movements. A swing high or low is only considered valid if the percentage change from the last swing is greater than this input value. This feature helps in avoiding false signals in sideways or less volatile markets.
3. **Use Wicks Option:**
- Users can choose whether to consider the wicks of the candles or just the closing prices in identifying swings. This feature adds flexibility, allowing the script to be tailored to different trading styles and strategies.
4. **Line Color Customization:**
- The color of the lines marking the swings can be customized, enhancing the visual appeal and readability of the chart.
**Operational Mechanics:**
1. **Identification of Swing Highs and Lows:**
- The script uses the `ta.pivothigh` and `ta.pivotlow` functions to identify swing highs and lows. Whether it uses the high/low of the candles or their closing prices is determined by the user's choice in the "Use Wicks" option.
2. **Drawing and Updating Lines:**
- When a new swing high or low is identified, and it meets the percentage change criteria from the previous swing, a line is drawn from the last swing low to the current high (or vice versa). If a new swing high (or low) is identified that is higher (or lower) than the previous one, the old line is deleted, and a new line is drawn.
3. **Swing Update Logic:**
- The script maintains a toggle mechanism to look alternatively for highs and lows. This ensures that it sequentially identifies a high and then a low (or vice versa), which aligns with how actual market swings behave.
**Usage in Trading:**
1. **Identifying Trend Reversals:**
- By marking swing highs and lows, the script helps traders identify potential trend reversals. A break of a swing low in an uptrend or a swing high in a downtrend could signal a change in the prevailing trend.
2. **Support and Resistance:**
- Swing highs and lows often act as levels of support and resistance. Traders can use these levels for setting entry or exit points, stop losses, and take profit orders.
3. **Customization for Strategy:**
- The customizable nature of the script allows traders to adjust the parameters according to their trading strategy, time frame, and asset volatility.
In summary, the "Swing Identifier" is a versatile and customizable tool that aids in visually identifying crucial price swing points, thereby assisting traders in making informed decisions based on technical analysis principles.

Liquidity Levels/Voids (VP) [LuxAlgo]The Liquidity Levels/Voids (VP) is a script designed to detect liquidity voids & levels by measuring traded volume at all price levels on the market between two swing points and highlighting the distribution of the liquidity voids & levels at specific price levels.
🔶 USAGE
Liquidity is a fundamental market force that shapes the trajectory of assets.
The creation of a liquidity level comes as a result of an initial imbalance of supply/demand, which forms what we know as a swing high or swing low. As more players take positions in the market, these are levels that market participants will use as a historical reference to place their stops. When the levels are then re-tested, a decision will be made. The binary outcome here can be a breakout of the level or a reversal back to the mean.
Liquidity voids are sudden price changes that occur in the market when the price jumps from one level to another with little trading activity (low volume), creating an imbalance in price. The price tends to fill or retest the liquidity voids area, and traders understand at which price level institutional players have been active.
Liquidity voids are a valuable concept in trading, as they provide insights about where many orders were injected, creating this inefficiency in the market. The price tends to restore the balance.
🔶 SETTINGS
The script takes into account user-defined parameters and detects the liquidity voids based on them, where detailed usage for each user-defined input parameter in indicator settings is provided with the related input's tooltip.
🔹 Liquidity Levels / Voids
Liquidity Levels/Voids: Color customization option for Unfilled Liquidity Levels/Voids.
Detection Length: Lookback period used for the calculation of Swing Levels.
Threshold %: Threshold used for the calculation of the Liquidity Levels & Voids.
Sensitivity: Adjusts the number of levels between two swing points, as a result, the height of a level is determined, and then based on the above-given threshold the level is checked if it matches the liquidity level/void conditions.
Filled Liquidity Levels/Voids: Toggles the visibility of the Filled Liquidity Levels/Voids and color customization option for Filled Liquidity Levels/Voids.
🔹 Other Features
Swing Highs/Lows: Toggles the visibility of the Swing Levels, where tooltips present statistical information, such as price, price change, and cumulative volume between the two swing levels detected based on the detection length specified above, Coloring options to customize swing low and swing high label colors, and Size option to adjust the size of the labels.
🔹 Display Options
Mode: Controls the lookback length of detection and visualization.
# Bars: Lookback length customization, in case Mode is set to Present.
🔶 RELATED SCRIPTS
Liquidity-Voids-FVG
Buyside-Sellside-Liquidity
Swing-Volume-Profiles

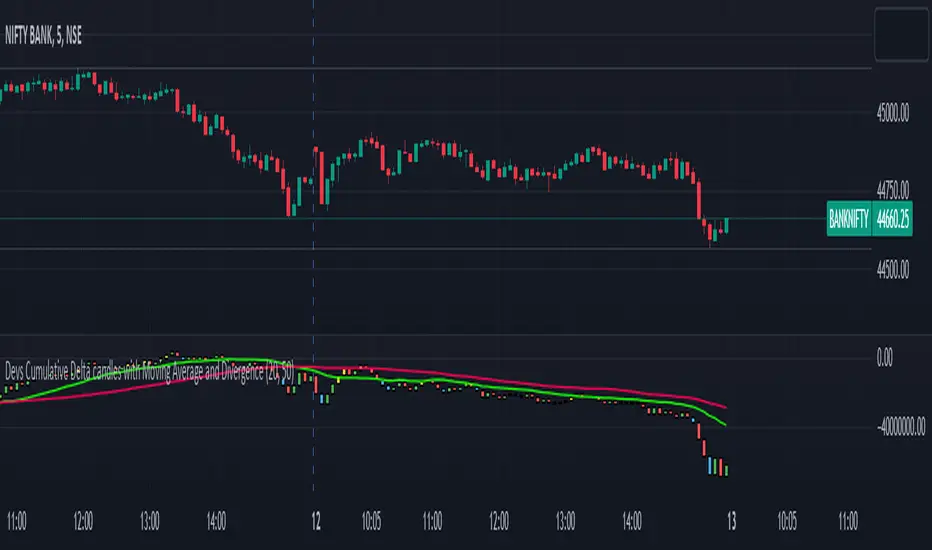
Devs Cumulative Delta candles with Moving Average and DivergenceDELTA = BUY Volume – SELL Volumes
Delta = Positive => Aggressiveness on the Buy side
Delta = Negative => Aggressiveness on the Sell side
If delta is greater than 0 you have more buying than selling pressure. If delta is less than 0, you have more selling than buying pressure.
When there is more Buying than Selling (Delta=Positive), the price candle is Green and when there is more Selling than Buying (Delta=Negative), the price candle is Red. We use delta to understand the relationship between buying or selling pressure and price.
Let’s imagine a price bar that reached the low for the day but delta was actually positive and the bar closed higher than it opened.
In simple terms we can describe this as:
Price made a new low
The bar closed higher
Delta demonstrated more buying than selling : Volume delta is a key metric to understand when making trading decisions based on volume and order flow. However, on its own it can be too much information to interpret quickly when trading in a volatile market.
What are Delta Bars?
Delta Bars is a candlestick representation of Delta. In other words, it has an Open, High (also called Delta Max), Low (also called Delta Min) and Close point in every candle (1min, 5min, 30min etc.)
The Delta Open in every candle is always 0
The Delta Close is the cumulative BUY less cumulative SELL at the close if the candle
The Delta Max is the maximum value of Delta during the candle session (lowest Delta Max possible = 0)
The Delta Min is the minimum value of Delta during the candle session (highest Delta Min possible = 0) The Delta bars are uncorrelated to the Tick Multiplier of the symbol.
Generally you would expect Price to move UP when Delta is positive and Price to move DOWN when Delta is negative. So what happens when the above rule is not followed. We have Divergence
Divergence:
Any two parameters that should be in sync (Price and Delta in this case) towards supporting a particular move (Up or Down) but are in reality not (in sync) form a Divergence
Cumulative volume delta takes the delta values for every bar and successively adds them together to visually provide as seen in the chart.
While volume delta is great for comparing delta bar to bar, cumulative volume delta is useful when determining buying or selling pressure at different price levels such as swing highs or lows. I just gave you a details regarding delta and delta bars.
What details would you see in the indicator??
When you apply this indicator on the chart, you will find the CD(Cumulative delta) candles, which move up and down the way price moves in a chart. Moreover, in case of a divergence, you will find a change in colour of delta candles. If the price is still green but the delta is negative, you will find a bullish divergence, marked with Yellow colour and if the price is red and you have a positive delta, you will have a bearish divergence, marked with blue coloured delta candle. Usually it has been seen that a repeated divergence generally depicts end of a trend or slow down of a trend.
Moreover, I have placed 2 moving averages in the script which you can customize as per your needs. I prefer 20 and 50 day MA for better accuracy as most reversals happen at 20 and 50 day MA.
This indicator works in almost all index, stocks, currencies excepting few where the volume past is invisible. This indicator purely works taking the buying and selling volume into consideration. Sometimes when you change the timeframe in chart, you may have to manually adjust for the display in chart.
SMT Divergences [LuxAlgo]The SMT Divergences indicator highlights SMT divergences between the chart symbol and two user-selected tickers (ES and YM by default).
A dashboard returning the SMT divergences statistics is also provided within the settings.
🔶 SETTINGS
Swing Lookback: Calculation window used to detect swing points.
Comparison Ticker: If enabled, will detect SMT divergences between the chart prices and the prices of the selected ticker.
🔹 Dashboard
Show Dashboard: Displays statistics dashboard on the chart.
Location: Location of the dashboard on the chart.
Size: Size of the displayed dashboard.
🔶 USAGE
SMT Divergences are characterized by diverging swing points between two securities.
The detection of SMT Divergences is performed by detecting swing points using the user chart prices as well as the prices of the selected external tickers. If a swing point on the chart ticker is detected at the same time on external tickers, comparison is performed.
Due to the detection requiring swing point confirmation (3 candles by default), this indicator can better be used to study price behaviors on the occurrence of an SMT divergence.
The dashboard highlights the number of SMT divergences that occurred on a swing high and swing low between the chart ticker and the selected external tickers.
The returned percentage indicates the proportion of swing highs or swing lows that led to an SMT divergence.

Candle Trend Counter [theEccentricTrader]█ OVERVIEW
This indicator counts the number of confirmed candle trend scenarios on any given candlestick chart and displays the statistics in a table, which can be repositioned and resized at the user's discretion.
█ CONCEPTS
Green and Red Candles
• A green candle is one that closes with a high price equal to or above the price it opened.
• A red candle is one that closes with a low price that is lower than the price it opened.
Swing Highs and Swing Lows
• A swing high is a green candle or series of consecutive green candles followed by a single red candle to complete the swing and form the peak.
• A swing low is a red candle or series of consecutive red candles followed by a single green candle to complete the swing and form the trough.
Muti-Part Green and Red Candle Trends
• A multi-part green candle trend begins upon the completion of a swing low and continues until a red candle completes the swing high, with each green candle counted as a part of the trend.
• A multi-part red candle trend begins upon the completion of a swing high and continues until a green candle completes the swing low, with each red candle counted as a part of the trend.
█ FEATURES
Inputs
Start Date
End Date
Position
Text Size
Show Sample Period
Show Plots
Table
The table is colour coded, consists of seven columns and, as many as, thirty-one rows. Blue cells denote the multi-part candle trend scenarios, green cells denote the corresponding green candle trend scenarios and red cells denote the corresponding red candle trend scenarios.
The candle trend scenarios are listed in the first column with their corresponding total counts to the right, in the second column. The last row in column one, displays the sample period which can be adjusted or hidden via indicator settings.
The third column displays the total candle trend scenarios as percentages of total 1-candle trends, or complete swing highs and swing lows. And column four displays the total candle trend scenarios as percentages of the, last, or preceding candle trend part. For example 4-candle trends as a percentage of 3-candle trends. This offers more insight into what might happen next at any given point in time.
Plots
I have added plots as a visual aid to the various candle trend scenarios listed in the table. Green up-arrows, with the number of the trend part, denote green candle trends. Red down-arrows, with the number of the trend part, denote red candle trends.
█ HOW TO USE
This indicator is intended for research purposes, strategy development and strategy optimisation. I hope it will be useful in helping to gain a better understanding of the underlying dynamics at play on any given market and timeframe.
It can, for example, give you an idea of whether the next candle will close higher or lower than it opened, based on the current scenario and what has happened in the past under similar circumstances. Such information can be very useful when conducting top down analysis across multiple timeframes and making strategic decisions.
What you do with these statistics and how far you decide to take your research is entirely up to you, the possibilities are endless.
█ LIMITATIONS
Some higher timeframe candles on tickers with larger lookbacks such as the DXY , do not actually contain all the open, high, low and close (OHLC) data at the beginning of the chart. Instead, they use the close price for open, high and low prices. So, while we can determine whether the close price is higher or lower than the preceding close price, there is no way of knowing what actually happened intra-bar for these candles. And by default candles that close at the same price as the open price, will be counted as green. You can avoid this problem by utilising the sample period filter.
The green and red candle calculations are based solely on differences between open and close prices, as such I have made no attempt to account for green candles that gap lower and close below the close price of the preceding candle, or red candles that gap higher and close above the close price of the preceding candle. I can only recommend using 24-hour markets, if and where possible, as there are far fewer gaps and, generally, more data to work with. Alternatively, you can replace the scenarios with your own logic to account for the gap anomalies, if you are feeling up to the challenge.
It is also worth noting that the sample size will be limited to your Trading View subscription plan. Premium users get 20,000 candles worth of data, pro+ and pro users get 10,000, and basic users get 5,000. If upgrading is currently not an option, you can always keep a rolling tally of the statistics in an excel spreadsheet or something of the like.

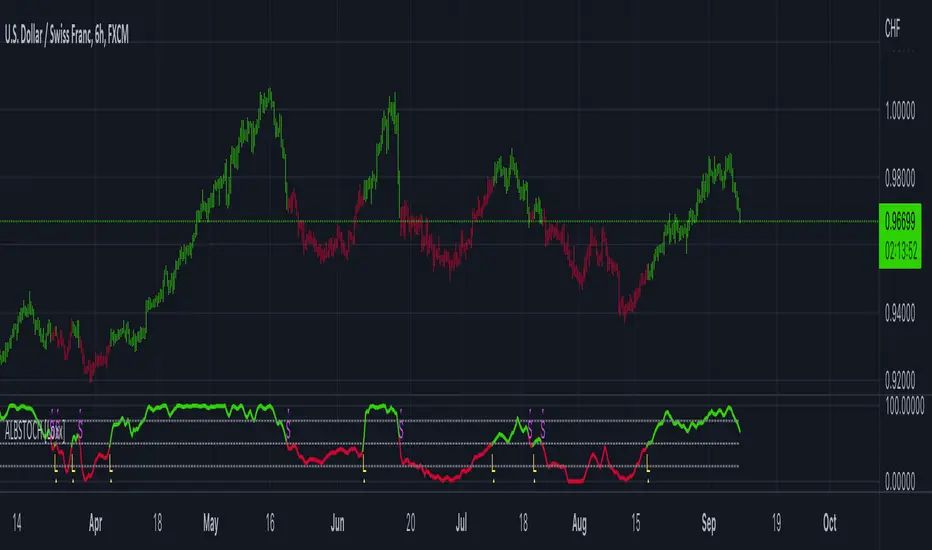
Swing Levels and Liquidity - By LeviathanThis script will plot pivot points (swing highs and lows) in the form of lines, boxes or labels to help you identify market structure, “liquidity” areas, swing failure patterns, etc. You are also able to see the volume traded at each pivot point, which will help you compare their significance.
Bars Left-Right
A pivot high (swing high) is a bar in a series of bars that has a higher value than the bars around it and a pivot low (swing low) is a bar in a series of bars that has a lower value than the bars surrounding it. The Bars Left and Bars Right parameters are used to define the number of bars on the left and right sides of a pivot point that the function should consider when identifying pivot highs and lows in a time series. For example, if Bars Left is set to 5 and Bars Right is set to 6, the function will look for a pivot point by comparing the value of the current bar with the values of the 5 bars to its left and the 6 bars to its right. If the value of the current bar is higher than all of these bars, it is considered a pivot high point. These parameter can be used to adjust the sensitivity of the script (lowering the Bars Left and Bars Right parameters will give you more swing points and increasing the Bars Left and Bars Right parameters will give you fewer swing points).
”Show Boxes” - This will draw a box above the swing high and a box below the swing low to help you visualise a large area of interest around swing points. Additional box types and the width of the box can be adjusted in Appearance settings below.
”Show Lines” - This will draw a horizontal line at the level of each swing high and swing low.
”Show Labels” - This will plot a circle at the high point of each swing high and at the low point of each swing low.
”Show Volume” - This will display the amount of volume traded in a given swing point candle. It can help you identify the significance of a given swing point by comparing it to the volumes of other swing points.
”Extend Until Filled” - This will extend the swing point levels until they are mitigated by the price. Turning it off will continue plotting the levels just a few more bars after a swing point occurs.
”Appearance” - You can show/hide swing points, choose the colors of labels, lines and boxes, choose the size and positioning of the text, choose line and box appearance (adjust the Box Width when switching between timeframes!) and more.
More updates coming soon (MTF, more data…)

Market Structure - By LeviathanThis indicator helps you identify market structure by plotting swing highs and lows (HH, LH, HL, LL), BOS/CHOCH and 0.5 retracement levels. Other functionalities will be added in future updates.
Indicator Settings Overview
SWING LENGTH
The number of leftbars and rightbars when searching for swing points. The lower the value, the more swing points are shown and the higher the value, the less swing points are shown. I suggest adjusting it to fit your style and when switching between different timeframes.
BOS CONFIRMATION
Choose whether a Break of Structure is determined by a candle close or a wick breaching previous swing point. Using the "Wick" confirmation option will result in more breaks of structure.
CHOCH
Turning this ON renames the first counter trend Break of Structure (BOS) to CHoCH (Change of Character) and therefore signaling a possible trend shift.
SHOW 0.5 RETRACEMENT LEVEL
This will show a level halfway between a swing low and a swing high of an expansion move, which can act as an approximate retracement point if the trend continues.
In uptrends, 0.5 level is drawn between Higher Lows (HL) and Higher Highs ( HHs ). Long entries can be placed around that level if you suspect that the uptrend will continue.
In downtrends, 0.5 level is drawn between Lower Highs (LH) and Lower Lows (LLs). Short entries can be placed around that level if you suspect that the downtrend will continue.
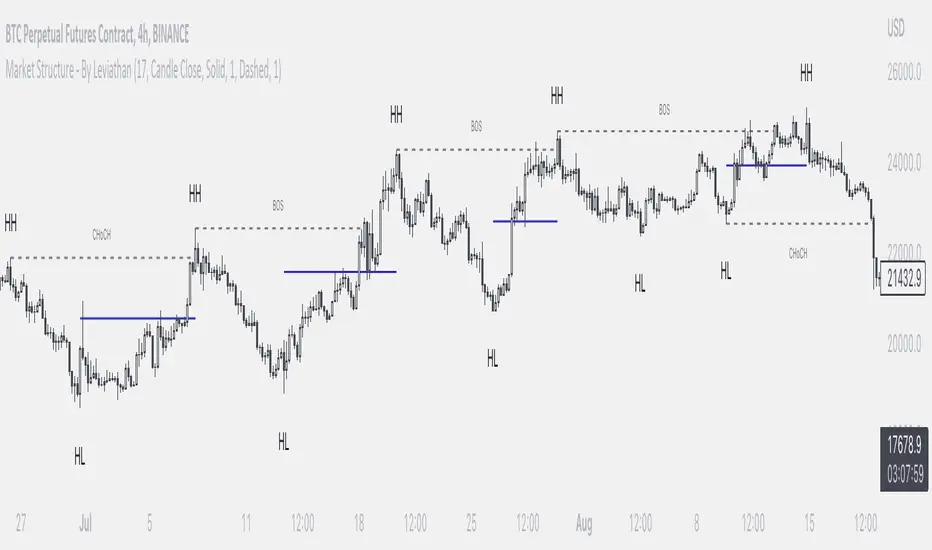
MTF CCI + Realtime DivergencesMulti-timeframe Commodity Channel Index (CCI) + Realtime Divergences + Alerts
This version of the CCI includes the following features:
- Optional 2x sets of triple-timeframe overbought and oversold signals with fully configurable timeframes and overbought and oversold thresholds, can indicate where 3 selected timeframes are all overbought or all oversold at the same time, with alert option.
- Optional divergence lines drawn directly onto the oscillator in realtime, with alert options.
- Configurable pivot periods to fine tune the divergences drawn in order to suit different trading styles and timeframes, including the ability to enable automatic adjustment of pivot period per chart timeframe.
- Alternate timeframe feature allows you to configure the oscillator to use data from a different timeframe than the chart it is loaded on.
- 'Hide oscillator' feature allows traders to hide the oscillator itself, leaving only the background colours indicating the overbought and oversold periods and/or MTF overbought and oversold confluences, as seen in the chart image.
- Also includes standard configurable CCI options, including CCI length and source type. Defaults set to length 20, and hlc3 source type.
- Optional Flip oscillator feature, allows users to flip the oscillator upside down, for use with Tradingviews 'Flip chart' feature (Alt+i), for the purpose of manually spotting divergences, where the trader has a strong natural bias in one direction, so that they can flip both the chart and the oscillator.
- Optional 'Fade oscillator' feature, which will fade out all but the most recent period, reducing visual noise on the chart.
While this version of the CCI has the ability to draw divergences in realtime along with related alerts so you can be notified as divergences occur without spending all day watching the charts, the main purpose of this indicator was to provide the triple-timeframe overbought and oversold confluence signals, in an attempt to add more confluence, weight and reliability to the single timeframe overbought and oversold states, commonly used for trade entry confluence. It's primary purpose is intended for scalping reversal trades on lower timeframes, typically between 1-15 minutes, which can be used in conjunction with the regular divergences the indicator can highlight. The triple timeframe overbought can often indicate near term reversals to the downside, with the triple timeframe oversold often indicating neartime reversals to the upside. The default timeframes for this confluence are set to check the 1m, 5m and 15m timeframes together, ideal for scalping the < 15 minute charts. The default settings for the MTF #1 timeframes (1m, 5m and 15m) are best used on a <5 minute chart.
Its design and use case is based upon the original MTF Stoch RSI + Realtime Divergences found here .
Commodity Channel Index (CCI)
Investopedia has described the popular oscillator as follows:
“The Commodity Channel Index (CCI) is a momentum-based oscillator used to help determine when an investment vehicle is reaching a condition of being overbought or oversold.
Developed by Donald Lambert, this technical indicator assesses price trend direction and strength, allowing traders to determine if they want to enter or exit a trade, refrain from taking a trade, or add to an existing position. In this way, the indicator can be used to provide trade signals when it acts in a certain way.”
You can read more about the CCI, its use cases and calculations here .
How do traders use overbought and oversold levels in their trading?
The oversold level, that is traditionally when the CCI is above the 100 level is typically interpreted as being 'overbought', and below the -100 level is typically considered 'oversold'. Traders will often use the CCI at an overbought level as a confluence for entry into a short position, and the CCI at an oversold level as a confluence for an entry into a long position. These levels do not mean that price will necessarily reverse at those levels in a reliable way, however. This is why this version of the CCI employs the triple timeframe overbought and oversold confluence, in an attempt to add a more confluence and reliability to this usage of the CCI. While traditionally, the overbought and oversold levels are below -100 for oversold, and above 100 for overbought, he default threshold settings of this indicator have been increased to provide fewer, stronger signals, especially suited to the low timeframes and highly volatile assets.
What are divergences?
Divergence is when the price of an asset is moving in the opposite direction of a technical indicator, such as an oscillator, or is moving contrary to other data. Divergence warns that the current price trend may be weakening, and in some cases may lead to the price changing direction.
There are 4 main types of divergence, which are split into 2 categories;
regular divergences and hidden divergences. Regular divergences indicate possible trend reversals, and hidden divergences indicate possible trend continuation.
Regular bullish divergence: An indication of a potential trend reversal, from the current downtrend, to an uptrend.
Regular bearish divergence: An indication of a potential trend reversal, from the current uptrend, to a downtrend.
Hidden bullish divergence: An indication of a potential uptrend continuation.
Hidden bearish divergence: An indication of a potential downtrend continuation.
How do traders use divergences in their trading?
A divergence is considered a leading indicator in technical analysis , meaning it has the ability to indicate a potential price move in the short term future.
Hidden bullish and hidden bearish divergences, which indicate a potential continuation of the current trend are sometimes considered a good place for traders to begin, since trend continuation occurs more frequently than reversals, or trend changes.
When trading regular bullish divergences and regular bearish divergences, which are indications of a trend reversal, the probability of it doing so may increase when these occur at a strong support or resistance level . A common mistake new traders make is to get into a regular divergence trade too early, assuming it will immediately reverse, but these can continue to form for some time before the trend eventually changes, by using forms of support or resistance as an added confluence, such as when price reaches a moving average, the success rate when trading these patterns may increase.
Typically, traders will manually draw lines across the swing highs and swing lows of both the price chart and the oscillator to see whether they appear to present a divergence, this indicator will draw them for you, quickly and clearly, and can notify you when they occur.
Setting alerts.
With this indicator you can set alerts to notify you when any/all of the above types of divergences occur, on any chart timeframe you choose, and also when the triple timeframe overbought and oversold confluences occur.
Configurable pivot period.
You can adjust the default pivot period values to suit your prefered trading style and timeframe. If you like to trade a shorter time frame, lowering the default lookback values will make the divergences drawn more sensitive to short term price action. By default, this indicator has enabled the automatic adjustment of the pivot periods for 4 configurable timeframes, in a bid to optimise the divergences drawn when the indicator is loaded onto any of the 4 timeframes. These timeframes and the auto adjusted pivot periods on each of them can also be reconfigured within the settings menu.
Disclaimer: This script includes code adapted from the Divergence for Many Indicators v4 by LonesomeTheBlue . With special thanks.

UFO + Realtime Divergences (UO x MFI)UFO + Realtime Divergences (UO x MFI) + Alerts
The UFO is a hybrid of two powerful oscillators - the Ultimate Oscillator (UO) and the Money Flow Index (MFI)
Features of the UFO include:
- Optional divergence lines drawn directly onto the oscillator in realtime.
- Configurable alerts to notify you when divergences occur, as well as centerline crossovers.
- Configurable lookback periods to fine tune the divergences drawn in order to suit different trading styles and timeframes.
- Background colouring option to indicate when the oscillator has crossed its centerline.
- Alternate timeframe feature allows you to configure the oscillator to use data from a different timeframe than the chart it is loaded on.
- 2x MTF triple-timeframe Stochastic RSI overbought and oversold confluence signals painted at the top of the panel for use as a confluence for reversal entry trades.
The core calculations of the UFO+ combine the factory settings of the Ultimate Oscillator and Money Flow Index, taking an average of their combined values for its output eg:
UO_Value + MFI_Value / 2
The result is a powerful oscillator capable of detecting high quality divergences, including on very low timeframes and highly volatile markets, it benefits from the higher weighting of the most recent price action provided by the Ultimate Oscillators calculations, as well as the calculation of the MFI, which incorporates volume data. The UFO and its incorporated 2x triple-timeframe MTF Stoch RSI overbought and oversold signals makes it well adapted for low timeframe scalping and regular divergence trades in particular.
The Ultimate Oscillator (UO)
Tradingview describes the Ultimate Oscillator as follows:
“The Ultimate Oscillator indicator (UO) is a technical analysis tool used to measure momentum across three varying timeframes. The problem with many momentum oscillators is that after a rapid advance or decline in price, they can form false divergence trading signals. For example, after a rapid rise in price, a bearish divergence signal may present itself, however price continues to rise. The Ultimate Oscillator attempts to correct this by using multiple timeframes in its calculation as opposed to just one timeframe which is what is used in most other momentum oscillators.”
You can read more about the UO and its calculations here
The Money Flow Index ( MFI )
Investopedia describes the True Strength Indicator as follows:
“The Money Flow Index ( MFI ) is a technical oscillator that uses price and volume data for identifying overbought or oversold signals in an asset. It can also be used to spot divergences which warn of a trend change in price. The oscillator moves between 0 and 100. Unlike conventional oscillators such as the Relative Strength Index ( RSI ), the Money Flow Index incorporates both price and volume data, as opposed to just price. For this reason, some analysts call MFI the volume-weighted RSI .”
You can read more about the MFI and its calculations here
The Stochastic RSI (relating to the built-in MTF Stoch RSI feature)
The popular oscillator has been described as follows:
“The Stochastic RSI is an indicator used in technical analysis that ranges between zero and one (or zero and 100 on some charting platforms) and is created by applying the Stochastic oscillator formula to a set of relative strength index ( RSI ) values rather than to standard price data. Using RSI values within the Stochastic formula gives traders an idea of whether the current RSI value is overbought or oversold. The Stochastic RSI oscillator was developed to take advantage of both momentum indicators in order to create a more sensitive indicator that is attuned to a specific security's historical performance rather than a generalized analysis of price change.”
You can read more about the Stochastic RSI and its calculations here
How do traders use overbought and oversold levels in their trading?
The oversold level, that is when the Stochastic RSI is above the 80 level is typically interpreted as being 'overbought', and below the 20 level is typically considered 'oversold'. Traders will often use the Stochastic RSI at an overbought level as a confluence for entry into a short position, and the Stochastic RSI at an oversold level as a confluence for an entry into a long position. These levels do not mean that price will necessarily reverse at those levels in a reliable way, however. This is why this version of the Stoch RSI employs the triple timeframe overbought and oversold confluence, in an attempt to add a more confluence and reliability to this usage of the Stoch RSI .
What are divergences?
Divergence is when the price of an asset is moving in the opposite direction of a technical indicator, such as an oscillator, or is moving contrary to other data. Divergence warns that the current price trend may be weakening, and in some cases may lead to the price changing direction.
There are 4 main types of divergence, which are split into 2 categories;
regular divergences and hidden divergences. Regular divergences indicate possible trend reversals, and hidden divergences indicate possible trend continuation.
Regular bullish divergence: An indication of a potential trend reversal, from the current downtrend, to an uptrend.
Regular bearish divergence: An indication of a potential trend reversal, from the current uptrend, to a downtrend.
Hidden bullish divergence: An indication of a potential uptrend continuation.
Hidden bearish divergence: An indication of a potential downtrend continuation.
How do traders use divergences in their trading?
A divergence is considered a leading indicator in technical analysis , meaning it has the ability to indicate a potential price move in the short term future.
Hidden bullish and hidden bearish divergences, which indicate a potential continuation of the current trend are sometimes considered a good place for traders to begin, since trend continuation occurs more frequently than reversals, or trend changes.
When trading regular bullish divergences and regular bearish divergences, which are indications of a trend reversal, the probability of it doing so may increase when these occur at a strong support or resistance level . A common mistake new traders make is to get into a regular divergence trade too early, assuming it will immediately reverse, but these can continue to form for some time before the trend eventually changes, by using forms of support or resistance as an added confluence, such as when price reaches a moving average, the success rate when trading these patterns may increase.
Typically, traders will manually draw lines across the swing highs and swing lows of both the price chart and the oscillator to see whether they appear to present a divergence, this indicator will draw them for you, quickly and clearly, and can notify you when they occur.
Setting alerts.
With this indicator you can set alerts to notify you when any/all of the above types of divergences occur, on any chart timeframe you choose.
Configurable pivot period.
You can adjust the default pivot lookback values to suit your prefered trading style and timeframe. If you like to trade a shorter time frame, lowering the default lookback values will make the divergences drawn more sensitive to short term price action.
Disclaimer: This script includes code from the stock UO and MFI by Tradingview as well as the Divergence for Many Indicators v4 by LonesomeTheBlue.

Adaptive-Lookback Stochastic [Loxx]Adaptive-Lookback Stochastic is an adaptive stochastic indicator.
The Adaptive lookback is truly a market-driven period input used to determine the variable lookback period for many different indicators, instead of a traditional, fixed figure.
It is based on the frequency of market swings - the time between swing highs or swing lows. A swing high is defined as two consecutive higher highs followed by two consecutive lower highs; a swing low is defined by two consecutive lower lows followed by two consecutive higher lows. As swing points typically accompany reversals, they occur more frequently in choppier and volatile markets than in trends.
Adaptive lookback period is determined as :
Determine the initial number of swing points (swing count parameter) to use in the calculation.
Count the number of price bars it takes for the n swing points to form.
Divide step 2 by step 1 and round the result.
As an addition, adjust the "speed" of the produced period using the speed parameter - the smaller the speed parameter, the "slower" the average, and vice versa
Included
Bar coloring
Loxx Expanded Source Types
3 types of signals: levels crosses, slope, and middle crosses
Alerts