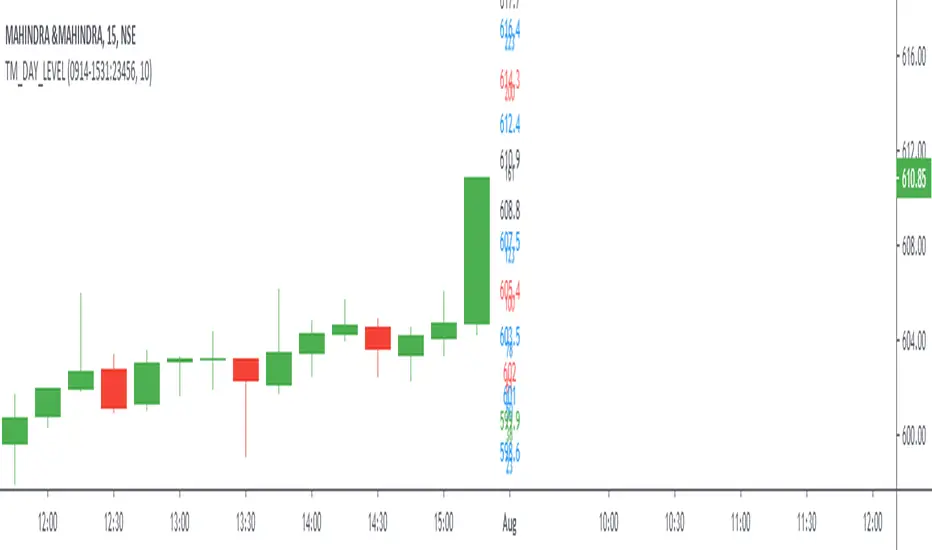
TM_DAY_LEVELDay level Indicator shows overall market price structure of market for Intraday Position.
Terminology Use ==> Price Line, Price Level name and Price level
Timeframe ==> Use proper Signal with swing trend on 15 Min. or lower time frame (Best if Use with 15 Minutes chart or 5 Min. chart).
What to Identify ==> Overall market price structure for the Intraday Period
How to Use ==>
There are Many Line in price level chart
Green/red with Solid for important area of support or resistance
Other dotted lines are for retracement or extension of prices.
Important Structure==> Price behaviors on all lines of possible support and resistance
Use market structure, chart pattern, trend lines for more support..
Entry ==>
Let’s wait the proper area of support or resistance (Area of Value in case of trend pattern use)
Exit ==>
SL of swing high/low out of market structure with proper risk management and target with proper Risk/ Reward Ratio
스크립트에서 "swing high low"에 대해 찾기
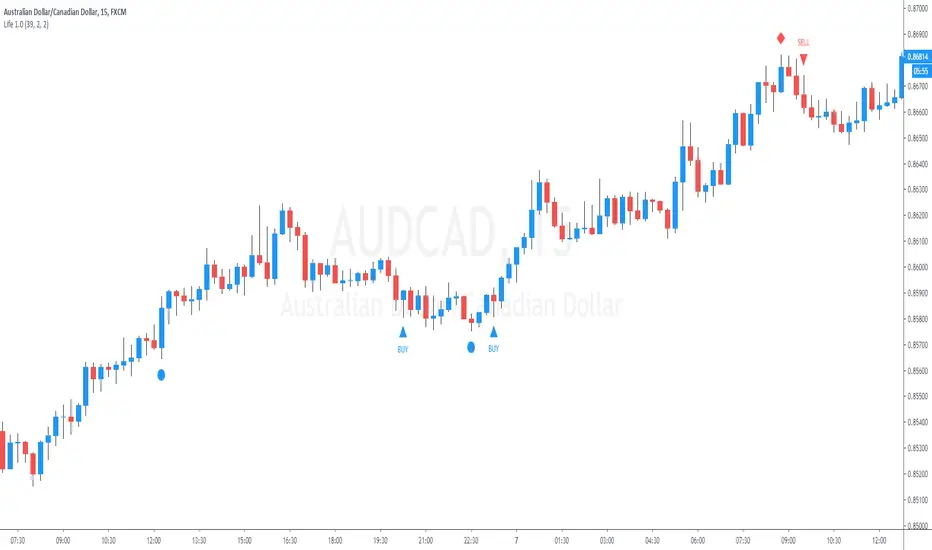
25 Life Bank BreakOutThis indicator allows the user to visually identify a swing High/Low and place a marker which will measure 2 candles either side of the swing point for the lowest body.
Once identified apply a 50% Fib to the body to ID a break out point and allow an alert to be placed.
Subsequently measures a 25% fib retracement of the breakout for a potential entry point. Alerts may also be created.
This does not provide trading signals nor is designed to do so.
It is not a trading strategy.
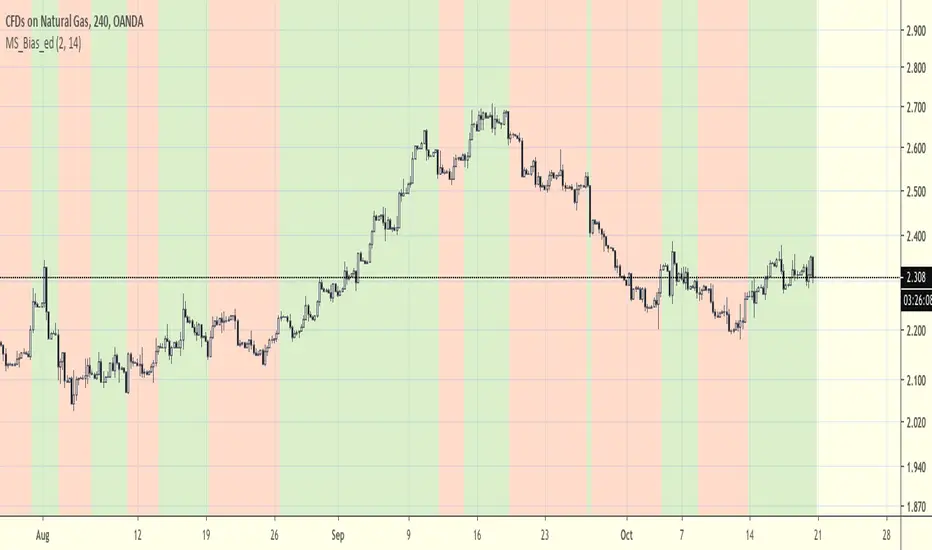
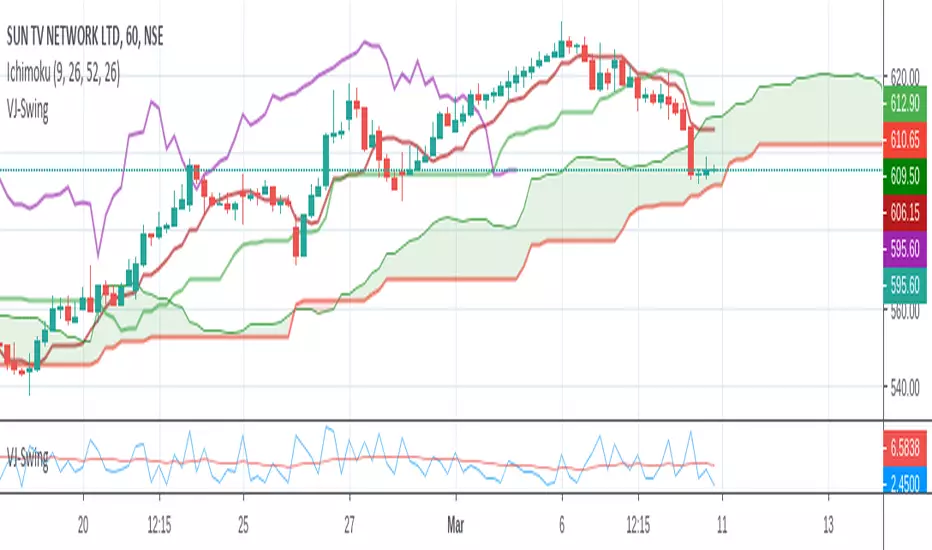
VJ Swing IndicatorThis indicator plots swing (high-low). It goes well with default Ichimoku cloud. It also has EMA over 26 periods. It can be used during scalping / intraday.
Aggressive Pullback IndicatorThis indicator is designed to be used with the rules of Steven Hart's Aggressive Pullback Strategy. It is intended for use on the 4-hour timeframe but will work on all timeframes. The rules are customizable, but the default settings are:
Minimum Candle Pullback: 2
How Many Candles We Can Engulf: 3
Override Rule #2 If Candle's Body % of ATR Is Less Than: 99%
ATR Length: 14
EMA Length (close): 50
How Far To Look Back For Swings: 5 bars (this is used to invalidate engulfing candles that close above the swing high/lows that started the 2 candle pullback)
Visit www.thetradingchannel.net or www.youtube.com for information on how to use the strategy correctly (and profitably)!
* Note that like all indicators, it is not 100% accurate and will miss some signals. But it does catch the majority of them :)

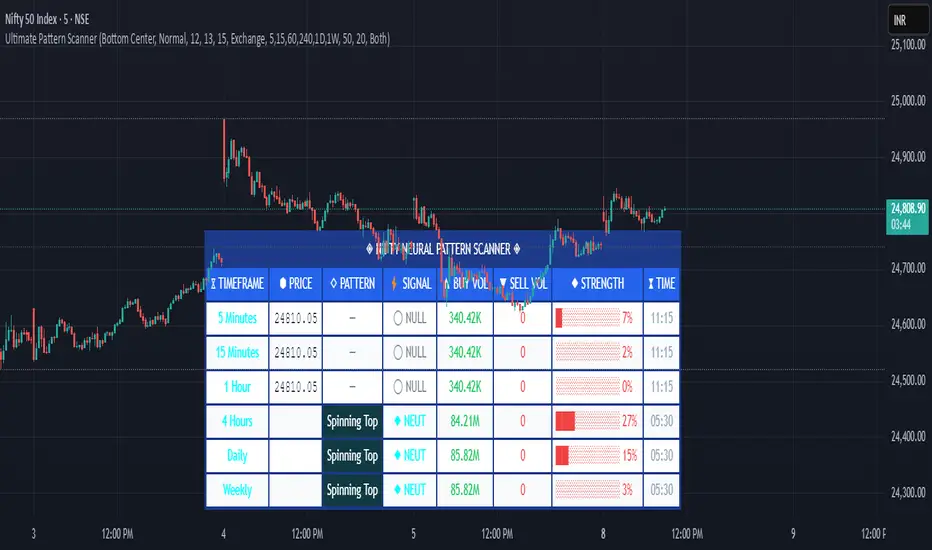
Pattern ScannerUltimate Pattern Scanner — multi-timeframe candlestick discovery tool (educational use only).
Purpose: This script scans user-selected timeframes for classical candlestick patterns (for example: engulfing, morning/evening stars, hammers, dojis, tasuki gaps, three soldiers/crows, tweezers, marubozu, and others) and reports pattern name, detection price, directional signal (Bull / Bear / Neutral), and a simple volume participation metric. It is intended as an idea-generation and training tool to help traders learn pattern mechanics, not as an automated trading system.
Main modules and rationale: 1) Pattern engine — applies classical candle structure rules to detect formations; 2) SMA trend filter (configurable length) — provides a directional bias to favor trade-with-trend setups; 3) Volume heuristic — approximates participation by separating candles into buy-like and sell-like volume and comparing total volume to a moving average; 4) Multi-timeframe aggregator — collects and presents pattern results from multiple timeframes; 5) Alerts — optional alerts list detected patterns and TFs. Combining these modules is intentional: patterns provide structure, SMA provides context, and volume supplies participation confirmation. Together they improve the educational value and practical relevance of each detected pattern.
How to use: Choose timeframes and SMA length that match your trading horizon. Use the scanner to locate pattern candidates, then confirm with higher-timeframe agreement and volume ratio before considering trade entry. Use structural stops (recent swing highs/lows or ATR-based stops) and define risk:reward rules. For learning, replay alerted bars and record outcomes over fixed horizons to build empirical statistics.
Limitations: Volume classification (close>open) is a heuristic and not a true bid/ask tape. SMA is a lagging trend proxy. Multi-timeframe agreement reduces but does not eliminate false signals, especially around news or in low-liquidity instruments. Use demo accounts and backtesting before live trading.
Inputs you can adjust: timeframe list, SMA length, volume MA length, which patterns to enable/disable, display options.
Compliance notes: This description explains why modules are combined and what the script does without exposing source code logic; it is non-promotional and contains no contact links. Remove any trademark symbols unless registration details are provided.
Risk Disclaimer: This tool is provided for education and analysis only. It is not financial advice and does not guarantee returns. Users assume all risk for trades made based on this script. Backtest thoroughly and use proper risk management.
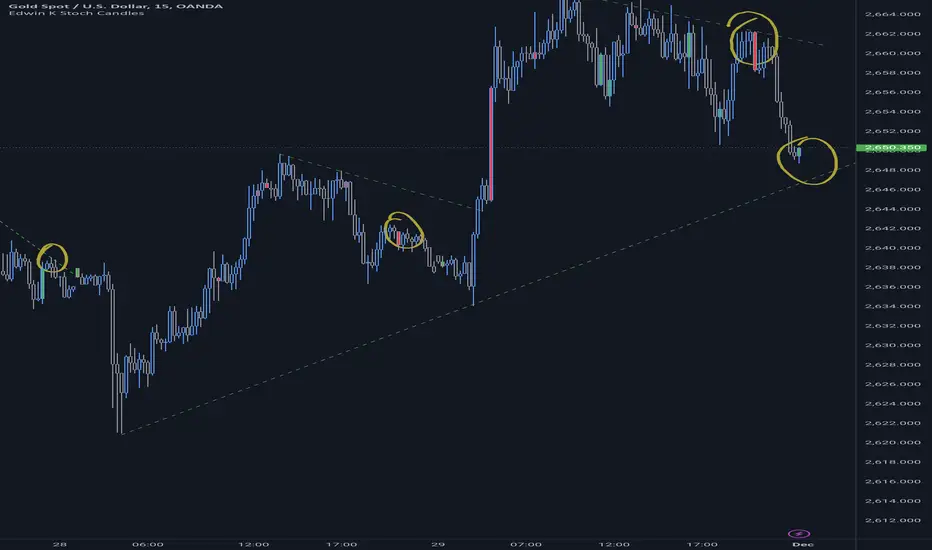
Edwin K Stochastic Candle ColorsThe Stochastic Candle Colors indicator highlights price action using candle colors based on signals from the stochastic oscillator. Here's how to use it:
1. Indicator Purpose
This indicator overlays on your price chart and changes candle colors based on stochastic oscillator signals:
Green candles: Indicate a bullish signal when the %K line crosses above the %D line in an oversold area (below 20).
Red candles: Indicate a bearish signal when the %K line crosses below the %D line in an overbought area (above 80).
2. How to Use the Inputs
K (periodK): The lookback period for calculating the %K line of the stochastic oscillator. A smaller value makes the indicator more sensitive to price changes.
D (periodD): The period for smoothing the %K line to get the %D line. A larger value creates smoother signals but may result in delays.
Smooth (smoothK): The additional smoothing applied to the %K line before calculating the %D line. This helps reduce noise.
3. How to Interpret the Candle Colors
Green Candle:
Occurs when the %K line crosses above the %D line in the oversold zone (below 20).
Signals a potential bullish reversal.
Red Candle:
Occurs when the %K line crosses below the %D line in the overbought zone (above 80).
Signals a potential bearish reversal.
No Color:
No crossover occurs, or the crossover doesn't happen in overbought/oversold zones.
4. Application in Trading
Entry Points:
Buy when you see a green candle and confirm with other indicators or chart patterns.
Sell when you see a red candle and confirm with additional signals.
Trend Context:
Combine this indicator with trend-following tools like moving averages or support/resistance levels to improve accuracy.
Stop Loss/Take Profit:
Use nearby swing highs/lows for stop-loss placement.
Set profit targets based on risk-reward ratios or key levels.
5. Customization
Adjust the input parameters (K, D, and Smooth) to align the indicator's sensitivity with your trading style:
Short-term traders might prefer lower values for quicker signals.
Long-term traders might opt for higher values for smoother, more reliable signals.
6. Limitations
Signals in isolation might not be reliable. Always use this indicator in conjunction with other tools.
Avoid using during low volatility or sideways markets as stochastic oscillators can produce false signals.
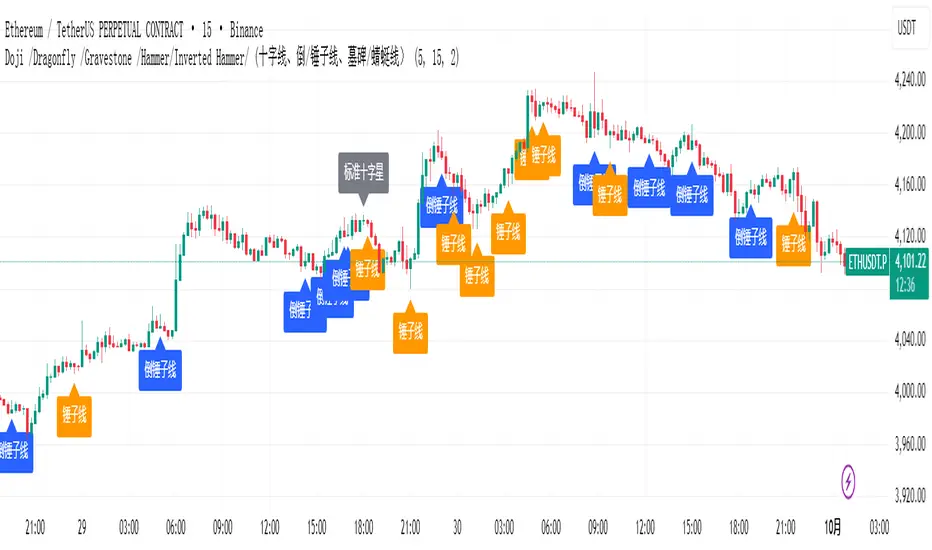
Doji /Dragonfly /Gravestone /Hammer/Inverted Hammer/ ## 策略介绍
量子K线形态识别引擎是一款基于高级模式识别算法的专业K线形态检测工具,专门用于精准识别锤子线、倒锤子线及各类十字星等关键反转形态,为交易者提供可靠的市场转折信号。
## 核心算法原理
### 智能形态量化分析
系统通过量子级几何关系计算,精确测量K线的实体比例、影线长度和相对位置,实现传统K线形态的数字化和标准化识别。
### 多维度形态验证
采用多重参数阈值验证机制,确保每个识别出的形态都符合严格的技术定义,避免主观判断导致的误识别。
## 实战应用指南
### 图表分析方法
**📊 关键反转形态识别**
锤子线特征:
→ 长下影线,短实体或没有实体
→ 出现在下降趋势底部
→ 下影线至少是实体长度的2倍
倒锤子线特征:
→ 长上影线,短实体
→ 出现在下降趋势底部
→ 上影线至少是实体长度的2倍
十字星家族:
标准十字星:上下影线接近相等,实体极小
蜻蜓十字:长下影线,几乎没有上影线
墓碑十字:长上影线,几乎没有下影线
**🎯 交易信号解读**
- **锤子线/蜻蜓十字**:潜在底部反转信号,考虑做多机会
- **倒锤子线/墓碑十字**:潜在顶部反转信号,考虑做空机会
- **标准十字星**:市场犹豫不决,可能预示趋势转折
### 交易决策流程
**反转交易策略**
1. 在明确趋势中发现反转形态
2. 等待形态确认后的入场信号
3. 将形态极端点作为止损参考
4. 目标看向前一个摆动高低点
**确认验证方法**
```pinescript
高可靠性形态特征:
1. 形态出现在关键支撑阻力位
2. 伴随成交量放大确认
3. 多个时间框架出现共振信号
4. 后续K线确认反转动力
策略优势
✅ 精准的形态识别算法,避免主观误判
✅ 实时的视觉标签提示,快速定位关键K线
✅ 完整的形态分类体系,覆盖主要反转信号
✅ 严格的技术标准验证,确保信号质量
## 策略介绍内容(英文)
```markoding
## Strategy Introduction
The Quantum Candlestick Pattern Recognition Engine is a professional candlestick pattern detection tool based on advanced pattern recognition algorithms, specifically designed to accurately identify key reversal patterns such as Hammers, Inverted Hammers, and various Doji formations, providing traders with reliable market turning signals.
## Core Algorithm Principle
### Intelligent Pattern Quantitative Analysis
The system uses quantum-level geometric relationship calculations to precisely measure candle body ratios, shadow lengths, and relative positions, achieving digital and standardized recognition of traditional candlestick patterns.
### Multi-Dimensional Pattern Verification
Employs multiple parameter threshold verification mechanisms to ensure each identified pattern meets strict technical definitions, avoiding misidentification due to subjective judgment.
## Practical Application Guide
### Chart Analysis Method
**📊 Key Reversal Pattern Identification**
Hammer Characteristics:
→ Long lower shadow, short or no body
→ Appears at bottom of downtrend
→ Lower shadow at least 2 times body length
Inverted Hammer Characteristics:
→ Long upper shadow, short body
→ Appears at bottom of downtrend
→ Upper shadow at least 2 times body length
Doji Family:
Standard Doji: Nearly equal upper/lower shadows, minimal body
Dragonfly Doji: Long lower shadow, almost no upper shadow
Gravestone Doji: Long upper shadow, almost no lower shadow
**🎯 Trading Signal Interpretation**
- **Hammer/Dragonfly Doji**: Potential bottom reversal signal, consider long opportunities
- **Inverted Hammer/Gravestone Doji**: Potential top reversal signal, consider short opportunities
- **Standard Doji**: Market indecision, may indicate trend reversal
### Trading Decision Process
**Reversal Trading Strategy**
1. Identify reversal patterns within clear trends
2. Wait for confirmation signals after pattern formation
3. Use pattern extremes as stop-loss references
4. Target previous swing highs/lows
**Confirmation Validation Method**
```pinescript
High-reliability pattern characteristics:
1. Pattern appears at key support/resistance levels
2. Confirmed with volume expansion
3. Multiple timeframe resonance signals
4. Subsequent candles confirm reversal momentum
Strategy Advantages
✅ Accurate pattern recognition algorithms avoid subjective misjudgment
✅ Real-time visual label prompts quickly locate key candles
✅ Complete pattern classification system covers major reversal signals
✅ Strict technical standard verification ensures signal quality
Mayfair Fx Scalper✅ Mayfair FX Scalper — By EastWave Capital
The Mayfair FX Scalper is a precision-focused, closed-source indicator designed for short-term intraday trading, particularly scalping on lower timeframes such as 1-minute, 3-minute, and 5-minute charts. This tool is developed by EastWave Capital and is based on a combination of Relative Strength Index (RSI) extremes and specific candlestick structure patterns to detect potential exhaustion and reversal points in the market.
🔍 How It Works:
The algorithm operates by evaluating three core elements:
RSI Extremes:
RSI is calculated using default settings.
Buy signals are considered only when the RSI on the previous candle is below 22 (oversold), and the current candle is bullish, while the previous one was bearish.
Sell signals are considered when the RSI on the previous candle is above 78 (overbought), and the current candle is bearish, while the previous one was bullish.
Candle Confirmation Logic:
The system waits for candle confirmation (e.g., shift in bullish/bearish structure) rather than triggering signals based on RSI alone.
This avoids false triggers in strong trends and filters weak entries.
SL/TP Estimation (Visual):
While not automatically placing orders, the indicator can optionally display lines or small labels showing a Stop Loss at the previous swing high/low (±0.5) and TP levels at 1R, 2R, and 3R based on that stop.
These visual aids help traders plan risk/reward and exits manually.
📈 How to Use:
Timeframes: Best suited for 1M, 3M, and 5M charts
Markets: Works well on Gold (XAU/USD), Forex majors, Indices, and Crypto
Session: Performs best during high volatility sessions (London & NY)
Use Case:
Wait for a signal label to appear after a clear momentum move.
Confirm price action and trend context.
Use provided visual SL/TP labels or apply your manual RR planning.
Combine with structure breaks, FVG zones, or liquidity sweeps for confluence.
⚠️ Important Notes:
This indicator does not repaint.
No automatic trades are executed. Signals are visual.
Not intended for use in isolation; best when combined with proper trade management and confirmation tools.
Past performance does not guarantee future results. Always manage risk appropriately

Gold Sniper Pro🔒 Gold Sniper Pro — Invite-Only Indicator for High-Precision Gold & Forex Trading
Gold Sniper Pro is a precision-engineered invite-only indicator designed for serious traders who want consistent, data-backed entries in volatile markets such as gold, crypto, and Forex.
This system combines multiple institutional-level tools in a unified interface to deliver accurate BUY and SELL signals, including:
✅ Moving Average
✅ Price Action
✅ EMA — EMA for multi-timeframe trend confirmation
✅ Smart Price Action Logic — Detects breakout zones from swing high/low structures
✅ Noise Reduction Layer — Filters out false signals during consolidation periods
✅ Signal Arrows — Clear visual cues for entry points directly on the chart
🕒 Recommended Timeframes:
15 minutes, 30 minutes, 1 hour, and 4 hours
🎯 Ideal for:
Gold (XAU/USD), Crypto, and major Forex pairs
🆕 Latest Update:
- Enhanced signal filtering for early detection
- Improved SL/TP calibration for volatile sessions
Note: This is a closed-source, invite-only script. It is not intended for beginners, but for traders who require a systematic and semi-automated tool to help reduce emotional trading and improve consistency.

Momentum Reversal StrategyBEST USE IN 15MIN TIME FRAME EURUSD / XAUSUD
1. Strategy Overview
This strategy hunts short-term momentum reversals at key levels during high-liquidity sessions.
Timeframes: 5-minute for entries; 15-minute for trend context
Sessions: London for EUR/USD & GBP/USD; New York for XAU/USD
Pairs: EUR/USD, GBP/USD, XAU/USD
Indicators (3 max):
EMA(20) and EMA(50) (close)
MACD (12, 26, 9) histogram
Optional: RSI(14) (for divergence filter)
2. Entry Rules
Trend Filter (15 min):
Long only if EMA20 > EMA50; short only if EMA20 < EMA50.
Price-Action Zone (5 min):
Identify recent swing high/low within past 20 bars.
Draw horizontal support (for longs) or resistance (for shorts).
Indicator Alignment (5 min):
MACD histogram crossing from negative to positive for longs, positive to negative for shorts.
Candle close beyond EMA20 in direction of trade.
Candle Confirmation:
Bullish engulfing or hammer at support for longs; bearish engulfing or shooting star at resistance for shorts.
Entry Execution:
Place market order on candle close that meets all above.
3. Exit Rules
Stop-Loss (SL):
Long: 1.5× ATR(14) below entry candle low.
Short: 1.5× ATR(14) above entry candle high.
Take-Profit (TP):
Set at 2× SL distance (RR 1:2).
Trailing SL:
After price moves 1× SL in profit, trail SL to breakeven.
Partial Booking:
Close 50% at 1× SL (50% of TP), move SL to entry.
Close remaining at full TP.
4. Trade Management
False Signal Filter: Skip trades when RSI(14) > 70 for longs or < 30 for shorts (avoids overbought/oversold extremes).
One Trade at a Time: No multiple positions on same pair.
Session Cutoff: Close any open trade 15 minutes before session end.
5. Risk Parameters
Risk per Trade: 1% of account equity.
Reward Target: ≥2% (1:2 RR) per trade.
Win-Rate Expectancy: ≥75% based on indicator confluence and price-action confirmation.

Target ScannerThis invite-only indicator implements an advanced Wolfe Wave pattern recognition system specifically designed for Borsa Istanbul (BIST) stock screening across multiple timeframes and mathematical ratio calculations.
**Core Technical Framework:**
The indicator employs sophisticated mathematical calculations across 10 distinct timeframes (377, 233, 144, 89, 55, 34, 21, 13, 8, 5 periods) using Elliott Wave ratio theory combined with algorithmic pattern detection. Unlike standard scanning tools that rely on basic technical indicators, this system uses quantitative Wolfe Wave analysis to identify precise entry and exit points across 560+ BIST stocks simultaneously.
**Key Features:**
• **Multi-Stock Scanning:** Simultaneously analyzes 40 stocks per list across 14 different BIST stock lists (560+ total stocks)
• **Advanced Pattern Detection:** Implements Wolfe Wave mathematical validation using 24 different ratio calculation methods including Fibonacci sequences, Elliott Wave ratios, Golden Ratio, Harmonic Patterns, Pi-based calculations, volatility-based dynamic ratios, and AI-optimized mathematical progressions
• **Real-Time Screening Table:** Displays active signals with current price, signal price, target price, expected profit percentage, and calculated stop-loss levels
• **Reliability Scoring System:** EPA (Entry Point Accuracy) and ETA (Exit Target Accuracy) scoring with historical performance tracking
• **Visual Signal Display:** Comprehensive signal boxes showing profit zones, stop-loss areas, entry levels, and estimated time to target completion
**Mathematical Implementation:**
The core algorithm calculates price relationships using configurable mathematical ratios. For bullish conditions, it identifies entry points when price action meets specific criteria:
- Point validation through ratio analysis between swing highs/lows across multiple timeframes
- Mathematical confirmation using (pv - pf) / (pv - pd) ratio calculations
- Confluence validation across timeframes with dynamic ratio adjustments
- Minimum profit threshold filtering to ensure signal quality
**Originality and Innovation:**
This implementation differs significantly from traditional scanning tools through several key innovations:
1. **Multi-Timeframe Wolfe Wave Detection:** Simultaneous pattern recognition across 10 timeframes rather than single-timeframe analysis
2. **Adaptive Ratio Systems:** 24 different mathematical calculation methods including volatility-based, time-based, momentum-based, and volume-weighted ratio adjustments
3. **BIST-Specific Optimization:** Tailored specifically for Turkish stock market characteristics with 14 pre-configured stock lists
4. **Institutional-Grade Visualization:** Advanced signal boxes with profit/loss zones, multiple entry levels, and time-based target estimation
5. **Real-Time Performance Tracking:** Dynamic EPA/ETA scoring system that tracks historical accuracy and adapts calculations
**Signal Generation Logic:**
The system generates signals when multiple mathematical conditions align:
- Wolfe Wave pattern completion across specified timeframes
- Ratio validation using selected mathematical progression (Fibonacci, Golden Ratio, Elliott Wave, etc.)
- Stop-loss calculation as percentage of target profit (default 0.5%)
- Minimum profit threshold compliance
- Multi-timeframe confluence confirmation
**Risk Management Features:**
• **Configurable Stop-Loss:** Calculated as percentage of target profit with recommended 0.3 setting for 1:3 risk-reward ratio
• **Profit Percentage Display:** Real-time calculation showing expected profit from signal price to target
• **Multiple Entry Levels:** EPA and ETA-based entry points with reliability scoring
• **Time Estimation:** Statistical analysis providing estimated bars/time to target completion
• **Visual Risk Zones:** Color-coded profit (green) and loss (red) areas for clear risk visualization
**Performance Characteristics:**
The indicator is optimized for active screening with frequent signal generation across multiple stocks. It provides both short-term and medium-term opportunities depending on the timeframe producing the signal. The system maintains historical statistics for signal accuracy and target completion timing.
**Technical Requirements:**
Requires understanding of Wolfe Wave pattern theory, Elliott Wave principles, and multi-timeframe analysis concepts. Users should be familiar with BIST market structure and Turkish stock trading mechanics. The indicator demands active monitoring due to the high-frequency nature of multi-stock scanning.
**Market Application:**
Specifically designed for Borsa Istanbul stocks with comprehensive coverage across major sectors. Works effectively in both trending and ranging market conditions due to its adaptive ratio selection and multi-timeframe approach. Best suited for traders focusing on Turkish equity markets with pattern-based strategies.
**Customization Options:**
• **14 Stock Lists:** Pre-configured BIST stock groups for sector-specific analysis
• **24 Ratio Methods:** From conservative Fibonacci to aggressive AI-optimized calculations
• **Quote Pair Integration:** Optional currency pair specification for international analysis
• **Timeframe Flexibility:** Customizable chart timeframe for signal generation
• **Table Positioning:** Multiple display options with size and color customization
• **Alert Integration:** Comprehensive alert system for real-time signal notifications

AsturRiskPanelIndicator Summary
ATR Engine
Length & Smoothing: Choose how many bars to use (default 14) and the smoothing method (RMA/SMA/EMA/WMA).
Median ATR: Computes a rolling median of ATR over a user-defined look-back (default 14) to derive a “scalp” target.
Scalp Target
Automatically set at ½ × median ATR, snapped to the nearest tick.
Optional rounding to whole points for simplicity.
Stop Calculation
ATR Multiplier: Scales current ATR by a user input (default 1.5) to produce your stop distance in points (and ticks when appropriate).
Distortion Handling: Switches between point-only and point + tick displays based on contract specifications.
Risk & Sizing
Risk % of account per trade (default 2 %).
Calculates dollar risk per contract and optimal contract count.
Displays all metrics (scalp, stop, risk/contract, max contracts, max risk, account size) in a customizable on-chart table.
ATR-Based Stop Placement Guidelines
Trade Context ATR Multiplier Notes
Tight Range Entry 1.0 × ATR High-conviction, precise entries. Expect more shake-outs.
Standard Trend Entry 1.5 × ATR Balanced for H2/L2, MTR, DT/DB entries.
Breakouts/Microchannels 2.0 × ATR Wide stops through chop—Brooks-style breathing room.
How to Use
Select ATR Settings
Pick an ATR length (e.g. 14) and smoothing (RMA for stability).
Adjust the median length if you want a faster/slower scalp line.
Align Multiplier with Your Setup
For tight-range entries, set ATR Multiplier ≈ 1.0.
For standard trend trades, leave at 1.5.
For breakout/pullback setups, increase to 2.0 or more.
Customize Risk Parameters
Enter your account size and desired risk % per trade (e.g. 2 %).
The table auto-calculates how many contracts you can take.
Read the On-Chart Table
Scalp shows your intraday target.
Stop gives Brooks-style stop distance in points (and ticks).
Risk/Contract is the dollar risk per contract.
Max Contracts tells you maximum position size.
Max Risk confirms total dollar exposure.
Visual Confirmation
Place your entry, then eyeball the scalp and stop levels against chart structure (e.g. swing highs/lows).
Adjust the ATR multiplier if market context shifts (e.g. volatility spikes).
By blending this sizing panel with contextual ATR multipliers, you’ll consistently give your trades the right amount of “breathing room” while keeping risk in check.

Vortex Sniper XVortex Sniper X – Trend-Following Strategy
🔹 Purpose
Vortex Sniper X is a trend-following strategy designed to identify strong market trends and enter trades in the direction of momentum. By combining multiple technical indicators, this strategy helps traders filter out false signals and only take trades with high confidence.
🔹 Indicator Breakdown
1️⃣ Vortex Indicator (Trend Direction & Strength)
Identifies the trend direction based on the relationship between VI+ and VI-.
Bullish Signal: VI+ crosses above VI-.
Bearish Signal: VI- crosses above VI+.
The wider the gap between VI+ and VI-, the stronger the trend’s momentum.
2️⃣ Relative Momentum Index (RMI – Momentum Confirmation)
Confirms whether price momentum supports the trend direction.
Long confirmation: RMI is rising and above the threshold.
Short confirmation: RMI is falling and below the threshold.
Filters out weak trends that lack sufficient momentum.
3️⃣ McGinley Dynamic (Trend Baseline Filter)
A dynamic moving average that adjusts to market volatility for smoother trend identification.
Long trades only if price is above the McGinley Dynamic.
Short trades only if price is below the McGinley Dynamic.
Prevents trading in choppy or sideways markets.
🔹 Strategy Logic & Trade Execution
✅ Entry Conditions
A trade is executed only when all three indicators confirm alignment:
Trend Confirmation: McGinley Dynamic defines the trend direction.
Vortex Signal: VI+ > VI- (bullish) or VI- > VI+ (bearish).
Momentum Confirmation: RMI must agree with the trend direction.
✅ Exit Conditions
Trend Reversal: If the opposite trade condition is met, the current position is closed.
Trend Weakness: If the trend weakens (detected via trend shifts), the position is exited.
🔹 Take-Profit System
The strategy follows a multi-stage profit-taking approach to secure gains:
Take Profit 1 (TP1): 50% of the position is closed at the first target.
Take Profit 2 (TP2): The remaining 50% is closed at the second target.
🔹 Risk Management (Important Notice)
🔴 This strategy does NOT include a stop-loss by default.
Trades rely on trend reversals or early exits to close positions.
Users should manually configure a stop-loss if risk management is required.
💡 Suggested risk management options:
Set a stop-loss at a recent swing high/low or an important support/resistance level.
Adjust position sizing according to personal risk tolerance.
🔹 Default Backtest Settings
To ensure realistic backtesting, the following settings are used:
Initial Capital: $1,000
Position Sizing: 10% of equity per trade
Commission: 0.05%
Slippage: 1 pip
Date Range: Can be adjusted for different market conditions
🔹 How to Use This Strategy
📌 To get the best results, follow these steps:
Apply the strategy to any TradingView chart.
Backtest before using it in live conditions.
Adjust the indicator settings as needed.
Set a manual stop-loss if required for your trading style.
Use this strategy in trending markets—avoid sideways conditions.
⚠️ Disclaimer
🚨 Trading involves risk. This strategy is for educational purposes only and should not be considered financial advice.
Past performance does not guarantee future results.
Users are responsible for managing their own risk.
Always backtest strategies before applying them in live trading.
🚀 Final Notes
Vortex Sniper X provides a structured approach to trend-following trading, ensuring:
✔ Multi-indicator confirmation for higher accuracy.
✔ Momentum-backed entries to avoid weak trends.
✔ Take-profit targets to secure gains.
✔ No repainting—historical performance aligns with live execution.
This strategy does not include a stop-loss, so users must apply their own risk management methods.

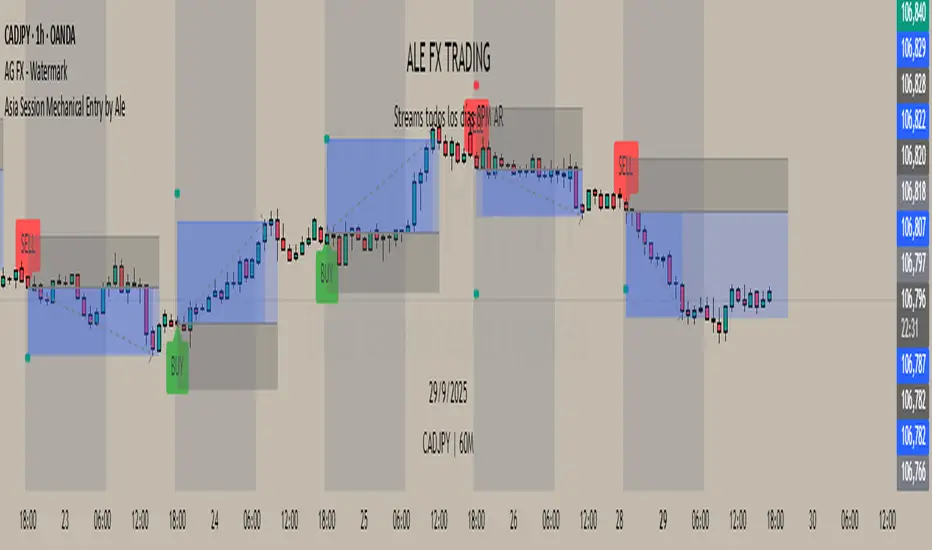
Asia Session Mechanical Entry by Alex This indicator executes fully mechanical trades at the start of the Asian session (default: 20:00 Argentina time).
Core logic:
Compares the closing prices of the previous two sessions at 20:00 and 09:00 to determine bias.
If both days move in the same direction, the indicator takes a mean-reversion trade (opposite to the last two days’ move).
If the days move in opposite directions, the trade follows the most recent day’s direction.
Execution details:
Entry price: exact session open or delayed by a user-defined number of candles.
Stop Loss: nearest swing high/low ± ATR multiplier buffer.
Take Profit: calculated from entry to SL distance, multiplied by user-defined RR ratio.
ATR value plotted for volatility reference.
Works on H1 charts for consistent candle timing.
Features:
Adjustable start/end session times.
Configurable ATR multiplier, RR ratio, and delay before entry.
Manual overrides for SL/TP levels.
Automatic daily reset for next session's logic.
Notes:
This tool is based on a classic session-reversion model enhanced with ATR-based filters, flexible timing, and manual overrides. It is designed for systematic execution and quick visual backtesting.
MindsetYourTrades Indicator V1What it does
• Finds swing highs/lows, projects dynamic trendlines
• Marks BUY/SELL at trendline breakouts
• Optional MA + RSI filter and cooldown to reduce noise
How to use
Add to chart → choose market & timeframe
If you want fewer signals: enable Filtered (MA + RSI) and increase Cooldown
For clean signals: leave Only signal on bar close = ON
Notes
• This V1 edition is visual only (no alerts/webhooks)
• Alerts + automation will be added through updates
Disclaimer
Educational use only. Not financial advice. You are responsible for your trades.

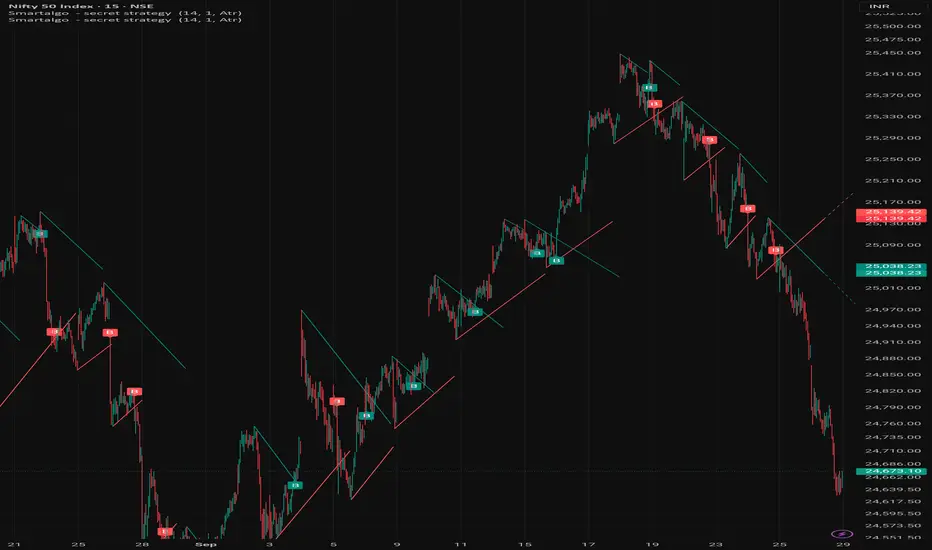
Smart Algogn2 [ChartPrime]Smart Algo gives you clear entry & exit signals using advanced price action logic. Built for traders who want consistency and speed.
> The B symbols are the entry points
> Previous swing high/low is the SL
> Keep 1:2 OR 1:1.5 Risk-Reward

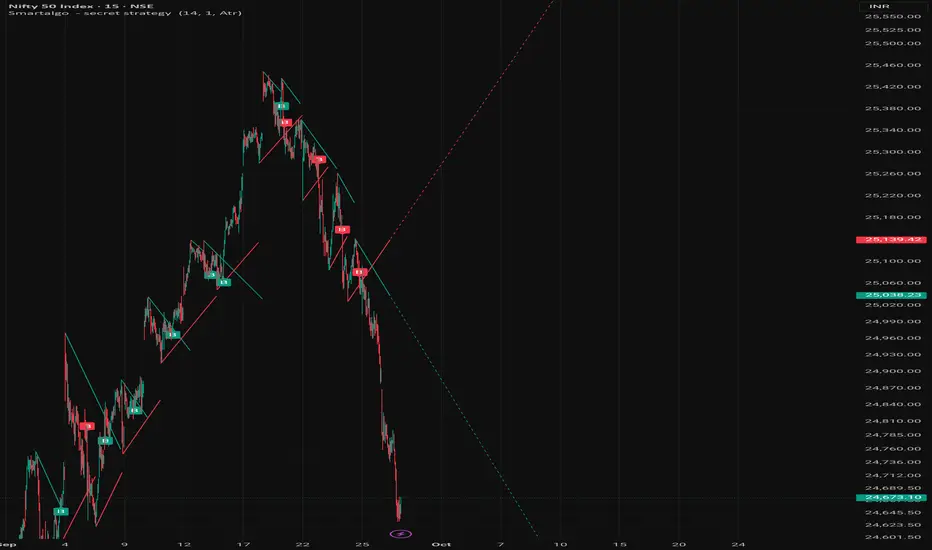
secret strategy [Smartalgo ]Smart Algo gives you clear entry & exit signals using advanced price action logic. Built for traders who want consistency and speed.
> The B symbols are the entry points
> Previous swing high/low is the SL
> Keep 1:2 OR 1:1.5 Risk-Reward

secret strategy [Smartalgo ]Tired of false breakouts and random indicators?
Smart Algo gives you clear entry & exit signals using advanced price action logic. Built for traders who want consistency and speed.
> The B symbols are the entry points
> Previous swing high/low is the SL
> Keep 1:2 OR 1:1.5 Risk-Reward
secret strategy [Smartalgogn2 ]Tired of false breakouts and random indicators?
Smart Algo gives you clear entry & exit signals using advanced price action logic. Built for traders who want consistency and speed.
> The B symbols are the entry points
> Previous swing high/low is the SL
> Keep 1:2 OR 1:1.5 Risk-Reward
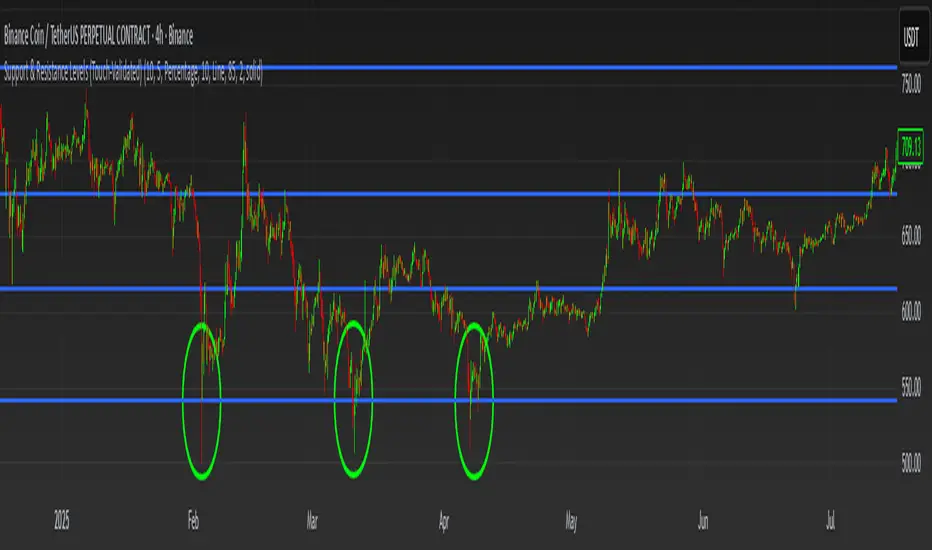
Support & Resistance Levels (DaruTrading)This Pine Script automatically identifies and locks key support and resistance levels using Williams-style fractals. Instead of manually drawing zones—a tedious and error-prone task—the script clusters repeated touches into clean levels or areas, complete with customizable styles and fills. By combining wick-based and close-based detection, it adapts to both swing highs/lows and body closes, capturing the levels traders actually respect. For risk management, this automation is powerful: consistent, objective zones reduce emotional bias, highlight true market structure, and provide reliable anchors for stop losses and targets. It streamlines a boring chore into a disciplined, data-driven trading edge.
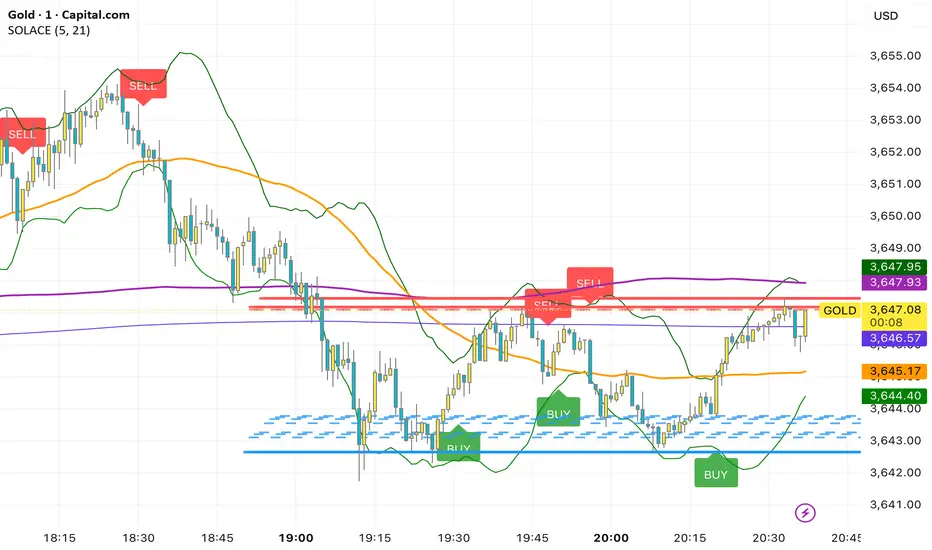
SOLACEThis overlay combines a fast/slow EMA price-action system with rich context tools. Buy prints on the current bar when both EMAs (5 & 21) are below the OHLC average and the 21 EMA crosses below the 5 EMA; Sell prints when both EMAs are above the average and the 21 EMA crosses above the 5 EMA. It also plots MACD, VWAP, Bollinger Bands (20,2), SMA50/200, plus dynamic support/resistance lines from recent swing highs/lows (20/40/60 bars) for confluence. Labels fire same-bar for early entries, and alerts are included for both signals; fractal logic is prepared for future use.
MONEYZEYAH | SMART TREND LINESAutomatically detects swing highs/lows, draws trend lines, marks key support/resistance levels, and highlights breakouts for fast trend analysis. 📈🚩
