ICT Sweep + CHoCH + FVG Alerts
### 🔥 ICT Sweep + CHoCH + FVG Alerts
Script designed to automate ICT entry confirmations using:
• Liquidity Sweep (Buy/Sell Stops taken)
• Change of Character (CHoCH)
• Fair Value Gap (FVG) confirmation
### ✅ Conditions
**Long signal when:**
1. Bearish liquidity sweep
2. Bullish CHoCH
3. Bullish FVG forms and gets respected
**Short signal when:**
1. Bullish liquidity sweep
2. Bearish CHoCH
3. Bearish FVG forms and gets respected
### 🎯 Purpose
This script helps traders detect smart-money setup entries based on ICT logic and receive alerts in real time.
### 📡 Alerts
Supports webhook automation for bots, signal servers, or trading platforms.
*This script does not place trades automatically, alerts only.*
### ⚠️ Disclaimer
This tool is for educational purposes.
Always backtest and use proper risk management.
스크립트에서 "sweep"에 대해 찾기
KENW Liq Sweep 17This indicator is designed to alert on potential liquidity sweep events:
- In uptrends, it tracks Sell-Side Liquidity (SSL) by marking swing lows that occur during negative MACD histogram periods. It generates a long entry alert when price makes a lower low in SSL (i.e., the most recent SSL level is below the prior one), suggesting a sweep of sell-side liquidity before a potential bullish continuation.
- In downtrends, it tracks Buy-Side Liquidity (BSL) by marking swing highs that occur during positive MACD histogram periods. It generates a short entry alert when price makes a higher high in BSL (i.e., the most recent BSL level is above the prior one), indicating a sweep of buy-side liquidity before a potential bearish continuation.

Wick Sweep EntriesWick Sweep Entry designed by Finweal Finance (Indicator Originator : Prajyot Mahajan) :
This Indicator is specially designed for Nifty, Sensex and Banknifty Options Buying. This works well on Expiry Days.
Setup Timeframe : 5m and 1m.
Entry Criteria :
For Long/CE :
Wait for Sweep of 5m Candle Low with next 5m Candle but you do not wait for the next 5 minute candle to close, you enter directly whenever any 1 minute candle of next 5minute candle to close above the low of previous 5m Candle.
For Short/PE :
Wait for Sweep of 5m Candle High with next 5m Candle but you do not wait for the next 5 minute candle to close, you enter directly whenever any 1 minute candle of next 5minute candle to close below the High of previous 5m Candle.
Key notes :
1. As this is the Scalping High Frequency Strategy, it is to be used for scalping purpose only. You might have losses too so to avoid the noise in the market, i suggest you to use this strategy in the first 45 minutes to 1 hour of Indian Markets as this is a volatility Strategy.
2. Although Nifty and Banknifty are independent indices, they still show some reactions with each other, so if you spot a long entry on BNF and Short Entry on nifty then you will avoid taking the trade, you will take the trade only if there is a tandem activity or At least the other index is not showing opposite signal.
3. If target is not hit and you spot another entry, you will avoid taking the new entry.
The Indicator will automatically spot/plot the entry signal, all you need to do is enter as soon as 1minute candle closes either below prior 5 minute candle High for Short/PE or closes above 5minute low for Long/CE.
For Targets :
You Can Target recent minor pull back, FVG, or Order blocks.
Remember : This is a scalping strategy so don't hold trade for more than 4/5 1minute Candles

TJR asia session sweep//@version=5
strategy("TJR asia session sweep", "TJR Asia Sweep", overlay=true, max_lines_count=500, max_labels_count=500)
// Input settings
show_asian = input.bool(true, "Show Asian Session", group="Visual Settings")
show_london = input.bool(true, "Show London Session", group="Visual Settings")
show_swing_points = input.bool(true, "Show Asian Swing Points", group="Visual Settings")
show_market_structure = input.bool(true, "Show Market Structure", group="Visual Settings")
show_bos = input.bool(true, "Show Break of Structure", group="Visual Settings")
// Session Time Settings
asian_start_hour_input = input.int(22, "Asian Session Start Hour", minval=0, maxval=23, group="Session Times")
asian_end_hour_input = input.int(3, "Asian Session End Hour", minval=0, maxval=23, group="Session Times")
london_start_hour_input = input.int(3, "London Session Start Hour", minval=0, maxval=23, group="Session Times")
london_end_hour_input = input.int(8, "London Session End Hour", minval=0, maxval=23, group="Session Times")
session_timezone = input.string("America/New_York", "Session Timezone", options= , group="Session Times")
// Risk Management Settings
use_atr_sl = input.bool(false, "Use ATR Multiplier for Stop Loss", group="Risk Management")
atr_length = input.int(14, "ATR Length", minval=1, maxval=50, group="Risk Management")
atr_multiplier = input.float(2.0, "ATR Multiplier for Stop Loss", minval=0.5, maxval=10.0, group="Risk Management")
force_london_close = input.bool(true, "Force Close at London Session End", group="Risk Management")
cutoff_minutes = input.int(60, "Minutes Before Session End to Stop New Trades", minval=0, maxval=300, group="Risk Management")
// Position Sizing Settings
position_sizing_method = input.string("USD Risk", "Position Sizing Method", options= , group="Position Sizing")
usd_risk_per_trade = input.float(100.0, "USD Risk Per Trade", minval=1.0, maxval=10000.0, group="Position Sizing")
fixed_contracts = input.float(1.0, "Fixed Number of Contracts", minval=0.01, maxval=1000.0, step=0.01, group="Position Sizing")
// Color settings
asian_color = input.color(color.red, "Asian Session Color")
london_color = input.color(color.blue, "London Session Color")
swing_high_color = input.color(color.orange, "Swing High Color")
swing_low_color = input.color(color.lime, "Swing Low Color")
bullish_structure_color = input.color(color.green, "Bullish Structure Color")
bearish_structure_color = input.color(color.red, "Bearish Structure Color")
bos_color = input.color(color.orange, "Break of Structure Color")
// Line settings
line_width = input.int(2, "Line Width", minval=1, maxval=5)
// ATR calculation for stop loss
atr = ta.atr(atr_length)
// Position size calculation function
calculate_position_size(entry_price, stop_loss_price) =>
var float position_size = na
if position_sizing_method == "Fixed Contracts"
position_size := fixed_contracts
else // USD Risk method
stop_distance = math.abs(entry_price - stop_loss_price)
if stop_distance > 0
// Calculate position size based on USD risk per trade
// For forex: position_size = risk_amount / (stop_distance * point_value)
// For most forex pairs, point value = 1 (since we're dealing with price differences directly)
position_size := usd_risk_per_trade / stop_distance
else
position_size := fixed_contracts // Fallback to fixed contracts if stop distance is 0
position_size
// Session time definitions (using input variables)
asian_start_hour = asian_start_hour_input
asian_end_hour = asian_end_hour_input
london_start_hour = london_start_hour_input
london_end_hour = london_end_hour_input
// Get current hour using selected timezone
current_hour = hour(time, session_timezone)
// Previous hour for transition detection
prev_hour = hour(time , session_timezone)
// Session transition detection
asian_start = current_hour == asian_start_hour and prev_hour != asian_start_hour
asian_end = current_hour == asian_end_hour and prev_hour != asian_end_hour
london_start = current_hour == london_start_hour and prev_hour != london_start_hour
london_end = current_hour == london_end_hour and prev_hour != london_end_hour
// Session activity detection
asian_active = (current_hour >= asian_start_hour) or (current_hour < asian_end_hour)
london_active = (current_hour >= london_start_hour) and (current_hour < london_end_hour)
// Session boxes - keep previous sessions visible
var box asian_session_box = na
var box london_session_box = na
// Create Asian session box
if show_asian and asian_start
// Create new box at session start (previous box remains visible)
asian_session_box := box.new(bar_index, high, bar_index + 1, low,
border_color=asian_color, bgcolor=color.new(asian_color, 90),
border_width=2, border_style=line.style_solid)
// Pre-calculate session highs and lows for consistency
asian_session_length = asian_active and not na(asian_session_box) ? bar_index - box.get_left(asian_session_box) + 1 : 1
current_asian_high = ta.highest(high, asian_session_length)
current_asian_low = ta.lowest(low, asian_session_length)
// Update Asian session box continuously during session
if show_asian and asian_active and not na(asian_session_box)
box.set_right(asian_session_box, bar_index)
// Update box to contain session highs and lows
box.set_top(asian_session_box, current_asian_high)
box.set_bottom(asian_session_box, current_asian_low)
// Create London session box
if show_london and london_start
// Create new box at session start (previous box remains visible)
london_session_box := box.new(bar_index, high, bar_index + 1, low,
border_color=london_color, bgcolor=color.new(london_color, 90),
border_width=2, border_style=line.style_solid)
// Pre-calculate London session highs and lows for consistency
london_session_length = london_active and not na(london_session_box) ? bar_index - box.get_left(london_session_box) + 1 : 1
current_london_high = ta.highest(high, london_session_length)
current_london_low = ta.lowest(low, london_session_length)
// Update London session box continuously during session
if show_london and london_active and not na(london_session_box)
box.set_right(london_session_box, bar_index)
// Update box to contain session highs and lows
box.set_top(london_session_box, current_london_high)
box.set_bottom(london_session_box, current_london_low)
// Asian Session Swing Points Detection
var float asian_session_high = na
var float asian_session_low = na
var int asian_high_bar = na
var int asian_low_bar = na
// Asian Session Absolute High/Low for TP levels
var float asian_absolute_high = na
var float asian_absolute_low = na
var line asian_high_line = na
var line asian_low_line = na
var label asian_high_label = na
var label asian_low_label = na
var bool high_broken = false
var bool low_broken = false
// London Session High/Low tracking for stop loss
var float london_session_high = na
var float london_session_low = na
// Market structure tracking variables
var string breakout_direction = na // "bullish" or "bearish"
var float last_hh_level = na // Last Higher High level
var float last_hl_level = na // Last Higher Low level
var float last_ll_level = na // Last Lower Low level
var float last_lh_level = na // Last Lower High level
var int structure_count = 0
var string last_structure_type = na // "HH", "HL", "LL", "LH"
// Legacy variables for compatibility
var float last_swing_high = na
var float last_swing_low = na
var int last_high_bar = na
var int last_low_bar = na
// Market structure state tracking
var float pending_high = na
var float pending_low = na
var int pending_high_bar = na
var int pending_low_bar = na
var bool waiting_for_confirmation = false
// Break of Structure tracking variables
var float most_recent_hl = na
var float most_recent_lh = na
var int most_recent_hl_bar = na
var int most_recent_lh_bar = na
var bool bos_detected = false
// Trading variables
var bool trade_taken = false
// Trade visualization boxes (based on Casper strategy approach)
var box current_profit_box = na
var box current_sl_box = na
// Update swing points during Asian session
if asian_active and show_swing_points
// Always track absolute high/low for both TP levels and breakout detection
if na(asian_absolute_high) or high > asian_absolute_high
asian_absolute_high := high
if na(asian_absolute_low) or low < asian_absolute_low
asian_absolute_low := low
// Use absolute high/low for breakout levels (simplified logic)
if na(asian_session_high) or high > asian_session_high
asian_session_high := high
asian_high_bar := bar_index
if na(asian_session_low) or low < asian_session_low
asian_session_low := low
asian_low_bar := bar_index
// Track London session high/low for stop loss levels
if london_active
if na(london_session_high) or high > london_session_high
london_session_high := high
if na(london_session_low) or low < london_session_low
london_session_low := low
// Draw initial lines when Asian session ends
if asian_end and show_swing_points
if not na(asian_session_high) and not na(asian_high_bar)
// Draw extending line for high
asian_high_line := line.new(asian_high_bar, asian_session_high, bar_index + 200, asian_session_high,
color=swing_high_color, width=2, style=line.style_dashed, extend=extend.right)
asian_high_label := label.new(bar_index + 5, asian_session_high, "Asian High: " + str.tostring(asian_session_high, "#.####"), style=label.style_label_left, color=swing_high_color, textcolor=color.white, size=size.small)
if not na(asian_session_low) and not na(asian_low_bar)
// Draw extending line for low
asian_low_line := line.new(asian_low_bar, asian_session_low, bar_index + 200, asian_session_low,
color=swing_low_color, width=2, style=line.style_dashed, extend=extend.right)
asian_low_label := label.new(bar_index + 5, asian_session_low, "Asian Low: " + str.tostring(asian_session_low, "#.####"), style=label.style_label_left, color=swing_low_color, textcolor=color.white, size=size.small)
// Reset break flags for new session
high_broken := false
low_broken := false
// Check for breakouts during London session
if london_active and show_swing_points and not na(asian_session_high) and not na(asian_session_low)
// Check if Asian high is broken
if not high_broken and not low_broken and high > asian_session_high
high_broken := true
// Update high line to end at break point
if not na(asian_high_line)
line.set_x2(asian_high_line, bar_index)
line.set_extend(asian_high_line, extend.none)
// Remove the low line (first break wins)
if not na(asian_low_line)
line.delete(asian_low_line)
if not na(asian_low_label)
label.delete(asian_low_label)
// Add break marker
label.new(bar_index, asian_session_high * 1.001, "HIGH BREAK!",
style=label.style_label_down, color=color.red, textcolor=color.white, size=size.normal)
// Set breakout direction and initialize structure tracking
breakout_direction := "bullish"
last_swing_high := asian_session_high
last_swing_low := asian_session_low
last_high_bar := bar_index
structure_count := 0
// Check if Asian low is broken
if not low_broken and not high_broken and low < asian_session_low
low_broken := true
// Update low line to end at break point
if not na(asian_low_line)
line.set_x2(asian_low_line, bar_index)
line.set_extend(asian_low_line, extend.none)
// Remove the high line (first break wins)
if not na(asian_high_line)
line.delete(asian_high_line)
if not na(asian_high_label)
label.delete(asian_high_label)
// Add break marker
label.new(bar_index, asian_session_low * 0.999, "LOW BREAK!",
style=label.style_label_up, color=color.red, textcolor=color.white, size=size.normal)
// Set breakout direction and initialize structure tracking
breakout_direction := "bearish"
last_swing_high := asian_session_high
last_swing_low := asian_session_low
last_low_bar := bar_index
structure_count := 0
// Stop extending lines when London session ends (if not already broken)
if london_end and show_swing_points
if not high_broken and not na(asian_high_line)
line.set_x2(asian_high_line, bar_index)
line.set_extend(asian_high_line, extend.none)
if not low_broken and not na(asian_low_line)
line.set_x2(asian_low_line, bar_index)
line.set_extend(asian_low_line, extend.none)
// Force close all trades at London session end (if enabled)
if london_end and force_london_close
if strategy.position_size != 0
// Extend boxes immediately before session close to prevent timing issues
if not na(current_profit_box)
// Ensure minimum 8 bars width or extend to current bar, whichever is longer
box_left = box.get_left(current_profit_box)
min_right = box_left + 8
final_right = math.max(min_right, bar_index)
box.set_right(current_profit_box, final_right)
current_profit_box := na // Clear reference after extending
if not na(current_sl_box)
// Ensure minimum 8 bars width or extend to current bar, whichever is longer
box_left = box.get_left(current_sl_box)
min_right = box_left + 8
final_right = math.max(min_right, bar_index)
box.set_right(current_sl_box, final_right)
current_sl_box := na // Clear reference after extending
strategy.close_all(comment="London Close")
trade_taken := false // Reset trade flag for next session
// Market structure detection after breakout (only during London session and before first BoS)
if show_market_structure and not na(breakout_direction) and london_active and not bos_detected
// Bullish structure tracking (HH, HL alternating)
if breakout_direction == "bullish"
// Check for Higher High pattern: Bullish candle followed by bearish candle
pattern_high = math.max(high , high)
prev_hh = na(last_hh_level) ? last_swing_high : last_hh_level
// HH Detection: Only if we expect HH next (no last structure or last was HL)
if (na(last_structure_type) or last_structure_type == "HL") and close > open and close < open and pattern_high > prev_hh and close > prev_hh
// Check consolidation
is_too_close = not na(last_high_bar) and (bar_index - last_high_bar) <= 4
should_create_hh = true
if is_too_close and structure_count > 0 and pattern_high <= last_hh_level
should_create_hh := false
if should_create_hh
structure_count := structure_count + 1
label.new(bar_index - 1, high + (high * 0.0003), "HH" + str.tostring(structure_count),
style=label.style_none, color=color.new(color.white, 100),
textcolor=color.white, size=size.small)
last_hh_level := pattern_high
last_swing_high := pattern_high
last_high_bar := bar_index
last_structure_type := "HH"
// HL Detection: Only if we expect HL next (last was HH)
pattern_low = math.min(low , low)
prev_hl = na(last_hl_level) ? last_swing_low : last_hl_level
if last_structure_type == "HH" and close < open and close > open and pattern_low > prev_hl and close > prev_hl
// Check consolidation
is_too_close = not na(last_low_bar) and (bar_index - last_low_bar) <= 4
should_create_hl = true
if is_too_close and pattern_low <= last_hl_level
should_create_hl := false
if should_create_hl
structure_count := structure_count + 1
label.new(bar_index - 1, low - (low * 0.0003), "HL" + str.tostring(structure_count),
style=label.style_none, color=color.new(color.white, 100),
textcolor=color.white, size=size.small)
last_hl_level := pattern_low
most_recent_hl := pattern_low // Update most recent HL for BoS detection
most_recent_hl_bar := bar_index - 1 // Store HL bar position
last_low_bar := bar_index
last_structure_type := "HL"
// Bearish structure tracking (LL, LH alternating)
if breakout_direction == "bearish"
// Check for Lower Low pattern: Bearish candle followed by bullish candle
pattern_low = math.min(low , low)
prev_ll = na(last_ll_level) ? last_swing_low : last_ll_level
// LL Detection: Only if we expect LL next (no last structure or last was LH)
if (na(last_structure_type) or last_structure_type == "LH") and close < open and close > open and pattern_low < prev_ll and close < prev_ll
// Check consolidation
is_too_close = not na(last_low_bar) and (bar_index - last_low_bar) <= 4
should_create_ll = true
if is_too_close and structure_count > 0 and pattern_low >= last_ll_level
should_create_ll := false
if should_create_ll
structure_count := structure_count + 1
label.new(bar_index - 1, low - (low * 0.0003), "LL" + str.tostring(structure_count),
style=label.style_none, color=color.new(color.white, 100),
textcolor=color.white, size=size.small)
last_ll_level := pattern_low
last_swing_low := pattern_low
last_low_bar := bar_index
last_structure_type := "LL"
// LH Detection: Only if we expect LH next (last was LL)
pattern_high = math.max(high , high)
prev_lh = na(last_lh_level) ? last_swing_high : last_lh_level
if last_structure_type == "LL" and close > open and close < open and pattern_high < prev_lh and close < prev_lh
// Check consolidation
is_too_close = not na(last_high_bar) and (bar_index - last_high_bar) <= 4
should_create_lh = true
if is_too_close and pattern_high >= last_lh_level
should_create_lh := false
if should_create_lh
structure_count := structure_count + 1
label.new(bar_index - 1, high + (high * 0.0003), "LH" + str.tostring(structure_count),
style=label.style_none, color=color.new(color.white, 100),
textcolor=color.white, size=size.small)
last_lh_level := pattern_high
most_recent_lh := pattern_high // Update most recent LH for BoS detection
most_recent_lh_bar := bar_index - 1 // Store LH bar position
last_high_bar := bar_index
last_structure_type := "LH"
// Check if we're within the cutoff period before London session end
current_minute = minute(time, session_timezone)
london_end_time_minutes = london_end_hour * 60 // Convert London end hour to minutes
current_time_minutes = current_hour * 60 + current_minute // Current time in minutes
// Calculate minutes remaining in London session
london_session_minutes_remaining = london_end_time_minutes - current_time_minutes
// Handle day rollover case (e.g., if london_end is 8:00 (480 min) and current is 23:30 (1410 min))
if london_session_minutes_remaining < 0
london_session_minutes_remaining := london_session_minutes_remaining + (24 * 60) // Add 24 hours in minutes
// Only allow trades if more than cutoff_minutes remaining in London session
allow_new_trades = london_session_minutes_remaining > cutoff_minutes
// Break of Structure (BoS) Detection and Trading Logic - Only first BoS per London session and outside cutoff period
if show_bos and london_active and show_market_structure and not bos_detected and not trade_taken and allow_new_trades
// Bullish BoS: Price closes below the most recent HL (after bullish breakout) - SELL SIGNAL
if breakout_direction == "bullish" and not na(most_recent_hl) and not na(most_recent_hl_bar)
// Check minimum distance requirement (at least 4 candles between BoS and HL)
if close < most_recent_hl and (bar_index - most_recent_hl_bar) >= 4
// Draw dotted line from HL position to BoS point
line.new(most_recent_hl_bar, most_recent_hl, bar_index, most_recent_hl,
color=bos_color, width=2, style=line.style_dotted, extend=extend.none)
// Calculate center position for BoS label
center_bar = math.round((most_recent_hl_bar + bar_index) / 2)
// Draw BoS label below the line for HL break
label.new(center_bar, most_recent_hl - (most_recent_hl * 0.0005), "BoS",
style=label.style_none, color=color.new(color.white, 100),
textcolor=bos_color, size=size.normal)
// SELL ENTRY
if not na(london_session_high) and not na(asian_absolute_low)
// Calculate stop loss based on settings
stop_loss_level = use_atr_sl ? close + (atr * atr_multiplier) : london_session_high
take_profit_level = asian_absolute_low
entry_price = close
// Calculate position size based on user settings
position_size = calculate_position_size(entry_price, stop_loss_level)
strategy.entry("SELL", strategy.short, qty=position_size, comment="BoS Sell")
strategy.exit("SELL EXIT", "SELL", stop=stop_loss_level, limit=take_profit_level, comment="SL/TP")
// Create trade visualization boxes (TradingView style) - minimum 8 bars width
// Blue profit zone box (from entry to take profit)
current_profit_box := box.new(left=bar_index, top=take_profit_level, right=bar_index + 8, bottom=entry_price,
bgcolor=color.new(color.blue, 70), border_width=0)
// Red stop loss zone box (from entry to stop loss)
current_sl_box := box.new(left=bar_index, top=entry_price, right=bar_index + 8, bottom=stop_loss_level,
bgcolor=color.new(color.red, 70), border_width=0)
trade_taken := true
bos_detected := true // Mark BoS as detected for this session
// Bearish BoS: Price closes above the most recent LH (after bearish breakout) - BUY SIGNAL
if breakout_direction == "bearish" and not na(most_recent_lh) and not na(most_recent_lh_bar)
// Check minimum distance requirement (at least 4 candles between BoS and LH)
if close > most_recent_lh and (bar_index - most_recent_lh_bar) >= 4
// Draw dotted line from LH position to BoS point
line.new(most_recent_lh_bar, most_recent_lh, bar_index, most_recent_lh,
color=bos_color, width=1, style=line.style_dotted, extend=extend.none)
// Calculate center position for BoS label
center_bar = math.round((most_recent_lh_bar + bar_index) / 2)
// Draw BoS label above the line for LH break
label.new(center_bar, most_recent_lh + (most_recent_lh * 0.0005), "BoS",
style=label.style_none, color=color.new(color.white, 100),
textcolor=bos_color, size=size.normal)
// BUY ENTRY
if not na(london_session_low) and not na(asian_absolute_high)
// Calculate stop loss based on settings
stop_loss_level = use_atr_sl ? close - (atr * atr_multiplier) : london_session_low
take_profit_level = asian_absolute_high
entry_price = close
// Calculate position size based on user settings
position_size = calculate_position_size(entry_price, stop_loss_level)
strategy.entry("BUY", strategy.long, qty=position_size, comment="BoS Buy")
strategy.exit("BUY EXIT", "BUY", stop=stop_loss_level, limit=take_profit_level, comment="SL/TP")
// Create trade visualization boxes (TradingView style) - minimum 8 bars width
// Blue profit zone box (from entry to take profit)
current_profit_box := box.new(left=bar_index, top=entry_price, right=bar_index + 8, bottom=take_profit_level,
bgcolor=color.new(color.blue, 70), border_width=0)
// Red stop loss zone box (from entry to stop loss)
current_sl_box := box.new(left=bar_index, top=stop_loss_level, right=bar_index + 8, bottom=entry_price,
bgcolor=color.new(color.red, 70), border_width=0)
trade_taken := true
bos_detected := true // Mark BoS as detected for this session
// Position close detection for extending boxes (based on Casper strategy)
if barstate.isconfirmed and strategy.position_size == 0 and strategy.position_size != 0
// Extend trade visualization boxes to exact exit point when position closes
if not na(current_profit_box)
// Ensure minimum 8 bars width or extend to current bar, whichever is longer
box_left = box.get_left(current_profit_box)
min_right = box_left + 8
final_right = math.max(min_right, bar_index)
box.set_right(current_profit_box, final_right)
current_profit_box := na // Clear reference after extending
if not na(current_sl_box)
// Ensure minimum 8 bars width or extend to current bar, whichever is longer
box_left = box.get_left(current_sl_box)
min_right = box_left + 8
final_right = math.max(min_right, bar_index)
box.set_right(current_sl_box, final_right)
current_sl_box := na // Clear reference after extending
// Backup safety check - extend boxes if position is closed but boxes still active
if not na(current_profit_box) and strategy.position_size == 0
box_left = box.get_left(current_profit_box)
min_right = box_left + 8
final_right = math.max(min_right, bar_index)
box.set_right(current_profit_box, final_right)
current_profit_box := na
if not na(current_sl_box) and strategy.position_size == 0
box_left = box.get_left(current_sl_box)
min_right = box_left + 8
final_right = math.max(min_right, bar_index)
box.set_right(current_sl_box, final_right)
current_sl_box := na
// Reset everything when new Asian session starts
if asian_start and show_swing_points
asian_session_high := na
asian_session_low := na
asian_high_bar := na
asian_low_bar := na
// Reset absolute levels
asian_absolute_high := na
asian_absolute_low := na
asian_high_line := na
asian_low_line := na
asian_high_label := na
asian_low_label := na
high_broken := false
low_broken := false
// Reset London session levels
london_session_high := na
london_session_low := na
// Reset market structure tracking
breakout_direction := na
last_hh_level := na
last_hl_level := na
last_ll_level := na
last_lh_level := na
last_swing_high := na
last_swing_low := na
last_high_bar := na
last_low_bar := na
structure_count := 0
last_structure_type := na
pending_high := na
pending_low := na
pending_high_bar := na
pending_low_bar := na
waiting_for_confirmation := false
// Reset BoS tracking
most_recent_hl := na
most_recent_lh := na
most_recent_hl_bar := na
most_recent_lh_bar := na
bos_detected := false
// Reset trading
trade_taken := false
// Reset current trade boxes
current_profit_box := na
current_sl_box := na
// Debug info (optional)
show_debug = input.bool(false, "Show Debug Info")
if show_debug
var table debug_table = table.new(position.top_right, 2, 3, bgcolor=color.white, border_width=1)
if barstate.islast
table.cell(debug_table, 0, 0, "Current Hour:", text_color=color.black)
table.cell(debug_table, 1, 0, str.tostring(current_hour), text_color=color.black)
table.cell(debug_table, 0, 1, "Asian Active:", text_color=color.black)
table.cell(debug_table, 1, 1, str.tostring((current_hour >= asian_start_hour) or (current_hour < asian_end_hour)), text_color=color.black)
table.cell(debug_table, 0, 2, "London Active:", text_color=color.black)
table.cell(debug_table, 1, 2, str.tostring((current_hour >= london_start_hour) and (current_hour < london_end_hour)), text_color=color.black)

Swing High/Low Levels (Auto Remove)Plots untapped swing high and low levels from higher timeframes. Used for liquidity sweep strategy. Cluster of swing levels are a magnet for price to return to and reverse. Indicator gives option for candle body or wick for sweep to remove lines.

One Trading Setup for Life ICT [TradingFinder] Sweep Session FVG🔵 Introduction
ICT One Trading Setup for Life is a trading strategy based on liquidity and market structure shifts, utilizing the PM Session Sweep to determine price direction. In this strategy, the market first forms a price range during the PM Session (from 13:30 to 16:00 EST), which includes the highest high (PM Session High) and lowest low (PM Session Low).
In the next session, the price first touches one of these levels to trigger a Liquidity Hunt before confirming its trend by breaking the Change in State of Delivery (CISD) Level. After this confirmation, the price retraces toward a Fair Value Gap (FVG) or Order Block (OB), which serve as the best entry points in alignment with liquidity.
In financial markets, liquidity is the primary driver of price movement, and major market participants such as institutional investors and banks are constantly seeking liquidity at key levels. This process, known as Liquidity Hunt or Liquidity Sweep, occurs when the price reaches an area with a high concentration of orders, absorbs liquidity, and then reverses direction.
In this setup, the PM Session range acts as a trading framework, where its highs and lows function as key liquidity zones that influence the next session’s price movement. After the New York market opens at 9:30 EST, the price initially breaks one of these levels to capture liquidity.
However, for a trend shift to be confirmed, the CISD Level must be broken.
Once the CISD Level is breached, the price retraces toward an FVG or OB, which serve as optimal trade entry points.
Bullish Setup :
Bearish Setup :
🔵 How to Use
In this strategy, the PM Session range is first identified, which includes the highest high (PM Session High) and lowest low (PM Session Low) between 13:30 and 16:00 EST. In the following session, the price touches one of these levels for a Liquidity Hunt, followed by a break of the Change in State of Delivery (CISD) Level. The price then retraces toward a Fair Value Gap (FVG) or Order Block (OB), creating a trading opportunity.
This process can occur in two scenarios : bearish and bullish setups.
🟣 Bullish Setup
In a bullish scenario, the PM Session High and PM Session Low are identified. In the following session, the price first breaks the PM Session Low, absorbing liquidity. This process results in a Fake Breakout to the downside, misleading retail traders into taking short positions.
After the Liquidity Hunt, the CISD Level is broken, confirming a trend reversal. The price then retraces toward an FVG or OB, offering an optimal long entry opportunity.
The initial take-profit target is the PM Session High, but if higher timeframe liquidity levels exist, extended targets can be set.
The stop-loss should be placed below the Fake Breakout low or the first candle of the FVG.
🟣 Bearish Setup
In a bearish scenario, the market first defines its PM Session High and PM Session Low. In the next session, the price initially breaks the PM Session High, triggering a Liquidity Hunt. This movement often causes a Fake Breakout, misleading retail traders into taking incorrect positions.
After absorbing liquidity, the CISD Level breaks, indicating a shift in market structure. The price then retraces toward an FVG or OB, offering the best short entry opportunity.
The initial take-profit target is the PM Session Low, but if additional liquidity exists on higher timeframes, lower targets can be considered.
The stop-loss should be placed above the Fake Breakout high or the first candle of the FVG.
🔵 Setting
CISD Bar Back Check : The Bar Back Check option enables traders to specify the number of past candles checked for identifying the CISD Level, enhancing CISD Level accuracy on the chart.
Order Block Validity : The number of candles that determine the validity of an Order Block.
FVG Validity : The duration for which a Fair Value Gap remains valid.
CISD Level Validity : The duration for which a CISD Level remains valid after being broken.
New York PM Session : Defines the PM Session range from 13:30 to 16:00 EST.
New York AM Session : Defines the AM Session range from 9:30 to 16:00 EST.
Refine Order Block : Enables finer adjustments to Order Block levels for more accurate price responses.
Mitigation Level OB : Allows users to set specific reaction points within an Order Block, including: Proximal: Closest level to the current price. 50% OB: Midpoint of the Order Block. Distal: Farthest level from the current price.
FVG Filter : The Judas Swing indicator includes a filter for Fair Value Gap (FVG), allowing different filtering based on FVG width: FVG Filter Type: Can be set to "Very Aggressive," "Aggressive," "Defensive," or "Very Defensive." Higher defensiveness narrows the FVG width, focusing on narrower gaps.
Mitigation Level FVG : Like the Order Block, you can set price reaction levels for FVG with options such as Proximal, 50% OB, and Distal.
Demand Order Block : Enables or disables bullish Order Block.
Supply Order Block : Enables or disables bearish Order Blocks.
Demand FVG : Enables or disables bullish FVG.
Supply FVG : Enables or disables bearish FVGs.
Show All CISD : Enables or disables the display of all CISD Levels.
Show High CISD : Enables or disables high CISD levels.
Show Low CISD : Enables or disables low CISD levels.
🔵 Conclusion
The ICT One Trading Setup for Life is a liquidity-based strategy that leverages market structure shifts and precise entry points to identify high-probability trade opportunities. By focusing on PM Session High and PM Session Low, this setup first captures liquidity at these levels and then confirms trend shifts with a break of the Change in State of Delivery (CISD) Level.
Entering a trade after a retracement to an FVG or OB allows traders to position themselves at optimal liquidity levels, ensuring high reward-to-risk trades. When used in conjunction with higher timeframe bias, order flow, and liquidity analysis, this strategy can become one of the most effective trading methods within the ICT Concept framework.
Successful execution of this setup requires risk management, patience, and a deep understanding of liquidity dynamics. Traders can enhance their confidence in this strategy by conducting extensive backtesting and analyzing past market data to optimize their approach for different assets.

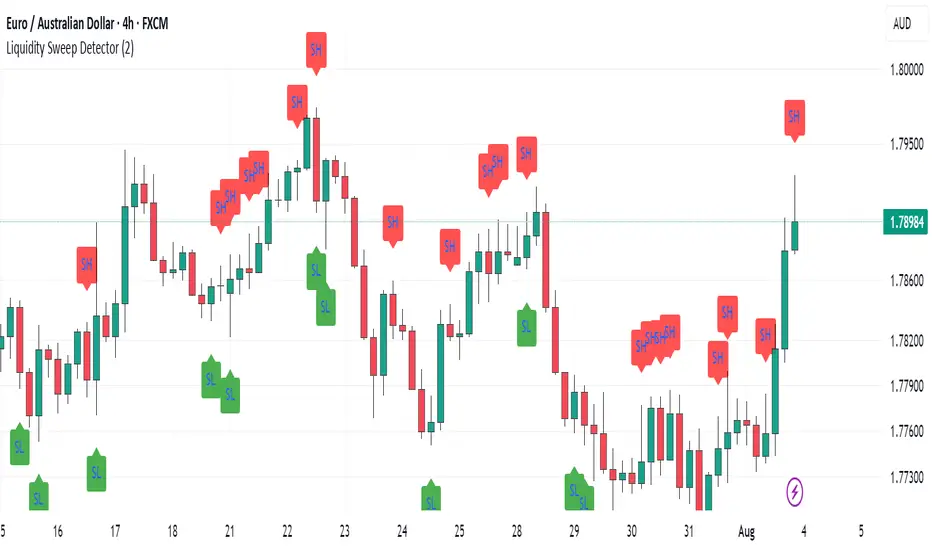
Liquidity Sweep Indicator (Signal-based SL + BE/TP)I created a more advanced version of my Liquidity Sweep Indicator. Open source, but I dont recommend to create a TV-strategy from the code because you should combine it with price action an chart analysis! Have fun :)

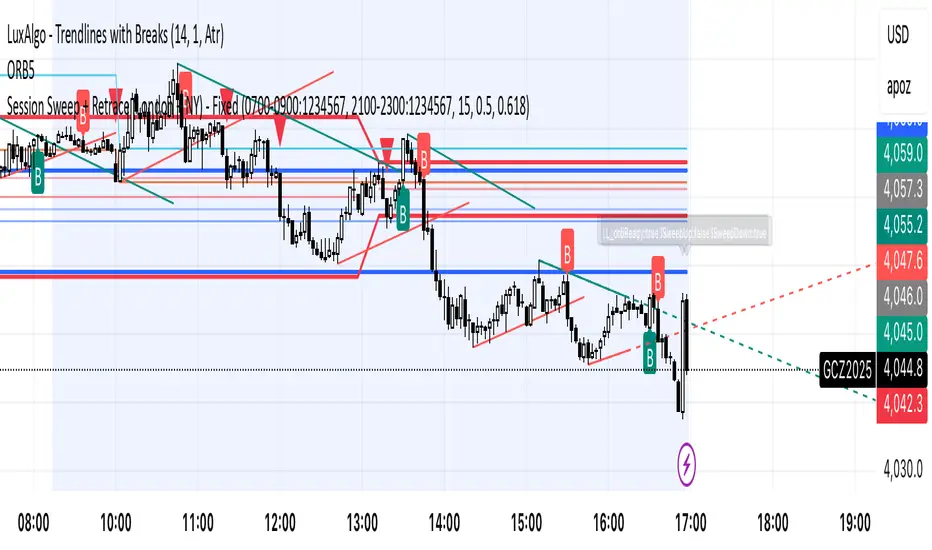
Session Sweep + Retrace (London + NY) - FixedORB Strategy with confluence. This sets out the 5 min session sweep from London and NY, and highlights a test back into the order zone with fib retracement.
BTC LL->HH Liquidity Sweep / BOS / Retest / 4H Bias v6_8BTC LL->HH Liquidity Sweep / BOS / Retest / 4H Bias v6_8

Liquidity Sweep Breakout - LSBLiquidity Sweep Breakout - LSB
A professional session-based breakout system designed for OANDA:USDJPY and other JPY pairs.
Not guesswork, but precision - built on detailed observation of institutional moves to capture clear trade direction daily.
Master the Market’s Daily Bank Flow.
---
Strategy Detail:
I discovered this strategy after carefully studying how Japanese banks influence the forex market during their daily settlement period. Banks are some of the biggest players in the financial world, and when they adjust or settle their accounts in the morning, it often creates a push in the market. From years of observation, I noticed a consistent pattern, once banks finish their settlements, the market usually continues moving in the same direction that was formed right after those actions. This daily banking flow often sets the tone for the entire trading session, especially for JPY pairs like USDJPY.
To capture this move, I built the indicator so that it follows the bank-driven trend with clear rules for entries, stop-loss (SL), and take-profit (TP). The system is designed with professional risk management in mind. By default, it assumes a $10,000 account size, risks only 1% of that balance per trade, and targets a 1:1.5 reward-to-risk ratio. This means for every $100 risked, the potential profit is $150. Such controlled risk makes the system safer and more sustainable for long-term traders. At the same time, users are not limited to this setup, they can adjust the account balance in the settings, and the indicator will automatically recalculate the lot size and risk levels based on their own capital. This ensures the strategy works for small accounts and larger accounts alike.
🌍 Why It Works
Fundamentally driven: Based on **daily Japanese banking settlement flows**.
Session-specific precision: Targets the exact window when USDJPY liquidity reshapes.
Risk-managed: Always calculates lot size based on account and risk preferences.
Automatable: With webhook + MT5 EA, it can be fully hands-free.
---
✅ Recommended
Pair: USDJPY (best observed behavior).
Timeframe: 3-Minute chart.
Platform: TradingView Premium (for webhooks).
Execution: MT5 via EA.
---
🔎 Strategy Concept
The Tokyo Magic Breakout (TMB) is built on years of session observation and the unique daily rhythm of the Japanese banking system.
Every morning between 5:50 AM – 6:10 AM PKT (09:50 – 10:10 JST), Japanese banks perform daily reconciliation and settlement. This often sets the tone for the USDJPY direction of the day.
This strategy isolates that critical moment of liquidity adjustment and waits for a clean breakout confirmation. Instead of chasing noise, it executes only when price action is aligned with the Tokyo market’s hidden flows.
---
🕒 Timing Logic
Session Start: 5:00 AM PKT (Tokyo market open range).
Magic Candle: The 5:54 AM PKT candle is marked as the reference “breakout selector.”
Checkpoints: First confirmation at 6:30 AM PKT, then every 15 minutes until 8:30 AM PKT.
* If price stays inside the magic range → wait.
* If a breakout happens but the candle wick touches the range → wait for the next checkpoint.
* If by 8:30 AM PKT no clean breakout occurs → the day is marked as No Trade Day (NTD).
👉 Recommended timeframe: 3-Minute chart (3M) for precise signals.
---
📈 Trade Execution
Entry: Clean break above/below the magic candle’s range.
Stop-Loss: Opposite side of the Tokyo session high/low.
Take-Profit: Calculated by Reward\:Risk ratio (default 1.5:1).
Lot Size: Auto-calculated based on your risk model:
* Fixed Dollar
* % of Equity
* Conservative (minimum of both).
Visuals include:
✅ Entry/SL/TP lines
✅ Shaded risk (red) and reward (green) zones
✅ Trade labels (Buy/Sell with lot size & levels)
✅ TP/SL hit markers
---
🔔 Alerts & Automation (AutoTMB)
This strategy is fully automation-ready with EA + MT5:
1. Enable alerts in TMB settings.
2. Insert your PineConnector License Key.
3. Configure your risk management preferences.
4. Create a TradingView alert → in the message box simply type:
Pine Script®
{{alert_message}}
and set the EA webhook.
Now, every breakout trade (with exact entry, SL, TP, and lot size) is sent instantly.
👉 On your MT5:
* Install the EA.
* Use the same license key.
* Run it on a VPS or local MT5 terminal.
You now have a hands-free trading system: AutoTMB.

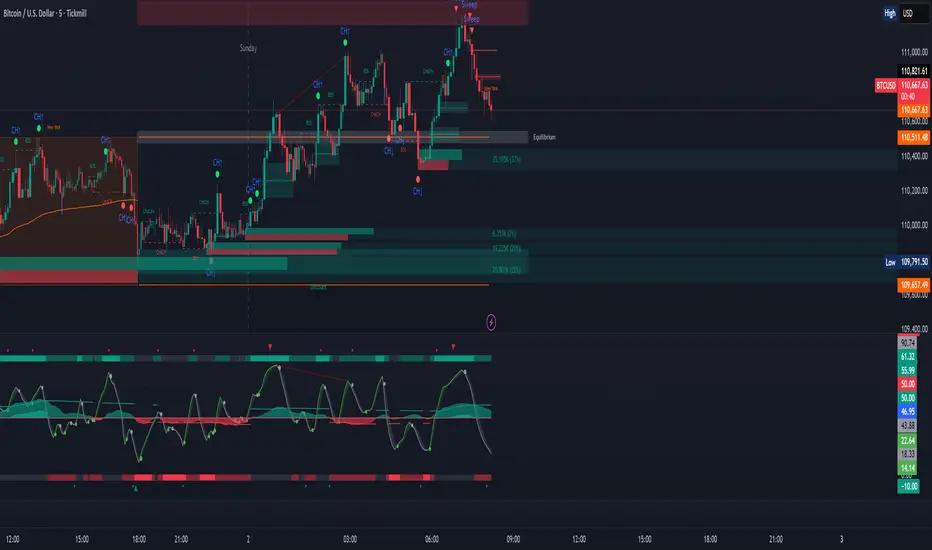
Current Hourly Open Liquidity with Sweep DetectionStatistics indicate that if the current hourly candle reaches the high or low of the previous hourly candle, there is a strong likelihood that the price will return to the current hour's open, depending on how quickly the previous hour's high or low was swept. If the sweep occurs within the first 20 minutes, there is a 75% chance the current hour's open will be reached; if it takes between 21 and 40 minutes, the probability decreases to 50%; and if it takes longer than 41 minutes, the chance drops to 25%.
These statistics can help identify manipulation on the hourly timeframe and guide trade decisions accordingly. For instance, if the previous hourly high is taken within the first 20 minutes but the current hour's open is not reached, it may be wise to avoid long positions until it happens or consider short positions in the direction of the open liquidity, using your existing entry rules and risk management.
The indicator highlights the current hour's open with a line and label to visually represent that liquidity pool, adjusting the line's color based on whether and when the previous hour's high or low was tapped. Once the open is reached, the indicator can, depending on settings, remove the line and label from the chart (this is enabled by default) since the liquidity pool is no longer relevant, preventing chart clutter.
All colors, line widths, label text sizes, and colors can be customized.

AMD Liquidity Sweep with AlertsAMD Liquidity Sweep with Alerts
Identify key liquidity levels from the Asian trading session with visual markers and alerts.
📌 Key Features:
Asia Session Detection
Customizable start/end hours (0-23) to match your trading timezone
Automatically calculates session high/low
Smart Swing Level Identification
Finds the closest significant swing high ≥ Asia high
Finds the closest significant swing low ≤ Asia low
Adjustable pivot sensitivity (# of left/right bars)
Professional Visuals
Dashed reference lines extending into the future
Blue-highlighted key levels
Clean label formatting with precise price levels
Trading Alerts
Price-cross alerts for liquidity breaks
Visual markers (triangles) when levels are breached
Separate alerts for buy-side/sell-side liquidity
Customization Options
Toggle intermediate swing highlights
Adjust label sizes
💡 Trading Applications:
Institutional Levels: Identify zones where Asian session liquidity pools exist
Breakout Trading: Get alerted when price breaches Asian session ranges
S/R Flip Zones: Watch how price reacts at these key reference levels
London/NY Open: Use Asian levels for early European session trades
🔧 How to Use:
Set your preferred Asia session hours
Adjust pivot sensitivity (default 1 bar works for most timeframes)
Enable alerts for breakouts if desired
Watch for reactions at the plotted levels

Session Breakout/Sweep with alertsThis indicator is based on popular London breakout strategy. but as I noticed that it don't work good with breakouts so I made it to be used as reversal entries as well. By default the timing is set for asian session but you can change it according to your need.
Use as breakout
Use as liquidity sweep
Note:
On some pairs the timing changes automatically (I don't know why), if you face this issue , go to settings and set the timing accordingly and save it as templet so that you don't have to change it every time you load the chart with timing issue.
I hope you guys find it useful. Do share your though and feedback in comments.

HTF Liquidity Levels█ OVERVIEW
The indicator introduces a new representation of the previous days, weeks, and months highs & lows ( DWM HL ) with a focus on untapped levels.
█ CONCEPTS
Untapped Levels
It is popularly known that the liquidity is located behind swing points or beyond higher time frames highs/lows (in a sense, an intraday swing point is a day high/low). These key areas are said "liquid" because of the accumulation of resting orders, mainly in the form of stop-loss orders. And this more significantly on higher time frames which have more time for stacking orders. As the result, the indicator aims to keep track of untapped levels that have their liquidity states intact.
Liquidity Pools
Once a liquidity level identified, or better, a cluster of liquidity levels work as magnets for the market. The price is more likely to make its way towards heavier pockets of liquidity, by proximity (the closest liquidity pool), and by difficulty (path with less obstacles). This phenomenon is referred as liquidity run, raid, purge, grab, hunt, sweep, you name it. Consequently, the indicator can help you frame a directional bias during your trading session.
█ NOTES
Drawings
Once a level is tapped, it is highlighted. At the end of each day, all tapped levels are cleared.

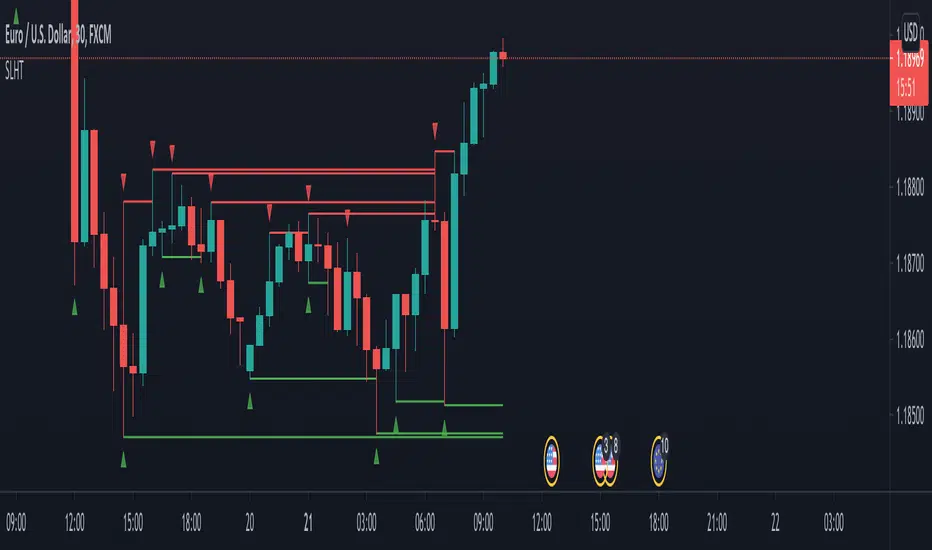
SL Hunter Tracker SL Hunter Tracker
coded by Bogdan Vaida
SL Hunter Tracker is a meticulous hunter that tracks SL hunters.
First it plots the fractals on the chart, then it draws lines from them
to the last wick that touched that height. You can add sweep alerts, once
per bar close, so that you get notified when a wick was touched.
Tested on: EURUSD 30'

Spring & Upthrust Trap (Zeiierman)█ Overview
Spring & Upthrust Trap (Zeiierman) is a Wyckoff-style “range sweep” indicator that highlights liquidity traps using a simple ZigZag pivot structure. It’s designed to catch the moment price briefly breaks a range boundary to trigger stops, then quickly snaps back into the range (rejection).
⚪ What It Detects
A Spring (Bull) is a downside fakeout. Price sweeps below the range boundary (taking liquidity), then rejects and returns back above the opposite boundary. In other words, it looks bearish for a moment, then flips bullish as the sweep fails.
An Upthrust (Bear) is the upside version. Price sweeps above the range boundary, then rejects and falls back through the opposite boundary. It looks bullish briefly, then flips bearish when that breakout fails.
█ How It Works
⚪ 1) Pivot Extraction (ZigZag Structure)
The script first compresses price into a small set of swing pivots using a ZigZag-style method driven by ZigZag Length. A bar becomes a pivot when it is the highest/lowest point inside the lookback window.
⚪ 2) Pattern Framing (X → A → B → C)
When there are at least four pivots available, the script maps the most recent pivot sequence into four labeled points:
X and A define the range boundaries (the box height is based on |A − X|)
B is the sweep pivot (the “fakeout” that breaks a boundary)
C is the rejection/snapback pivot that confirms the sweep failed
This is the minimum structure needed to define a trap without overfitting.
⚪ 3) Sweep Sizing (Filtering Noise vs Real Sweeps)
Not all boundary breaks are meaningful. The script measures sweep magnitude relative to the range size:
Sweep Fraction: |B − X| / |A − X|
This does two things:
Filters tiny pokes through a boundary (often random noise)
Filters extremely large breaks that are more likely to be true trend continuation rather than a trap
This is controlled by:
Min Sweep (minimum required violation)
Max Sweep (maximum allowed violation)
⚪ 4) Spring vs Upthrust Logic (Directional Trap Detection)
The script then decides which trap is forming:
Spring (Bull)
A downside sweep that fails: price breaks below the boundary, then returns strongly back through the opposite side.
Upthrust (Bear)
An upside sweep that fails: price breaks above the boundary, then returns strongly back through the opposite side.
█ How to Use
⚪ Interpreting a Spring (Bull)
A Spring is best treated as a failed breakdown. The sweep suggests stops were taken under the range, but the snapback implies that the market rejected lower prices.
Common behaviors after a good Spring:
fast reclaim back into the range
retest of the boundary from above (acceptance test)
continuation away from the sweep area if buyers remain in control
⚪ Interpreting an Upthrust (Bear)
An Upthrust is a failed breakout. Stops get taken above the range, but the price cannot hold outside and collapses back into/through the structure.
Common behaviors after a good Upthrust:
rejection wick and rapid return
retest of the boundary from below
continuation downward if sellers remain in control
█ Settings
ZigZag Length – pivot sensitivity. Higher = smoother, fewer signals. Lower = more pivots, more traps.
Show Patterns – detect Springs only, Upthrusts only, or both.
Min Sweep – minimum sweep size relative to range height (filters micro sweeps).
Max Sweep – maximum sweep size relative to range height (filters “real breaks”).
Confirm Pad – extra snapback requirement beyond the boundary (adds confirmation).
-----------------
Disclaimer
The content provided in my scripts, indicators, ideas, algorithms, and systems is for educational and informational purposes only. It does not constitute financial advice, investment recommendations, or a solicitation to buy or sell any financial instruments. I will not accept liability for any loss or damage, including without limitation any loss of profit, which may arise directly or indirectly from the use of or reliance on such information.
All investments involve risk, and the past performance of a security, industry, sector, market, financial product, trading strategy, backtest, or individual's trading does not guarantee future results or returns. Investors are fully responsible for any investment decisions they make. Such decisions should be based solely on an evaluation of their financial circumstances, investment objectives, risk tolerance, and liquidity needs.

Smart Trader, Episode 02, by Ata Sabanci | Battle of Candles ⚠️ CRITICAL: READ BEFORE USING ⚠️
This indicator is 100% VOLUME-BASED and requires Lower Timeframe (LTF) intrabar data for accurate calculations. Please understand the following limitations before using:
📊 DATA ACCURACY LEVELS:
• 1T (Tick) — Most accurate, real volume distribution per tick
• 1S (1 Second) — Reasonably accurate approximation
• 15S (15 Seconds) — Good approximation, longer historical data available
• 1M (1 Minute) — Rough approximation, maximum historical data range
⚠️ BACKTEST & REPLAY LIMITATIONS:
• Replay mode results may differ from live trading due to data availability
• For longer back test periods, use higher LTF settings (15S or 1M)
• Not all symbols/exchanges support tick-level data
• Crypto and Forex typically have better LTF data availability than stocks
💡 A NOTE ON TOOLS:
Successful trading requires proper tools. Higher TradingView plans provide access to more historical intrabar data, which directly impacts the accuracy of volume-based calculations. More precise volume data leads to more reliable signals. Consider this when evaluating your trading infrastructure.
📌 OVERVIEW
Smart Trader Episode 02: Battle of Candles is an advanced educational indicator that combines multiple analysis engines to help traders identify market scenarios and understand market dynamics. This is NOT financial advice or a trading signal service — it's a learning tool designed to help you understand how institutional traders might interpret price action.
The indicator integrates 7 major analysis engines into a unified dashboard, providing real-time insights into volume flow, trend structure, market phases, and potential trade setups.
⚡ KEY FEATURES
🎯 16-Pattern Scenario Engine
Automatically detects and classifies market conditions into 16 distinct scenarios, from strong continuation moves to potential reversals and traps.
💰 Trade Advisor Panel
Aggregates all signals into actionable suggestions with confidence levels, suggested entry/SL/TP levels, and risk/reward calculations.
📊 Volume Engine
Splits volume into buy/sell components using either Geometry (candle shape) or Intrabar (LTF data) methods for precise delta analysis.
📈 CVD (Cumulative Volume Delta)
Tracks the running total of buying vs selling pressure to identify accumulation, distribution, and divergences.
🎯 Stop-Hunt Detection
Identifies potential stop-hunt patterns where price sweeps liquidity levels before reversing.
📐 Pure Structure Trend Engine
Zero-lag trend detection based on swing highs/lows (HH/HL/LH/LL) without any lagging indicators.
⚡ Effort vs Result Analysis
Measures energy spent (volume) versus ground taken (price movement) to detect stalls, breakthroughs, and exhaustion.
🎯 SCENARIO ENGINE — 16 Market Patterns
The Scenario Engine analyzes multiple factors (candle anatomy, volume, forces, CVD, wick analysis) to classify each candle into one of 16 scenarios:
Continuation Scenarios (1-3)
1. ⚔️ STRONG MOVE — Big body candle (>60%) with volume confirming direction. Indicates strong momentum continuation.
2. 🛡️ ABSORPTION — One side attacks but the other absorbs the pressure. Price holds despite volume. Continuation expected in the absorbing side's favor.
3. 📉 PULLBACK — Small move against the trend with low volume. Indicates a healthy retracement before trend continuation.
Reversal Scenarios (4-6, 13-16)
4. 💥 REJECTION — Big wick (>40%) with small body and high volume. Price was rejected
at a level, potential reversal.
5. 🪤 TRAP — Pin direction disagrees with delta. Extreme wick size. Looks bullish/bearish but the opposite may happen.
6. 😫 EXHAUSTION — High energy spent (volume) but low ground taken (price movement). Both sides active but momentum fading.
13. 🔄 CVD BULL DIV — Price falling but CVD rising. Hidden buying detected (accumulation). Potential bullish reversal.
14. 🔄 CVD BEAR DIV — Price rising but CVD falling. Hidden selling detected (distribution). Potential bearish reversal.
15. 🎯 STOP HUNT BULL — Shorts were liquidated below support. Price swept liquidity and reversed. Expect bullish move.
16. 🎯 STOP HUNT BEAR — Longs were liquidated above resistance. Price swept liquidity and reversed. Expect bearish move.
Range/Stalemate Scenarios (7-9)
7. ⚖️ DEADLOCK — Market in balance. Force ratio between 0.4-0.6. Low volume. No side winning.
8. 🔥 BATTLE — High volume fight in a range. Both sides attacking. Wicks on both ends of candle.
9. 🎯 WAITING — Building phase with quiet volume. Market is preparing but no trigger yet. Wait for breakout.
Pre-Breakout Scenarios (10-12)
10. 🚀 BULL SETUP — Buyers accumulating in a building phase. Positive delta building. Bullish pressure growing.
11. 💣 BEAR SETUP — Sellers distributing in a building phase. Negative delta building. Bearish pressure growing.
12. ⚡ BREAKOUT — Price at boundary with strong candle and volume supporting. Imminent breakout expected.
💰 TRADE ADVISOR ENGINE
The Trade Advisor aggregates all signals from the different engines into a single actionable output. It uses a weighted scoring system:
Scoring Weights:
• Scenario Signal: 30%
• Trend Alignment: 20%
• CVD Momentum: 15% + Divergence Bonus
• Pin Forces: 15%
• Liquidity Sweep: 12%
• Stop-Hunt Detection: 10%
• Effort vs Result: 10%
Possible Actions:
• ⏳ WAIT — Edge not strong enough (stay patient)
• 🟢 LONG ENTRY — Buyers have strong advantage + signals align
• 🔴 SHORT ENTRY — Sellers have strong advantage + signals align
• ⚠️ CLOSE LONG/SHORT — Position at risk (reversal/trend flip)
• 🛑 STOP LOSS — Price hit risk threshold
• 💰 TAKE PROFIT — Target threshold reached
📊 EXTENDED INFO PANEL (Detailed Explanations)
The Extended Info panel is hidden by default (toggle: Show Extended Info in settings). It provides detailed metrics that feed into the main engines:
CVD ANALYSIS
What is CVD?
Cumulative Volume Delta (CVD) is the running total of Buy Volume minus Sell Volume. It reveals the underlying buying/selling pressure that may not be visible in price alone.
CVD Value & Slope:
• ↗ Rising: CVD increasing = net buying pressure (bullish)
• ↘ Falling: CVD decreasing = net selling pressure (bearish)
• → Flat: No clear pressure direction
Accumulation vs Distribution:
• Accumulation %: Shows buying pressure strength (0-100). High accumulation with CVD rising = strong bullish bias.
• Distribution %: Shows selling pressure strength (0-100). High distribution with CVD falling = strong bearish bias.
Divergence Alerts:
• ⚠️ BULLISH DIVERGENCE: Price falling but CVD rising. Hidden buying = potential reversal UP.
• ⚠️ BEARISH DIVERGENCE: Price rising but CVD falling. Hidden selling = potential reversal DOWN.
WICK ANALYSIS
Wick Torque:
Torque measures the "rotational force" from wicks. It's calculated from wick length, volume, and body efficiency.
• Positive Torque (Bullish): Bottom wick power dominates. Buyers defended lower prices.
• Negative Torque (Bearish): Top wick power dominates. Sellers defended higher prices.
• ⚡ High Torque (>30): Strong signal, significant wick rejection occurred.
Stop-Hunt Detection:
The engine detects when price has likely swept stop-losses clustered at key levels:
• Stop Hunt Risk %: Likelihood score (0-100). Above 55% = confirmed hunt.
• "Shorts hunted": Price swept below support, liquidating shorts, expect bounce UP.
• "Longs hunted": Price swept above resistance, liquidating longs, expect drop DOWN.
LIQUIDITY SWEEPS
This section appears only when a liquidity sweep is detected. The engine monitors for price sweeping recent highs/lows and then reversing:
• 🎯 LIQUIDITY SWEPT ABOVE: Price broke recent highs but closed back below. Longs trapped, expect DOWN.
• 🎯 LIQUIDITY SWEPT BELOW: Price broke recent lows but closed back above. Shorts trapped, expect UP.
POWER BALANCE
The Power Balance meter shows the real-time strength comparison between buyers and sellers.
Force Ratio:
• 0% = Complete seller dominance
• 50% = Perfect balance
• 100% = Complete buyer dominance
Visual Bar:
• Left side (▓): Bear territory
• Right side (▓): Bull territory
• The bar is smoothed over recent history to reduce noise.
EFFORT vs RESULT
This section measures the efficiency of price movement relative to volume expended.
Energy:
How much volume was spent relative to the average. Energy > 1.0x means above-average volume activity.
Ground:
How much price movement occurred relative to average range. Ground > 1.0x means above-average price movement.
STALL Warning:
A STALL is detected when high energy is spent but low ground is taken (high effort, low result). This often indicates institutional battle, exhaustion, or imminent reversal.
MARKET PHASE
The Phase Engine classifies the current market regime:
RANGE : No clear trend. Price confined to middle of channel. Low ADX. Balanced forces. Trade breakouts with caution.
BUILDING : Compression/preparation phase. Channel tightening or boundary penetration without follow-through. Watch for breakout direction.
TRENDING : Active directional move. Clear slope, good efficiency, price on trending side of channel. Favor pullback entries.
Strength:
0-100% score combining slope, volume validity, and force/efficiency filters.
Bars: How many candles the current phase has persisted.
TRACK RECORD (Validation Panel)
Enable with Show Validation Panel in settings. This section tracks the historical accuracy of scenario predictions:
Accuracy: Percentage of validated predictions that were correct.
Best/Worst Scenario: Shows which scenarios have the highest and lowest accuracy on the current symbol.
Recent Signals: Last 5 predictions with their outcomes. ✓ = correct, ✗ = wrong, ⏳ = pending validation.
⚙️ SETTINGS GUIDE
📊 Volume Analysis
Volume Calculation: Choose Geometry (estimates from candle shape) or Intrabar (precise LTF data).
Intrabar Resolution: LTF for precise mode. Try 1S, 15S, or 1T. Must be lower than chart timeframe.
History Depth: Candles stored in memory (5-50). Higher = more context, slower.
Memory Lookback: Bars for moving averages and Z-scores (10-100).
🏷️ Market Phase
Range Zone Width: How much of channel center is considered "range" (0.1-0.8).
Trend Sensitivity: Minimum slope to detect trending. Lower = more sensitive.
Min Episode Length: Minimum bars before phase can change. Prevents flickering.
🎯 Scenarios
Min Confidence to Show: Only display scenarios above this confidence level (30-90).
Bars to Validate: How many bars to wait before checking if prediction was correct.
Success Move %: Minimum price movement to consider prediction successful.
💰 Trade Advisor
Min Confidence for Entry: Minimum confidence to suggest a trade entry (50-90).
Default Risk %: Stop loss distance as % of price (0.5-5.0).
Min Risk/Reward: Minimum acceptable R:R ratio (1.0-5.0).
🔔 ALERT CONDITIONS
The indicator provides the following alert conditions you can configure:
• 🟢 LONG Entry Signal
• 🔴 SHORT Entry Signal
• ⚠️ Close LONG Signal
• ⚠️ Close SHORT Signal
• 🛑 STOP LOSS Alert
• 💰 Take Profit Alert
• 🚨 High Urgency Signal
⚠️ IMPORTANT DISCLAIMER
EDUCATIONAL TOOL ONLY
This indicator is designed for educational purposes to help users identify different market scenarios and understand how various signals might be interpreted.
The Trade Advisor is NOT a recommendation to buy, sell, or invest.
• Past performance does not guarantee future results
• All trading involves risk of loss
• The creator is not a licensed financial advisor
• Always do your own research (DYOR)
• Consult a qualified financial advisor before making any investment decisions
By using this indicator, you acknowledge that you understand these risks and accept full responsibility for your trading decisions.

CISD [TakingProphets]🧠 Indicator Purpose:
The "CISD - Change in State of Delivery" is a precision tool designed for traders utilizing ICT (Inner Circle Trader) conecpets. It detects critical shifts in delivery conditions after liquidity sweeps — helping you spot true smart money activity and optimal trade opportunities. This script is especially valuable for traders applying liquidity concepts, displacement recognition, and market structure shifts at both intraday and swing levels.
🌟 What Makes This Indicator Unique:
Unlike basic trend-following or scalping tools, CISD operates through a two-phase smart money logic:
Liquidity Sweep Detection (sweeping Buyside or Sellside Liquidity).
State of Delivery Change Identification (through bearish or bullish displacement after the sweep).
It intelligently tracks candle sequences and only signals a CISD event after true displacement — offering a much deeper context than ordinary indicators.
⚙️ How the Indicator Works:
Swing Point Detection: Identifies recent pivot highs/lows to map Buyside Liquidity (BSL) and Sellside Liquidity (SSL) zones.
Liquidity Sweeps: Watches for price breaches of these liquidity points to detect institutional stop hunts.
Sequence Recognition: Finds series of same-direction candles before sweeps to mark institutional accumulation/distribution.
Change of Delivery Confirmation: Confirms CISD only after significant displacement moves price against the initial candle sequence.
Visual Markings: Automatically plots CISD lines and optional labels, customizable in color, style, and size.
🎯 How to Use It:
Identify Liquidity Sweeps: Watch for CISD levels plotted after a liquidity sweep event.
Plan Entries: Look for retracements into CISD lines for high-probability entries.
Manage Risk: Use CISD levels to refine your stop-loss and profit-taking zones.
Best Application:
After stop hunts during Killzones (London Open, New York AM).
As part of the Flow State Model: identify higher timeframe PD Arrays ➔ wait for lower timeframe CISD confirmation.
🔎 Underlying Concepts:
Liquidity Pools: Highs and lows cluster stop orders, attracting institutional sweeps.
Displacement: Powerful price moves post-sweep confirm smart money involvement.
Market Structure: CISD frequently precedes major Change of Character (CHoCH) or Break of Structure (BOS) shifts.
🎨 Customization Options:
Adjustable line color, width, and style (solid, dashed, dotted).
Optional label display with customizable color and sizing.
Line extension settings to keep CISD zones visible for future reference.
✅ Recommended for:
Traders studying ICT Smart Money Concepts.
Intraday scalpers and higher timeframe swing traders.
Traders who want to improve entries around liquidity sweeps and institutional displacement moves.
🚀 Bonus Tip:
For maximum confluence, pair this with the HTF POI, ICT Liquidity Levels, and HTF Market Structure indicators available at TakingProphets.com! 🔥

2022 Model ICT Entry Strategy [TradingFinder] One Setup For Life🔵 Introduction
The ICT 2022 model, introduced by Michael Huddleston, is an advanced trading strategy rooted in liquidity and price imbalance, where time and price serve as the core elements. This ICT 2022 trading strategy is an algorithmic approach designed to analyze liquidity and imbalances in the market. It incorporates concepts such as Fair Value Gap (FVG), Liquidity Sweep, and Market Structure Shift (MSS) to help traders identify liquidity movements and structural changes in the market, enabling them to determine optimal entry and exit points for their trades.
This Full ICT Day Trading Model empowers traders to pinpoint the Previous Day High/Low as well as the highs and lows of critical sessions like the London and New York sessions. These levels act as Liquidity Zones, which are frequently swept prior to a market structure shift (MSS) or a retracement to areas such as Optimal Trade Entry (OTE).
Bullish :
Bearish :
🔵 How to Use
The ICT 2022 model is a sophisticated trading strategy that focuses on identifying key liquidity levels and price movements. It operates based on two main principles. In the first phase, the price approaches liquidity zones and sweeps critical levels such as the previous day’s high or low and key session levels.
This movement is known as a Liquidity Sweep. In the second phase, following the sweep, the price retraces to areas like the FVG (Fair Value Gap), creating ideal entry points for trades. Below is a detailed explanation of how to apply this strategy in bullish and bearish setups.
🟣 Bullish ICT 2022 Model Setup
To use the ICT 2022 model in a bullish setup, start by identifying the Previous Day High/Low or key session levels, such as those of the London or New York sessions. In a bullish setup, the price usually moves downward first, sweeping the Liquidity Low. This move, known as a Liquidity Sweep, reflects the collection of buy orders by major market participants.
After the liquidity sweep, the price should shift market structure and start moving upward; this shift, referred to as Market Structure Shift (MSS), signals the beginning of an upward trend. Following MSS, areas like FVG, located within the Discount Zone, are identified. At this stage, the trader waits for the price to retrace to these zones. Once the price returns, a long trade is executed.
Finally, the stop-loss should be set below the liquidity low to manage risk, while the take-profit target is usually placed above the previous day’s high or other identified liquidity levels. This structure enables traders to take advantage of the upward price movement after the liquidity sweep.
🟣 Bearish ICT 2022 Model Setup
To identify a bearish setup in the ICT 2022 model, begin by marking the Previous Day High/Low or key session levels, such as the London or New York sessions. In this scenario, the price typically moves upward first, sweeping the Liquidity High. This move, known as a Liquidity Sweep, signifies the collection of sell orders by key market players.
After the liquidity sweep, the price should shift market structure downward. This movement, called the Market Structure Shift (MSS), indicates the start of a downtrend. Following MSS, areas such as FVG, found within the Premium Zone, are identified. At this stage, the trader waits for the price to retrace to these areas. Once the price revisits these zones, a short trade is executed.
In this setup, the stop-loss should be placed above the liquidity high to control risk, while the take-profit target is typically set below the previous day’s low or another defined liquidity level. This approach allows traders to capitalize on the downward price movement following the liquidity sweep.
🔵 Settings
Swing period : You can set the swing detection period.
Max Swing Back Method : It is in two modes "All" and "Custom". If it is in "All" mode, it will check all swings, and if it is in "Custom" mode, it will check the swings to the extent you determine.
Max Swing Back : You can set the number of swings that will go back for checking.
FVG Length : Default is 120 Bar.
MSS Length : Default is 80 Bar.
FVG Filter : This refines the number of identified FVG areas based on a specified algorithm to focus on higher quality signals and reduce noise.
Types of FVG filters :
Very Aggressive Filter: Adds a condition where, for an upward FVG, the last candle's highest price must exceed the middle candle's highest price, and for a downward FVG, the last candle's lowest price must be lower than the middle candle's lowest price. This minimally filters out FVGs.
Aggressive Filter: Builds on the Very Aggressive mode by ensuring the middle candle is not too small, filtering out more FVGs.
Defensive Filter: Adds criteria regarding the size and structure of the middle candle, requiring it to have a substantial body and specific polarity conditions, filtering out a significant number of FVGs.
Very Defensive Filter: Further refines filtering by ensuring the first and third candles are not small-bodied doji candles, retaining only the highest quality signals.
🔵 Conclusion
The ICT 2022 model is a comprehensive and advanced trading strategy designed around key concepts such as liquidity, price imbalance, and market structure shifts (MSS). By focusing on the sweep of critical levels such as the previous day’s high/low and important trading sessions like London and New York, this strategy enables traders to predict market movements with greater precision.
The use of tools like FVG in this model helps traders fine-tune their entry and exit points and take advantage of bullish and bearish trends after liquidity sweeps. Moreover, combining this strategy with precise timing during key trading sessions allows traders to minimize risk and maximize returns.
In conclusion, the ICT 2022 model emphasizes the importance of time and liquidity, making it a powerful tool for both professional and novice traders. By applying the principles of this model, you can make more informed trading decisions and seize opportunities in financial markets more effectively.

SMC Liquidity EngineSMC Liquidity Engine MTF is a multi-timeframe market structure and liquidity-based trading system designed to track institutional order flow. It identifies swing highs and lows to map market structure, detects breaks of structure and changes of character, and filters entries using higher-timeframe bias. By combining liquidity sweeps with structure shifts, the system highlights high-probability reversal and continuation zones where smart money is most likely active.
In normal human language, it waits for price to hunt stops, confirms the trend on a higher timeframe, then marks where professionals would step in. That is how you avoid getting farmed by noise and actually trade with intent.

ICT Anchored Market Structures with Validation [LuxAlgo]The ICT Anchored Market Structures with Validation indicator is an advanced iteration of the original Pure-Price-Action-Structures tool, designed for price action traders.
It systematically tracks and validates key price action structures, distinguishing between true structural shifts/breaks and short-term sweeps to enhance trend and reversal analysis. The indicator automatically highlights structural points, confirms breakouts, identifies sweeps, and provides clear visual cues for short-term, intermediate-term, and long-term market structures.
A distinctive feature of this indicator is its exclusive reliance on price patterns. It does not depend on any user-defined input, ensuring that its analysis remains robust, objective, and uninfluenced by user bias, making it an effective tool for understanding market dynamics.
🔶 USAGE
Market structure is a cornerstone of price action analysis. This script automatically detects real-time market structures across short-term, intermediate-term, and long-term levels, simplifying trend analysis for traders. It assists in identifying both trend reversals and continuations with greater clarity.
Market structure shifts and breaks help traders identify changes in trend direction. A shift signals a potential reversal, often occurring when a swing high or low is breached, suggesting a transition in trend. A break, on the other hand, confirms the continuation of an established trend, reinforcing the current direction. Recognizing these shifts and breaks allows traders to anticipate price movement with greater accuracy.
It’s important to note that while a CHoCH may signal a potential trend reversal and a BoS suggests a continuation of the prevailing trend, neither guarantees a complete reversal or continuation. In some cases, CHoCH and BoS levels may act as liquidity zones or areas of consolidation rather than indicating a clear shift or continuation in market direction. The indicator’s validation component helps confirm whether the detected CHoCH and BoS are true breakouts or merely liquidity sweeps.
🔶 DETAILS
🔹 Market Structures
Market structures are derived from price action analysis, focusing on identifying key levels and patterns in the market. Swing point detection, a fundamental concept in ICT trading methodologies and teachings, plays a central role in this approach.
Swing points are automatically identified based exclusively on market movements, without requiring any user-defined input.
🔹 Utilizing Swing Points
Swing points are not identified in real-time as they form. Short-term swing points may appear with a delay of up to one bar, while the identification of intermediate and long-term swing points is entirely dependent on subsequent market movements. Importantly, this detection process is not influenced by any user-defined input, relying solely on pure price action. As a result, swing points are generally not intended for real-time trading scenarios.
Instead, traders often analyze historical swing points to understand market trends and identify potential entry and exit opportunities. By examining swing highs and lows, traders can:
Recognize Trends: Swing highs and lows provide insight into trend direction. Higher swing highs and higher swing lows signify an uptrend, while lower swing highs and lower swing lows indicate a downtrend.
Identify Support and Resistance Levels: Swing highs often act as resistance levels, referred to as Buyside Liquidity Levels in ICT terminology, while swing lows function as support levels, also known as Sellside Liquidity Levels. Traders can leverage these levels to plan their trade entries and exits.
Spot Reversal Patterns: Swing points can form key reversal patterns, such as double tops or bottoms, head and shoulders, and triangles. Recognizing these patterns can indicate potential trend reversals, enabling traders to adjust their strategies effectively.
Set Stop Loss and Take Profit Levels: In ICT teachings, swing levels represent price points with expected clusters of buy or sell orders. Traders can target these liquidity levels/pools for position accumulation or distribution, using swing points to define stop loss and take profit levels in their trades.
Overall, swing points provide valuable information about market dynamics and can assist traders in making more informed trading decisions.
🔹 Logic of Validation
The validation process in this script determines whether a detected market structure shift or break represents a confirmed breakout or a sweep.
The breakout is confirmed when the close price is significantly outside the deviation range of the last detected structural price. This deviation range is defined by the 17-period Average True Range (ATR), which creates a buffer around the detected market structure shift or break.
A sweep occurs when the price breaches the structural level within the deviation range but does not confirm a breakout. In this case, the label is updated to 'SWEEP.'
A visual box is created to represent the price range where the breakout or sweep occurs. If the validation process continues, the box is updated. This box visually highlights the price range involved in a sweep, helping traders identify liquidity events on the chart.
🔶 SETTINGS
The settings for Short-Term, Intermediate-Term, and Long-Term Structures are organized into groups, allowing users to customize swing points, market structures, and visual styles for each.
🔹 Structures
Swings and Size: Enables or disables the display of swing highs and lows, assigns icons to represent the structures, and adjusts the size of the icons.
Market Structures: Toggles the visibility of market structure lines.
Market Structure Validation: Enable or disable validation to distinguish true breakouts from liquidity sweeps.
Market Structure Labels: Displays or hides labels indicating the type of market structure.
Line Style and Width: Allows customization of the style and width of the lines representing market structures.
Swing and Line Colors: Provides options to adjust the colors of swing icons, market structure lines, and labels for better visualization.
🔶 RELATED SCRIPTS
Pure-Price-Action-Structures.
Market-Structures-(Intrabar).
