스크립트에서 "supertrend"에 대해 찾기

SSL MACD - nhuthang83supertrend method, supertrend method, supertrend method, supertrend method, supertrend method,


SuperTrended Moving Averages Strategyself use
used in 1 second timeframe
please let me publish it aaa

CPR PIVOT, 2ST, 5MA, VWAPSUPERTREND
2 supertrend with diffrent patameters.
MOVING AVERAGE RIBBON
5 differenT EMA
VWAP
Simple vwap with bands nothing special
every parameters and looks can be change
AND CPR


Supertrend + RSI + EMA + MACD - Fixed Single SignalMomentum trading with signals to add alerts and connect to API for Algo trading


SuperTrend Zone Rejection [STRZ] CONCEPT -
This indicator identifies trend-continuation setups by combining the Super Trend with dynamic Average True Range (ATR) value zones. It highlights specific price action behaviour's—specifically wick rejections and momentum closes—that occur during pullbacks into the trend baseline.
HOW IT WORKS -
The script operates on three logic gates:
>> Trend Filter: Uses a standard Super Trend (Factor 3, Period 10 default) to define market direction.
>> Dynamic Zones: Projects a volatility-based zone (default 2.0x ATR) above or below the Super Trend line to define a valid pullback area.
>> Signal Detection: Identifies specific candle geometries occurring within these zones.
>> Rejection: Candles with significant wicks testing the zone support/resistance.
>> Momentum: Candles that open within the zone and close in the upper/lower quartile of their range.
FEATURES -
>> Dynamic Channel: Visualizes the active buy/sell zone using a continuous, non-repainting box.
>> Volatile Filtering: Filters out low-volatility candles (doji's/noise) based on minimum ATR size.
>> Visuals: Color-coded trend visualization with distinct signal markers for qualified entries.
SETTINGS -
>> Super Trend: Adjustable Factor and ATR Period.
>> Zone Multiplier: Controls the width of the pullback zone relative to ATR.
>> Visuals: Customizable colours for zones and signals to fit light/dark themes.

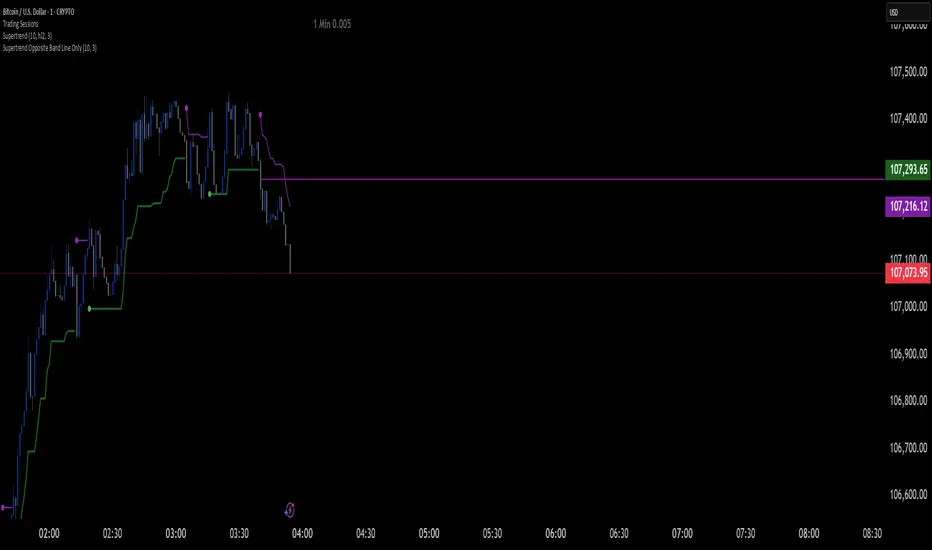
Supertrend Opposite Band Line Onlywhen super trend changes Trend , its important to wait for crossing the Price line of opposite Band so i have written this script . this will help you Traders for sure
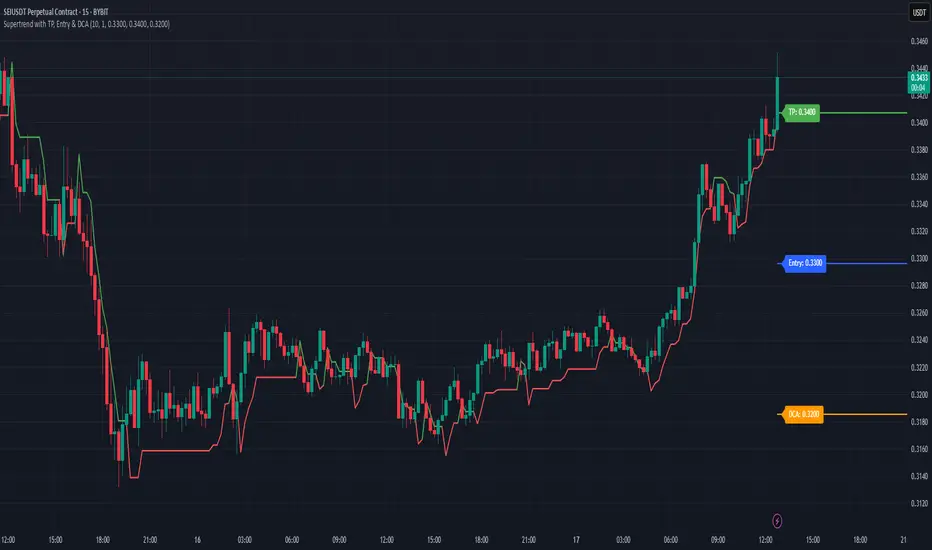
Supertrend with TP, Entry & DCAThis script is super trend plus, horizontal lines for Take Profit, Entry Price and DCA.
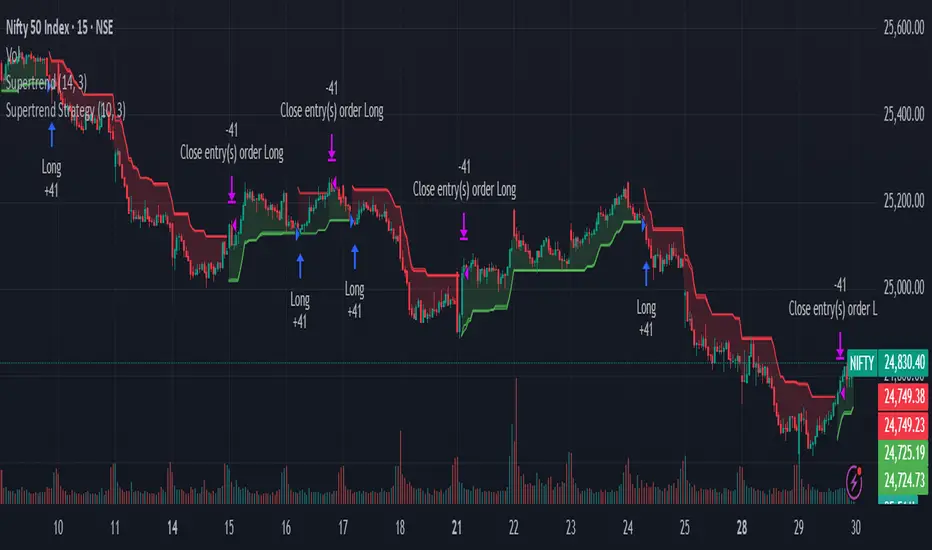
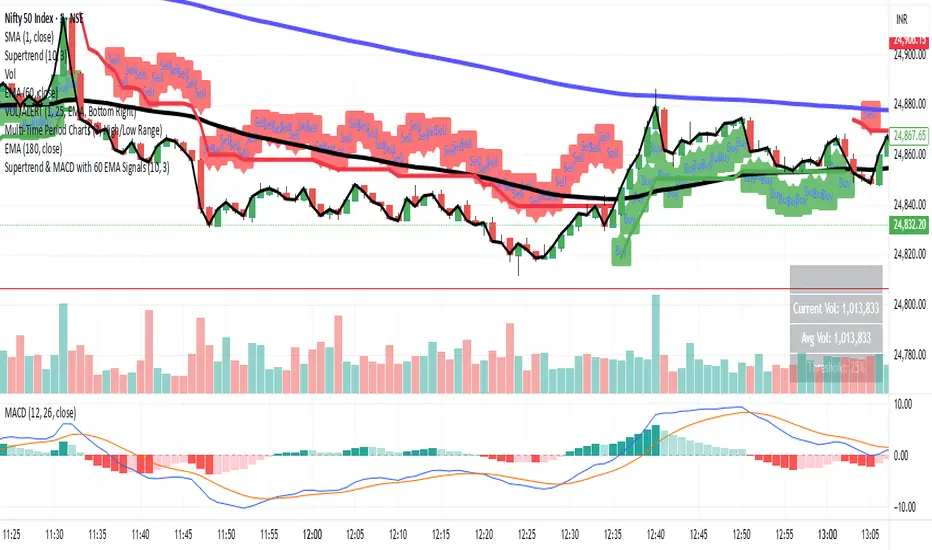
Supertrend & MACD with 60 EMA Signalsthis is a great way to understand market without getting biased ...excellent for intraday entry
Supertrend & CCI Strategy ScalpThis strategy is based on 2 Super Trend Indicators along with CCI .
The longer factor length gives you the current trend and the deviation in the short factor length gives us the opportunity to enter in the trade .
CCI indicator is used to determine the overbought and oversold levels.
Setup :
Long : When atrLength1 > close and atrLength2 < close and CCI < -100 we look for long trades as the longer factor length will be bullish .
Short : When atrLength1 < close and atrLength2 > close and CCI > 100 we look for short trades as the longer factor length will be bearish .
Please tune the settings according to your use .
Trade what you see not what you feel .
Please consult with your financial advisor before you deploy any real money for trading .

SuperTrend VolatilityThis indicator is actually composition of 3 indicator to one common one
it based on super trend , OBV and volatility % range
obv act as our source for the super trend to make it more sensitive
you can control it as a regular super trend + the addition of volatility % range (volatility factor)
so 1 is volatility range , can be from 0.1 to 5 depend on your liking.
i set it here in this example of btc 4 hour chart to be 0.5 which is 1/2 of the volatility % range since it fitted better this particular asset . for stock i prefer 1 as my factor
this indicator as i normally do have alert and signal inside.
the aim of this indicator is to maximize trend on one hand and other to keep sensitivity high
one of the problem with regular super trend that as we keep the we increase the trend to be longer it lose sensitivity .
by this method that i show here i try to minimize that bad effect and make it both sensitive and more responsive. this is one of the reason i use a modified version of OBV as a source to it .
for each asset that you use try to find the best fit so this model can work properly
here apple with factor=1 as range
on daily it better half of volatility range
NIO
gold 4 hour
gold 1 hour

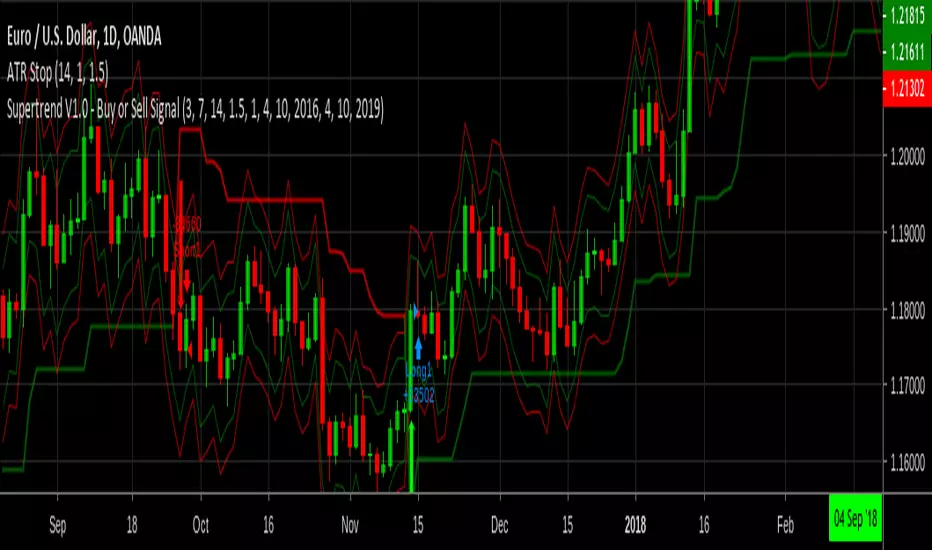
Supertrend V1.0 - Buy or Sell SignalTesting a concept to get a TP and SL based on the ATR at the time of the position entry.

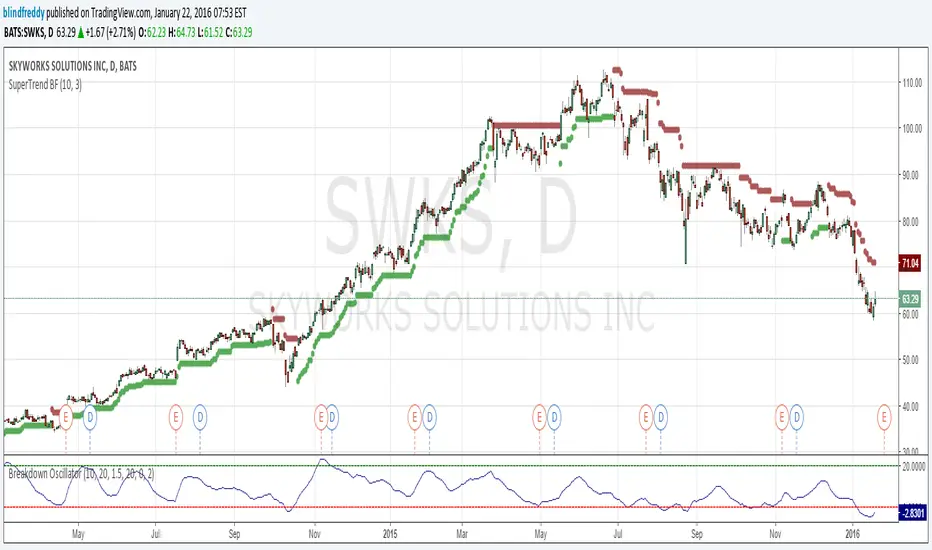
SuperTrend BFI am republishing this indicator as something changed within TradingView's script engine so that the old script ceased to function ( a minor syntax error that used to be acceptable but no longer is).
Anyhow here's the fixed version which as you can see has done a great job of keeping us on the right side of the trend with once-hot stocks like Skyworks !