Plot Multiple Stock Avg Buy , Stop Loss, Target(s-a-t-i-s-h)This indicator will be mostly helpful for individual, broker or consultant who deal with multiple stock purchase and would like to plot Buy Price, Stop Loss, Target, Just upload the stocks in the format given in the indicator and Voila we have all the plotting in the respective charts. Thanks to Claude for helping me to finalize my idea this indicator.
Now consultant / stock broker can give the list to there client with the respective levels and then can plot it easy with this one indicator.
Enjoy--
스크립트에서 "stop loss"에 대해 찾기

Custom ATR Stop Loss Calculator by riyukireiruCan automatically input the entry price, calculate ATR stop-loss, allow customizable period, adjustable table position, selectable MA ATR type, and customizable ATR value.

Long-Only Trailing Stop Loss Strategy by Ravi PrasadSimple & Eligant way to make money. As the profit % increases, the trailing stop loss follows tightly !
Multiple EMAs with RSI and ATR Stop-LossMultiple EMA Buy and Sell with pre condition of Overbought Oversold RSI pre requirement. Purple line is Stop Loss Level.

SMA150 Stop Loss AlertSMA150 indicator that alerts you when stock falls under 150 with additional of -2% (for avoiding early stop-loss)

AI - Williams Alligator Strategy (ATR Stop-Loss) AlertsAI - Williams Alligator Strategy (ATR Stop-Loss) with Alerts

ATR stop lossPlots the stop loss level based on average true range (ATR) and a multiplier of choice (1 to 2.5, default is 1.5), subtracted from closing price.
Additions in this version:
You can now show percentage labels to help evaluate the level of risk.
The color of the plotted line and the text labels can be picked by the user.

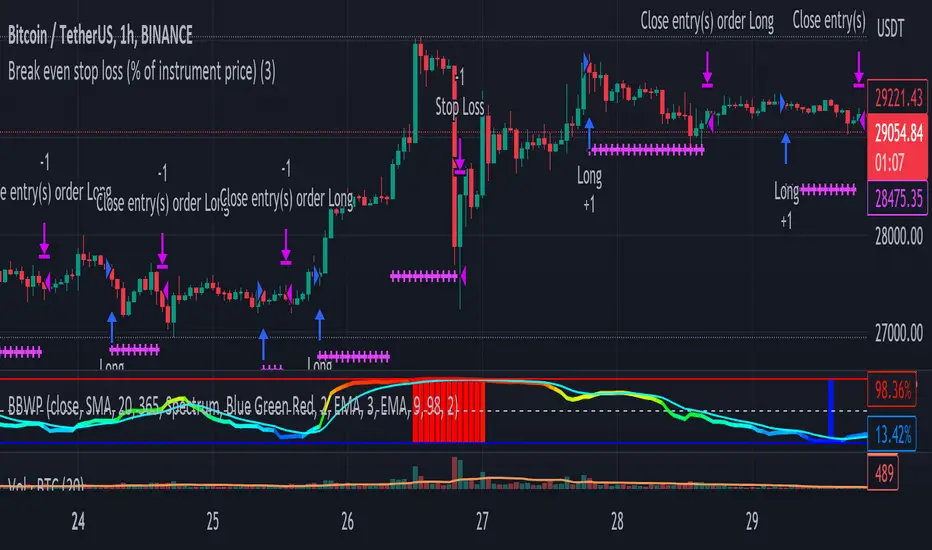
Break even stop loss (% of instrument price)Simply proof of concept to place a stop loss a percentage below entry price and move it to break even if the price moves the same percentage above the entre price.
EMA and MACD with Trailing Stop Loss (by Coinrule)An exponential moving average ( EMA ) is a type of moving average (MA) that places a greater weight and significance on the most recent data points. The exponential moving average is also referred to as the exponentially weighted moving average. An exponentially weighted moving average reacts more significantly to recent price changes than a simple moving average simple moving average ( SMA ), which applies an equal weight to all observations in the period.
Moving average convergence divergence ( MACD ) is a trend-following momentum indicator that shows the relationship between two moving averages of a security’s price. The MACD is calculated by subtracting the 26-period exponential moving average ( EMA ) from the 12-period EMA.
The result of that calculation is the MACD line. A nine-day EMA of the MACD called the "signal line," is then plotted on top of the MACD line, which can function as a trigger for buy and sell signals. Traders may buy the security when the MACD crosses above its signal line and sell—or short—the security when the MACD crosses below the signal line. Moving average convergence divergence ( MACD ) indicators can be interpreted in several ways, but the more common methods are crossovers, divergences, and rapid rises/falls.
The Strategy enters and closes the trade when the following conditions are met:
LONG
The MACD histogram turns bearish
EMA7 is greater than EMA14
EXIT
Price increases 3% trailing
Price decreases 1% trailing
This strategy is back-tested from 1 January 2022 to simulate how the strategy would work in a bear market and provides good returns.
Pairs that produce very strong results include XRPUSDT on the 1-minute timeframe. This short timeframe means that this strategy opens and closes trades regularly
In order to further improve the strategy, the EMA can be changed from 7 and 14 to, say, EMA20 and EMA50. Furthermore, the trailing stop loss can also be changed to ideally suit the user to match their needs.
The strategy assumes each order is using 30% of the available coins to make the results more realistic and to simulate you only ran this strategy on 30% of your holdings. A trading fee of 0.1% is also taken into account and is aligned to the base fee applied on Binance.

Oversold RSI with Tight Stop-Loss Strategy (by Coinrule)KRAKEN:LINKUSD
This is one of the best strategies that can be used to get familiar with technical indicators and start to include them in your rules on Coinrule .
ENTRY
1. This trading system uses the RSI (Relative Strength Index) to anticipate good points to enter positions. RSI is a technical indicator frequently used in trading. It works by measuring the speed and change of price movements to determine whether a coin is oversold (indicating a good entry point) or overbought (indicating a point of exit/entry for a short position). The RSI oscillates between 0 and 100 and is traditionally considered overbought when over 70 and oversold when below 30.
2. To pick the right moment to buy, the strategy enters a trade when the RSI falls below 30 indicating the coin is oversold and primed for a trend reversal.
EXIT
The strategy then exits the position when the price appreciates 7% from the point of entry. The position also maintains a tight stop-loss and closes the position if the price depreciates 1% from the entry price. The idea behind this is to cut your losing trades fast and let your winners ride.
The best time frame for this strategy based on our back testing data is the daily. Shorter time frames can also work well on certain coins, however in our experience, the daily works best. Feel free to experiment with this script and test it on a variety of your coins! With our back testing data a trading fee of 0.1% is taken into account. The fee is aligned to the base fee applied on Binance, which is the largest cryptocurrency exchange by volume. In the example shown, this strategy made a handsome net profit of 52.6% on Chainlink with 66.67% of trades being profitable.
You can execute this strategy on your favorite exchanges with Coinrule .

isamuch - 2MA Cross and Stop Lossสัญญาณซื้อ/ขาย : มาจาก Moving Average สองเส้นตัดกัน
Stop Loss : มาจากราคาต่ำสุด/สูงสุดของช่วงระหว่าง Moving Average สองเส้นตัดกันก่อนหน้ากับ Moving Average ตัดกันปัจจุบัน

Parabolic SAR Strategy With take profit and stop lossDo not make it too difficult!
This is my first strategy! I took the Parabolic SAR Strategy and added Stop Loss and Take profit, and I can see some fantastic results in 2h-3h-4h on some of the Crypto coins.
This is for training only, and I do not recommend using it as part of a trading bot, however, I do myself.

MultiPrice AlertThis is an alert script using Pinescript version 4. This enables one to set 5 alerts (1 StopLoss, 4 Targets), on 3 different symbols, at using a single alert in the UI.
Every visible line will only appear on the symbols that are selected. After setting targets when making an alert, select this indicator as a condition. Change the name to whatever you want, usually the names of the set of tickers.
The Alert message is dyanmic showing which Symbol with each type of alert, at whatever price.
Ability to disable the targets + symbols.
Alerts work by Stop Loss crossing under price and Targets Cross Over. Enabling the "Short" Targets reverses this.
The line that is being displayed is actually the price of the asset being moved over x number of bars. I have not found a way to plot a traditional horizontal line, as the code for it uses a fixed price.
As it being a user input, it is a variable. Any help with this would be appreicated.
Alerts are set to once per bar.
Known bug that sometimes if the prices that you set are inside the current candle stick, then your alert will immeaditally fire, either change the timeframe or let it fire and wait fo
After a target is hit, I reccomend setting the alert to 0 and REMAKING the alert. You MUST REMAKE THE ALERT AFTER ANY CHANGES. This script WILL NOT CHANGE ALERTS AS YOU CHANGE SETTINGS.
TradingView Alerts are not this smart , at least I haven't found a way to do this yet.


Anti-Volume Stop Loss multi timeframe [LM]Hello Traders,
I would like to introduce you fork of popular indicator Anti-Volume Stop Loss created by Buff Dormeier and cracked here on tradingview by @Rafka so shout out to him. I have tried to crack it myself as well as I'm big fan of Dormeier's work but it's not easy so really big thanks to Rafka
I have refactored original script and have included multi timeframe setting.
As its shown below you can select higher timeframe to track lower one:
Enjoy!

Bitlinc MARSI Study AST w/ Take Profit & Stop loss - beta 0.1This script is beta 0.1 - will update as soon as the script is tradable
This script is based on AST on a 10 minute timeframe. You can change the asset and the timeframe for any asset you want to trade, but for it to work correct ALL settings have to be testes in the Strategy section of the TradingView. Each assets and timeframe require a different mixture of settings. This is NOT a one settings fits all trading for all assets on any timeframe. Below are the settings and explanation on how it works.
How it fires a buy / sell:
The script will plot an RSI with upper and lower bands in a separate indicator window. The idea behind this script is to fire a LONG when MA crosses OVER lower band and fire a SHORT when the MA crosses under the lower band. Each order that fires is an OCO (Order Cancels Order) for pyramiding.
Settings:
You have full control of these settings as mentioned above, you must configure every part of this script for each asset and timeframe you trade.
- Length of MA
- Length
- Upper bands of RSI
- Lower bands of RSI
- Take profit percentage
- Stop loss percentage
- Month to start and end the strategy (within 2020)
- Day to start and end the strategy (within 2020)
- Quantity type
- Slippage
- Pyramiding
***Remember that after the signal to enter or exit a trade is fired, the alert will trigger AFTER the close of the candle that caused the tigger to fire

ATR Stop Loss LONG/SHORT by melihgulerYou can monitor the stop loss level according to ATR in 2 ways (Long/Short).

RSI + EMA+ MTF Stop-LossThis is a simple RSI with multiple MTF (No security) to help with direction short and long-term.
The rsi for the current chart has a noise reduction, while the rest are based on ma's.
I have supplied an extra flexible mtf rsi ma for potential adjustable/long-term stop-loss or direction identification.
Enjoy

RSI Stop LossExperiment for using RSI as a stop loss value, shows where the price will be when the RSI increases or decreases by a specified amount.


MACD Enhanced Strategy MTF with Stop Loss [LTB]I developed this script to analyse MACD, MACD Signal, MACD Histogram movements by using current and higher time frame. Script calculates higher time frame automatically, no manuel entry. I also added trailing stop loss line. You can change the parameters as you wish ;)
btw. you should know that MACD is more successful when there is trend.
If you like it please comment and check out my other scripts.

TrVSA Dual ATR Stop LossThis indicator highlight the Dual ATR Stop Loss for both long and short trade.

poki buy and sell Take profit and stop lossThis indicator is based on modelius model of lazy bear weis model with ATR for the buy=B sell =S
in addition there is Take profit and stop loss in % both for short and for long
next stage is to know the resistance level and support based on bollinger marked in blue and red dots
Also included Parabolic Sar (blue and red dots rising up or down)
The color of bulish or bearish zone is based on the cross of Hull avreage and linear regression ( for each time set may need different setting for accuracy )
So how to use this scrupt to better profit
1. if you have B signal and its on lower support level then its good starting place for buy. look at the Parabolic Sar if its in agreement. The exit can be either by S =sell, Take profit that you decide on % or by end of Parabolic SAR upward
2. exact the oposite for short
Play with setting for the desired results or change modify this script for your purpose
