Sunil BB Blast Heikin Ashi StrategySunil BB Blast Heikin Ashi Strategy
The Sunil BB Blast Heikin Ashi Strategy is a trend-following trading strategy that combines Bollinger Bands with Heikin-Ashi candles for precise market entries and exits. It aims to capitalize on price volatility while ensuring controlled risk through dynamic stop-loss and take-profit levels based on a user-defined Risk-to-Reward Ratio (RRR).
Key Features:
Trading Window:
The strategy operates within a user-defined time window (e.g., from 09:20 to 15:00) to align with market hours or other preferred trading sessions.
Trade Direction:
Users can select between Long Only, Short Only, or Long/Short trade directions, allowing flexibility depending on market conditions.
Bollinger Bands:
Bollinger Bands are used to identify potential breakout or breakdown zones. The strategy enters trades when price breaks through the upper or lower Bollinger Band, indicating a possible trend continuation.
Heikin-Ashi Candles:
Heikin-Ashi candles help smooth price action and filter out market noise. The strategy uses these candles to confirm trend direction and improve entry accuracy.
Risk Management (Risk-to-Reward Ratio):
The strategy automatically adjusts the take-profit (TP) level and stop-loss (SL) based on the selected Risk-to-Reward Ratio (RRR). This ensures that trades are risk-managed effectively.
Automated Alerts and Webhooks:
The strategy includes automated alerts for trade entries and exits. Users can set up JSON webhooks for external execution or trading automation.
Active Position Tracking:
The strategy tracks whether there is an active position (long or short) and only exits when price hits the pre-defined SL or TP levels.
Exit Conditions:
The strategy exits positions when either the take-profit (TP) or stop-loss (SL) levels are hit, ensuring risk management is adhered to.
Default Settings:
Trading Window:
09:20-15:00
This setting confines the strategy to the specified hours, ensuring trading only occurs during active market hours.
Strategy Direction:
Default: Long/Short
This allows for both long and short trades depending on market conditions. You can select "Long Only" or "Short Only" if you prefer to trade in one direction.
Bollinger Band Length (bbLength):
Default: 19
Length of the moving average used to calculate the Bollinger Bands.
Bollinger Band Multiplier (bbMultiplier):
Default: 2.0
Multiplier used to calculate the upper and lower bands. A higher multiplier increases the width of the bands, leading to fewer but more significant trades.
Take Profit Multiplier (tpMultiplier):
Default: 2.0
Multiplier used to determine the take-profit level based on the calculated stop-loss. This ensures that the profit target aligns with the selected Risk-to-Reward Ratio.
Risk-to-Reward Ratio (RRR):
Default: 1.0
The ratio used to calculate the take-profit relative to the stop-loss. A higher RRR means larger profit targets.
Trade Automation (JSON Webhooks):
Allows for integration with external systems for automated execution:
Long Entry JSON: Customizable entry condition for long positions.
Long Exit JSON: Customizable exit condition for long positions.
Short Entry JSON: Customizable entry condition for short positions.
Short Exit JSON: Customizable exit condition for short positions.
Entry Logic:
Long Entry:
The strategy enters a long position when:
The Heikin-Ashi candle shows a bullish trend (green close > open).
The price is above the upper Bollinger Band, signaling a breakout.
The previous candle also closed higher than it opened.
Short Entry:
The strategy enters a short position when:
The Heikin-Ashi candle shows a bearish trend (red close < open).
The price is below the lower Bollinger Band, signaling a breakdown.
The previous candle also closed lower than it opened.
Exit Logic:
Take-Profit (TP):
The take-profit level is calculated as a multiple of the distance between the entry price and the stop-loss level, determined by the selected Risk-to-Reward Ratio (RRR).
Stop-Loss (SL):
The stop-loss is placed at the opposite Bollinger Band level (lower for long positions, upper for short positions).
Exit Trigger:
The strategy exits a trade when either the take-profit or stop-loss level is hit.
Plotting and Visuals:
The Heikin-Ashi candles are displayed on the chart, with green candles for uptrends and red candles for downtrends.
Bollinger Bands (upper, lower, and basis) are plotted for visual reference.
Entry points for long and short trades are marked with green and red labels below and above bars, respectively.
Strategy Alerts:
Alerts are triggered when:
A long entry condition is met.
A short entry condition is met.
A trade exits (either via take-profit or stop-loss).
These alerts can be used to trigger notifications or webhook events for automated trading systems.
Notes:
The strategy is designed for use on intraday charts but can be applied to any timeframe.
It is highly customizable, allowing for tailored risk management and trading windows.
The Sunil BB Blast Heikin Ashi Strategy combines two powerful technical analysis tools (Bollinger Bands and Heikin-Ashi candles) with strong risk management, making it suitable for both beginners and experienced traders.
Feebacks are welcome from the users.
스크립트에서 "stop loss"에 대해 찾기

Marcel's Dynamic Profit / Loss Calculator for GoldOverview
This Dynamic Risk / Reward Tool for Gold is designed to help traders efficiently plan and manage their trades in the volatile gold market. This script provides a clear visualisation of trade levels (Entry, Stop Loss, Take Profit) while dynamically calculating potential profit and loss. It ensures gold traders can assess their positions with precision, saving time and improving risk management.
Key Features
1. Trade Level Visualisation:
Plots Entry (Blue), Stop Loss (Red), and Take Profit (Green) lines directly on the chart.
Helps you visualise and confirm trade setups quickly which is good for scalping and day trades.
2. Dynamic Risk and Reward Calculations:
Calculates potential profit and loss in real time based on user-defined inputs such as position size, leverage, and account equity.
Displays a summary panel showing risk/reward metrics directly on the chart.
3. Customisable Settings:
Allows you to adjust key parameters like account equity, position size, leverage, and specific price levels for Entry, Stop Loss, and Take Profit.
Defaults are dynamically generated for convenience but remain fully adjustable for flexibility.
How It Works
The script uses gold-specific conventions (e.g., 1 lot = 100 ounces, 1 pip = 0.01 price change) to calculate accurate risk and reward metrics.
It dynamically positions Stop Loss and Take Profit levels relative to the entry price, based on user-defined or default offsets.
A real-time summary panel is displayed in the bottom-right corner of the chart, showing:
Potential Profit: The monetary value if the Take Profit is hit.
Potential Lo
ss: The monetary value if the Stop Loss is hit.
How to Use It
1. Add the script to your chart on a gold trading pair (e.g., XAUUSD).
2. Input your:
Account equity.
Leverage.
Position size (in lots).
Desired En
try Price (default: current close price).
3. Adjust the Stop Loss and Take Profit levels to your strategy, or let the script use default offsets of:
500 pips below the Entry for Stop Loss.
1000 pips above the Entry for Take Profit.
4. Review the plotted levels and the summary panel to confirm your trade aligns with your risk/reward goals.
Why Use This Tool?
Clarity and Precision:
Provides clear trade visuals and financial metrics for confident decision-making.
Time-Saving:
Automates the calculations needed to evaluate trade risk and reward.
Improved Risk Management:
Ensures you never trade without knowing your exact potential loss and gain.
This script is particularly useful for both novice and experienced traders looking to enhance their risk management and trading discipline in the Gold market. Enjoy clearer trades at speed.

ICT Master Suite [Trading IQ]Hello Traders!
We’re excited to introduce the ICT Master Suite by TradingIQ, a new tool designed to bring together several ICT concepts and strategies in one place.
The Purpose Behind the ICT Master Suite
There are a few challenges traders often face when using ICT-related indicators:
Many available indicators focus on one or two ICT methods, which can limit traders who apply a broader range of ICT related techniques on their charts.
There aren't many indicators for ICT strategy models, and we couldn't find ICT indicators that allow for testing the strategy models and setting alerts.
Many ICT related concepts exist in the public domain as indicators, not strategies! This makes it difficult to verify that the ICT concept has some utility in the market you're trading and if it's worth trading - it's difficult to know if it's working!
Some users might not have enough chart space to apply numerous ICT related indicators, which can be restrictive for those wanting to use multiple ICT techniques simultaneously.
The ICT Master Suite is designed to offer a comprehensive option for traders who want to apply a variety of ICT methods. By combining several ICT techniques and strategy models into one indicator, it helps users maximize their chart space while accessing multiple tools in a single slot.
Additionally, the ICT Master Suite was developed as a strategy . This means users can backtest various ICT strategy models - including deep backtesting. A primary goal of this indicator is to let traders decide for themselves what markets to trade ICT concepts in and give them the capability to figure out if the strategy models are worth trading!
What Makes the ICT Master Suite Different
There are many ICT-related indicators available on TradingView, each offering valuable insights. What the ICT Master Suite aims to do is bring together a wider selection of these techniques into one tool. This includes both key ICT methods and strategy models, allowing traders to test and activate strategies all within one indicator.
Features
The ICT Master Suite offers:
Multiple ICT strategy models, including the 2022 Strategy Model and Unicorn Model, which can be built, tested, and used for live trading.
Calculation and display of key price areas like Breaker Blocks, Rejection Blocks, Order Blocks, Fair Value Gaps, Equal Levels, and more.
The ability to set alerts based on these ICT strategies and key price areas.
A comprehensive, yet practical, all-inclusive ICT indicator for traders.
Customizable Timeframe - Calculate ICT concepts on off-chart timeframes
Unicorn Strategy Model
2022 Strategy Model
Liquidity Raid Strategy Model
OTE (Optimal Trade Entry) Strategy Model
Silver Bullet Strategy Model
Order blocks
Breaker blocks
Rejection blocks
FVG
Strong highs and lows
Displacements
Liquidity sweeps
Power of 3
ICT Macros
HTF previous bar high and low
Break of Structure indications
Market Structure Shift indications
Equal highs and lows
Swings highs and swing lows
Fibonacci TPs and SLs
Swing level TPs and SLs
Previous day high and low TPs and SLs
And much more! An ongoing project!
How To Use
Many traders will already be familiar with the ICT related concepts listed above, and will find using the ICT Master Suite quite intuitive!
Despite this, let's go over the features of the tool in-depth and how to use the tool!
The image above shows the ICT Master Suite with almost all techniques activated.
ICT 2022 Strategy Model
The ICT Master suite provides the ability to test, set alerts for, and live trade the ICT 2022 Strategy Model.
The image above shows an example of a long position being entered following a complete setup for the 2022 ICT model.
A liquidity sweep occurs prior to an upside breakout. During the upside breakout the model looks for the FVG that is nearest 50% of the setup range. A limit order is placed at this FVG for entry.
The target entry percentage for the range is customizable in the settings. For instance, you can select to enter at an FVG nearest 33% of the range, 20%, 66%, etc.
The profit target for the model generally uses the highest high of the range (100%) for longs and the lowest low of the range (100%) for shorts. Stop losses are generally set at 0% of the range.
The image above shows the short model in action!
Whether you decide to follow the 2022 model diligently or not, you can still set alerts when the entry condition is met.
ICT Unicorn Model
The image above shows an example of a long position being entered following a complete setup for the ICT Unicorn model.
A lower swing low followed by a higher swing high precedes the overlap of an FVG and breaker block formed during the sequence.
During the upside breakout the model looks for an FVG and breaker block that formed during the sequence and overlap each other. A limit order is placed at the nearest overlap point to current price.
The profit target for this example trade is set at the swing high and the stop loss at the swing low. However, both the profit target and stop loss for this model are configurable in the settings.
For Longs, the selectable profit targets are:
Swing High
Fib -0.5
Fib -1
Fib -2
For Longs, the selectable stop losses are:
Swing Low
Bottom of FVG or breaker block
The image above shows the short version of the Unicorn Model in action!
For Shorts, the selectable profit targets are:
Swing Low
Fib -0.5
Fib -1
Fib -2
For Shorts, the selectable stop losses are:
Swing High
Top of FVG or breaker block
The image above shows the profit target and stop loss options in the settings for the Unicorn Model.
Optimal Trade Entry (OTE) Model
The image above shows an example of a long position being entered following a complete setup for the OTE model.
Price retraces either 0.62, 0.705, or 0.79 of an upside move and a trade is entered.
The profit target for this example trade is set at the -0.5 fib level. This is also adjustable in the settings.
For Longs, the selectable profit targets are:
Swing High
Fib -0.5
Fib -1
Fib -2
The image above shows the short version of the OTE Model in action!
For Shorts, the selectable profit targets are:
Swing Low
Fib -0.5
Fib -1
Fib -2
Liquidity Raid Model
The image above shows an example of a long position being entered following a complete setup for the Liquidity Raid Modell.
The user must define the session in the settings (for this example it is 13:30-16:00 NY time).
During the session, the indicator will calculate the session high and session low. Following a “raid” of either the session high or session low (after the session has completed) the script will look for an entry at a recently formed breaker block.
If the session high is raided the script will look for short entries at a bearish breaker block. If the session low is raided the script will look for long entries at a bullish breaker block.
For Longs, the profit target options are:
Swing high
User inputted Lib level
For Longs, the stop loss options are:
Swing low
User inputted Lib level
Breaker block bottom
The image above shows the short version of the Liquidity Raid Model in action!
For Shorts, the profit target options are:
Swing Low
User inputted Lib level
For Shorts, the stop loss options are:
Swing High
User inputted Lib level
Breaker block top
Silver Bullet Model
The image above shows an example of a long position being entered following a complete setup for the Silver Bullet Modell.
During the session, the indicator will determine the higher timeframe bias. If the higher timeframe bias is bullish the strategy will look to enter long at an FVG that forms during the session. If the higher timeframe bias is bearish the indicator will look to enter short at an FVG that forms during the session.
For Longs, the profit target options are:
Nearest Swing High Above Entry
Previous Day High
For Longs, the stop loss options are:
Nearest Swing Low
Previous Day Low
The image above shows the short version of the Silver Bullet Model in action!
For Shorts, the profit target options are:
Nearest Swing Low Below Entry
Previous Day Low
For Shorts, the stop loss options are:
Nearest Swing High
Previous Day High
Order blocks
The image above shows indicator identifying and labeling order blocks.
The color of the order blocks, and how many should be shown, are configurable in the settings!
Breaker Blocks
The image above shows indicator identifying and labeling order blocks.
The color of the breaker blocks, and how many should be shown, are configurable in the settings!
Rejection Blocks
The image above shows indicator identifying and labeling rejection blocks.
The color of the rejection blocks, and how many should be shown, are configurable in the settings!
Fair Value Gaps
The image above shows indicator identifying and labeling fair value gaps.
The color of the fair value gaps, and how many should be shown, are configurable in the settings!
Additionally, you can select to only show fair values gaps that form after a liquidity sweep. Doing so reduces "noisy" FVGs and focuses on identifying FVGs that form after a significant trading event.
The image above shows the feature enabled. A fair value gap that occurred after a liquidity sweep is shown.
Market Structure
The image above shows the ICT Master Suite calculating market structure shots and break of structures!
The color of MSS and BoS, and whether they should be displayed, are configurable in the settings.
Displacements
The images above show indicator identifying and labeling displacements.
The color of the displacements, and how many should be shown, are configurable in the settings!
Equal Price Points
The image above shows the indicator identifying and labeling equal highs and equal lows.
The color of the equal levels, and how many should be shown, are configurable in the settings!
Previous Custom TF High/Low
The image above shows the ICT Master Suite calculating the high and low price for a user-defined timeframe. In this case the previous day’s high and low are calculated.
To illustrate the customizable timeframe function, the image above shows the indicator calculating the previous 4 hour high and low.
Liquidity Sweeps
The image above shows the indicator identifying a liquidity sweep prior to an upside breakout.
The image above shows the indicator identifying a liquidity sweep prior to a downside breakout.
The color and aggressiveness of liquidity sweep identification are adjustable in the settings!
Power Of Three
The image above shows the indicator calculating Po3 for two user-defined higher timeframes!
Macros
The image above shows the ICT Master Suite identifying the ICT macros!
ICT Macros are only displayable on the 5 minute timeframe or less.
Strategy Performance Table
In addition to a full-fledged TradingView backtest for any of the ICT strategy models the indicator offers, a quick-and-easy strategy table exists for the indicator!
The image above shows the strategy performance table in action.
Keep in mind that, because the ICT Master Suite is a strategy script, you can perform fully automatic backtests, deep backtests, easily add commission and portfolio balance and look at pertinent metrics for the ICT strategies you are testing!
Lite Mode
Traders who want the cleanest chart possible can toggle on “Lite Mode”!
In Lite Mode, any neon or “glow” like effects are removed and key levels are marked as strict border boxes. You can also select to remove box borders if that’s what you prefer!
Settings Used For Backtest
For the displayed backtest, a starting balance of $1000 USD was used. A commission of 0.02%, slippage of 2 ticks, a verify price for limit orders of 2 ticks, and 5% of capital investment per order.
A commission of 0.02% was used due to the backtested asset being a perpetual future contract for a crypto currency. The highest commission (lowest-tier VIP) for maker orders on many exchanges is 0.02%. All entered positions take place as maker orders and so do profit target exits. Stop orders exist as stop-market orders.
A slippage of 2 ticks was used to simulate more realistic stop-market orders. A verify limit order settings of 2 ticks was also used. Even though BTCUSDT.P on Binance is liquid, we just want the backtest to be on the safe side. Additionally, the backtest traded 100+ trades over the period. The higher the sample size the better; however, this example test can serve as a starting point for traders interested in ICT concepts.
Community Assistance And Feedback
Given the complexity and idiosyncratic applications of ICT concepts amongst its proponents, the ICT Master Suite’s built-in strategies and level identification methods might not align with everyone's interpretation.
That said, the best we can do is precisely define ICT strategy rules and concepts to a repeatable process, test, and apply them! Whether or not an ICT strategy is trading precisely how you would trade it, seeing the model in action, taking trades, and with performance statistics is immensely helpful in assessing predictive utility.
If you think we missed something, you notice a bug, have an idea for strategy model improvement, please let us know! The ICT Master Suite is an ongoing project that will, ideally, be shaped by the community.
A big thank you to the @PineCoders for their Time Library!
Thank you!

CPR by NKDCentral Pivot Range (CPR) Trading Strategy:
The Central Pivot Range (CPR) is a widely-used tool in technical analysis, helping traders pinpoint potential support and resistance levels in the market. By using the CPR effectively, traders can better gauge market trends and determine favorable entry and exit points. This guide explores how the CPR works, outlines its calculation, and describes how traders can enhance their strategies using an extended 10-line version of CPR.
What Really Central Pivot Range (CPR) is?
At its core, the CPR consists of three key lines:
Pivot Point (PP) – The central line, calculated as the average of the previous day’s high, low, and closing prices.
Upper Range (R1) – Positioned above the Pivot Point, acting as a potential ceiling where price may face resistance.
Lower Range (S1) – Found below the Pivot Point, serving as a potential floor where price might find support.
Advanced traders often expand on the traditional three-line CPR by adding extra levels above and below the pivot, creating up to a 10-line system. This extended CPR allows for a more nuanced understanding of the market and helps identify more detailed trading opportunities.
Applying CPR for Trading Success
1. How CPR is Calculation
The CPR relies on the previous day's high (H), low (L), and close (C) prices to create its structure:
Pivot Point (PP) = (H + L + C) / 3
First Resistance (R1) = (2 * PP) - L
First Support (S1) = (2 * PP) - H
Additional resistance levels (R2, R3) and support levels (S2, S3) are calculated by adding or subtracting multiples of the previous day’s price range (H - L) from the Pivot Point.
2. Recognizing the Market Trend
To effectively trade using CPR, it’s essential to first determine whether the market is trending up (bullish) or down (bearish). In an upward-trending market, traders focus on buying at support levels, while in a downward market, they look to sell near resistance.
3. Finding Ideal Entry Points
Traders often look to enter trades when price approaches key levels within the CPR range. Support levels (S1, S2) offer buying opportunities, while resistance levels (R1, R2) provide selling opportunities. These points are considered potential reversal zones, where price may bounce or reverse direction.
4. Managing Risk with Stop-Loss Orders
Proper risk management is crucial in any trading strategy. A stop-loss should be set slightly beyond the support level for buy positions and above the resistance level for sell positions, ensuring that losses are contained if the market moves against the trader’s position.
5. Determining Profit Targets
Profit targets are typically set based on the distance between entry points and the next support or resistance level. Many traders apply a risk-reward ratio, aiming for larger potential profits compared to the potential losses. However, if the next resistance and support level is far then middle levels are used for targets (i.e. 50% of R1 and R2)
6. Confirmation Through Other Indicators
While CPR provides strong support and resistance levels, traders often use additional indicators to confirm potential trade setups. Indicators such as moving averages can
help validate the signals provided by the CPR.
7. Monitoring Price Action At CPR Levels
Constantly monitoring price movement near CPR levels is essential. If the price fails to break through a resistance level (R1) or holds firm at support (S1), it can offer cues on when to exit or adjust a trade. However, a strong price break past these levels often signals a continued trend.
8. Trading Breakouts with CPR
When the price breaks above resistance or below support with strong momentum, it may signal a potential breakout. Traders can capitalize on these movements by entering positions in the direction of the breakout, ideally confirmed by volume or other technical indicators.
9. Adapting to Changing Market Conditions
CPR should be used in the context of broader market influences, such as economic reports, news events, or geopolitical shifts. These factors can dramatically affect market direction and how price reacts to CPR levels, making it important to stay informed about external market conditions.
10. Practice and Backtesting for Improvements
Like any trading tool, the CPR requires practice. Traders are encouraged to backtest their strategies on historical price data to get a better sense of how CPR works in different market environments. Continuous analysis and practice help improve decision-making and strategy refinement.
The Advantages of Using a 10-Line CPR System
An extended 10-line CPR system—comprising up to five resistance and five support levels—provides more granular control and insight into market movements. This expanded view helps traders better gauge trends and identify more opportunities for entry and exit. Key benefits include:
R2, S2 Levels: These act as secondary resistance or support zones, giving traders additional opportunities to refine their trade entries and exits.
R3, S3 Levels: Provide an even wider range for identifying reversals or trend continuations in more volatile markets.
Flexibility: The broader range of levels allows traders to adapt to changing market conditions and make more precise decisions based on market momentum.
So in Essential:
The Central Pivot Range is a valuable tool for traders looking to identify critical price levels in the market. By providing a clear framework for identifying potential support and resistance zones, it helps traders make informed decisions about entering and exiting trades. However, it’s important to combine CPR with sound risk management and additional confirmation through other technical indicators for the best results.
Although no trading tool guarantees success, the CPR, when used effectively and combined with practice, can significantly enhance a trader’s ability to navigate market fluctuations.

Unlock the Power of Seasonality: Monthly Performance StrategyThe Monthly Performance Strategy leverages the power of seasonality—those cyclical patterns that emerge in financial markets at specific times of the year. From tax deadlines to industry-specific events and global holidays, historical data shows that certain months can offer strong opportunities for trading. This strategy was designed to help traders capture those opportunities and take advantage of recurring market patterns through an automated and highly customizable approach.
The Inspiration Behind the Strategy:
This strategy began with the idea that market performance is often influenced by seasonal factors. Historically, certain months outperform others due to a variety of reasons, like earnings reports, holiday shopping, or fiscal year-end events. By identifying these periods, traders can better time their market entries and exits, giving them an advantage over those who solely rely on technical indicators or news events.
The Monthly Performance Strategy was built to take this concept and automate it. Instead of manually analyzing market data for each month, this strategy enables you to select which months you want to focus on and then executes trades based on predefined rules, saving you time and optimizing the performance of your trades.
Key Features:
Customizable Month Selection: The strategy allows traders to choose specific months to test or trade on. You can select any combination of months—for example, January, July, and December—to focus on based on historical trends. Whether you’re targeting the historically strong months like December (often driven by the 'Santa Rally') or analyzing quieter months for low volatility trades, this strategy gives you full control.
Automated Monthly Entries and Exits: The strategy automatically enters a long position on the first day of your selected month(s) and exits the trade at the beginning of the next month. This makes it perfect for traders who want to benefit from seasonal patterns without manually monitoring the market. It ensures precision in entering and exiting trades based on pre-set timeframes.
Re-entry on Stop Loss or Take Profit: One of the standout features of this strategy is its ability to re-enter a trade if a position hits the stop loss (SL) or take profit (TP) level during the selected month. If your trade reaches either a SL or TP before the month ends, the strategy will automatically re-enter a new trade the next trading day. This feature ensures that you capture multiple trading opportunities within the same month, instead of exiting entirely after a successful or unsuccessful trade. Essentially, it keeps your capital working for you throughout the entire month, not just when conditions align perfectly at the beginning.
Built-in Risk Management: Risk management is a vital part of this strategy. It incorporates an Average True Range (ATR)-based stop loss and take profit system. The ATR helps set dynamic levels based on the market’s volatility, ensuring that your stops and targets adjust to changing market conditions. This not only helps limit potential losses but also maximizes profit potential by adapting to market behavior.
Historical Performance Testing: You can backtest this strategy on any period by setting the start year. This allows traders to analyze past market data and optimize their strategy based on historical performance. You can fine-tune which months to trade based on years of data, helping you identify trends and patterns that provide the best trading results.
Versatility Across Asset Classes: While this strategy can be particularly effective for stock market indices and sector rotation, it’s versatile enough to apply to other asset classes like forex, commodities, and even cryptocurrencies. Each asset class may exhibit different seasonal behaviors, allowing you to explore opportunities across various markets with this strategy.
How It Works:
The trader selects which months to test or trade, for example, January, April, and October.
The strategy will automatically open a long position on the first trading day of each selected month.
If the trade hits either the take profit or stop loss within the month, the strategy will close the current position and re-enter a new trade on the next trading day, provided the month has not yet ended. This ensures that the strategy continues to capture any potential gains throughout the month, rather than stopping after one successful trade.
At the start of the next month, the position is closed, and if the next month is also selected, a new trade is initiated following the same process.
Risk Management and Dynamic Adjustments:
Incorporating risk management with this strategy is as easy as turning on the ATR-based system. The strategy will automatically calculate stop loss and take profit levels based on the market’s current volatility, adjusting dynamically to the conditions. This ensures that the risk is controlled while allowing for flexibility in capturing profits during both high and low volatility periods.
Maximizing the Seasonal Edge:
By automating entries and exits based on specific months and combining that with dynamic risk management, the Ultimate Monthly Performance Strategy takes advantage of seasonal patterns without requiring constant monitoring. The added re-entry feature after hitting a stop loss or take profit ensures that you are always in the game, maximizing your chances to capture profitable trades during favorable seasonal periods.
Who Can Benefit from This Strategy?
This strategy is perfect for traders who:
Want to exploit the predictable, recurring patterns that occur during specific months of the year.
Prefer a hands-off, automated trading approach that allows them to focus on other aspects of their portfolio or life.
Seek to manage risk effectively with ATR-based stop losses and take profits that adjust to market conditions.
Appreciate the ability to re-enter trades when a take profit or stop loss is hit within the month, ensuring that they don't miss out on multiple opportunities during a favorable period.
In summary, the Ultimate Monthly Performance Strategy provides traders with a comprehensive tool to capitalize on seasonal trends, optimize their trading opportunities throughout the year, and manage risk effectively. The built-in re-entry system ensures you continue to benefit from the market even after hitting targets within the same month, making it a robust strategy for traders looking to maximize their edge in any market.
Risk Disclaimer:
Trading financial markets involves significant risk and may not be suitable for all investors. The Monthly Performance Strategy is designed to help traders identify seasonal trends, but past performance does not guarantee future results. It is important to carefully consider your risk tolerance, financial situation, and trading goals before using any strategy. Always use appropriate risk management and consult with a professional financial advisor if necessary. The use of this strategy does not eliminate the risk of losses, and traders should be prepared for the possibility of losing their entire investment. Be sure to test the strategy on a demo account before applying it in live markets.

Mean Reversion Cloud (Ornstein-Uhlenbeck) // AlgoFyreThe Mean Reversion Cloud (Ornstein-Uhlenbeck) indicator detects mean-reversion opportunities by applying the Ornstein-Uhlenbeck process. It calculates a dynamic mean using an Exponential Weighted Moving Average, surrounded by volatility bands, signaling potential buy/sell points when prices deviate.
TABLE OF CONTENTS
🔶 ORIGINALITY
🔸Adaptive Mean Calculation
🔸Volatility-Based Cloud
🔸Speed of Reversion (θ)
🔶 FUNCTIONALITY
🔸Dynamic Mean and Volatility Bands
🞘 How it works
🞘 How to calculate
🞘 Code extract
🔸Visualization via Table and Plotshapes
🞘 Table Overview
🞘 Plotshapes Explanation
🞘 Code extract
🔶 INSTRUCTIONS
🔸Step-by-Step Guidelines
🞘 Setting Up the Indicator
🞘 Understanding What to Look For on the Chart
🞘 Possible Entry Signals
🞘 Possible Take Profit Strategies
🞘 Possible Stop-Loss Levels
🞘 Additional Tips
🔸Customize settings
🔶 CONCLUSION
▅▅▅▅▅▅▅▅▅▅▅▅▅▅▅▅▅▅▅▅▅▅▅▅▅▅▅▅▅▅▅▅▅▅▅▅▅▅▅▅▅▅▅▅▅▅
🔶 ORIGINALITY The Mean Reversion Cloud (Ornstein-Uhlenbeck) is a unique indicator that applies the Ornstein-Uhlenbeck stochastic process to identify mean-reverting behavior in asset prices. Unlike traditional moving average-based indicators, this model uses an Exponentially Weighted Moving Average (EWMA) to calculate the long-term mean, dynamically adjusting to recent price movements while still considering all historical data. It also incorporates volatility bands, providing a "cloud" that visually highlights overbought or oversold conditions. By calculating the speed of mean reversion (θ) through the autocorrelation of log returns, this indicator offers traders a more nuanced and mathematically robust tool for identifying mean-reversion opportunities. These innovations make it especially useful for markets that exhibit range-bound characteristics, offering timely buy and sell signals based on statistical deviations from the mean.
🔸Adaptive Mean Calculation Traditional MA indicators use fixed lengths, which can lead to lagging signals or over-sensitivity in volatile markets. The Mean Reversion Cloud uses an Exponentially Weighted Moving Average (EWMA), which adapts to price movements by dynamically adjusting its calculation, offering a more responsive mean.
🔸Volatility-Based Cloud Unlike simple moving averages that only plot a single line, the Mean Reversion Cloud surrounds the dynamic mean with volatility bands. These bands, based on standard deviations, provide traders with a visual cue of when prices are statistically likely to revert, highlighting potential reversal zones.
🔸Speed of Reversion (θ) The indicator goes beyond price averages by calculating the speed at which the price reverts to the mean (θ), using the autocorrelation of log returns. This gives traders an additional tool for estimating the likelihood and timing of mean reversion, making the signals more reliable in practice.
🔶 FUNCTIONALITY The Mean Reversion Cloud (Ornstein-Uhlenbeck) indicator is designed to detect potential mean-reversion opportunities in asset prices by applying the Ornstein-Uhlenbeck stochastic process. It calculates a dynamic mean through the Exponentially Weighted Moving Average (EWMA) and plots volatility bands based on the standard deviation of the asset's price over a specified period. These bands create a "cloud" that represents expected price fluctuations, helping traders to identify overbought or oversold conditions. By calculating the speed of reversion (θ) from the autocorrelation of log returns, the indicator offers a more refined way of assessing how quickly prices may revert to the mean. Additionally, the inclusion of volatility provides a comprehensive view of market conditions, allowing for more accurate buy and sell signals.
Let's dive into the details:
🔸Dynamic Mean and Volatility Bands The dynamic mean (μ) is calculated using the EWMA, giving more weight to recent prices but considering all historical data. This process closely resembles the Ornstein-Uhlenbeck (OU) process, which models the tendency of a stochastic variable (such as price) to revert to its mean over time. Volatility bands are plotted around the mean using standard deviation, forming the "cloud" that signals overbought or oversold conditions. The cloud adapts dynamically to price fluctuations and market volatility, making it a versatile tool for mean-reversion strategies. 🞘 How it works Step one: Calculate the dynamic mean (μ) The Ornstein-Uhlenbeck process describes how a variable, such as an asset's price, tends to revert to a long-term mean while subject to random fluctuations. In this indicator, the EWMA is used to compute the dynamic mean (μ), mimicking the mean-reverting behavior of the OU process. Use the EWMA formula to compute a weighted mean that adjusts to recent price movements. Assign exponentially decreasing weights to older data while giving more emphasis to current prices. Step two: Plot volatility bands Calculate the standard deviation of the price over a user-defined period to determine market volatility. Position the upper and lower bands around the mean by adding and subtracting a multiple of the standard deviation. 🞘 How to calculate Exponential Weighted Moving Average (EWMA)
The EWMA dynamically adjusts to recent price movements:
mu_t = lambda * mu_{t-1} + (1 - lambda) * P_t
Where mu_t is the mean at time t, lambda is the decay factor, and P_t is the price at time t. The higher the decay factor, the more weight is given to recent data.
Autocorrelation (ρ) and Standard Deviation (σ)
To measure mean reversion speed and volatility: rho = correlation(log(close), log(close ), length) Where rho is the autocorrelation of log returns over a specified period.
To calculate volatility:
sigma = stdev(close, length)
Where sigma is the standard deviation of the asset's closing price over a specified length.
Upper and Lower Bands
The upper and lower bands are calculated as follows:
upper_band = mu + (threshold * sigma)
lower_band = mu - (threshold * sigma)
Where threshold is a multiplier for the standard deviation, usually set to 2. These bands represent the range within which the price is expected to fluctuate, based on current volatility and the mean.
🞘 Code extract // Calculate Returns
returns = math.log(close / close )
// Calculate Long-Term Mean (μ) using EWMA over the entire dataset
var float ewma_mu = na // Initialize ewma_mu as 'na'
ewma_mu := na(ewma_mu ) ? close : decay_factor * ewma_mu + (1 - decay_factor) * close
mu = ewma_mu
// Calculate Autocorrelation at Lag 1
rho1 = ta.correlation(returns, returns , corr_length)
// Ensure rho1 is within valid range to avoid errors
rho1 := na(rho1) or rho1 <= 0 ? 0.0001 : rho1
// Calculate Speed of Mean Reversion (θ)
theta = -math.log(rho1)
// Calculate Volatility (σ)
sigma = ta.stdev(close, corr_length)
// Calculate Upper and Lower Bands
upper_band = mu + threshold * sigma
lower_band = mu - threshold * sigma
🔸Visualization via Table and Plotshapes
The table shows key statistics such as the current value of the dynamic mean (μ), the number of times the price has crossed the upper or lower bands, and the consecutive number of bars that the price has remained in an overbought or oversold state.
Plotshapes (diamonds) are used to signal buy and sell opportunities. A green diamond below the price suggests a buy signal when the price crosses below the lower band, and a red diamond above the price indicates a sell signal when the price crosses above the upper band.
The table and plotshapes provide a comprehensive visualization, combining both statistical and actionable information to aid decision-making.
🞘 Code extract // Reset consecutive_bars when price crosses the mean
var consecutive_bars = 0
if (close < mu and close >= mu) or (close > mu and close <= mu)
consecutive_bars := 0
else if math.abs(deviation) > 0
consecutive_bars := math.min(consecutive_bars + 1, dev_length)
transparency = math.max(0, math.min(100, 100 - (consecutive_bars * 100 / dev_length)))
🔶 INSTRUCTIONS
The Mean Reversion Cloud (Ornstein-Uhlenbeck) indicator can be set up by adding it to your TradingView chart and configuring parameters such as the decay factor, autocorrelation length, and volatility threshold to suit current market conditions. Look for price crossovers and deviations from the calculated mean for potential entry signals. Use the upper and lower bands as dynamic support/resistance levels for setting take profit and stop-loss orders. Combining this indicator with additional trend-following or momentum-based indicators can improve signal accuracy. Adjust settings for better mean-reversion detection and risk management.
🔸Step-by-Step Guidelines
🞘 Setting Up the Indicator
Adding the Indicator to the Chart:
Go to your TradingView chart.
Click on the "Indicators" button at the top.
Search for "Mean Reversion Cloud (Ornstein-Uhlenbeck)" in the indicators list.
Click on the indicator to add it to your chart.
Configuring the Indicator:
Open the indicator settings by clicking on the gear icon next to its name on the chart.
Decay Factor: Adjust the decay factor (λ) to control the responsiveness of the mean calculation. A higher value prioritizes recent data.
Autocorrelation Length: Set the autocorrelation length (θ) for calculating the speed of mean reversion. Longer lengths consider more historical data.
Threshold: Define the number of standard deviations for the upper and lower bands to determine how far price must deviate to trigger a signal.
Chart Setup:
Select the appropriate timeframe (e.g., 1-hour, daily) based on your trading strategy.
Consider using other indicators such as RSI or MACD to confirm buy and sell signals.
🞘 Understanding What to Look For on the Chart
Indicator Behavior:
Observe how the price interacts with the dynamic mean and volatility bands. The price staying within the bands suggests mean-reverting behavior, while crossing the bands signals potential entry points.
The indicator calculates overbought/oversold conditions based on deviation from the mean, highlighted by color-coded cloud areas on the chart.
Crossovers and Deviation:
Look for crossovers between the price and the mean (μ) or the bands. A bullish crossover occurs when the price crosses below the lower band, signaling a potential buying opportunity.
A bearish crossover occurs when the price crosses above the upper band, suggesting a potential sell signal.
Deviations from the mean indicate market extremes. A large deviation indicates that the price is far from the mean, suggesting a potential reversal.
Slope and Direction:
Pay attention to the slope of the mean (μ). A rising slope suggests bullish market conditions, while a declining slope signals a bearish market.
The steepness of the slope can indicate the strength of the mean-reversion trend.
🞘 Possible Entry Signals
Bullish Entry:
Crossover Entry: Enter a long position when the price crosses below the lower band with a positive deviation from the mean.
Confirmation Entry: Use additional indicators like RSI (above 50) or increasing volume to confirm the bullish signal.
Bearish Entry:
Crossover Entry: Enter a short position when the price crosses above the upper band with a negative deviation from the mean.
Confirmation Entry: Look for RSI (below 50) or decreasing volume to confirm the bearish signal.
Deviation Confirmation:
Enter trades when the deviation from the mean is significant, indicating that the price has strayed far from its expected value and is likely to revert.
🞘 Possible Take Profit Strategies
Static Take Profit Levels:
Set predefined take profit levels based on historical volatility, using the upper and lower bands as guides.
Place take profit orders near recent support/resistance levels, ensuring you're capitalizing on the mean-reversion behavior.
Trailing Stop Loss:
Use a trailing stop based on a percentage of the price deviation from the mean to lock in profits as the trend progresses.
Adjust the trailing stop dynamically along the calculated bands to protect profits as the price returns to the mean.
Deviation-Based Exits:
Exit when the deviation from the mean starts to decrease, signaling that the price is returning to its equilibrium.
🞘 Possible Stop-Loss Levels
Initial Stop Loss:
Place an initial stop loss outside the lower band (for long positions) or above the upper band (for short positions) to protect against excessive deviations.
Use a volatility-based buffer to avoid getting stopped out during normal price fluctuations.
Dynamic Stop Loss:
Move the stop loss closer to the mean as the price converges back towards equilibrium, reducing risk.
Adjust the stop loss dynamically along the bands to account for sudden market movements.
🞘 Additional Tips
Combine with Other Indicators:
Enhance your strategy by combining the Mean Reversion Cloud with momentum indicators like MACD, RSI, or Bollinger Bands to confirm market conditions.
Backtesting and Practice:
Backtest the indicator on historical data to understand how it performs in various market environments.
Practice using the indicator on a demo account before implementing it in live trading.
Market Awareness:
Keep an eye on market news and events that might cause extreme price movements. The indicator reacts to price data and might not account for news-driven events that can cause large deviations.
🔸Customize settings 🞘 Decay Factor (λ): Defines the weight assigned to recent price data in the calculation of the mean. A value closer to 1 places more emphasis on recent prices, while lower values create a smoother, more lagging mean.
🞘 Autocorrelation Length (θ): Sets the period for calculating the speed of mean reversion and volatility. Longer lengths capture more historical data, providing smoother calculations, while shorter lengths make the indicator more responsive.
🞘 Threshold (σ): Specifies the number of standard deviations used to create the upper and lower bands. Higher thresholds widen the bands, producing fewer signals, while lower thresholds tighten the bands for more frequent signals.
🞘 Max Gradient Length (γ): Determines the maximum number of consecutive bars for calculating the deviation gradient. This setting impacts the transparency of the plotted bands based on the length of deviation from the mean.
🔶 CONCLUSION
The Mean Reversion Cloud (Ornstein-Uhlenbeck) indicator offers a sophisticated approach to identifying mean-reversion opportunities by applying the Ornstein-Uhlenbeck stochastic process. This dynamic indicator calculates a responsive mean using an Exponentially Weighted Moving Average (EWMA) and plots volatility-based bands to highlight overbought and oversold conditions. By incorporating advanced statistical measures like autocorrelation and standard deviation, traders can better assess market extremes and potential reversals. The indicator’s ability to adapt to price behavior makes it a versatile tool for traders focused on both short-term price deviations and longer-term mean-reversion strategies. With its unique blend of statistical rigor and visual clarity, the Mean Reversion Cloud provides an invaluable tool for understanding and capitalizing on market inefficiencies.

OrderFlow [Adjustable] | FractalystWhat's the indicator's purpose and functionality?
This indicator is designed to assist traders in identifying real-time probabilities of buyside and sellside liquidity .
It allows for an adjustable pivot level , enabling traders to customize the level they want to use for their entries.
By doing so, traders can evaluate whether their chosen entry point would yield a positive expected value over a large sample size, optimizing their strategy for long-term profitability.
For advanced traders looking to enhance their analysis, the indicator supports the incorporation of up to 7 higher timeframe biases .
Additionally, the higher timeframe pivot level can be adjusted according to the trader's preferences,
Offering maximum adaptability to different strategies and needs, further helping to maximize positive EV.
EV=(P(Win)×R(Win))−(P(Loss)×R(Loss))
-----
What's the purpose of these levels? What are the underlying calculations?
1. Understanding Swing highs and Swing Lows
Swing High: A Swing High is formed when there is a high with 2 lower highs to the left and right.
Swing Low: A Swing Low is formed when there is a low with 2 higher lows to the left and right.
2. Understanding the purpose and the underlying calculations behind Buyside, Sellside and Pivot levels.
3. Identifying Discount and Premium Zones.
4. Importance of Risk-Reward in Premium and Discount Ranges
----
How does the script calculate probabilities?
The script calculates the probability of each liquidity level individually. Here's the breakdown:
1. Upon the formation of a new range, the script waits for the price to reach and tap into pivot level level. Status: "⏸" - Inactive
2. Once pivot level is tapped into, the pivot status becomes activated and it waits for either liquidity side to be hit. Status: "▶" - Active
3. If the buyside liquidity is hit, the script adds to the count of successful buyside liquidity occurrences. Similarly, if the sellside is tapped, it records successful sellside liquidity occurrences.
4. Finally, the number of successful occurrences for each side is divided by the overall count individually to calculate the range probabilities.
Note: The calculations are performed independently for each directional range. A range is considered bearish if the previous breakout was through a sellside liquidity. Conversely, a range is considered bullish if the most recent breakout was through a buyside liquidity.
----
What does the multi-timeframe functionality offer?
In the adjustable version of the orderflow indicator, you can incorporate up to 7 higher timeframe probabilities directly into the table.
This feature allows you to analyze the probabilities of buyside and sellside liquidity across multiple timeframes, without the need to manually switch between them.
By viewing these higher timeframe probabilities in one place, traders can spot larger market trends and refine their entries and exits with a better understanding of the overall market context.
This multi-timeframe functionality helps traders:
1. Simplify decision-making by offering a comprehensive view of multiple timeframes at once.
2. Identify confluence between timeframes, enhancing the confidence in trade setups.
3. Adapt strategies more effectively, as the higher timeframe pivot levels can be customized to meet individual preferences and goals.
----
What are the multi-timeframe underlying calculations?
The script uses the same calculations (mentioned above) and uses security function to request the data such as price levels, bar time, probabilities and booleans from the user-input timeframe.
----
How does the Indicator Identifies Positive Expected Values?
OrderFlow indicator instantly calculates whether a trade setup has the potential for positive expected value (EV) in the long run.
To determine a positive EV setup, the indicator uses the formula:
EV=(P(Win)×R(Win))−(P(Loss)×R(Loss))
where:
P(Win) is the probability of a winning trade.
R(Win) is the reward or return for a winning trade, determined by the current risk-to-reward ratio (RR).
P(Loss) is the probability of a losing trade.
R(Loss) is the loss incurred per losing trade, typically assumed to be -1.
By calculating these values based on historical data and the current trading setup, the indicator helps you understand whether your trade has a positive expected value over a large sample size.
----
How can I know that the setup I'm going to trade with has a postive EV?
If the indicator detects that the adjusted pivot and buy/sell side probabilities have generated positive expected value (EV) in historical data, the risk-to-reward (RR) label within the range box will be colored blue and red .
If the setup does not produce positive EV, the RR label will appear gray.
This indicates that even the risk-to-reward ratio is greater than 1:1, the setup is not likely to yield a positive EV because, according to historical data, the number of losses outweighs the number of wins relative to the RR gain per winning trade.
----
What is the confidence level in the indicator, and how is it determined?
The confidence level in the indicator reflects the reliability of the probabilities calculated based on historical data. It is determined by the sample size of the probabilities used in the calculations. A larger sample size generally increases the confidence level, indicating that the probabilities are more reliable and consistent with past performance.
----
How does the confidence level affect the risk-to-reward (RR) label?
The confidence level (★) is visually represented alongside the probability label. A higher confidence level indicates that the probabilities used to determine the RR label are based on a larger and more reliable sample size.
----
How can traders use the confidence level to make better trading decisions?
Traders can use the confidence level to gauge the reliability of the probabilities and expected value (EV) calculations provided by the indicator. A confidence level above 95% is considered statistically significant and indicates that the historical data supporting the probabilities is robust. This high confidence level suggests that the probabilities are reliable and that the indicator’s recommendations are more likely to be accurate.
In data science and statistics, a confidence level above 95% generally means that there is less than a 5% chance that the observed results are due to random variation. This threshold is widely accepted in research and industry as a marker of statistical significance. Studies such as those published in the Journal of Statistical Software and the American Statistical Association support this threshold, emphasizing that a confidence level above 95% provides a strong assurance of data reliability and validity.
Conversely, a confidence level below 95% indicates that the sample size may be insufficient and that the data might be less reliable . In such cases, traders should approach the indicator’s recommendations with caution and consider additional factors or further analysis before making trading decisions.
----
How does the sample size affect the confidence level, and how does it relate to my TradingView plan?
The sample size for calculating the confidence level is directly influenced by the amount of historical data available on your charts. A larger sample size typically leads to more reliable probabilities and higher confidence levels.
Here’s how the TradingView plans affect your data access:
Essential Plan
The Essential Plan provides basic data access with a limited amount of historical data. This can lead to smaller sample sizes and lower confidence levels, which may weaken the robustness of your probability calculations. Suitable for casual traders who do not require extensive historical analysis.
Plus Plan
The Plus Plan offers more historical data than the Essential Plan, allowing for larger sample sizes and more accurate confidence levels. This enhancement improves the reliability of indicator calculations. This plan is ideal for more active traders looking to refine their strategies with better data.
Premium Plan
The Premium Plan grants access to extensive historical data, enabling the largest sample sizes and the highest confidence levels. This plan provides the most reliable data for accurate calculations, with up to 20,000 historical bars available for analysis. It is designed for serious traders who need comprehensive data for in-depth market analysis.
PRO+ Plans
The PRO+ Plans offer the most extensive historical data, allowing for the largest sample sizes and the highest confidence levels. These plans are tailored for professional traders who require advanced features and significant historical data to support their trading strategies effectively.
For many traders, the Premium Plan offers a good balance of affordability and sufficient sample size for accurate confidence levels.
----
What is the HTF probability table and how does it work?
The HTF (Higher Time Frame) probability table is a feature that allows you to view buy and sellside probabilities and their status from timeframes higher than your current chart timeframe.
Here’s how it works:
Data Request : The table requests and retrieves data from user-defined higher timeframes (HTFs) that you select.
Probability Display: It displays the buy and sellside probabilities for each of these HTFs, providing insights into the likelihood of price movements based on higher timeframe data.
Detailed Tooltips: The table includes detailed tooltips for each timeframe, offering additional context and explanations to help you understand the data better.
----
What do the different colors in the HTF probability table indicate?
The colors in the HTF probability table provide visual cues about the expected value (EV) of trading setups based on higher timeframe probabilities:
Blue: Suggests that entering a long position from the HTF user-defined pivot point, targeting buyside liquidity, is likely to result in a positive expected value (EV) based on historical data and sample size.
Red: Indicates that entering a short position from the HTF user-defined pivot point, targeting sellside liquidity, is likely to result in a positive expected value (EV) based on historical data and sample size.
Gray: Shows that neither long nor short trades from the HTF user-defined pivot point are expected to generate positive EV, suggesting that trading these setups may not be favorable.
----
How to use the indicator effectively?
For Amateur Traders:
Start Simple: Begin by focusing on one timeframe at a time with the pivot level set to the default (50%). This helps you understand the basic functionality of the indicator.
Entry and Exit Strategy: Focus on entering trades at the pivot level while targeting the higher probability side for take profit and the lower probability side for stop loss.
Use simulation or paper trading to practice this strategy.
Adjustments: Once you have a solid understanding of how the indicator works, you can start adjusting the pivot level to other values that suit your strategy.
Ensure that the RR labels are colored (blue or red) to indicate positive EV setups before executing trades.
For Advanced Traders:
1. Select Higher Timeframe Bias: Choose a higher timeframe (HTF) as your main bias. Start with the default pivot level and ensure the confidence level is above 95% to validate the probabilities.
2. Align Lower Timeframes: Switch between lower timeframes to identify which ones align with your predefined HTF bias. This helps in synchronizing your trading decisions across different timeframes.
3. Set Entries with Current Pivot Level: Use the current pivot level for trade entries. Ensure the HTF status label is active, indicating that the probabilities are valid and in play.
4. Target HTF Liquidity Level: Aim for liquidity levels that correspond to the higher timeframe, as these levels are likely to offer better trading opportunities.
5. Adjust Pivot Levels: As you gain experience, adjust the pivot levels to further optimize your strategy for high EV. Fine-tune these levels based on the aggregated data from multiple timeframes.
6. Practice on Paper Trading: Test your strategies through paper trading to eliminate discretion and refine your approach without financial risk.
7. Focus on Trade Management: Ultimately, effective trade management is crucial. Concentrate on managing your trades well to ensure long-term success. By aiming for setups that produce positive EV, you can position yourself similarly to how a casino operates.
----
🎲 Becoming the House (Gaining Edge Over the Market):
In American roulette, the house has a 5.26% edge due to the 0 and 00. This means that while players have a 47.37% chance of winning on even-money bets, the true odds are 50%. The discrepancy between the true odds and the payout ensures that, statistically, the casino will win over time.
From the Trader's Perspective: In trading, you gain an edge by focusing on setups with positive expected value (EV). If you have a 55.48% chance of winning with a 1:1 risk-to-reward ratio, your setup has a higher probability of profitability than the losing side. By consistently targeting such setups and managing your trades effectively, you create a statistical advantage, similar to the casino’s edge.
----
🎰 Applying the Concept to Trading:
Just as casinos rely on their mathematical edge, you can achieve long-term success in trading by focusing on setups with positive EV. By ensuring that your probabilities and risk-to-reward (RR) ratios are in your favor, you create an edge similar to that of the house.
And by systematically targeting trades with favorable probabilities and managing your trades effectively, you improve your chances of profitability over the long run. Which is going to help you “become the house” in your trading, leveraging statistical advantages to enhance your overall performance.
----
What makes this indicator original?
Real-Time Probability Calculations: The indicator provides real-time calculations of buy and sell probabilities based on historical data, allowing traders to assess the likelihood of positive expected value (EV) setups instantly.
Adjustable Pivot Levels: It features an adjustable pivot level that traders can modify according to their preferences, enhancing the flexibility to align with different trading strategies.
Multi-Timeframe Integration: The indicator supports up to 7 higher timeframes, displaying their probabilities and biases in a single view, which helps traders make informed decisions without switching timeframes.
Confidence Levels: It includes confidence levels based on sample sizes, offering insights into the reliability of the probabilities. Traders can gauge the strength of the data before making trades.
Dynamic EV Labels: The indicator provides color-coded EV labels that change based on the validity of the setup. Blue indicates positive EV in a long bias, red indicates positive EV in a short bias and gray signals caution, making it easier for traders to identify high-quality setups.
HTF Probability Table: The HTF probability table displays buy and sell probabilities from user-defined higher timeframes, helping traders integrate broader market context into their decision-making process.
----
Terms and Conditions | Disclaimer
Our charting tools are provided for informational and educational purposes only and should not be construed as financial, investment, or trading advice. They are not intended to forecast market movements or offer specific recommendations. Users should understand that past performance does not guarantee future results and should not base financial decisions solely on historical data.
Built-in components, features, and functionalities of our charting tools are the intellectual property of @Fractalyst use, reproduction, or distribution of these proprietary elements is prohibited.
By continuing to use our charting tools, the user acknowledges and accepts the Terms and Conditions outlined in this legal disclaimer and agrees to respect our intellectual property rights and comply with all applicable laws and regulations.

Market Structure Break Targets [UAlgo]The "Market Structure Break Targets " indicator is designed to identify and visualize key market structure points such as Market Structure Breaks (MSBs) and Break of Structures (BoS). These points are crucial for understanding market trends and potential reversal zones. By plotting these structures on the chart, traders can easily spot significant support and resistance levels, as well as potential entry and exit points.
This indicator uses a combination of swing highs and lows to determine market structures and calculates targets based on user-defined percentages or Average True Range (ATR) multipliers. It provides visual cues in the form of lines, labels, and boxes to help traders quickly interpret market conditions.
🔶 Key Features
Customizable Swing Length: Users can set the swing length to identify the pivot highs and lows, which are crucial for determining market structure.
Target Duration Bars: Defines the maximum duration (in bars) for which the targets will be considered valid.
Target Calculation Methods: The target levels are crucial for setting potential price objectives. The calculation can be based on a percentage move from the identified pivot or using the ATR to factor in market volatility. These targets help in setting realistic profit-taking levels or identifying stop-loss placements.
Bullish and Bearish Market Structure Break (MSB): Detects and highlights bullish and bearish market structure breaks with customizable colors and target percentages.
Bullish MSB
When the price closes above a significant pivot high, a bullish MSB is identified. The indicator will draw a line at this level and calculate a target based on the chosen method (percentage or ATR). The target is visualized with a dotted line, and a label "MSB" is displayed. Additionally, an order block is created at the level of the bullish MSB. This order block is highlighted with a semi-transparent box, representing a potential area where price might find support in the future.
Bearish MSB
Conversely, when the price closes below a significant pivot low, a bearish MSB is marked. Similar to bullish MSBs, targets are calculated and displayed on the chart. An order block is also generated at the level of the bearish MSB, visualized with a semi-transparent box. This box highlights a potential resistance area where price might face selling pressure.
Bullish and Bearish Break of Structure (BoS): Identifies break of structures for both bullish and bearish scenarios, providing additional target levels.
Bullish BoS
If the price continues to rise and breaks another significant level, a bullish BoS is detected. This break is also marked with lines and labels, providing additional target levels for traders. An order block is created at the BoS level, serving as a potential support zone.
Bearish BoS
If the price falls further after a bearish MSB, a bearish BoS is identified and visualized similarly. The indicator creates an order block at the BoS level, which acts as a potential resistance zone.
🔶 Disclaimer:
Use with Caution: This indicator is provided for educational and informational purposes only and should not be considered as financial advice. Users should exercise caution and perform their own analysis before making trading decisions based on the indicator's signals.
Not Financial Advice: The information provided by this indicator does not constitute financial advice, and the creator (UAlgo) shall not be held responsible for any trading losses incurred as a result of using this indicator.
Backtesting Recommended: Traders are encouraged to backtest the indicator thoroughly on historical data before using it in live trading to assess its performance and suitability for their trading strategies.
Risk Management: Trading involves inherent risks, and users should implement proper risk management strategies, including but not limited to stop-loss orders and position sizing, to mitigate potential losses.
No Guarantees: The accuracy and reliability of the indicator's signals cannot be guaranteed, as they are based on historical price data and past performance may not be indicative of future results.

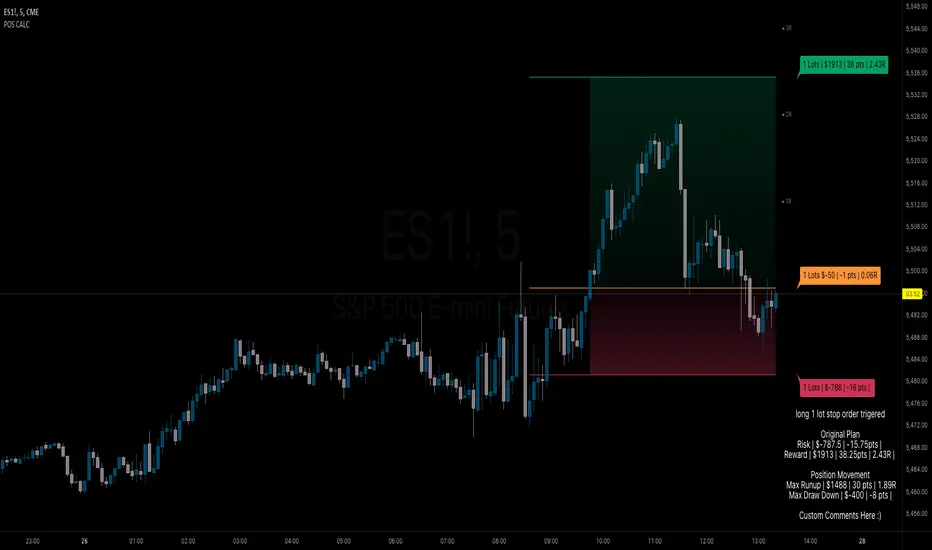
BB Position CalculatorPosition Size Calculator Instructions
Overview
The Position Size Calculator is designed to help traders automatically determine the appropriate lot size based on the dollar amount they are willing to risk. It includes features for automatic lot sizing, fixed lot risk calculations, take profit calculations (both automatic and fixed), max run-up, and max drawdown. Calculated values are displayed in ticks, points, and USD.
Key Features
• Automatic Lot Sizing: Automatically calculates lot size based on the amount of money you are willing to risk.
• Fixed Lot Risk Calculations: Provides risk calculations for fixed lot sizes.
• Take Profit Calculations: Offers both automatic and fixed take profit calculations.
• Max Run-Up and Max Drawdown: Monitors and displays the maximum run-up and drawdown of your trade.
• Detailed Metrics: Displays all calculated values in ticks, points, and USD.
Setup Instructions
1. Add and Remove for Each Position: The calculator is designed to be added to your chart for each new position. Once your preferences are set the first time, save them as your default to retain your settings for future use.
2. Adding the Indicator to Favorites:
• Use the TradingView keyboard shortcut “/” then type “pos.”
• Use the arrow key to select the Position Size Calculator and press enter.
• Close the indicator selection pop-up.
3. Setting the Trigger Price:
• A blue pop-up labeled “SET TRIGGER PRICE” will appear at the bottom of the chart.
• Click on the chart at the price level where you want to enter the trade.
4. Setting the Stop Loss:
• The pop-up will change to “SET STOP LOSS.”
• Click on the chart at the price level where your stop loss will be set.
5. Setting the Take Profit:
• The pop-up will change to “SET TAKE PROFIT.”
• Click on the chart at the price level where you want to take profit. If you have selected the option to overwrite with a set risk/reward ratio (R:R), the calculation will use this price level.
6. Setting the Trade Window Start:
• The pop-up will change to “SET TRADE WINDOW START.”
• Click on the bar in time where you want the indicator to start monitoring for price to trigger the position.
7. Adjusting the Position:
• Clicking on any part of the indicator will display draggable lines, allowing you to fine-tune the position that was previously plotted by the first four chart clicks.
Additional Notes
• Compatibility: This calculator has only been tested with futures trading.
• Customization: Once your preferences are set, save them as your default to make setup quicker for future trades.
• Support: If you have any questions or feature requests, please feel free to reach out.
Signals & Overlays [UAlgo]The Signals & Overlays indicator is a comprehensive trading tool designed to provide traders with a holistic view of market conditions. It combines multiple analysis techniques to offer insights into trend direction, potential reversal points, and optimal entry and exit levels. This versatile indicator is suitable for various trading styles and timeframes, also has Beginner-Friendly presets to enable multiple features at once within one-click.
🔶 Key Features:
🔹 Contrarian Signals:
This feature identifies potential trend reversals and market turning points. These contrarian signals are displayed as arrow markers on the chart, alerting traders to possible opportunities that go against the prevailing trend. The signals are based on a combination of price action, momentum, and volatility factors, providing a multi-faceted approach to market analysis.
Customizable Settings :
Signal Sensitivity: Adjustable from 0.1 to 10.0. This controls how sensitive the indicator is to potential reversal signals.
🔹 Reversal Zones:
This feature utilizes statistical methods that compute a smoothed average and associated bands around a data series using Gaussian weights. The Gaussian distribution helps to assign more weight to data points near the center of the window, and the bands represent the average plus/minus a scaled measure of deviation.
This technique is often used in financial analysis to detect trends and measure volatility to identify key areas where price reversals are more likely to occur. These zones providing a dynamic representation of potential support and resistance areas. Traders can use these zones to anticipate potential price reactions and plan their entries and exits accordingly.
Users can also customize the responsiveness of the Reversal Zones through the "Zone Speed" setting. This allows for fine-tuning the model's sensitivity to price changes:
Swift Mode: Quickly adapts to recent price movements, ideal for short-term trading.
Standard Mode: Balances recent and historical data for a medium-term perspective.
Slow Mode: Emphasizes longer-term trends, suitable for position trading.
Customizable Settings :
Zone Data Source: Users can select which price data (open, high, low, close, etc.) to use for zone calculations.
Zone Speed: Choosable between "Swift", "Standard", and "Slow", affecting how quickly the zones adapt to price changes.
🔹 Smart Trail:
The Smart Trail feature provides an adaptive trend-following mechanism. It plots a dynamic line that adjusts based on price action and volatility, helping traders stay in trending moves while providing a trailing stop-loss reference. This feature is particularly useful for managing open positions and optimizing exit points.
🔹 Trend Cloud:
Generates a specialized trend indicator using double-smoothed EMAs applied to closing prices and the high-low price range. It visualizes market trends and volatility by shading the area between different indicator values over time. The color of the shading changes to reflect whether the current trend is strengthening or weakening.
The Trend Cloud feature provides a visually intuitive representation of the overall market trend. It generates a dynamic colored cloud on the chart that helps traders quickly assess the current market direction and strength. Bullish trends represented by blue clouds and bearish trends by red clouds.
🔹 Trend Analyzer:
The Trend Analyzer component provides an in-depth analysis of the current market trend. It uses a customizable moving average system to determine the trend direction and strength. The analyzer can be configured to focus on short-term, medium-term, or long-term trends, allowing traders to align their strategy with their preferred trading timeframe.
Customizable Settings :
Analyzer Calculation Period: Adjustable period for trend analysis calculations.
Analyzer Mode: Selectable between "Short-Term", "Medium-Term", and "Long-Term".
Analyzer Calculation Source: Customizable price data source for trend analysis.
Use Heikin Ashi: Option to use Heikin Ashi candles instead of regular candles for calculations.
🔹 TP/Exit/Entry Levels:
The indicator calculates and displays potential take profit (TP), exit, and entry levels based on market structure and volatility. These levels are marked on the chart, offering traders guidance on optimal points for trade management. This feature can be particularly helpful for setting profit targets and managing risk.
🔹 Dashboard:
The customizable dashboard provides a quick overview of key market metrics. It displays information such as trend strength, volume analysis, market volatility, the current state of the Trend Catcher and the market is "Bearish" or "Bullish". This at-a-glance summary helps traders make informed decisions without the need to switch between multiple indicators.
Customizable Settings :
Toggle: Option to display or hide the dashboard.
Dashboard Position and Size: Selectable between "Top Right", "Bottom Right", and "Bottom Left". Adjustable size to "Tiny", "Small" or "Normal".
🔶 Disclaimer:
Use with Caution: This indicator is provided for educational and informational purposes only and should not be considered as financial advice. Users should exercise caution and perform their own analysis before making trading decisions based on the indicator's signals.
Not Financial Advice: The information provided by this indicator does not constitute financial advice, and the creator (UAlgo) shall not be held responsible for any trading losses incurred as a result of using this indicator.
Backtesting Recommended: Traders are encouraged to backtest the indicator thoroughly on historical data before using it in live trading to assess its performance and suitability for their trading strategies.
Risk Management: Trading involves inherent risks, and users should implement proper risk management strategies, including but not limited to stop-loss orders and position sizing, to mitigate potential losses.
No Guarantees: The accuracy and reliability of the indicator's signals cannot be guaranteed, as they are based on historical price data and past performance may not be indicative of future results.
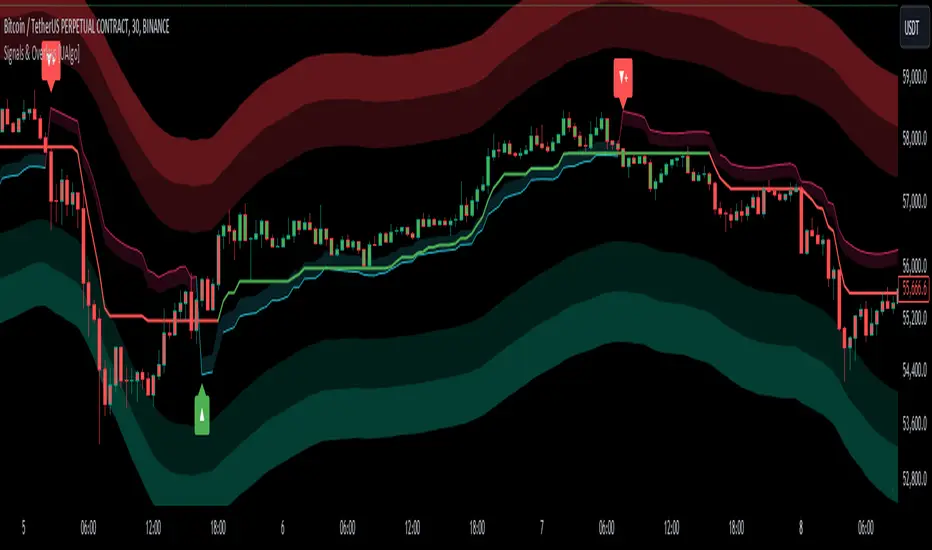
ICT Concept [TradingFinder] Order Block | FVG | Liquidity Sweeps🔵 Introduction
The "ICT" style is one of the subsets of "Price Action" technical analysis. ICT is a method created by "Michael Huddleston", a professional forex trader and experienced mentor. The acronym ICT stands for "Inner Circle Trader".
The main objective of the ICT trading strategy is to combine "Price Action" and the concept of "Smart Money" to identify optimal entry points into trades. However, finding suitable entry points is not the only strength of this approach. With the ICT style, traders can better understand price behavior and adapt their trading approach to market structure accordingly.
Numerous concepts are discussed in this style, but the key practical concepts for trading in financial markets include "Order Block," "Liquidity," and "FVG".
🔵 How to Use
🟣Order Block
Order blocks are a specific type of "Supply and Demand" zones formed when a series of orders are placed in a block. These orders could be created by banks or other major players. Banks typically execute large orders in blocks during their trading sessions. If they were to enter the market directly with a small quantity, significant price movements would occur before the orders are fully executed, resulting in less profit. To avoid this, they divide their orders into smaller, manageable positions. Traders should look for "buy" opportunities in "demand order blocks" areas and "sell" opportunities in "supply order blocks".
🟣Liquidity
These levels are where traders aim to exit their trades. "Market Makers" or smart money usually collects or distributes their trading positions near levels where many retail traders have placed their "Stop Loss" orders. When the liquidity resulting from these losses is collected, the price often reverses direction.
A "Stop Hunt" is a move designed to neutralize liquidity generated by triggered stop losses. Banks often use significant news events to trigger stop hunts and acquire the liquidity released in the market. If, for example, they intend to execute heavy buy orders, they encourage others to sell through stop hunts.
As a result, if there is liquidity in the market before reaching the order block region, the credibility of that order block is higher. Conversely, if liquidity is near the order block, meaning the price reaches the order block before reaching the liquidity area, the credibility of that order block is lower.
🟣FVG (Fair Value Gap)
To identify the "Fair Value Gap" on the chart, one must analyze candle by candle. Focus on candles with large bodies, examining one candle and the one before it. The candles before and after this central candle should have long shadows, and their bodies should not overlap with the body of the central candle. The distance between the shadows of the first and third candles is called the FVG range.
These zone function in two ways :
•Supply and Demand zone: In this case, the price reacts to these zone, and its trend reverses.
•Liquidity zone: In this scenario, the price "fills" the zone and then reaches the order block.
Important Note: In most cases, FVG zone with very small width act as supply and demand zone, while zone with a significant width act as liquidity zone, absorbing the price.
🔵 Setting
🟣Order Block
Refine Order Block : When the option for refining order blocks is Off, the supply and demand zones encompass the entire length of the order block (from Low to High) in their standard state and remain unaltered. On the option for refining order blocks triggers the improvement of supply and demand zones using the error correction algorithm.
Refine Type : The enhancement of order blocks via the error correction algorithm can be executed through two methods: Defensive and Aggressive. In the Aggressive approach, the widest possible range is taken into account for order blocks.
Show High Levels : If major high levels are to be displayed, set the option for showing high level to Yes.
Show Low Levels : If major low levels are to be displayed, set the option for showing low level to Yes.
Show Last Support : If showing the last support is desired, set the option for showing last support to Yes.
Show Last Resistance : If showing the last resistance is desired, set the option for showing last resistance to Yes.
🟣 FVG
FVG Filter : When FVG filtering is activated, the number of FVG areas undergoes filtration based on the specified algorithm.
FVG Filter Types :
1. Very Aggressive : Apart from the initial condition, an additional condition is introduced. For an upward FVG, the maximum price of the last candle should exceed the maximum price of the middle candle. Similarly, for a downward FVG, the minimum price of the last candle should be lower than the minimum price of the middle candle. This mode eliminates a minimal number of FVGs.
2. Aggressive : In addition to the conditions of the Very Aggressive mode, this mode considers the size of the middle candle; it should not be small. Consequently, a larger number of FVGs are eliminated in this mode.
3. Defensive : Alongside the conditions of the Very Aggressive mode, this mode takes into account the size of the middle candle, which should be relatively large with the majority of it comprising the body. Furthermore, to identify upward FVGs, the second and third candles must be positive, whereas for downward FVGs, the second and third candles must be negative. This mode filters out a considerable number of FVGs, retaining only those of suitable quality.
4. Very Defensive : In addition to the conditions of the Defensive mode, the first and third candles should not be very small-bodied doji candles. This mode filters out the majority of FVGs, leaving only the highest quality ones. Show Demand FVG: Enables the display of demand-related boxes, which can be toggled between off and on. Show Supply FVG: Enables the display of supply-related boxes along the path, which can also be toggled between off and on.
🟣 Liquidity
Statics Liquidity Line Sensitivity : A value ranging from 0 to 0.4. Increasing this value reduces the sensitivity of the "Statics Liquidity Line Detection" function and increases the number of identified lines. The default value is 0.3.
Dynamics Liquidity Line Sensitivity : A value ranging from 0.4 to 1.95. Increasing this value enhances the sensitivity of the "Dynamics Liquidity Line Detection" function and decreases the number of identified lines. The default value is 1.
Statics Period Pivot : Default value is set to 8. By adjusting this value, you can specify the period for static liquidity line pivots.
Dynamics Period Pivot : Default value is set to 3. By adjusting this value, you can specify the period for dynamic liquidity line pivots.
You can activate or deactivate liquidity lines as necessary using the buttons labeled "Show Statics High Liquidity Line," "Show Statics Low Liquidity Line," "Show Dynamics High Liquidity Line," and "Show Dynamics Low Liquidity Line".

[Options Strategies] Selling Covered Calls and Puts (TSO) This trading indicator assists with traditional covered options trading strategies like Covered Calls, Covered Puts, and Cash Secured Puts. It also offers advanced features for trading options intelligently by utilizing options specific levels, such as BE (Break Even) and Strike (all visually shown on chart) in combination with S&R (Support and Resistance), Trend Lines, and other technical analysis tools such as MA (Moving Averages) and ATR Average True Range, all integrated within the indicator.
* Covered options approach over trading shares or options separately offers distinct advantages:
- Reduced Risk and Flexibility : Covered options strategy provides a more conservative approach by combining stock ownership with options trading. It reduces risk exposure compared to buying options outright or trading shares alone. Additionally, it offers flexibility in various market conditions.
- Profitability in Sideways Markets: Covered options allow for profitability in scenarios where the stock price is either moving optimally or remaining sideways. In contrast, just holding stocks might not yield significant gains in a sideways market, and buying options can result in losses due to time decay.
- Protection Against Price Movements: In covered options, if the stock price goes against the trade, the loss is mitigated by the premium received from selling the options. This provides a level of protection compared to other trading strategies where losses can accumulate more rapidly.
==============================================================
Strategies / Visual Examples:
---------------------------------------------------------------------------
---------------------------------------------------------------------------
Up to 3 Symbols can be monitored at the same time with alerts for each Symbol and a Stats Table. To see Symbol's visuals (Date Range, Strike, BE, etc.) - the chart has to be loaded with that Symbol. Here is an example of trading multiple stocks at same layout on different charts trading AAPL, BAC and TSLA.
---------------------------------------------------------------------------
---------------------------------------------------------------------------
An example of a Smart Covered Calls trading SPY.
STRATEGY EXPLANATION:
* Trade Open Trigger (Bullish/Sideway)
>>> S&R (Support and Resistance) or Trend Line broken, bounced off or simply near (if price is near/slightly crossing S&R/Trend Line > a bounce often takes place)
>>> Confirmation by additional TA (Technical Analysis) tools.
>>> EXAMPLE: Broken Resistance combined with a Trend Line up-bounce, confirmed by bullish 200EMA.
* TP (Take-Profit)
>>> Contracts Expire at Expiration date: Premium received for selling contracts kept.
>>> Assignment: Premium received for selling contracts kept + stock assigned/sold at a higher price than it was purchased.
* BE/SL (Break Even Stop-Loss) |
>>> BE/SL hit: stock sold at a slight loss with options contracts bought out (BTC - Buy to Close) at a lower price than initially sold (since price went down and these are calls), so technically the loss is reduced by the partial Premium still kept from initially sold contracts at trade open.
>>> Increasing the BE/SL distance: for wider BE/SL > Bid Price needs to be increased:
- Set longer Expiration date.
- Set closer Strike price.
NOTE: With longer Expiration date and closer Strike, chances of assignment increase as well. It's best to find an optimal level, where BE/SL is behind a Support/Resistance level and/or an established trend line and/or Large Length Moving Average, yet not extremely far away.
---------------------------------------------------------------------------
---------------------------------------------------------------------------
An example of a Smart Covered Puts trading SPY.
STRATEGY EXPLANATION:
* Trade Open Trigger (Bearish/Sideway)
>>> S&R (Support and Resistance) or Trend Line broken, bounced off or simply near (if price is near/slightly crossing S&R/Trend Line > a bounce often takes place)
>>> Confirmation by additional TA (Technical Analysis) tools.
>>> EXAMPLE: Broken Resistance combined with a Trend Line down-bounce, confirmed by bearish 200EMA.
* TP (Take-Profit)
>>> Contracts Expire at Expiration date: Premium received for selling contracts kept.
>>> Assignment: Premium received for selling contracts kept + stock assigned/bought-to-cover at a lower price than it was shorted.
* BE/SL (Break Even Stop-Loss) |
>>> BE/SL hit: stock bought-to-cover at a slight loss with options contracts bought out (BTC - Buy to Close) at a lower price than initially sold (since price went up and these are puts), so technically the loss is reduced by the partial Premium still kept from initially sold contracts at trade open.
>>> Increasing the BE/SL distance: for wider BE/SL > Bid Price needs to be increased:
- Set longer Expiration date.
- Set closer Strike price.
NOTE: With longer Expiration date and closer Strike, chances of assignment increase as well. It's best to find an optimal level, where BE/SL is behind a Support/Resistance level and/or an established trend line and/or Large Length Moving Average, yet not extremely far away.
---------------------------------------------------------------------------
---------------------------------------------------------------------------
An example of a Smart Secured Cash Puts trading SPY.
STRATEGY EXPLANATION:
* Trade Open Trigger (Bullish/Sideway)
>>> Bullish steady trend.
>>> Confirmation by additional TA (Technical Analysis) tools.
>>> EXAMPLE: Slowly rising price action above 200EMA.
* TP (Take-Profit)
>>> Early BTC: BTC (Buy to Close) before Expiration date if options premium/contract price already reduced by at least 50-90% (the reduced price is the profit, if premium lost 90% - only 10% will need to be paid to buy options out to close the trade) and if the stock price is nearing Resistance, Trend Line or big length moving average (like 200EMA) as a bounce may happen or even a potential reverse of the trend. If there is no trend reversal or a small correction bounce occurs, with further trend continuation > another Cash Secured Puts trade can be opened with new Expiration date and Strike.
>>> Contracts Expire at Expiration date: Premium received for selling contracts kept, considering the Strike was never hit.
>>> Assignment with stock closing below Strike and above/near BE (Break Even): Premium received for selling contracts kept. NOTE: It is best to get rid of the stock ASAP to then open a new Cash Secured Puts trade with lower Strike and a new Expiration date.
* BE/SL (Break Even Stop-Loss) |
>>> BE/SL hit: contracts bought out (BTC - Buy to Close) at a higher price than initially sold (since price went down and these are puts), the amount/difference in current contract price is the loss (as premium received + contract price increase is the total cost, which will have to be paid to buy the countracts out).
>>> Increasing the BE/SL distance: for wider BE/SL > Bid Price needs to be increased:
- Set longer Expiration date.
- Set closer Strike price.
NOTE: With longer Expiration date and closer Strike, chances of assignment increase as well. It's best to find an optimal level, where BE/SL is behind a Support/Resistance level and/or an established trend line and/or Large Length Moving Average, yet not extremely far away.
---------------------------------------------------------------------------
---------------------------------------------------------------------------
An example of Options Wheel strategy trading TQQQ. See how Strike and BE (Break Even) hits are displayed every time they occur.
STRATEGY EXPLANATION:
* Trade Open Trigger (Bullish/Sideway)
>>> Options Wheel strategy combines Cash Secured Puts with Covered Calls, so a steady bullish trend is preferred with lower volatility.
>>> It's best to start with Cash Secured Puts until assignment hits (stocks purchased), then switch to Covered Calls until assignment hits (stocks sold) and so on.
* TP (Take-Profit)
>>> Contracts Expire at Expiration date: Premium received for selling contracts kept.
>>> Assignment: Premium received for selling contracts kept. Stock is assigned (purchased if Cash Secured Puts were sold | sold if Covered Calls were sold ).
* BE/SL (Break Even Stop-Loss)
>>> Assignment is the stop-loss for this strategy, which ends current trade and starts next one. It is not a direct loss, but could result a long unrealized losses if after stock purchase assignment it goes down for a while or even a complete loss if low-cap company is used and it goes out of business.
>>> BE/SL distance can still be increased/kept optimal: for wider BE/SL > Bid Price needs to be increased:
- Set longer Expiration date.
- Set closer Strike price.
NOTE: With longer Expiration date and closer Strike, chances of assignment increase as well. It's best to find an optimal level, where BE/SL is behind a Support/Resistance level and/or an established Trend Line and/or Large Length Moving Average, yet not extremely far away.
| 3.0_wheel_strategy_tqqq_example.png
===========================================================================
Trading open/close/TP/SL labels, plots and colors explanations:
---------------------------------------------------------------------------
There are 3 approaches: Cashed Secured Puts, Covered Puts, Covered Calls. Here is an example showing all 3 (the Strikes, Bid prices, Expirations were chosen realistically).
>>> There are 3 symbol templates, the color can be changed for each and each symbol template can be unchecked to be fully hidden or all 3 can be used.
>>> Strike: dashed horizontal line plotted at chosen Strike, if Strike is hit within the Date Range - there will be a label shown.
>>> BE (Break Even): dotted horizontal line plotted at calculated BE, if BE is hit within the Date Range - there will be a label shown.
>>> Stock Purchased: solid horizontal line plotted at input price at which the stock was purchased.
>>> Date Range (STO >>> Expiration ): vertical lines with arrows (arrows direction is based on the approach), which connect Strike, BE (Break Even) and Stock Purchased creating an square/rectangle of the whole trade, making it easy to see everything at once.
>>> Stats Table: shows all the necessary data for each symbol.
===========================================================================
GLOBAL SETTINGS ///////////////////////////////////////////////////////////
---------------------------------------------------------------------------
>>> Show: week divider vertical lines: Will show vertical divider lines separating each week.
>>> Show: Mondays and Fridays: Will show M - for Monday, F - for Friday, T - for Tuesday (Tuesday will be shown if there is a Holiday on Monday)
---------------------------------------------------------------------------
OPTIONS SETUP: SYMBOL0X /////////////////////////////////////////////////// | (identical for all 3 symbols)
---------------------------------------------------------------------------
>>> Symbol0X | Show Table: Turns on symbol01, all visuals on chart, calculations, etc. Table can be separately hidden if desired.
>>> Label Size: Size of the labels on chart showing Strike, BE (Break Even), etc.
>>> Label Color: Color for all symbol0X labels.
>>> Text Color: Text color for all symbol0X labels.
>>> Options Trading Style: 1)Covered Calls: Bullish-sideways market approach (need to own 100 shares of stock per each contract sold), Strike price has to be set above the current stock price | 2)Covered Puts: Bearish-sideways market approach (need to own 100 shares of stock per each contract sold), Strike price has to be set below the current stock price | 3)Cash Secured Puts: Bullish-sideways approach (need to have enough cash to acquire shares at Strike price if hit), Strike price has to be set below the current stock price.
>>> # of contracts sold (1 contract > 100shares): # of contracts sold per trade, for Covered Calls and Covered Puts, every contract must be backed up by 100shares of the underlying stock.
>>> Price per 1 contract (Bid): Premium received per each contract sold.
>>> Strike Price.
>>> Stock Purchase Price: Stock purchase price (NOTE: This is only for Covered Call and Covered Puts, for Secured Cash Puts - stock is only purchased if at Expiration it closes beyond Strike price).
>>> STO (Sell to Open) Date: date at which the contracts were sold and Premium received.
>>> Exp (Expiration) Date: date at which contracts expire, if price never breaks the Strike at Expiration - contracts become worthless!
>>> Alert/Label: Futures Expire Soon: With this setting turned on, an Alert will trigger and a Label will be shown at opening of the first candle bar on the Expiration date. It will certainly be before the end of the day, however depending on the chart TimeFrame during alert creation - it may trigger at a different time. For Example: On a Daily chart TimeFrame SPY (S&P500) will trigger such alert at 9:30AM ET. ||| NOTE: Due to difference in timezones - the solid lines representing the STO >>> Exp range may be off by 1 business day from the date input in the indicator Settings > Inputs, so double check and calibrate the date by setting it 1 day behind/ahead from actual dates so that Alert is received on the actual Expiration date.
>>> Strike price Broken - Style: 'Close': Show/Alert Strike price broken only once candle bar is closed | 'Live': Show/Alert Strike price broken immediately once it happens, before candle bar is closed.
>>> Show: Strike price Broken: will show a label near candle bar breaking the Strike price.
>>> Alert: Strike price Broken: will alert at price breaking the Strike price.
>>> BE (Break Even) price Broken - Alert Style: 'Close': Show/Alert BE (Break Even) price broken only once candle bar is closed | 'Live': Show/Alert BE (Break Even) price broken immediately once it happens, before candle bar is closed.
>>> Show: BE (Break Even) price Broken: will show a label near candle bar breaking the BE price.
>>> Alert: BE (Break Even) price Broken: will alert at price breaking the BE price.
---------------------------------------------------------------------------
TA: TREND LINES ///////////////////////////////////////////////////////////
---------------------------------------------------------------------------
>>> Trend Lines - Uptrend/downtrend colors
>>> Show: Trend Lines: Show/Hide trend lines
>>> Show: Trend Line Breaks: Show/Hide labels where trend lines were broken
>>> Alert: Trend Line Breaks: Alert when trend line is broken
>>> Trend Lines - Search - Left Bars / Trend Lines - Search - Right Bars: how many candle bars will be used to calculate Trend Lines, the bigger the number > the more precise and less amount of trend lines will be found
>>> Trend Lines - Extend Setting
---------------------------------------------------------------------------
TA: S&R (SUPPORT AND RESISTANCE) //////////////////////////////////////////
---------------------------------------------------------------------------
>>> S&R (Support and Resistance) - Support/Resistance colors.
>>> Show: S&R (Support and Resistance) Top/Bottom Levels.
>>> Show: S&R (Support and Resistance) Top/Bottom Level Breaks: Show/Hide labels where support/resistance levels were broken
>>> Alert: S&R (Support and Resistance) Top/Bottom Level Breaks: Alert when S&R (Support and Resistance) level is broken
>>> S&R (Support and Resistance) - Search - Left Bars / S&R (Support and Resistance) - Search - Right Bars: how many candle bars will be used to calculate S&R (Support & Resistance) Levels, the bigger the number > the more precise and less amount of support and resistance levels will be found.
>>> S&R Search - Custom Resolution: This is a custom timeframe setting specifically for S&R Search, it disregards current chart timeframe. This is great to use for scalping, for example: with main chart set to 1min and the custom timeframe set to 3min or 5min - there will be stronger support/resistance levels with more detailed price action.
---------------------------------------------------------------------------
TA: ADDITIONAL TOOLS //////////////////////////////////////////////////////
>>> Show - MA (Moving Average).
>>> Show - ATR (Average True Range).
---------------------------------------------------------------------------
---------------------------------------------------------------------------
STATS TABLE ///////////////////////////////////////////////////////////////
Stats Table displays all the necessary date about each options setup.
>>> Table positioning
---------------------------------------------------------------------------
===========================================================================
Adding Alerts in TradngView
---------------------------------------------------------------------------
-Add indicator to chart and make sure to check/uncheck which alerts are required, then simply create it.
-Right-click anywhere on the TradingView chart
-Click on Add alert
-Condition: Select this indicator by it’s name
-Immediately below, change it to "alert() function calls only"
-Expiration: Open-ended (that may require higher tier TradingView account, otherwise the alert will need to be occasionally re-triggered)
-Alert name: Whatever you desire
-Hit “Create”
-Note: If you change ANY Settings within the indicator – you must DELETE the current alert and create a new one per steps above, otherwise it will continue triggering alerts per old Settings!
===========================================================================
If you have any questions or issues with the indicator, please message me directly via TradingView.
---------------------------------------------------------------------------
Good Luck! (NOTE: Trading is very risky, past performance is not necessarily indicative of future results, so please trade responsibly!)
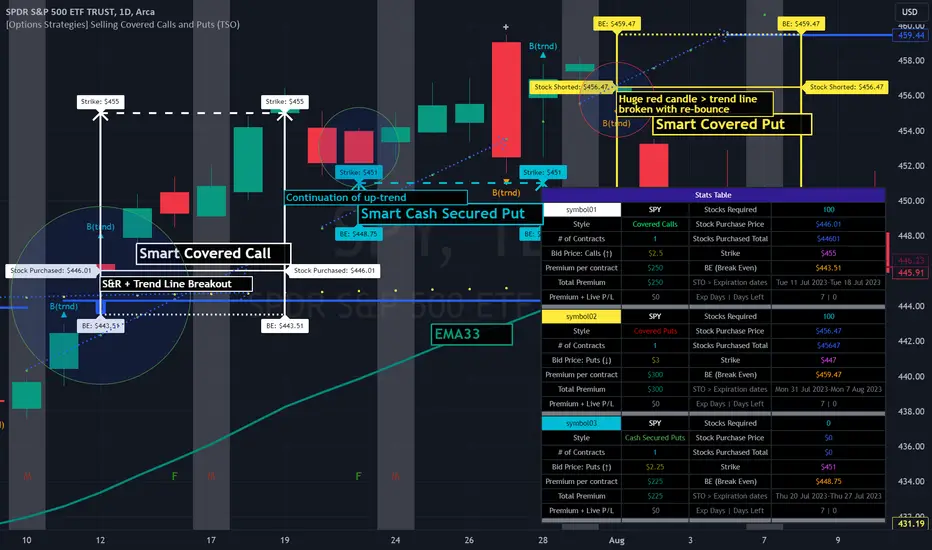
Single Swing Strategy (SSS)Introduction
The Single Swing Strategy (SSS) is a trading strategy designed for assets that trend. It utilises a single technical indicator to identify potential buying opportunities in upward-trending markets. The strategy focuses on moments when the price of an asset breaks out to a new high, suggesting a strong upward momentum.
Components
1. Exponential Moving Averages (EMAs): SSS uses two EMAs to evaluate the overall asset trend. SSS describes an uptrend as identified, when the fast EMA crosses above the slow EMA and vice versa for a downtrend.
2. Breakout: The strategy validates the trend identified by the EMAs through breakouts in the price action of the asset over a specified lookback period. No indicator is required for this step.
3. Average Directional Index (ADX): The ADX is used to measure the strength of a trend. It does not indicate the trend's direction but rather its strength, whether it's an uptrend or downtrend. A high ADX value (typically above 25) suggests a strong trend, either up or down while a low ADX value (typically below 20) indicates a weak or non-trending market. The ADX itself is a moving average of the expanding range between the +DI and -DI.
4. Positive Directional Indicator (DI+): DI+ helps identify the presence and strength of uptrends. It is calculated based on the upward price movement between current and previous highs. A rising DI+ alongside a rising ADX suggests a strengthening uptrend. When DI+ crosses above DI-, it's often interpreted as a bullish signal.
5. Negative Directional Indicator (DI-): DI- is used to detect the presence and strength of downtrends.It is derived from the downward price movement between current and previous lows. An increasing DI- along with a rising ADX indicates a strengthening downtrend while a crossover of DI- above DI+ is typically seen as a bearish signal.
How it works
1. Regime filter with ADX, DI+, and DI-: The first step in taking a trade is to determine the direction of the trend using the +DI. If in an uptrend, the strategy checks if the ADX is above 25 to confirm a strong uptrend. -DI is not used since the strategy is long only. If in an uptrend and the trend is strong, trades can be opened.
2. Trend Identification with EMAs: Initially, the strategy uses two Exponential Moving Averages (fast and slow) to determine the asset trend. A fast EMA crossing above the slow EMA signifies an uptrend, and vice versa for a downtrend. This is the Entry signal to open a long position.
3. Trend Confirmation with Breakout: The strategy confirms the EMA-indicated trend through price breakouts over a specified lookback period. An EMA crossover without a price action breakout does not lead to an entry signal
4. Trade Management: After entering a trade, the strategy uses predefined levels for taking profit and setting stop losses. Trades are closed either when the price reaches the take-profit level or falls to the stop-loss level. Hence, risk management is built in.
Results
The backtest results can be found below. Initial capital of 10000 was used, this is a convenient amount for most retail traders, commission of $3 per order, position size of 3% of initial capital and slippage of 3 ticks. These are all representative of real world retail trading conditions.
Originality
The Single Swing Strategy (SSS)'s originality is in its blending of classical technical analysis; Trend Analysis through EMAs and Price Action through Breakout, into an innovative trading logic.
1. The Essence of Trend and Breakout in SSS
(i) Trend Recognition: At the heart of SSS is the Exponential Moving Averages (EMAs). While the use of EMAs is common, SSS employs them for trend analysis so an entry decision can be made. The strategy's core algorithm assesses the inception of an upward trend by observing a specific crossing pattern of the EMAs, a moment where the asset's momentum shifts, offering a strategic advantage.
(ii) Breakout Significance: The strategy's reliance on price breakouts isn't just about identifying a new high; it's about understanding market psychology. A breakout beyond a previous high signals not only momentum but also a collective market sentiment that favors upward movement. SSS attempts to capture this momentum, translating it into a tangible trading opportunity.
(iii)Strength of trend: The ADX and +DI double checks the trend is in the right direction and checks to see if the trend is strong enough hence, it prevents trading when the trend is not supportive.
2. Simplicity as a Cornerstone
(i) Clarity and Efficiency: In the realm of algorithmic trading, complexity isn't always synonymous with effectiveness. SSS' simplicity ensures its logic is transparent and its execution, efficient. This simplicity is a strategic choice, designed to reduce overfitting to past data and improve adaptability to real-market conditions.
(ii) Ease of Use and Decision Making: The straightforward nature of SSS may empower traders to make informed decisions without being overwhelmed by convoluted indicators. This is particularly useful because of the embedding of risk management using defined exit points after entry through a Take Profit and Stop Loss. This hardcodes a 3:1 risk reward ratio into every trade.
3. Positive Expectancy
(i) Performance Metrics: The SSS strategy shows its edge in its backtesting results. A 62% win rate, a profit factor of 1.7, profit ratio of 1.05 and an average trade gain of 4.7% are not just numbers; they show the mathematical edge over the backtest period, especially considering the high commissions and slippage factored into its design.
Trading
The SSS strategy has been backtested on the 1D timeframe of BTCUSD but users are encouraged to try it on other assets such as SPXL (5min), AAPL (5min) and others but the appropriate timeframe and trading costs may vary.
NOTE
Like any trading strategy, SSS does not guarantee profits. It's a tool to assist in decision-making, not a foolproof solution. Trading involves risks, particularly in volatile markets. Users should trade responsibly, considering their risk tolerance and financial situation. While SSS automates some aspects of trading, it requires continuous monitoring and does not replace the need for sound judgement and decision-making by the trader.

2Mars - MA / BB / SuperTrend
The 2Mars strategy is a trading approach that aims to improve trading efficiency by incorporating several simple order opening tactics. These tactics include moving average crossovers, Bollinger Bands, and SuperTrend.
Entering a Position with the 2Mars Strategy:
Moving Average Crossover: This method considers the crossing of moving averages as a signal to enter a position.
Price Crossing Bollinger Bands: If the price crosses either the upper or lower Bollinger Band, it is seen as a signal to enter a position.
Price Crossing Moving Average: If the price crosses the moving average, it is also considered a signal to enter a position.
SuperTrend and Bars confirm:
The SuperTrend indicator is used to provide additional confirmation for entering positions and setting stop loss levels. "Bars confirm" is used only for entry to positions.
Moving Average Crossover Strategy:
A moving average crossover refers to the point on a chart where there is a crossover of the signal or fast moving average, above or below the basis or slow moving average. This strategy also uses moving averages for additional orders #3.
Basis Moving Average Length: Ratio * Multiplier
Signal Moving Average Length: Multiplier
Bollinger Bands:
Bollinger Bands consist of three bands: an upper band, a lower band, and a basis moving average. However, the 2Mars strategy incorporates multiple upper and lower levels for position entry and take profit.
Basis +/- StdDev * 0.618
Basis +/- StdDev * 1.618
Basis +/- StdDev * 2.618
Additional Orders:
Additional Order #1 and #2: closing price crosses above or below the Bollinger Bands.
Additional Order #3: closing price crosses above or below the basis or signal moving average.
Take Profit:
The strategy includes three levels for taking profits, which are based on the Bollinger Bands. Additionally, a percentage of the position can be chosen to close long or short positions.
Limit Orders:
The strategy allows for entering a position using a limit order. The calculation for the limit order involves the Average True Range (ATR) for a specific period.
For long positions: Low price - ATR * Multiplier
For short positions: High price + ATR * Multiplier
Stop Loss:
To manage risk, the strategy recommends using stop loss options. The stop loss is updated with each entry order and take-profit level 3. When using the SuperTrend Confirmation, the stop loss requires confirmation of a trend change. It allows for flexible adjustment of the stop loss when the trend changes.
There are three options for setting the stop loss:
1. ATR (Average True Range):
For long positions: Low price - ATR * Long multiplier
For short positions: High price + ATR * Short multiplier
2. SuperTrend + ATR:
For long positions: SuperTrend - ATR * Long multiplier
For short positions: SuperTrend + ATR * Short multiplier
3. StdDev:
For long positions: StdDev - ATR * Long multiplier
For short positions: StdDev + ATR * Short multiplier
Flexible Stop Loss:
There is also a flexible stop loss option for the ATR and StdDev methods. It is triggered when the SuperTrend or moving average trend changes unfavorably.
For long positions: Stop-loss price + (ATR * Long multiplier) * Multiplier
For short positions: Stop-loss price - (ATR * Short multiplier) * Multiplier
How configure:
Disable SuperTrend, take profit, stop loss, additional orders and begin setting up a strategy.
Pick soucre data
Number of bars for confirm
Pick up the ratio of the base moving average and the signal moving average.
Set up a SuperTrend
Time for set up of the Bollinger Bands and the take profit
And finaly set up of stop loss and limit orders
All done!
For OKX exchange:

01 Position CalculatorI present to your attention a calculator for calculating the volume per position.
This calculator is tested on cryptocurrency trading and MOEX liquid shares!
This calculator is suitable for beginners to make it easier to study trading and not get confused at the very beginning with volume calculations, I also use it for virtual trading, a position is drawn on the chart in real time, which shows the amount of loss or profit, that is, with the help of it I I practice different strategies without losing real money on experiments.
All calculations are made at your risk.
You need to indicate what your working deposit is, what percentage of it you are willing to risk per day, the number of your losing trades for one trading session, after which you will stop trading for that day, the amount of risk will be divided by the number of unprofitable trades.
The principle of operation is as simple as possible, you need to indicate three lines on the chart 1 - time line: it is needed so that a position on the chart can be drawn from it. 2 – Entry line for entering a position: the price at which you want to buy an asset. 3 – stop loss line “SL”: the price upon reaching which your losing trade will be closed. If the 3-stop loss line is placed below the 2-Entry line, then a long position will be calculated, if the stop loss line is above the Entry line, then a short position will be calculated. take profit "TP" is calculated automatically according to your settings in the menu.
And so on in order through the menu from top to bottom.
1. Rounding the volume to a whole number: if you select “round”, then the volume of the acquired asset (shares, coins, etc.) will be rounded to a whole number, but be careful if your deposit is $100, and the cost of 1 unit of the asset is more than $1000, then the calculator will give error. MOEX shares are traded only in whole lots, so rounding occurs automatically.
2. Automatic calculation of SL in 1 ATR of the selected TF (auto/manual) (ATR...): if you select auto and specify, for example, ATR 1h, then your “SL” will be calculated automatically and set at a distance from Entry of 1 ATR of the hourly time frame (this is the average price change over 1 hour)
3. Cryptocurrency deposit commission, MOEX deposit commission: I made two different deposits on purpose so as not to change the settings each time, depending on the schedule you choose, MOEX or cryptocurrency, the required deposit and commission will be automatically taken into account.
4. Slippage: this is the percentage of slippage on closing a position at a stop loss.
5. Daily drawdown % (...): this is the percentage of your trading deposit that you are willing to risk for one trading session, the amount at risk.
6. Ratio rice /profit 1/ (...): you need to indicate the SL/TP ratio, based on this your income per trade is calculated and the distance to TP is outlined on the graph.
7. Number of losing trades (...): this is the number of your trades per trading session after receiving which you will end trading for that day, the amount of risk will be divided by the number of losing trades.
8. Position: you can enter the start date of the position and Entry and SL prices
9. ATR – specify the number of last candles to calculate the average price movement of the selected time frame
Now, as for the tables located by default on the left and right at the bottom of the screen, I made windows with descriptions; when you hover the cursor over a cell, a description pops up.
RU
Этот калькулятор проверен, на торговле криптовалюты и ликвидных акциях MOEX!
Этот калькулятор подойдет начинающим, чтоб облегчить изучение торговли и не запутаться в самом начале с расчётами объемов, так же я использую его для виртуальной торговли, на графике в реальном времени рисуется позиция, на которой видно суму убытка или прибыли, то есть с помощью него я отрабатываю разные стратегии, не теряя реальные деньги на эксперименты.
Все расчеты делаются от вашего риска.
Вам необходимо указать какой ваш рабочий депозит, каким процентом от него вы готовы рискнуть на день, количество ваших убыточных сделок на одну торговую сессию, после которых вы прекратите торговлю на этот день, сумма риска будет поделена на количество убыточных сделок.
Принцип работы максимально прост, вам нужно указать на графике три линии 1 - линия время: она нужна чтоб от нее рисовался позиция на графике. 2 –линия Entry входа в позицию: цена по которой вы хотите купить актив. 3 – линия stop loss «SL»: цена при достижении которой закроется ваша убыточная сделка. Если линию 3-stop loss разместить под линией 2-Entry то будет рассчитываться длинная позиция, ели лини stop loss будет над линией Entry то будет рассчитываться короткая позиция. take profit «TP» рассчитывается автоматически согласно вашим настройкам в меню.
И так по порядку по меню с верху в низ.
1. Округление объема до целого: если выбрать «round -округлить», то объем приобретаемого актива (акции, монеты и другого) будет округлен до целого числа, но будьте внимательны если ваш депозит 100$, а стоимость 1 единицы актива более 1000$ то калькулятор выдаст ошибку. Акции MOEX торгуются только целыми лотами потому округление происходит автоматически.
2. Авто расчёт SL в 1 ATR выбранного TF (auto/manual) (ATR…): если выбрать auto и указать, к примеру ATR 1h, то ваш «SL», будет рассчитан автоматически и выставлен на расстоянии от Entry в 1 ATR часового time frame (это усредненное изменение цены за 1 час)
3. Депозит крипто валюты комиссия, депозит MOEX комиссия: сделал специально два разных депозита чтоб каждый раз не менять настройки, в зависимости от выбранного вами графика, MOEX или криптовалюта, будет автоматически браться в расчет нужный депозит и комиссия.
4. Проскальзывание: это процент на проскальзывание закрытия позиции по stop loss.
5. Просадка на день % (…): это процент от вашего торгового депозита, которым вы готовы рискнуть на одну торговую сессию, сумма риска надень.
6. Соотношение рис /прибыль 1/ (…): вам нужно указать соотношение SL/TP на основе этого рассчитывается ваш доход на сделку и на графике обрисовывается расстояние до TP.
7. Количество убыточных сделок (…): это количество ваших сделок на торговую сессию после получения, которых вы закончите торговлю на этот день, сумма риска надень будет поделена на количество убыточных сделок.
8. Позиция: можно вписать дату начала позиции и цены Entry и SL
9. ATR – укажите количество последних свечей для расчета среднего движения цены выбранного time frame
Теперь что касается таблиц расположенных по умолчанию с лева и справа в низу экрана, я сделал окна с описаниями, при наведении курсора на ячейку всплывает описание.
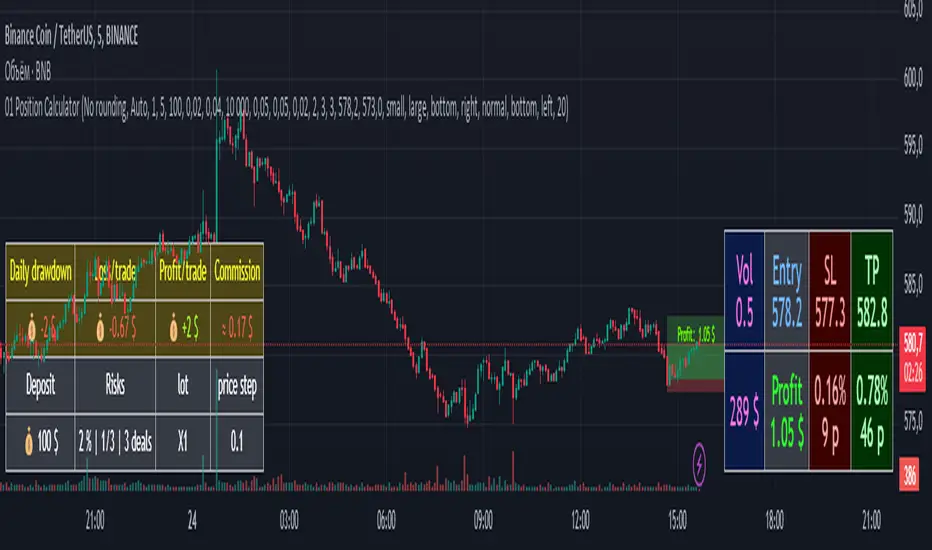
PTS Pi-Osc V1
The PTS - Pi-Osc know as Precision Index Oscillator by Roger Medcalf - Precision Trading Systems.
How does the Pi-Osc work?
Pi-Osc is a highly sophisticated consensus type indicator comprising of many different component signals.
A technical traders tool that measures everything from divergences to probabilities all blended into one simple to use product.
The buy and selling opportunities are highlighted by the moves away from + or - 3.14.
Simple to use for all levels of experience from beginner to expert and offers a unique edge in terms of precision.
The components that go into computations are identified below.
Money flow index provides a simple snapshot of how sold out or pumped up a stock or future really is and when measured in three different time frames gives a slick consensus view of money flow.
Relative strength index (RSI) still the No1 most popular indicator in use today as its power to identify overbought and oversold qualities in sideways markets is exceptional.
Its poor performance in trends is greatly reduced when seamlessly integrated with the PI-Osc algorithm.
Demand index being one of the designers favourite indicators for measuring the future direction caused by a large volume trade is incorporated here as well as its exceptional efficiency as a divergence indicator.
James Sibbet's creation provides an additional stellar incisive cutting accuracy to the Pi-Osc. Sibbets creation is one of the only indicators with true predictive qualities as a leading indicator.
Divergences. Pi-Osc measures divergences which occur over many look back periods from two different indicators, realising that divergences are often spurious in their reliability, the indicator only factors 4% of the total indicator
reading from these. Paradoxically the buy and sell zones have to have at least one observation of a divergence to trigger a signal.
Volume is always a factor that precedes a price change, as stock prices cannot move without a real money value being assigned to it either as a recent trade or a bid-offer order being placed.
The designer's understanding of volume patterns is a very useful addition incorporated into the Pi-Osc indicators unique conception.
Momentum frequently decelerates prior to market turning points and PI-osc is monitoring several timeframes of smoothed momentum samples in its calculations.
But unlike a conventional rate of change or momentum indicator the Pi-Osc indicator scores a neutral reading when momentum is rising or falling fast, and a reading is only factored into the output when momentum is reducing, thus
indicating a higher probability of success.
Probability is another feature of this algorithm.
Although rarely used in industry standard oscillators, the designer has added a standard deviation (2.9) factor into this indicator as the more usual 2 standard deviations used in Bollinger bands is just not reliable enough to bet hard earned cash on.
Normally distributed price sets have a 99.9% containment within 3.3 standard deviations, so when this is breached the Pi-Osc adds or deducts a further value to its output number.
Stochastics have similar attributes to RSI oscillators and have contributed a factor into PI-osc due to their smooth and reliable ability to identify buying and selling points in non trending markets.
Price patterns. Generally the industry standard oscillators just use the closing price to calculate their values, and although some indicators such as the stochastic use the high and low in their mathematics, few oscillators are actually programmed to respond to unique candlestick chart set ups.
PI-osc is setting the standard with its intelligent programming to recognise when the current chart pattern is shouting buy signals. Several of the more reliable patterns are factored into the algorithm.
When all the maths is done, Pi-Osc does an exceptional job of determining true buying and selling points.
Basically the trading interpretation is made very simple for you, as the buy and sell zones are so logically determined, not by one factor but from a large consensus "vote" from more than one different computation.
The benefits of this indicator are that it saves valuable time in "confirming technical analysis signals" and all trades know time is precious as large price changes can be missed in seconds while checking other confirming factors.
It takes the hard work out of it, and lets your computer do the brain work.
Ideally this indicator is best as an entry signal, and exits are best done with a trailing stop which has a logical trend following exit, as its quite rare that the Pi-Osc will run right to the other extreme and issue a reverse signal.
Precision Index Oscillator has now got a new rule as a result of the gradual rise in market volatility.
Apart from the other well known main rules to wait for the bounce away from Pi and trade in the direction of the major trend, the new rule is to experiment to find the best historical timeframe.
In the old days it would fire up very nicely on a 10 minute chart of most things, and still does (sometimes) but the futures markets and the very volatile cryptocurrencies now go way out of the old extremities in terms of deviations from the norm.
So it is essential to know what the market volatility is capable of on each instrument.
The point being made here is that using this on very short term time frames is not as safe as used to be.
Institutions enjoy working together to drive the prices into areas where most traders did not expect them to go, taking out all the stops and getting a better price for themselves.
So the first task after ordering this product is to create multiple minute chart settings in your Trading View platform and then click through them and there you will find hopefully find the holy grail, just like finding the best guitar,
amplifier and effects pedal settings for creating your own personalized type of music, finding the best timeframe to use you Pi-Osc is the essential work.
The holy grail usually turns out to be nothing more complex than a stop watch:
If the best setting turns out to be 15 minutes or 30 seconds on a volatile market or a 4 hours minute chart on a very volatile market then so be it.
Who cares? Does it matter?
All that matters is you find the way to get to the best results from this product.
Precision Index Oscillator has eight rules
1. Trade in the direction of the major trend
2. Find the time frame that has worked best in historical testing ( This can be a different setting for each market )
3. ALWAYS use a stop loss
4. Wait for the bounce away from Pi
5. Wait for the bounce away from Pi
6 Wait for the bounce away from Pi
7 Wait for the bounce away from Pi
8. Remember the other seven rules.
Precision Index Oscillator clarification of rules 3 to 7
This indicator can stay locked at the extreme Pi level for many bars, days, hours, minutes, seconds etc.
Taking the signal before the bounce comes is like the well known phrase "catching the falling knife".
Taking the signal before the bounce is a "Pi-Crime" and is a bad idea. Ignoring this point will likely result in losses
As Ed Seykota puts it in his usual amusing style, the problem with catching falling knives is that there are more knives than we have fingers.
He is referring to a market sell off rather than a sell off in one market.
When everything is crashing and we buy all of the crashing things at once, yes you guessed it: A painful day for the fingers!
Suggested settings for various lengths:
There are no settings to change. The beauty of Pi-Osc is there are no settings to be changed.
Your testing of "Pi signal qualifications" is confined only to selecting a time frame which appears to have offered good Pi-trades in the past.
This does not guarantee future signals will be good, and this is why risk control is essential.
Of course it is smart to experiement with different time periods of chart.
Execution of trades:
Exercise caution with this product.
Risk control is essential and risking more than 1% to 1.5% of your capital from entry price to stop would NOT be advised:
As with hunting, firing out lots of small trades in a shot gun approach will lead to better results than gambling all on the first signal you see.
There is much more chance of hitting a bird with a shot gun than a canon and the ammunition is much cheaper.
Always always use a stop loss. Something like 3 to 7 times a fifty period average true range for example.
Whilst it is often possible that a Pi-bounce appears exactly at the precise high or low of the week and could be the only one you see it is risky just to pile into it instantly as some markets produce several failed signals which continue to move in the same direction.
The safest and least risky method is to wait for the trend to change after the Pi-bounce. This is subjective to your own definition of how to measure the trend as "changing" but I would suggest waiting for a 8-20 period Exponential average to turn around before entering a trade.
Once the trade is entered you can implement a trailing stop to allow maximum potential gains and if your style is one of wanting to take quick profits then it is wise to take only some partial profits and give the move a chance to go somewhere and exit the remainder when the trend changes.
If the move was picked up near the absolute top or bottom it could be a large mistake to bail out of all of it early.
Market selection is important:
Avoid markets in endless smooth trends. These are best trading with trend following products ( Pi-Osc is not a trend following product )
Look for a choppy up or down trend or sideways market with some cycle qualities to it.
Best results are on liquid markets, you can observe the past signals and often history repeats with the good previous signals tending to indicate that future signals may also be good. (This is not certain of course)
This is also true of a market showing several historically bad signals which may be leading to more bad signals.
If the past performance of this indicator is poor on the market you are viewing, then move to another market until one is found where the readings show good price action after the signals in historical data.
Time frames:
This product can be applied to any time frame of market but be aware as is stated above, the slower time frames yield more valid signals and shorter time frames lead to more randomness and noise ridden plots of lower significance.
That said, it provides a valid reason to enter a trade and can give good results providing good stops and risk control are used. I have seen plenty of valid signals on 30 second charts right up to weekly charts.
The reliability of short term intra day time frames is usually lower than weekly or daily time frames. As 10 minute time frame is more reliable than a 30 second chart.
Please take this into consideration, try slowing down the impulses to go fast.
I am now accepting payments in USD or CHF for this product
This is not because I expect a US Dollar collapse but as a precaution to spread currency risk over different classes.
As FX rates vary substantially you can find the option that is cheaper than the other and it is fine to do that and choose the cheaper payment option.
Thanks for reading and I hope you do well with Pi-Osc on Trading View, just remember all the eight rules. You do remember them don't you?
Roger Medcalf - Precision Trading Systems