GODMODE V2.3 ULTIMATE══════════════════════════════════════════════════════════════
⚡ GODMODE V2.3 ULTIMATE ⚡
══════════════════════════════════════════════════════════════
Institutional-grade precision. Unmatched power.
The most advanced trading system ever built.
══════════════════════════════════════════════════════════════
█░█ █░░ ▀█▀ █ █▀▄▀█ ▄▀█ ▀█▀ █▀▀
█▄█ █▄▄ ░█░ █ █░▀░█ █▀█ ░█░ ██▄
────────────────────────────────
⚡ SMART MONEY CONCEPTS (SMC)
────────────────────────────────
✦ Order Block Detection
Auto-identifies bullish & bearish order blocks
Institutional buying/selling zones revealed
✦ Fair Value Gaps (FVG)
Automatically plots imbalance zones
High-probability reversal areas highlighted
✦ Break of Structure (BOS)
Real-time structure break detection
Trend continuation confirmation
✦ Change of Character (CHoCH)
Trend reversal early warning system
Catch reversals before they happen
✦ Liquidity Levels
Equal Highs/Lows detection (EQH/EQL)
Know where liquidity pools form
✦ Premium/Discount Zones
Daily range equilibrium plotted
Buy in discount, sell in premium
────────────────────────────────
📊 MULTI-TIMEFRAME ANALYSIS
────────────────────────────────
✦ 4-Timeframe Trend Dashboard
Current TF + 3 higher timeframes
Instant trend alignment visibility
✦ MTF Confluence Scoring
Signals only fire when timeframes align
Dramatically reduces false signals
✦ MTF Filter Toggle
Enable/disable for different strategies
Full control over signal filtering
✦ Custom Timeframe Selection
Choose your own MTF combination
Adapt to any trading style
────────────────────────────────
🎯 ADVANCED SIGNAL ENGINE
────────────────────────────────
✦ Multi-Confluence Buy/Sell Signals
5+ conditions must align to trigger
Institutional-quality entries
✦ RSI Confluence Filter
Eliminates overbought/oversold traps
Adjustable thresholds
✦ Volume Confirmation Filter
Validates signals with volume spikes
Customizable sensitivity
✦ MTF Trend Filter
Only trades with higher TF trend
Dramatically improves win rate
✦ Session Filter
Optional: Only signal during active hours
Avoid low-liquidity traps
✦ Signal Strength Score (0-100%)
Know exactly how strong each setup is
10+ factors calculated in real-time
✦ Anti-Repaint Mode
Signals only confirm on bar close
What you see is what you get
────────────────────────────────
🔮 PREDICTION SYSTEM
────────────────────────────────
✦ AI-Powered Prediction Line
Linear regression projection
Glowing trajectory visualization
✦ Dynamic Target Calculation
Updates with every tick
Adapts to volatility
✦ Directional Confidence
Bullish/Bearish/Neutral status
Clear actionable signals
────────────────────────────────
💰 MULTI-TARGET SYSTEM
────────────────────────────────
✦ TP1 / TP2 / TP3 Zones
Three take-profit levels
Scale out for maximum profit
✦ ATR-Based Calculations
Volatility-adjusted targets
Works on any market/timeframe
✦ Holographic Zone Display
Glowing TP/SL bands
Visually stunning presentation
✦ Customizable Multipliers
Set your own R:R preferences
Full control over risk
────────────────────────────────
🧮 POSITION SIZE CALCULATOR
────────────────────────────────
✦ Account Size Input
Enter your account balance
✦ Risk Percentage Setting
Define risk per trade (0.1-10%)
✦ Auto Position Sizing
Calculates exact position size
Based on SL distance
✦ Risk Amount Display
Shows dollar amount at risk
No more manual calculations
────────────────────────────────
📈 PERFORMANCE STATISTICS
────────────────────────────────
✦ Live Win Rate Tracker
Real-time accuracy percentage
Based on TP/SL hits
✦ Total Signals Counter
Track signal frequency
✦ Wins/Losses Display
Running W/L tally
✦ Current Streak
Track hot/cold streaks
Positive and negative
✦ Average R:R
Overall risk-reward performance
Measure your edge
────────────────────────────────
📊 KEY LEVELS
────────────────────────────────
✦ Previous Day High/Low (PDH/PDL)
Critical institutional levels
✦ Previous Week High/Low (PWH/PWL)
Swing trading reference points
✦ VWAP (Volume Weighted Average)
Institutional benchmark price
✦ Equilibrium Line
Daily range midpoint
Premium/Discount reference
────────────────────────────────
⏰ SESSIONS & KILLZONES
────────────────────────────────
✦ 4 Major Sessions
London • New York • Tokyo • Sydney
Color-coded backgrounds
✦ Killzone Highlighting
High-probability trading windows
London/NY overlap emphasized
✦ Session Dashboard Display
Current session shown in panel
Never miss prime trading hours
✦ Customizable Times
Adjust session hours to your zone
Full UTC time control
────────────────────────────────
🎨 5 PREMIUM COLOR THEMES
────────────────────────────────
✦ NEON (Default)
Cyan & Purple
Electric, vibrant aesthetic
✦ STEALTH
Grayscale tones
Minimal, professional look
✦ OCEAN
Blue spectrum
Cool, calming visuals
✦ SUNSET
Orange & Pink
Warm, energetic feel
✦ MATRIX
Green monochrome
Hacker aesthetic
────────────────────────────────
⚙️ 3 TRADING MODES
────────────────────────────────
✦ SCALP MODE
Fast MAs (9/21)
1m - 15m timeframes
Quick entries & exits
✦ SWING MODE
Balanced MAs (50/100)
1H - 4H timeframes
Ride the trends
✦ POSITION MODE
Slow MAs (100/200)
Daily+ timeframes
Long-term holds
────────────────────────────────
🎚️ 3 SIGNAL STYLES
────────────────────────────────
✦ AGGRESSIVE
More signals, faster triggers
For active traders
✦ BALANCED (Default)
Optimal signal frequency
Best risk/reward balance
✦ CONSERVATIVE
Fewer signals, higher quality
For patient traders
────────────────────────────────
💎 PREMIUM VISUALS
────────────────────────────────
✦ Neon Glow Moving Averages
Multi-layer glowing effect
Stunning trend visualization
✦ Breathing Gradient Ribbon
Opacity pulses with trend strength
Alive, dynamic display
✦ Trend Zone Background
Subtle chart tinting
Instant trend recognition
✦ Signal Burst Effects
Expanding rings on signals
Satisfying visual feedback
✦ Price Comet Trail
Fading dots follow price
Elegant motion effect
✦ Trend-Colored Candles
Candles match trend direction
Immersive chart experience
✦ Stealth Mode
Hide all visuals instantly
Clean chart when needed
────────────────────────────────
📱 TRIPLE DASHBOARD SYSTEM
────────────────────────────────
✦ MAIN DASHBOARD
12-row comprehensive panel
Trend, Power, RSI, Volume
Momentum, Session, Zone
Structure, Signal, Target
✦ MTF PANEL
4-timeframe trend arrows
Instant confluence check
✦ STATS PANEL
Win rate, W/L, Streak
Average R:R tracking
────────────────────────────────
🔔 ADVANCED ALERTS
────────────────────────────────
✦ Buy Signal Alert
✦ Sell Signal Alert
✦ Strong Buy (80%+ Power)
✦ Strong Sell (80%+ Power)
✦ BOS Bullish Alert
✦ BOS Bearish Alert
✦ CHoCH Bullish Alert
✦ CHoCH Bearish Alert
✦ Killzone Signal Alert
✦ MTF Confluence Alert
All alerts webhook-ready.
Compatible with trading bots.
────────────────────────────────
🛡️ SAFETY FEATURES
────────────────────────────────
✦ Anti-Repaint Mode
Signals confirm on bar close only
Guaranteed accuracy
✦ Stealth Mode
Instant minimal UI toggle
Clean charts when needed
✦ Customizable Everything
Every feature can be toggled
Make it yours
────────────────────────────────
🎬 ACTIVATION EXPERIENCE
────────────────────────────────
✦ Cinematic Startup Animation
"GODMODE V2.3 ULTIMATE ACTIVATED"
Pulsing gold & cyan text
✦ Mode & Theme Display
Shows your configuration
Premium onboarding experience
✦ Watermark Branding
Subtle bottom-left signature
Professional appearance
══════════════════════════════════════════════════════════════
█░█░█ █▀█ █▀█ █▄▀ █▀ █▀█ █▄░█
▀▄▀▄▀ █▄█ █▀▄ █░█ ▄█ █▄█ █░▀█
✓ All Markets (Forex, Crypto, Stocks, Futures, Indices)
✓ All Timeframes (1m to Monthly)
✓ TradingView Desktop & Mobile
✓ Works on Free & Paid TV accounts
══════════════════════════════════════════════════════════════
█▀▀ █▀█ █▀▄▀█ █▀█ ▄▀█ █▀█ █ █▀ █▀█ █▄░█
█▄▄ █▄█ █░▀░█ █▀▀ █▀█ █▀▄ █ ▄█ █▄█ █░▀█
┌─────────────────────────────────────────────────────────────┐
│ FEATURE │ PRO $50 │ ULTIMATE $99 │
├─────────────────────────────────────────────────────────────┤
│ Neon Glow Visuals │ ✓ │ ✓ │
│ Breathing Ribbon │ ✓ │ ✓ │
│ Signal Bursts │ ✓ │ ✓ │
│ Buy/Sell Signals │ ✓ │ ✓ │
│ RSI + Volume Filters │ ✓ │ ✓ │
│ TP/SL Zones │ Single │ TP1/TP2/TP3 │
│ Sessions │ Basic │ + Killzones │
│ Key Levels │ PDH/PDL │ + PWH/PWL │
│ Dashboard │ Standard │ Triple │
│ Modes │ 2 │ 3 │
│ Signal Styles │ — │ 3 │
│ Color Themes │ 1 │ 5 │
│ Smart Money (SMC) │ ✗ │ ✓ │
│ Order Blocks │ ✗ │ ✓ │
│ Fair Value Gaps │ ✗ │ ✓ │
│ BOS / CHoCH │ ✗ │ ✓ │
│ Liquidity Levels │ ✗ │ ✓ │
│ Premium/Discount │ ✗ │ ✓ │
│ Multi-Timeframe Analysis │ ✗ │ 4 TFs │
│ MTF Confluence Filter │ ✗ │ ✓ │
│ Position Size Calculator │ ✗ │ ✓ │
│ Performance Stats │ ✗ │ ✓ │
│ Win Rate Tracking │ ✗ │ ✓ │
│ VWAP │ ✗ │ ✓ │
│ Anti-Repaint Mode │ ✗ │ ✓ │
│ Stealth Mode │ ✗ │ ✓ │
│ MTF Panel │ ✗ │ ✓ │
│ Stats Panel │ ✗ │ ✓ │
│ Advanced Alerts │ 5 │ 10 │
│ Lifetime Updates │ ✗ │ ✓ │
│ Priority Support │ ✗ │ ✓ │
└─────────────────────────────────────────────────────────────┘
══════════════════════════════════════════════════════════════
█░█░█ █░█ ▄▀█ ▀█▀ █▄█ █▀█ █░█ █▀▀ █▀▀ ▀█▀
▀▄▀▄▀ █▀█ █▀█ ░█░ ░█░ █▄█ █▄█ █▄█ ██▄ ░█░
⚡ Lifetime access to GODMODE V2.3 ULTIMATE
⚡ All current features unlocked
⚡ All future updates FREE forever
⚡ Works on unlimited charts/symbols
⚡ Full customization control
⚡ Priority support via DM
⚡ Private Discord community access
⚡ Early access to V3.0
══════════════════════════════════════════════════════════════
█▀▀ ▄▀█ █▀█
█▀░ █▀█ ▀▀█
Q: Does this repaint?
A: No. Anti-Repaint Mode confirms signals on bar close only.
Q: What markets does this work on?
A: All markets — Forex, Crypto, Stocks, Futures, Indices, Commodities.
Q: What timeframe is best?
A: Scalp Mode for 1m-15m. Swing Mode for 1H-4H. Position Mode for Daily+.
Q: What are Smart Money Concepts?
A: Institutional trading strategies — Order Blocks, FVGs, BOS, CHoCH, Liquidity.
Q: How does MTF filtering work?
A: Signals only fire when your current timeframe aligns with 2+ higher timeframes.
Q: Can I customize everything?
A: Yes. Every visual, filter, level, and setting can be toggled and adjusted.
Q: Do I get future updates?
A: Yes. Lifetime updates included. V3.0 early access for ULTIMATE users.
Q: How do I get access?
A: After purchase, DM your TradingView username. Access granted within 24 hours.
Q: Is there a refund policy?
A: Due to digital nature, all sales are final. Test the PRO version first if unsure.
══════════════════════════════════════════════════════════════
▀█▀ █▀▀ █▀ ▀█▀ █ █▀▄▀█ █▀█ █▄░█ █ ▄▀█ █░░ █▀
░█░ ██▄ ▄█ ░█░ █ █░▀░█ █▄█ █░▀█ █ █▀█ █▄▄ ▄█
"Finally an indicator that actually looks as good as it performs.
The SMC features alone are worth $99."
"MTF confluence filter changed my trading. Win rate went from
45% to 67% in two weeks."
"Best purchase I've made for my trading. The dashboard tells
me everything I need at a glance."
══════════════════════════════════════════════════════════════
⚡ GODMODE V2.3 ULTIMATE — $99 ⚡
Lifetime access. Unlimited power.
Trade like an institution.
══════════════════════════════════════════════════════════════
스크립트에서 "smart"에 대해 찾기

Lumina Flow OscillatorLumina Flow Oscillator - "The Flow of Light"
The Story: Harmonizing Pressure & Flow
Every market move is born from a conflict between two forces: Pressure (Accumulation/Distribution) and Kinetic Flow (Trend Momentum). Most traders struggle because they look at these in isolation—buying a trend that has no pressure behind it, or selling a pressure release that has no flow to sustain it.
Lumina Flow was born from the idea of "Visualizing the Pulse". We asked: What if we could see the market's internal pressure building up, and only act when the kinetic energy (Flow) releases it?
This script is not just an oscillator; it is a Synthesis Engine. It harmonizes advanced pressure calculations with a next-generation kinetic flow algorithm to filter out the noise of indecision and illuminate only the moments of true market release.
How It Works (The Synthesis)
Lumina Flow combines two distinct mathematical models into a single, cohesive visual language:
1. The Pressure Engine (Oscillator Core)
At its heart lies a highly modified distribution algorithm. Unlike standard RSI or stochastic which just measure price change, the Pressure Engine measures the effort behind the move (Price * Volatility * Volume).
Smart Extremes: Buying is only permitted when Pressure is critically low (< 35), and Selling is only permitted when Pressure is critically high (> 65). This is the "Safety Valve" that prevents you from entering mid-range, choppy markets.
2. The Kinetic Flow System (The Ribbons & Gradient)
To ensure we don't catch falling knives, we integrated a sophisticated Kinetic Flow algorithm (based on advanced weighted arrays).
The Flow Ribbons: The glowing ribbons at the top and bottom of the chart represent the kinetic energy of the trend.
The Gradient: Notice the color flow. It doesn't just flip Green/Red. It flows through a spectrum—from Deep Teal (Strong Flow) to fading Cyan, or Fiery Red (Strong Drop) to fading Orange. This visualization helps you feel the acceleration and deceleration of the move before it happens.
How to Use "Lumina Flow"
The beauty of Lumina is in its simplicity. We have removed the noise.
Wait for the Extremes: Look for the Main Oscillator line to enter the Bottom Zone (below 35) or Top Zone (above 65).
Watch the Flow: Wait for the specific Lumina Dot to appear. This dot appears only when the Kinetic Flow confirms a reversal while you are in the Smart Zone.
Teal Dot: High Probability Buy (Pressure is Released Upwards).
Red-Orange Dot: High Probability Sell (Pressure is Released Downwards).
Ride the Ribbon: As long as the Top/Bottom ribbons remain bright and solid, the trend flow is active.
Key Features
Smart Zone Guard: Automatically filters out "middle of the road" weak signals.
Kinetic Smoothing: Zero-lag smoothing ensures the oscillator is responsive but free of "jitter".
Divergence Intelligence: built-in divergence detection highlights when price and pressure disagree (marked by Diamonds).
Lumina Aesthetic: Designed with a specific "Neon Flow" palette to be easy on the eyes during long sessions while highlighting critical data points.
Disclaimer & Credits
This script is a unique synthesis of open-source concepts, refined and harmonized for a specific trading style.
Pressure Logic: Inspired by advanced ADL/Chaikin concepts, refined for volatility.
Flow Logic: Utilizing array-based weighted moving average mathematics (inspired by J. Ehlers and open-source Hull concepts) to achieve superior smoothness.
Originality: The unique contribution of this script is the algorithmic synthesis of these two disparate forces (Pressure vs Flow) and the visual language created to interpret their relationship instantly.
This tool is for educational purposes. Past performance of 'Flow' does not guarantee future results.

Market State & Candlestick Patterns Made in ChinaIndicator Overview
The Market State & Candlestick Patterns Master (MSCP-Master) is a comprehensive, all-in-one technical analysis indicator that combines real-time market state identification with multiple candlestick pattern recognition. This powerful tool not only identifies classic price action patterns but also adapts their significance based on the current market volatility environment, providing context-aware trading signals for smarter decision-making.
Core Innovation: Adaptive Pattern Recognition
Traditional candlestick pattern indicators work in isolation, often giving false signals in the wrong market conditions. MSCP-Master revolutionizes this approach by:
First assessing market state (Low Volatility/Ranging/High Volatility) through a multi-dimensional scoring system
Then applying different confirmation criteria for each pattern based on the detected market state
Finally providing context-aware signals that are more reliable because they consider the broader market environment
Three-Layer Analysis System
Layer 1: Market State Identification (The Foundation)
Uses four key metrics to calculate a comprehensive market state score:
ATR Relative Volatility: Measures current volatility against historical norms
Bollinger Band Width: Identifies contraction/expansion periods
Amplitude Analysis: Evaluates recent price range activity
Momentum Strength: Assesses directional movement power
Based on the composite score, the market is classified into:
🔵 Low Volatility: Tight ranges, potential for breakout
🟡 Ranging: Normal oscillation within established bounds
🟢 High Volatility: Wide ranges, strong momentum moves
Layer 2: Pattern Recognition With Context Adaptation
Each pattern uses different confirmation logic based on market state:
High Volatility State: Uses SMA-based trend confirmation (Long/Short SMA comparison)
Low Volatility/Ranging States: Uses ATR-adjusted threshold confirmation (dynamic based on current vs. baseline volatility)
This adaptive approach means patterns are only considered valid when they make sense for the current market environment.
Layer 3: Comprehensive Pattern Library
The indicator identifies 10+ critical candlestick patterns:
Engulfing Patterns (Bullish/Bearish) with Harami confirmation requirement
Outside Bars (Bullish/Bearish) with customizable engulfing criteria
False Breakouts (Bullish/Bearish) with sophisticated tracking of "trap" moves
Hammer/Inverted Hammer with ATR-adjusted significance thresholds
Doji Variations (Standard, Dragonfly, Gravestone) with precise mathematical definitions
Three Soldiers Method (Enhanced) with dual absolute/relative strength measurements
Enhanced Three Soldiers Method - Beyond Traditional Interpretation
Unlike traditional "Three White Soldiers/Black Crows" patterns that rely on simple visual recognition, our enhanced version introduces:
Quantifiable Strength Metrics: Each candle must meet customizable thresholds for both absolute price movement (%) and relative efficiency (close-to-open vs. total range)
Two Signal Types: Preparation signals (amber) for early warnings and True signals (green/red) for confirmed breakouts
Breakout Confirmation: "True signals" only trigger when price breaks above/below recent signal cluster extremes
Full Customization: All parameters adjustable to match your trading style and market conditions
Key Features
🎯 Context-Aware Signals: Patterns are validated differently in high vs. low volatility markets
📊 Real-Time Market State: Clear color-coded background shows current market conditions
🔍 Multiple Confirmation Methods: Uses both SMA trend-following and ATR-adjusted threshold approaches
⚙️ Fully Customizable: Every parameter adjustable across all pattern types and market state calculations
📈 Comprehensive Visualization: Color-coded labels, reference lines, and information tables
Strategic Application
Preparation Signals: Use amber "single candle" or "three candle" signals to prepare for potential moves
True Signals: Green/red "True" signals indicate confirmed momentum - ideal for main entries
Market State Alignment: Trade with the market's character - aggressive in high volatility, cautious in low volatility
Pattern Convergence: Look for multiple patterns confirming the same direction for higher probability setups
Parameter Groups (Organized for Easy Customization)
Market State Identification: ATR, Bollinger Band, Amplitude, Momentum parameters
Pattern-Specific Settings: Engulfing, Outside Bars, False Breakouts, Hammer/Doji patterns
Three Soldiers Method: Absolute/Relative strength thresholds, lookback periods
Confirmation Logic: SMA lengths, ATR adjustment factors, sensitivity settings

Beast Mode - ORB Indicator [Advanced Retest & Targets]Beast Mode - ORB Indicator
The Beast Mode - ORB Indicator is a comprehensive institutional trading system designed to automate the Opening Range Breakout (ORB) strategy. Unlike standard ORB indicators that simply draw high/low lines, this script integrates "Smart Retest" logic, dynamic risk/reward targets, and volume/volatility filters to help traders identify high-probability setups while filtering out chop and fake-outs.
This tool is designed for Futures (ES, NQ, YM) and Equities traders who rely on the initial market balance to determine the day's directional bias.
How It Works
The Opening Range is defined as the High and Low price established during the first X minutes of the market session (e.g., 5 minutes, 15 minutes). This range represents the initial battle between buyers and sellers.
1. The Range Formation: The script monitors the user-defined opening window (e.g., 9:30–9:35 AM ET). Once the window closes, it plots the ORB High (Green), ORB Low (Red), and Midline (Gray).
2. The Breakout: A signal is generated when a candle closes outside the defined range. This signal is filtered by volume (must be higher than average) and range quality (to avoid trading during extremely tight or over-extended ranges).
3. The Smart Retest (New Feature): Breakouts often fail. The most reliable entry is often the retest of the breakout level. This script uses a unique algorithm to detect valid retests:
- Tolerance: Price must return to within a specific point range of the ORB level.
- Rejection: Price must physically "bounce" away from the level by a minimum point value.
- Volume: The rejection candle must have significant volume to confirm institutional defense of the level.
Key Features
1. Dynamic Risk/Reward Targets
The indicator automatically projects profit targets based on the size of the Opening Range:
- Target 1 (💰): Placed at a 1:1 ratio relative to the range size. (e.g., If the range is 20 points, T1 is 20 points above the High).
- Target 2: A user-defined multiplier (default 2.0x) for extended trend days.
- Stop Loss Zones: Visual dotted lines indicating statistically significant stop-loss placement levels.
2. Smart Retest Logic
Instead of blindly buying a touch of the line, the script waits for confirmation. It looks for a "Checkmark" pattern: Breakout -> Pullback to Zone -> Rejection Bounce. Retest signals are marked with a distinct "RE" label.
3. Quality Filters
- Volume Filter: Ensures that breakout signals are backed by relative volume (RVOL) to avoid "low volume drift" fake-outs.
- Range Filter: Prevents signals if the Opening Range is too small (chop) or too large (exhaustion), based on point values.
4. Professional Dashboard
A data table displays real-time statistics:
- Status: Forming, Active, or Waiting.
- Range: The exact size of the opening range in points.
- Position: Current price relation to the ORB (Above/Below/Inside).
- Targets: Exact price levels for T1 and T2.
Settings & Configuration
- ORB Timeframe: Select between 5m PreMarket, 5m Standard, 15m, or 30m ranges.
- Trading Session: Define your active trading hours (signals are muted outside this window).
- Target Multiplier: Adjust the extension for the second target (e.g., 1.5x, 2.0x, 3.0x).
- Retest Specifics:
- Tolerance: How close price must get to the line to count as a test.
- Min Bounce: How hard price must reject to trigger a signal.
- Visuals: Fully customizable colors for lines, backgrounds, and labels.
Disclaimer
This indicator is a technical analysis tool intended to assist in identifying market structure and potential areas of interest. Past performance of the Opening Range Breakout strategy does not guarantee future results. Users should always manage risk appropriately and use this tool in conjunction with their own analysis.
Concepts based on standard institutional Opening Range Breakout theory.

GardFx - Fusion Pro FREE TrialFusion Pro - by GardFx
This script is a specialized session-trading system designed to capitalize on the Opening Range Breakout (ORB) by utilizing Fair Value Gaps (FVG) as entry confirmation zones. Unlike standard breakout indicators that signal immediately upon a range break, this system waits for a price retest (mitigation) of specific imbalances created during the breakout move.
Core Concept
The strategy operates on a three-step logic sequence:
Define the Range: It establishes the High and Low of the opening session (London or New York).
Identify Imbalance: Upon a breakout of this range, the script scans for the creation of a Fair Value Gap (FVG) on the 1-minute timeframe.
Confirm Entry: It waits for price to retrace into the FVG (mitigation) and looks for specific candle confirmation patterns before generating a signal.
Detailed Methodology
1. The Opening Range (ORB)
The script monitors the first 15 minutes of the session (configurable).
High Line: The highest price reached during the first 15m.
Low Line: The lowest price reached during the first 15m.
Breakout: A breakout is validated when a candle closes outside of this defined range.
2. Fair Value Gap (FVG) Detection
Shutterstock
Not all breakouts are valid. This script filters for momentum by requiring an FVG to form immediately following the breakout.
Bullish FVG: Defined when the Low of Candle 1 is higher than the High of Candle 3.
Bearish FVG: Defined when the High of Candle 1 is lower than the Low of Candle 3.
Note: If an FVG is not formed shortly after the breakout, the setup is considered low-probability and ignored.
3. Entry Confirmation Models Once an FVG is identified and price returns to mitigate it, the script offers three confirmation modes:
Instant (First Touch): Aggressive entry immediately when price touches the FVG box.
Reversal Close: Waits for a candle to close in the direction of the trend after touching the FVG (e.g., a green candle close after dipping into a bullish FVG).
Engulfing Candle: The most conservative filter. Requires a full engulfing candle pattern occurring within or bouncing off the FVG.
4. Advanced Filters To reduce false signals during choppy markets, two optional filters are included:
Volume Filter: Requires the breakout candle's volume to be higher than its Moving Average (multiplied by a user-defined factor).
Higher Timeframe (HTF) Trend: Checks the trend on a higher timeframe (e.g., 1H or 4H).
Logic: If the HTF Close is > HTF EMA 50, only Buy signals are permitted. If HTF Close < HTF EMA 50, only Sell signals are permitted.
5. Risk Management The script includes an automated Risk/Reward calculator.
Stop Loss (SL): Placed at the invalidation point of the FVG structure, plus an optional ATR buffer to account for volatility.
Take Profit (TP): Calculated based on a user-defined Risk:Reward ratio (e.g., 1:2) relative to the Stop Loss distance.
Dashboard A multi-timeframe dashboard is displayed to provide a "Glance View" of market bias across the Daily, 4H, 1H, and 15M timeframes, ensuring trades are aligned with macro momentum.
3 hours ago
Release Notes
🚀 GardFx - Fusion Pro V2: The Ultimate ORB & ICT Suite
Welcome to Version 2.0 of Fusion Pro. This update transforms the indicator from a simple breakout tool into a complete institutional trading system. We have integrated Multi-Timeframe (MTF) logic, Candlestick Pattern recognition, and Smart Exit management to filter out noise and catch high-probability moves.
🔥 NEW FEATURES IN V2:
1. 🧠 Smart MTF Bias & Voting System
No more guessing the trend. The script now checks Daily, 4H, 1H, and 15m timeframes.
Voting Logic: A trade is only signaled if the higher timeframes agree (e.g., 2 out of 3 votes).
Visuals: The dashboard displays the live bias for every timeframe.
2. 🎯 Advanced Entry Confirmations We have added specific trigger patterns to reduce fake-outs. You can now choose your entry style:
🦄 Unicorn Setup: ORB Level + FVG overlap.
🕯️ Candlestick Patterns: Pinbar, Engulfing, Tweezer Tops/Bottoms, and Inside Bar.
📉 FVG 50%: Wait for price to retrace to the 50% equilibrium of the gap before entering.
3. 🛡️ Entry Validation Modes Control exactly when the entry label fires:
Instant: Enters immediately upon touch.
Candle Close: Waits for the candle to close in your direction.
Break of High/Low: Places a pending order at the wick; only enters if momentum breaks that level.
Wait for MSS: Waits for a Market Structure Shift (local high/low break).
4. 💰 Dynamic Smart Exit (Secure TP)
A new Volume-Based Exit Manager detects sudden momentum shifts or volume spikes against your position.
It prints a "Secure TP" label to help you bank profits before a reversal occurs, even if the fixed TP hasn't been hit.
5. 📊 Enhanced Dashboard & Stats
Tracks Win/Loss rates separately for Asia, London, and New York sessions.
Weekly and Daily stats reset automatically.
Fully customizable size and position.
6. ⚡ Automated UK Sessions
Built-in timings for Asia, London, and New York based on UTC (London) time. No more timezone conversion headaches.

True S/R Ultimate [Wonra]# True S/R Ultimate - TradingView Description
## Short Description (for script settings)
```
Volume-weighted Support & Resistance levels with buyer/seller pressure analysis. Shows the strongest levels based on historical price reactions and trading volume.
```
## Full Description
```
█ OVERVIEW
True S/R Ultimate identifies genuine support and resistance levels by analyzing historical pivot points weighted by trading volume. Unlike traditional S/R indicators that draw lines everywhere, this indicator filters and displays only the strongest levels where significant trading activity occurred.
The indicator uses a multi-factor approach:
• Volume accumulation at each price level
• Number of times price has touched/reacted to the level
• Buyer vs Seller pressure ratio at each zone
█ HOW IT WORKS
The indicator detects pivot highs and lows across your specified lookback period. When multiple pivots occur near the same price, they are grouped together, and their volumes are accumulated. This creates "volume clusters" that represent areas where traders have historically found value.
LEVEL NAMING:
• S1, S2, S3... = Support levels (below current price), ranked by volume strength
• R1, R2, R3... = Resistance levels (above current price), ranked by volume strength
• S1/R1 = Strongest level with highest accumulated volume
• S5/R5 = Weakest displayed level
█ READING THE LABELS
Each level displays:
┌─────────────────────────────────┐
│ R2 │ 1,789 │ ← Level name + Price
│ Vol: 21.8M │ 🟢 BUY 64% │ ← Volume + Dominant pressure
└─────────────────────────────────┘
VOLUME (Vol):
Shows the total accumulated trading volume at this level. Higher volume = stronger level.
• K = Thousands (1K = 1,000)
• M = Millions (1M = 1,000,000)
• B = Billions (1B = 1,000,000,000)
PRESSURE INDICATOR:
• 🟢 BUY XX% = Buyers were dominant at this level (bullish pressure)
• 🔴 SELL XX% = Sellers were dominant at this level (bearish pressure)
• Percentage shows the strength of the dominant side
█ COLOR CODING
The indicator uses smart color coding based on WHO was in control at each level:
GREEN/TEAL ZONES (🟢 BUY pressure > 50%):
• Buyers were more aggressive when price hit this level
• For SUPPORT: Strong buy interest, likely to bounce again
• For RESISTANCE: May break through as buyers are willing to pay higher
RED ZONES (🔴 SELL pressure > 50%):
• Sellers were more aggressive when price hit this level
• For RESISTANCE: Strong selling pressure, likely to reject again
• For SUPPORT: Weaker support, may break down
█ HOW TO USE
SCENARIO 1: Price approaching GREEN Support (e.g., S1 with 🟢 BUY 76%)
✓ This is a HIGH-PROBABILITY bounce zone
✓ Previous touches showed strong buyer absorption
✓ Consider LONG entries with stop below the zone
SCENARIO 2: Price approaching RED Resistance (e.g., R1 with 🔴 SELL 71%)
✓ This is a HIGH-PROBABILITY rejection zone
✓ Previous touches showed strong seller distribution
✓ Consider SHORT entries with stop above the zone
SCENARIO 3: Price approaching GREEN Resistance (e.g., R2 with 🟢 BUY 64%)
⚠ This resistance may be WEAK
⚠ Buyers were aggressive here before - may break through
⚠ Wait for confirmation before shorting
SCENARIO 4: Price approaching RED Support (e.g., S3 with 🔴 SELL 72%)
⚠ This support may be WEAK
⚠ Sellers were aggressive here - may break down
⚠ Be cautious with long entries
█ WHY LEVELS ABOVE PRICE CAN BE GREEN
When you see a RESISTANCE level (above current price) colored GREEN:
• It means when price was previously AT that level, BUYERS were dominant
• This doesn't mean the level is now support
• It means if price revisits this zone, it might break THROUGH (not reject)
• The buying pressure from before suggests demand at that price
Conversely, when you see a SUPPORT level (below price) colored RED:
• Previous touches showed sellers were in control
• This support may be weaker than it appears
• Consider tighter stop losses if going long at this level
█ SETTINGS
📊 MAIN SETTINGS
• Lookback Bars: How far back to analyze (default: 500)
• Minimum Touches: Required reactions to form a valid level (default: 2)
• Zone Width: Tolerance for grouping similar prices (default: 1%)
• Pivot Length: Sensitivity for detecting pivots (default: 5)
🎨 DISPLAY
• Max Levels: How many S/R levels to show per side (default: 5)
• Show Zone Boxes: Visual boxes around each level
🎨 COLORS
• Bullish/Buyers: Color for buy-dominated zones
• Bearish/Sellers: Color for sell-dominated zones
█ BEST PRACTICES
1. Use on higher timeframes (4H, Daily) for stronger levels
2. Combine with other confluence (trendlines, EMAs, Fibonacci)
3. Watch for volume confirmation when price approaches a level
4. S1/R1 are your primary levels - trade these with more size
5. S4/S5 or R4/R5 may be weaker - use confirmation
█ ALERTS
The indicator includes built-in alert conditions:
• "Near Support" - Price approaching strongest support
• "Near Resistance" - Price approaching strongest resistance
█ CREDITS
Developed by Wonra
Concept: Volume Profile meets Smart Money Concepts
```
## Tags (for TradingView)
```
support, resistance, volume, levels, zones, institutional, smart-money, supply-demand, order-flow, volume-profile
```

Alpha Options System# Apex Options Sniper - Advanced Multi-Signal Day Trading System
## 🎯 Overview
**Apex Options Sniper** is a professional-grade, multi-signal trading indicator specifically engineered for high-probability day trading of weekly options. This comprehensive system combines 10+ technical indicators into a sophisticated scoring algorithm that identifies optimal entry points with institutional-level precision.
Perfect for traders of SPY, QQQ, and high-volume stocks, this indicator eliminates guesswork by providing clear BUY CALLS and BUY PUTS signals based on multiple technical confluences.
---
## 🚀 Key Features
### **Multi-Signal Confluence Engine**
- **10+ Technical Indicators** working in harmony
- **Weighted Scoring System** (0-30+ points) for signal strength
- **Real-time Signal Classification**: Strong vs Moderate signals
- **False Signal Reduction** through multi-confirmation requirements
### **Advanced Momentum Analysis**
- ✅ RSI with Divergence Detection (bullish & bearish)
- ✅ Stochastic Oscillator (oversold/overbought + crossovers)
- ✅ MACD with crossover and momentum confirmation
- ✅ Automatic divergence spotting for reversal trades
### **Sophisticated Trend Detection**
- ✅ Triple EMA System (9/21/50) with alignment scoring
- ✅ SuperTrend Indicator with trend flip alerts
- ✅ VWAP for institutional price levels
- ✅ Multi-timeframe trend confirmation
### **Professional Volume Analysis**
- ✅ Volume Spike Detection (vs 20-period average)
- ✅ OBV (On-Balance Volume) with divergence detection
- ✅ Order Flow Analysis (buy vs sell pressure)
- ✅ Relative volume ratio display
### **Advanced Pattern Recognition**
- ✅ Bollinger Band Squeeze detection (volatility expansion)
- ✅ BB breakout signals (major move initiation)
- ✅ Automatic Support & Resistance levels (pivot-based)
- ✅ Price reaction scoring at key levels
### **Built-in Risk Management**
- ✅ ATR-based Stop Loss calculations
- ✅ Customizable Risk:Reward ratios
- ✅ Position sizing recommendations
- ✅ Real-time profit target calculations
### **Comprehensive Visual Dashboard**
- ✅ Live scoring breakdown for all indicators
- ✅ Individual signal strength display
- ✅ Bull vs Bear score comparison
- ✅ Color-coded signal status
- ✅ Risk management metrics
---
## 📊 How It Works
### **Scoring System**
The indicator assigns points based on technical conditions:
| **Category** | **Max Points** | **Conditions** |
|-------------|---------------|----------------|
| Momentum (RSI/Stoch) | 8 | Oversold/overbought + divergences |
| MACD | 4 | Crossovers + momentum direction |
| Trend (EMAs) | 6 | EMA alignment + SuperTrend |
| Volume | 4 | Spikes + OBV divergences |
| Order Flow | 2 | Buy/sell pressure imbalance |
| Bollinger Bands | 2 | Squeeze + breakouts |
| Support/Resistance | 2 | Price at key levels |
| VWAP | 1 | Above/below institutional level |
### **Signal Thresholds**
- **🚀 STRONG CALLS**: Bull score ≥6, Net score ≥4
- **📈 CALLS**: Bull score ≥4, Net score ≥2
- **🔥 STRONG PUTS**: Bear score ≥6, Net score ≤-4
- **📉 PUTS**: Bear score ≥4, Net score ≤-2
### **Multi-Timeframe Filter**
Optional higher timeframe confirmation reduces false signals by ensuring the broader trend supports your trade direction.
---
## 🎮 How to Use
### **Installation**
1. Open TradingView Pine Editor
2. Paste the complete indicator code
3. Click "Add to Chart"
4. Customize settings to your preference
### **Recommended Settings**
**For SPY/QQQ Day Trading:**
- Timeframe: 1-minute or 5-minute
- Strong Signal Threshold: 6
- Moderate Signal Threshold: 4
- Multi-timeframe Confluence: ON
**For Individual Stocks:**
- Timeframe: 5-minute or 15-minute
- Increase SuperTrend multiplier to 3.5-4.0
- Enable all advanced features
**For Scalping:**
- Timeframe: 1-minute
- Use STRONG signals only (6+)
- Tight stop loss (1.0-1.5 ATR multiplier)
### **Best Trading Times**
- **9:30-11:00 AM EST** - Highest volume, strongest signals
- **2:00-4:00 PM EST** - Afternoon momentum plays
- Avoid 11:30 AM-1:30 PM EST (lunch chop)
---
## 📈 Signal Interpretation
### **What You'll See on Chart:**
**Visual Signals:**
- 🟢 **Green Triangle (CALLS)**: Bullish entry point
- 🟢 **Large Green Triangle (STRONG CALLS)**: High-confidence bullish entry
- 🔴 **Red Triangle (PUTS)**: Bearish entry point
- 🔴 **Large Red Triangle (STRONG PUTS)**: High-confidence bearish entry
- 💎 **Small Diamonds**: RSI/OBV divergences (reversal warning)
**Dashboard Information:**
- Individual indicator values and signals
- Real-time score breakdown
- Bull/Bear score totals
- ATR stop loss levels
### **Entry Rules:**
✅ **High Probability Trades (Take These):**
- Strong signal (6+ score)
- 3+ indicators confirming
- Volume spike present
- SuperTrend aligned
- Higher timeframe confirms
⚠️ **Moderate Trades (Smaller Position):**
- Moderate signal (4-5 score)
- 2+ indicators confirming
- Normal volume
- Mixed trend signals
❌ **Avoid These:**
- Conflicting signals (Bull score ≈ Bear score)
- Low volume
- During major news events
- Bollinger squeeze without breakout direction
---
## 🛡️ Risk Management Guide
### **Position Sizing:**
- **Strong Signals (6+)**: 3-5% of portfolio
- **Moderate Signals (4-5)**: 2-3% of portfolio
- **Low Conviction**: 1-2% or skip
### **Stop Loss Strategy:**
- Use ATR-based stops (displayed in dashboard)
- Default: 1.5x ATR from entry
- Weekly options: 30-50% premium loss maximum
- Never hold through stop loss hoping for recovery
### **Profit Targets:**
- **Quick Scalps**: 25-50% gain (15-30 min)
- **Day Trades**: 50-100% gain (same day exit)
- **Swing**: 100-200% gain (1-2 days max for weeklies)
- **Take partial profits** at first target, let rest run
### **Time Decay Management (Weekly Options):**
- Monday-Wednesday: Hold overnight acceptable on strong signals
- Thursday: Close by EOD unless very strong conviction
- Friday: Avoid holding overnight, theta decay accelerates
---
## 🔔 Alert Configuration
### **Recommended Alerts:**
**Essential Alerts:**
1. 🚀 Strong Buy Calls
2. 🔥 Strong Buy Puts
**Advanced Alerts:**
3. 💎 RSI Bullish Divergence
4. ⚠️ RSI Bearish Divergence
5. 🔶 Bollinger Band Squeeze
6. ✅ SuperTrend Bull Flip
7. ❌ SuperTrend Bear Flip
**Alert Setup:**
- Set frequency: "Once Per Bar Close"
- Enable for all devices
- Use webhook for automation (optional)
---
## 💡 Pro Trading Tips
### **Maximize Win Rate:**
1. **Wait for confluence** - Best trades have 3+ indicators aligned
2. **Respect the dashboard** - Check WHY it's signaling (which indicators)
3. **Volume is king** - Signals with volume spikes are significantly more reliable
4. **Use BB Squeeze** - When squeeze + signal = explosive directional move
5. **SuperTrend flips** - Major trend change confirmations, very powerful
6. **Watch for divergences** - Diamond markers = hidden reversal opportunities
### **Common Mistakes to Avoid:**
❌ Trading every signal (be selective)
❌ Ignoring volume (volume confirms everything)
❌ Fighting the higher timeframe trend
❌ Oversizing positions on moderate signals
❌ Holding weekly options too long (theta decay)
❌ Trading during lunch hour (11:30-1:30 EST)
### **Advanced Techniques:**
- **Divergence + Support/Resistance** = Highest probability reversals
- **BB Squeeze + EMA alignment** = Explosive trend continuations
- **SuperTrend flip + Volume spike** = Major trend change entries
- **Multiple timeframe analysis** - Check 5m signal on 1m chart for precision entries
---
## 📊 Indicator Components Explained
### **RSI (Relative Strength Index)**
- Measures momentum and overbought/oversold conditions
- Divergences signal potential reversals before they happen
- Score: 2-3 points for extremes and divergences
### **Stochastic Oscillator**
- Confirms momentum extremes
- Crossovers provide entry timing
- Score: 1-2 points
### **MACD (Moving Average Convergence Divergence)**
- Trend following momentum indicator
- Crossovers signal momentum shifts
- Score: 1-3 points based on signal strength
### **EMA System (9/21/50)**
- Dynamic support and resistance
- Alignment shows trend strength
- Price position relative to EMAs scores 1-2 points
### **SuperTrend**
- Volatility-based trend indicator
- Reduces whipsaws in choppy conditions
- Trend flips are major signals (2 points)
### **Bollinger Bands**
- Volatility measurement
- Squeeze = calm before the storm
- Breakouts = directional move initiation (2 points)
### **Volume Analysis**
- Confirms price movement legitimacy
- Spikes validate signals (2 points)
- OBV divergences predict reversals (2 points)
### **Order Flow**
- Buy vs sell pressure measurement
- Institutional footprint detection
- Score: 2 points for strong imbalances
---
## 🎓 Learning Path
### **Beginner (Week 1-2):**
- Use STRONG signals only
- Focus on high-volume stocks (SPY/QQQ)
- Trade only first hour of market
- Use paper trading first
### **Intermediate (Week 3-4):**
- Add moderate signals to your arsenal
- Learn to read the dashboard
- Understand why each signal triggers
- Start combining with support/resistance
### **Advanced (Month 2+):**
- Use divergence signals
- Trade BB squeeze breakouts
- Optimize settings for your style
- Develop your own confluence rules
---
## ⚙️ Customization Guide
### **Adjustable Parameters:**
**Momentum Settings:**
- RSI Length (default: 14)
- RSI Oversold/Overbought levels (30/70)
- Stochastic Length (14)
**Trend Settings:**
- EMA periods (9/21/50)
- SuperTrend ATR Length (10)
- SuperTrend Multiplier (3.0)
**Volume Settings:**
- Volume MA Length (20)
- Volume Spike Threshold (1.5x)
**Advanced Settings:**
- Bollinger Band Length (20)
- BB Standard Deviation (2.0)
- Pivot Lookback (10)
**Signal Thresholds:**
- Strong Signal Score (default: 6)
- Moderate Signal Score (default: 4)
**Risk Management:**
- ATR Length (14)
- Stop Loss Multiplier (1.5)
- Risk:Reward Ratio (2.0)
---
## 📈 Performance Optimization
### **For Volatile Markets (VIX > 25):**
- Increase SuperTrend multiplier to 4.0
- Raise signal thresholds (+1 point)
- Tighten stop losses (1.0-1.2 ATR)
### **For Ranging Markets:**
- Focus on RSI extremes and divergences
- Use BB squeeze signals
- Ignore moderate signals
- Wait for support/resistance confirmation
### **For Trending Markets:**
- Follow SuperTrend direction religiously
- Use EMA alignment signals
- Allow wider stops (2.0 ATR)
- Take partial profits, let winners run
---
## 🔍 Troubleshooting
**Too Many Signals:**
- Increase signal thresholds to 7/5
- Enable multi-timeframe filter
- Trade only STRONG signals
**Missing Signals:**
- Decrease thresholds to 5/3
- Disable multi-timeframe filter
- Check that all features are enabled
**Whipsaw in Choppy Markets:**
- Increase SuperTrend multiplier
- Require volume spike confirmation
- Avoid trading 11:30 AM-1:30 PM EST
---
## 🏆 Best Practices
✅ **Always check:**
1. Dashboard shows why signal triggered
2. Volume confirms the move
3. Not during news events
4. Adequate time until expiration
✅ **Risk Management:**
1. Never risk more than 2% per trade
2. Use stops religiously
3. Take profits at targets
4. Don't revenge trade
✅ **Journal Your Trades:**
1. Entry price and signal strength
2. Which indicators triggered
3. Exit price and profit/loss
4. What worked and what didn't
---
## 📞 Support & Updates
This indicator is designed to evolve with market conditions. Recommended to:
- Review settings monthly
- Backtest on your favorite instruments
- Adjust thresholds based on your risk tolerance
- Keep a trading journal to track performance
---
## ⚠️ Disclaimer
This indicator is a tool for technical analysis and should not be used as the sole basis for trading decisions. Options trading involves substantial risk and is not suitable for all investors. Past performance does not guarantee future results. Always:
- Do your own research and due diligence
- Never invest more than you can afford to lose
- Consider consulting with a financial advisor
- Practice with paper trading before using real money
- Understand options Greeks (Delta, Theta, Gamma, Vega)
- Be aware of earnings dates and major news events
**No indicator is 100% accurate. Use proper risk management and trade responsibly.**
---
## 📊 Version History
**v1.0 - Initial Release**
- Multi-signal confluence system
- 10+ technical indicators
- Advanced dashboard
- ATR-based risk management
- Comprehensive alert system
---
## 🎯 Final Thoughts
**Apex Options Sniper** transforms complex technical analysis into clear, actionable signals. By combining multiple proven indicators with sophisticated scoring logic, it helps traders identify high-probability setups while managing risk effectively.
**Success Keys:**
- Quality over quantity (be selective)
- Risk management is everything
- Volume confirms the signal
- Confluence increases probability
- Discipline beats emotion
**Trade smart. Trade with confidence. Trade with Apex Options Sniper.**
---
*For questions, suggestions, or to share your success stories, please comment below or send a message.*
**Happy Trading! 🚀📈**

Apex Trend & Liquidity Master V2.1The Apex Trend & Liquidity Master is a hybrid trading system designed to align traders with the dominant market trend while identifying key structural price levels. Unlike simple moving average crossovers or standalone support/resistance tools, this script integrates a volatility-adaptive "Trend Cloud" with a "Smart Liquidity" engine.
This integration allows the script to offer unique filtering capabilities, such as hiding counter-trend liquidity zones to reduce chart noise and focus on high-probability continuations.
How It Works
Adaptive Trend Cloud The backbone of the system is the Trend Cloud, calculated using a Hull Moving Average (HMA) base with ATR bands. The cloud expands and contracts based on market volatility.
Green Cloud: Bullish Regime. The market is trending up; look for long opportunities.
Red Cloud: Bearish Regime. The market is trending down; look for short opportunities.
Smart Liquidity Zones (with Integration) The script automatically detects Pivot Highs and Lows to draw Supply (Resistance) and Demand (Support) zones. These zones persist until price breaks through them (mitigation).
Integration Feature: A "Filter Zones by Trend" option is included in the settings. When enabled, this feature connects the Trend Cloud to the Liquidity Engine:
It will only display Demand zones when the Trend Cloud is Bullish.
It will only display Supply zones when the Trend Cloud is Bearish.
Note on Lag: Zones are based on pivots (default lookback: 10). A zone appears on the chart 10 bars after the pivot forms. These are historical structural levels.
Signal Filters Buy and Sell labels are generated when the Trend Cloud changes color, but they are filtered to ensure quality:
Volume Filter: Signals only appear if the current volume is higher than the 20-period average.
RSI Filter: Prevents buying when RSI is overbought (>70) or selling when oversold (<30).
Live HUD An on-chart dashboard provides real-time data on:
Trend Bias: Direction of the cloud.
Momentum: RSI strength (Weak/Neutral/Strong).
Volume: High vs. Low activity.
Usage Guide
Identify the Trend: Use the background fill color to determine if you should be looking for longs (Green) or shorts (Red).
Wait for Structure: Look for price to pull back into a "Smart Liquidity" zone. For example, in a Green Trend, wait for price to touch a Green Demand box.
Confirm with Momentum: Check the Dashboard. Ideally, you want to see "Strong" momentum aligning with your trade direction.
Settings: If the chart is too cluttered, enable "Filter Zones by Trend" in the settings menu to hide counter-trend boxes.
Credits & Attribution This script combines original integration logic with adapted open-source concepts:
Smart Liquidity Logic: The method for generating Supply/Demand boxes via Pivot Highs/Lows and array management is adapted from open-source logic commonly used in Smart Money Concepts (SMC) indicators, notably popularized by LuxAlgo and the broader Pine community.
Trend Logic: The volatility cloud utilizes standard Hull Moving Average (HMA) and ATR formulas.
Disclaimer This indicator is provided for educational and informational purposes only. It does not constitute financial advice. Past performance of pivot levels or trend signals does not guarantee future results.

Project AETHER v3.1 - The Chronos Interface [Ghost Edition]**Advanced price action indicator with Ghost Candles, Smart Zones, and Momentum-Based Entry Signals**
**Project AETHER v3.1: The Chronos Interface **
A sophisticated multi-layered trading system designed to identify high-probability entry points by combining structural analysis with momentum confirmation.
---
#### 🌟 KEY FEATURES
**Ghost Candle Technology**
- Hollow candles reveal the true nature of price action
- Color-coded visualization: Neon glow indicates strength, transparency shows absorption
- Instantly distinguish between impulse moves and liquidity traps
**Context-Aware Structure Analysis**
- Automatic detection of Market Structure Shifts (MSS)
- Break of Structure (BOS) identification with clean visual markers
- Narrative-based approach: Know when you're trading with or against the trend
**Counter-Attack Zones (Breaker Blocks)**
- Identifies potential reversal zones where trapped traders exist
- Semi-transparent boxes mark areas of interest
- Perfect for planning entries at key institutional levels
**Golden Pocket Integration**
- Dynamic support/resistance zones based on price swings
- Automatic pivot detection adapts to any timeframe
- Optional inverted zones for both bullish and bearish scenarios
**W Power Confirmation System**
- Proprietary momentum algorithm for signal validation
- Customizable sensitivity levels for different market conditions
- Filters out weak signals, highlights high-conviction entries
**Smart Signal Generation**
- ⚡ **GP LONG/SHORT**: Zone touch + momentum confirmation
- 🔄 **REVERSAL**: Rejection signals when price fails to hold zones
- Built-in cooldown prevents signal spam
- ATR-based label positioning for clean charts
---
#### ⚙️ CUSTOMIZATION
**Context Settings**
- Structure sensitivity adjustment
- BOS/MSS visualization toggle
**Defense (Breaker) Settings**
- Counter-attack zone visibility
- Volume and efficiency thresholds
**Golden Pocket Settings**
- Pivot detection length
- Bullish/Bearish zone toggles
- Signal cooldown period
- Normal and Reversal signal modes
- ATR-based reversal zone sizing
**W Power Settings**
- Enable/disable momentum filter
- Channel and average length tuning
- Custom level thresholds for long/short entries
- Precise control over signal sensitivity
---
#### 📈 BEST USE CASES
- **Swing Trading**: Identify key reversal zones
- **Scalping**: Quick entries with momentum confirmation
- **Trend Following**: Structure-based entries in direction of trend
- **Reversal Trading**: Catch failed breakouts with reversal signals
---
#### 💡 HOW TO USE
1. **Add indicator to chart** - Ghost candles will automatically overlay
2. **Watch for structure** - Green/Red backgrounds show bullish/bearish bias
3. **Wait for zone touches** - Price approaching golden zones
4. **Confirm with momentum** - ⚡ or 🔄 signals appear when conditions align
5. **Manage trades** - Use zone boundaries for stop-loss placement
---
#### ⚠️ DISCLAIMER
This indicator is for educational purposes only. Trading involves risk of loss. Past performance is not indicative of future results. Always use proper risk management and never risk more than you can afford to lose.
---
#### 🔄 VERSION HISTORY
**v3.1 - Ghost Edition**
- Complete visual overhaul with Ghost Candle technology
- Added W Power momentum confirmation system
- Improved GP zone detection
- Added Reversal signal mode
- Enhanced signal timing with Touch & Wait system
- ATR-based label positioning
- Multiple cooldown mechanisms
---
**Tags**: `price-action` `momentum` `reversal` `support-resistance` `swing-trading` `scalping` `structure` `breaker-blocks` `smart-money`

KINETIC GOLD NQ Velocity Breakout [Ash_TheTrader]
🚀 Stop Guessing. Start Scalping with Physics.
Introducing the KINETIC GOLD NQ ⚡ VELOCITY BREAKOUT System
Author: Ash_TheTrader
Assets: Gold (XAUUSD), Nasdaq (US100), Bitcoin (BTC)
Style: High-Frequency Scalping (M1/M5)
---
🛑 The Problem: Why Most Indicators Fail
You’ve been there. The RSI says "Oversold," so you buy. But price keeps crashing. The Moving Average crosses over, so you enter. But the trend is already over.
Why? Because those indicators are lagging . They tell you what happened 10 candles ago.
⚡ The Solution: The "Physics" of Price
Markets move like objects in the real world. They have Velocity (Speed) and Momentum (Mass).
The Kinetic Velocity Breakout (KMB) system doesn't look at "Overbought" or "Oversold." It looks for FORCE .
It answers one simple question: Is the market moving fast enough to pay me?
---
🧠 The 4 "Smart Logic" Features
1. The Velocity Speedometer 🏎️
Most candles are "noise." This system ignores them. It uses a Normalized Volatility Engine to detect when price hits "WARP SPEED".
• Blue: Slow (Cruising). Don't touch.
• Yellow: Accelerating. Get ready.
• Red: WARP SPEED. Institutional money is entering.
2. The 1.5x Impulse Rule 💥
The algorithm strictly enforces the "1.5x Law." A signal ONLY fires if the breakout candle is 1.5 times larger than the average of the last 3 candles.
• Result? No more fakeouts. We only trade real expansions.
3. "Smart Mode" AI Dashboard 🖥️
A heads-up display (HUD) lives on your chart, auto-detecting your trading environment:
• Auto-Session: Tells you if you are in London, New York, or Asia.
• Risk Mode: Shows if you are using "Aggressive" or "Normal" logic.
• Status: Gives you a text readout like "READY ⚡" or "WAIT..."
4. Auto-Pilot Risk Management 🛡️
Scalping is fast. You don't have time to calculate Pips.
• The script draws the lines for you.
• As soon as a "ROCKET" signal appears, a Green TP Line (2x Reward) and Red SL Line appear instantly.
---
🎮 How to Trade: The 3-Step "Kinetic" Strategy
This strategy is designed for Gold (XAUUSD) and Nasdaq (US100) on the 5-Minute Timeframe .
Step 1: The "Yellow" Warning ⚠️
Watch the Smart Structure Lines (Dashed Lines).
• If the candles turn Yellow or the Dashboard says "FAST" , wake up.
• This means pressure is building against a key level.
Step 2: The "Warp" Trigger 🚀
Wait for a Confirmed Breakout . You are looking for:
1. A candle closes OUTSIDE the dashed structure line.
2. The candle color is NEON CYAN (Bullish) or NEON MAGENTA (Bearish).
3. The Signal Label appears: "ROCKET" (Buy) or "DROP" (Sell).
👉 Rule: No Label? No Trade. The 1.5x Logic saves you from bad trades.
Step 3: The Execution 💰
1. Enter at the close of the signal candle.
2. Stop Loss: Place it exactly on the Red Line provided by the indicator.
3. Take Profit: Place it on the Green Line .
4. Walk away. Let the physics work.
---
⚙️ Customizing Your Style
The script comes with two built-in "Personalities":
🛡️ Normal Scalper (Default)
• Best for: New traders, Funded Accounts.
• Logic: Waits for strong confirmation. High Win Rate.
• Risk: 1:2 Risk/Reward.
⚠️ QuickScalper (Aggressive)
• Best for: Gold M1, Volatility Hunters.
• Logic: Enters earlier on 1.2x Impulse. More signals, faster exits.
• Risk: 1:1.5 Risk/Reward (Grab the cash and go).
---
👇 Get the Code
Search for: KINETIC ⚡ in the TradingView library.
"Markets are physics. Trade the Velocity, not the noise." — @Ash_TheTrader

TuxAlgo Plus a SMC and Trap Toolkit V0.98r1 by McTogaThe “TuxAlgo Plus” script is a powerful, standalone, conceptual open-source project and self-sufficient “smart money toolkit” with automatic trap detection (SMT), liquidity grabs, FVG confluence, and complete bot setup signals for TV charts in the “H1 to H6” time frame and daily charts.
The script is used to improve SMC/trap analyses, i.e., the structure and visualization logic for TradingView charts have been expanded in the “TuxAlgo++” project in line with Smart Money Concepts (SMC) and Smart Money Traps (SMT).
The SMT block (“Smart Money Traps”) supplements classic smart money concepts with:
1. Detection of bull traps (short setups) and bear traps (long setups)
2. Display of trap boxes in the chart (liquidity grab areas)
3. A bot setup box (table) with ready-made entry/SL/TP levels:
as well as age in bars & days and “Valid until ~X d” (remaining term)
SMT / bot setup only run on the following timeframes:
- H1, H2, H3, H4, H6 This means that traps, labels, and the bot setup box are only displayed on these timeframes
Trap definition “Bull Trap (Short Setup)”:
- Valid swing high
- Swing trend bullish
- High (Wick) pierces above the swing high (Liquidity Grab)
- Close falls back below the swing high (false breakout)
-> Result: Short setup (bull trap), marked in orange
Trap definition “Bear Trap (long setup)”:
- Valid swing low
- Swing trend bearish
- Low (wick) pierces below the swing low (liquidity grab)
- Close rises above the swing low again (false breakout)
-> Result: Long setup (bear trap), marked in blue
Entry / SL / TP calculation
A price range is taken for each trap:
Bull trap (short):
- Range =
- Entry = point within this range:
Entry = hiBT - (hiBT - loBT) * TrapEntryRatio (0..1)
-> 0.0 = at the Wick extreme, 0.5 = middle, 1.0 = at the Swing level
- SL = Wick extreme (upper edge of the trap)
- Risk = |Entry - SL|
- TP1 = Entry - R1 * Risk
- TP2 = Entry - R2 * Risk
Bear Trap (Long):
- Range =
- Entry analogous within the range according to TrapEntryRatio
- SL = wick bottom (lower edge of the trap)
- Risk = |Entry - SL|
- TP1 = Entry + R1 * Risk
- TP2 = Entry + R2 * Risk
R1 / R2 correspond to the inputs:
- botRR1Input = TP1 Risk/Reward (e.g., 1.5R)
- botRR2Input = TP2 Risk/Reward (e.g., 3.0R)
Age & Validity
Each trap stores:
- lastTrapBarIndex -> last bar of the trap
- Age in bars -> bar_index - lastTrapBarIndex
- Age in days (~d) -> AgeBars * BarDurationInDays (depending on TF)
Input: trapMaxAgeBars determines how long a trap is valid.
The bot setup box is only displayed if:
- a trap is present,
- AgeBars <= trapMaxAgeBars,
- SMT + Box + SMC timeframe are active.
Color logic (color blind friendly):
- Blue (accentBlue) = fresh traps (Age <= 1/3 MaxAge)
- Orange (accentOrange) = medium age
- Violet (accentPurple) = old, but still within MaxAge
- Gray (accentGray) = expired (> MaxAge)
The box also shows “Valid until ~X d” as the remaining term.
Day/Night Mode & Colors
- chart.bg_color is used to detect dark or light mode.
- Text/background colors adjust (light/dark).
- Accent colors (blue/orange/purple/gray) are suitable for red/green color blindness.
- Trap labels in the chart:
- Bull trap label = orange (short setup)
- Bear trap label = blue (long setup)
- Text color depends on chart mode (dark/light)
Typical workflow (example):
1. Select a suitable symbol & SMC timeframe (e.g., H4 or H6).
2. Wait for a bull trap (short) or bear trap (long).
3. Read in the bot setup box:
- Direction (long/short)
- Entry, SL, TP1, TP2
- Age & “Valid until ~X d”
4. These values can be used as a template for manual trading or external bot/order systems.
5. Position size & leverage must always be calculated separately in your own risk management
(e.g., 2% rule). This script does not calculate position sizes.

Cosmic Crypto Golden ZoneCosmic Crypto Golden Zone
## Overview
**Cosmic Crypto Golden Zone** is an all-in-one swing trading indicator designed to identify high-probability retracement entries using Fibonacci levels, multi-timeframe confluence, and a simple Buy/Sell scoring system. The indicator removes the guesswork from trading pullbacks by combining structure analysis, momentum indicators, and volume confirmation into a single, easy-to-read signal.
**Best Used For:** Swing trading on 15m, 1H, and 4H timeframes in crypto, forex, and stocks.
---
## Key Features
### 🎯 Golden Zone Detection
Automatically identifies the optimal entry zone (0.5 - 0.786 Fibonacci retracement) where price is most likely to reverse and continue the trend.
### 📊 Buy/Sell Scoring (1-10)
A simplified signal table that scores setups from 1-10, telling you exactly when to buy or sell without needing to interpret multiple indicators.
### 📈 Multi-Timeframe Confluence
Filters trades to align with the higher timeframe trend (default: 4H), ensuring you only trade in the dominant direction.
### 🔍 Structure Detection (HH/HL/LH/LL)
Tracks market structure with Higher Highs, Higher Lows, Lower Highs, and Lower Lows to determine trend direction.
### 💧 Liquidity Sweep Detection
Identifies when price sweeps beyond the 0.886 level (stop-hunting zone) and reclaims the entry zone—a premium reversal signal.
### 📉 RSI Divergence Detection
Spots bullish and bearish divergences within the golden zone for additional confirmation.
### 🛡️ Dynamic Stop Loss
ATR-based stop loss that adjusts to current volatility, protecting you in both calm and volatile markets.
### 🎯 Smart Take Profit
Calculates TP based on your chosen entry point (FOMO, ENTRY, or Average) with customizable Risk:Reward targeting.
---
## How to Read the Signal Table
The table in the bottom-right corner gives you everything you need at a glance:
| Row | What It Shows |
|-----|---------------|
| **BUY/SELL + Score** | Direction and strength (1-10) |
| **Action** | 🚀 NOW (8+), ✓ READY (6-7), 👀 WATCH (4-5), ⏳ WAIT (<4) |
| **Zone** | Whether price is IN the golden zone or waiting |
| **Entry / TP / SL** | Your exact trade levels |
| **R:R** | Risk-to-Reward ratio with quality indicator |
### Score Breakdown
| Score | Meaning | Action |
|-------|---------|--------|
| **8-10** | High conviction setup | Enter on next candle close |
| **6-7** | Good setup | Enter with confirmation candle |
| **4-5** | Possible setup | Wait for more confluence |
| **1-3** | Weak/No setup | Skip this trade |
---
## How to Use: Step-by-Step
### Step 1: Check the Trend Direction
Look at the **Structure** in the info display:
- **BULLISH** (HH + HL pattern) → Only look for BUY signals
- **BEARISH** (LL + LH pattern) → Only look for SELL signals
### Step 2: Wait for Price to Enter the Golden Zone
The golden zone is highlighted between the **FOMO (0.618)** and **ENTRY (0.786)** levels. The table will show "✓ IN ZONE" when price reaches this area.
### Step 3: Check Your Score
Wait for the Buy/Sell score to reach **6 or higher** before considering an entry. Higher scores = higher probability.
### Step 4: Look for Confirmation
The best entries have multiple confirmations:
- ✅ Score 6+
- ✅ In Golden Zone
- ✅ Stochastic oversold/overbought
- ✅ RSI Divergence (DIV label)
- ✅ Liquidity Sweep (LIQ label) — *Premium signal*
- ✅ Bullish/Bearish candle pattern
### Step 5: Execute the Trade
Use the levels shown on the chart and in the table:
- **Entry:** FOMO (aggressive) or ENTRY (conservative)
- **Stop Loss:** Below/above the SL line (red)
- **Take Profit:** At the TP line (green)
---
## Chart Labels Explained
| Label | Color | Meaning |
|-------|-------|---------|
| **FOMO: ** | Green | 0.618 Fib - Aggressive entry level |
| **ENTRY: ** | Yellow (Bold) | 0.786 Fib - Conservative entry level |
| **LIQ: ** | Red | 0.886 Fib - Liquidity/stop-hunt zone |
| **TP: ** | Green | Take Profit target |
| **SL: ** | Red (Bold) | Stop Loss level |
| **R:R ** | Green/Orange | Risk-to-Reward ratio |
| **HH/HL/LH/LL** | Various | Structure swing labels |
| **DIV** | Lime/Pink | RSI Divergence detected |
| **LIQ** (arrow) | Lime/Red | Liquidity sweep signal |
| **AE** | Green/Red | Williams Vix Fix Aggressive Entry |
| **B/S** | Green/Red | Buy/Sell signal with score |
---
## Recommended Settings
### For Crypto (BTC, ETH, Altcoins)
- **Timeframe:** 1H or 4H
- **HTF:** 4H or Daily
- **Use Logarithmic Fibs:** ✅ ON
- **TP R:R Target:** 2.0 - 3.0
### For Forex
- **Timeframe:** 15m or 1H
- **HTF:** 4H
- **Use Logarithmic Fibs:** ❌ OFF
- **TP R:R Target:** 1.5 - 2.0
### For Stocks
- **Timeframe:** 1H or Daily
- **HTF:** Daily or Weekly
- **Use Logarithmic Fibs:** ✅ ON
- **TP R:R Target:** 2.0
---
## Settings Reference
### Structure (ZigZag)
- **Left Bars:** Lookback period for pivot detection (default: 10)
- **Right Bars:** Confirmation bars (default: 2)
- **Show Swing Labels:** Display HH/HL/LH/LL markers
### Multi-Timeframe Confluence
- **Enable MTF Filter:** Only trade when aligned with HTF trend
- **Higher Timeframe:** The timeframe to check trend (default: 4H)
### ADX Trend Strength
- **Enable ADX Filter:** Filter out choppy/ranging markets
- **ADX Threshold:** Minimum ADX value for trend confirmation (default: 20)
### Auto Fib Settings
- **Use Logarithmic Fibs:** Better for large % moves (crypto/stocks)
- **Fib Length:** How far the fib lines extend
### Split-Entry Trade Planner
- **Entry 1 Ratio:** FOMO level (default: 0.618)
- **Entry 2 Ratio:** ENTRY level (default: 0.786)
- **TP Calculation Mode:** Base TP on ENTRY, FOMO, or Average
- **TP R:R Target:** Your desired risk-to-reward ratio
- **Use ATR-Based Dynamic SL:** Volatility-adjusted stop loss
- **SL ATR Multiplier:** How many ATRs below entry for SL
### Williams Vix Fix
- **Show Bullish/Bearish AE:** Aggressive entry signals based on volatility extremes
- **Only Show in Golden Zone:** Filter VixFix signals to golden zone only
---
## Pro Tips
### 1. The Liquidity Sweep is Gold
When you see the **LIQ** arrow after price wicks below 0.886 and reclaims 0.786, this is often the best entry. Stops have been hunted, weak hands are out, and smart money is entering.
### 2. Don't Fight the HTF Trend
If the 4H is bearish, don't take long signals on the 15m just because the score is high. Always align with the bigger picture.
### 3. Wait for "IN ZONE"
Patience pays. The best setups come when price actually pulls back to the golden zone. Chasing breakouts leads to poor R:R.
### 4. Score 6+ is the Minimum
Scores of 4-5 can work, but your win rate will be significantly higher waiting for 6+. Scores of 8+ are rare but highly reliable.
### 5. Use Multiple Timeframes
Check the setup on your trading timeframe AND one timeframe higher. If both show bullish structure with good scores, confidence is higher.
### 6. Respect the Stop Loss
The SL is placed below the liquidity zone for a reason. If price closes below it, the setup is invalidated. Don't move your stop.
---
## Alerts Available
- **High Confluence Long/Short** — When score reaches your threshold
- **Bullish/Bearish Liquidity Sweep** — Premium reversal signal
- **RSI Divergence Detected** — Divergence in golden zone
- **Williams Vix Fix AE** — Aggressive entry signal
---
## Credits
Created by **Cosmic Crypto**
Combines concepts from:
- Fibonacci Retracement Trading
- Smart Money Concepts (Liquidity Sweeps)
- Williams Vix Fix
- Multi-Timeframe Analysis
- Stochastic RSI
- ADX Trend Strength
---
*Trade responsibly. Past performance does not guarantee future results. Always use proper risk management.*

Trend + Liquidity Master Trend & Liquidity Master
A Professional All-in-One Trading System combining Dynamic Trend Analysis with Smart Money Liquidity Zones
---
## 🎯 Overview
The Trend & Liquidity Master is a comprehensive trading indicator that merges institutional-grade trend detection with smart money liquidity mapping. Designed for traders who want to align with market structure while identifying high-probability entry zones, this system provides clear visual signals backed by multi-layered confirmation filters.
## ⚡ Core Features
### 📊 **Adaptive Trend Cloud**
- Multi-Algorithm Support: Choose between EMA, SMA, HMA, or RMA for trend calculation
- Volatility-Based Bands: Dynamic ATR bands that expand/contract with market conditions
- Anti-Chop Filter: Maintains trend state during consolidation to reduce false signals
- Visual Clarity: Color-coded cloud system (Green = Bullish, Red = Bearish - customisable)
### 🧱 **Smart Liquidity Zones**
- Supply & Demand Boxes: Automatically identifies institutional support/resistance levels
- Pivot-Based Detection: Uses swing high/low analysis to map liquidity pools
- Dynamic Mitigation: Zones auto-delete when price invalidates them
- Clean Visual Design: Semi-transparent boxes that don't clutter your chart
### 🎯 **Multi-Filter Signal System**
- Volume Confirmation: Optional filter to ensure signals occur on above-average volume
- RSI Screening: Avoid overbought buys and oversold sells (toggleable)
- Trend Alignment: Signals only trigger on confirmed trend changes
- Clear Entry Labels: BUY/SELL markers appear directly on the chart
### 🖥️ **Professional HUD Dashboard**
Real-time market intelligence display showing:
- Trend Bias: Current market direction (Bullish/Bearish)
- Momentum Status: Strength classification (Strong/Neutral/Weak)
- Volume State: Current volume relative to average (High/Low)
- Customizable Position & Styling: Place anywhere on your chart
---
## 🛠️ Customization Options
### **Trend Engine**
- Adjustable MA type and length
- Volatility multiplier for band sensitivity
- Source selection (Close, Open, HL2, etc.)
### **Liquidity Detection**
- Pivot lookback period (sensitivity control)
- Zone extension bars
- Toggle zones on/off independently
### **Signal Filters**
- Enable/disable volume filter
- Enable/disable RSI filter
- Fine-tune to match your trading style
### **Visual Design**
- Custom colors for bullish/bearish/neutral states
- Candle coloring option
- Dashboard styling and positioning
- Adjustable text and UI sizing
---
## 📈 How to Use
1. Identify the Trend: Wait for price to break above the upper band (Bullish) or below the lower band (Bearish)
2. Watch for Signals: BUY labels appear when trend turns bullish with confirmation; SELL labels for bearish turns
3. Confirm with Liquidity: Use Supply/Demand zones as potential entry refinement or profit targets
4. Monitor the HUD: Check momentum and volume states for additional confluence
5. Set Alerts: Built-in alert conditions for automated notifications
---
## 💡 Best Practices
- **Higher Timeframes**: Works best on 15m+ charts for reduced noise
- **Trend Following**: This is a trend-following system—avoid counter-trend trades
- **Multiple Confirmations**: Combine signals with liquidity zones for highest probability setups
- **Risk Management**: Always use proper position sizing and stop losses
---
## 🔔 Alert System
Pre-configured alerts for:
- Long entry signals (Apex Buy Alert)
- Short entry signals (Apex Sell Alert)
- Automatic ticker symbol insertion
---
## 📝 Notes
- Maximum 50 boxes and lines for optimal performance
- Liquidity zones automatically manage themselves (old zones removed)
- All components can be toggled independently
- Compatible with all markets (Forex, Crypto, Stocks, Indices)
---
## 🎨 What Makes This Different?
You get the best of both worlds: smart money zones that show where liquidity sits, combined with clear trend signals that tell you when to act.
---
Ready to trade with institutional-grade market intelligence? Add the Trend & Liquidity Master to your chart today.
---
*Disclaimer: This indicator is for educational and informational purposes only. Past performance does not guarantee future results. Always conduct your own analysis and practice proper risk management.*

UT3T Stratejisi (Ugur Tufan Trend ve Trade Takip Stratejisi)UT3T Strategy (Trend & Trade Tracking System)
UT3T Strategy is a comprehensive, hybrid trading system designed to capture both long-term trends and short-term trade opportunities. It combines smart cost averaging (DCA), dynamic profit-taking, and Fibonacci-based trade levels into a single, powerful indicator.
This script is ideal for traders looking for a structured approach to managing positions in both trending and ranging markets.
Key Features:
Dual Strategy Engine:
Strategy 1 (Trend Following): Uses EMA crossovers (EMA9/EMA50) to identify trend direction. It includes a smart DCA (Dollar Cost Averaging) mechanism labeled as ADD-LONG to optimize entry prices during corrections.
Strategy 2 (Trade Tracking): Utilizes custom Fibonacci channels to identify potential reversal zones (LONG / SHORT) based on price action and support/resistance levels.
Smart Position Management:
Dynamic Take Profit (TP): Offers an optional "Progressive TP" mode where profit targets increase by 50% after each successful hit (e.g., 10% -> 15% -> 22.5%), allowing you to ride strong trends.
Custom Exit Logic: The SHORT signal is triggered only if a minimum profit threshold (defined by the user) is met, preventing premature exits in small pullbacks.
Visual Clarity:
Clear Labels: Distinguishes between initial entries (LONG) and averaging entries (ADD-LONG) directly on the chart.
Alert System: Includes a fully customizable alert system for every signal type (Trend Entry, DCA, Stop Loss, Take Profit, and Fib Levels).
How to Use:
Symbol Settings: Input your preferred tickers and customize TP/Cost percentages in the settings menu.
Fib Levels: Define custom High/Low prices for Strategy 2 to generate Fib channels automatically.
Alerts: Set alerts based on your trading style (Per Bar Close for trends, Once Per Bar for TP levels).

Vector Trinity III: Flow [CVD]**1. Introduction: The Truth Serum**
This indicator is **Part 3** of the "Vector Trinity" trading system. It is the final validator in the decision-making process.
While Part I defines the *Structure* and Part II identifies the *Impulse*, **Part III (Flow)** answers the most critical question in trading: **"Is there real money behind this move?"**
It represents the **Energy Dimension**, analyzing the Cumulative Volume Delta (CVD) to spot true breakouts and expose traps.
* **I: Structure:** Spatial boundaries.
* **II: Impulse:** Momentum timing.
* **III: Flow:** **Capital validation & Divergence detection (Current Indicator).**
**2. Core Logic: CVD Estimation**
True "Delta" requires tick-by-tick data, which is often unavailable or premium-locked. **Vector Trinity III** uses a sophisticated **Intrabar Position Estimation** algorithm to mathematically approximate buying vs. selling pressure:
* **The Math:** It analyzes where the Close sits relative to the High and Low of the candle.
* Close near High = Dominant Aggressive Buying.
* Close near Low = Dominant Aggressive Selling.
* **The CVD:** It accumulates these delta values over time to create a continuous "Flow" line. This reveals the long-term intent of smart money.
**3. The Trend Line & Divergence**
The indicator features a **Grey Trend Line** (EMA of CVD) which serves as the baseline for "Net Flow."
* **Teal Zone (Above Trend):** Net Inflow. Capital is aggressively entering the market, supporting the price.
* **Maroon Zone (Below Trend):** Net Outflow. Capital is leaving the market, suggesting weakness.
**4. The "Trap" Detector (Divergence)**
The primary superpower of this indicator is spotting **Divergences**:
* **The Bull Trap (Fakeout):** Price makes a Higher High, but CVD makes a Lower High (or trends down).
* *Meaning:* The price is rising due to a lack of liquidity, not aggressive buying. **Smart money is selling into the rally.**
* **The Bear Trap (Shakeout):** Price makes a Lower Low, but CVD makes a Higher Low.
* *Meaning:* Smart money is absorbing the selling pressure (buying the dip).
**5. How to Use**
* **The "Trinity" Confirmation:** Before taking a trade based on Part I (Structure) and Part II (Impulse), look at Part III.
* **For a Long Setup:**
1. Price breaks the Structure (Part I).
2. Momentum fires Green/Cyan (Part II).
3. **Flow (Part III) MUST be Teal and rising.**
* **The Veto Rule:** If Price breaks up, but Flow is Maroon/Falling, **CANCEL the trade**. It is likely a trap.
**Settings:**
* **Trend Length:** 20 (Standard trend baseline to determine Net Inflow/Outflow).
---
### **中文说明**
**1. 简介:市场的“测谎仪”**
本指标是“矢量三位一体”交易系统的 **第三部分**。它是决策过程中最后的验证者。
第一部分 (Structure) 定义了结构,第二部分 (Impulse) 识别了脉冲,而 **第三部分 (Flow)** 则回答了交易中最关键的问题:**“这波行情背后有真钱吗?”**
它代表了系统的 **能量维度**,通过分析累积成交量 Delta (CVD) 来识别真正的突破并揭露市场陷阱。
* **I: Structure 结构:** 空间边界。
* **II: Impulse 脉冲:** 动能时机。
* **III: Flow 流向:** **资金验证与背离侦测(本指标)。**
**2. 核心逻辑:CVD 估算算法**
真正的“Delta”数据通常需要逐笔成交数据 (Tick Data),这往往需要付费数据源。**Vector Trinity III** 使用了一套精密的 **K线内相对位置估算 (Intrabar Position Estimation)** 算法,在数学上逼近真实的买卖压力:
* **算法原理:** 它分析收盘价在 K 线最高价和最低价之间的相对位置。
* 收盘接近最高价 = 主动买入主导。
* 收盘接近最低价 = 主动卖出主导。
* **CVD (累积值):** 它将这些 Delta 值随时间累积,形成一条连续的“资金流向”线。这揭示了主力资金的长期意图。
**3. 趋势线与背离**
指标包含一条 **灰色趋势线** (CVD 的均线),作为“净流量”的基准。
* **青色区域 (趋势线上方):** 净流入。资金正在积极入场,支撑价格上涨。
* **深红区域 (趋势线下方):** 净流出。资金正在撤离市场,暗示行情虚弱。
**4. “陷阱”侦测器 (背离)**
本指标的核心超能力是识别 **背离 (Divergence)**:
* **多头陷阱 (诱多/假突破):** 价格创出新高,但 CVD 却创出新低(或趋势向下)。
* *含义:* 价格上涨是因为缺乏流动性(空涨),而不是因为有主动买盘。**主力资金正在借反弹出货。**
* **空头陷阱 (诱空/洗盘):** 价格创出新低,但 CVD 却在抬高。
* *含义:* 主力资金正在吸收抛压(在此位置吸筹)。
**5. 使用方法**
* **“三位一体”共振验证:** 在根据第一部分 (结构) 和第二部分 (脉冲) 开单之前,必须查看第三部分。
* **做多设置:**
1. 价格突破结构 (Part I)。
2. 动能点火变绿/青色 (Part II)。
3. **资金流 (Part III) 必须呈现青色且向上攀升。**
* **一票否决权:** 如果价格向上突破,但资金流是深红色/下降的,**立即取消交易**。这极大概率是一个陷阱。
**参数设置:**
* **Trend Length (趋势周期):** 20 (用于确定净流入/流出的标准基准线)。
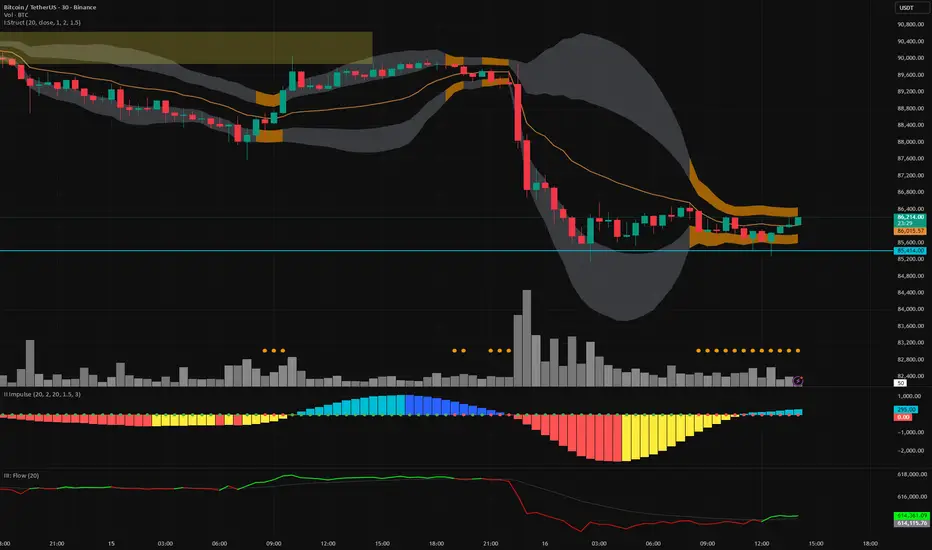
Kinetic Scalper [BULLBYTE]KINETIC SCALPER - ADVANCED MOMENTUM & CONFLUENCE TRADING SYSTEM
A SOPHISTICATED MULTI-FACTOR ANALYSIS INDICATOR FOR PRECISION ENTRIES
The Kinetic Scalper is a comprehensive trading analysis tool that combines volume-weighted momentum calculations, multi-oscillator divergence detection, and a proprietary 15-factor confluence scoring system to identify high-probability reversal setups across all timeframes.
WHAT MAKES THIS INDICATOR ORIGINAL
This is NOT a simple mashup of existing indicators.
The Kinetic Scalper features a completely custom momentum engine called the "Kinetic Pulse" - a volume-weighted momentum oscillator with Fisher Transform normalization that fundamentally differs from standard RSI or other momentum indicators. Every component feeds into a unified algorithmic framework designed specifically for this system.
KEY INNOVATIONS:
KINETIC PULSE ENGINE
Unlike standard RSI which uses simple price changes, the Kinetic Pulse applies:
→ Volume weighting to price movements (high-volume moves carry more weight)
→ EMA smoothing instead of traditional SMA (faster response to changes)
→ Fisher Transform normalization for improved signal clarity
→ Adaptive period adjustment based on current volatility regime
→ Result: A momentum oscillator that responds to conviction, not just price noise
15-FACTOR CONFLUENCE SCORING SYSTEM
Every signal is graded based on the number of confirming factors present:
→ Momentum position (oversold/overbought extremes)
→ Momentum velocity (direction change confirmation)
→ Momentum acceleration (strength of reversal)
→ Multi-oscillator divergence (price vs. 3 oscillators)
→ Volume confirmation (above-average participation)
→ Volume delta analysis (buying vs. selling pressure)
→ Higher timeframe alignment (trend confirmation from larger timeframe)
→ Session timing (major forex session awareness)
→ Structure clearance (clear path to profit targets)
→ Support/resistance proximity (confluence with key levels)
→ Market regime filtering (trending vs. choppy conditions)
Signals are graded A+, A, or B based on how many factors align:
• CONSERVATIVE MODE: A+ requires 12+ factors, A requires 9+, B requires 7+
• BALANCED MODE: A+ requires 10+ factors, A requires 7+, B requires 5+
• AGGRESSIVE MODE: A+ requires 8+ factors, A requires 5+, B requires 3+
TRADE ANALYSIS STATE MACHINE
A sophisticated monitoring system that tracks trade conditions in real-time using:
→ 5-state analysis framework (Factors Aligned / Positive Bias / Mixed Signals / Factors Weakening / Negative Bias)
→ Hysteresis-based transitions (different thresholds to enter vs. exit states)
→ Confidence smoothing with EMA (reduces noise, prevents flip-flopping)
→ Minimum commitment periods before state changes
→ Override logic for significant events (near TP/SL, momentum reversals)
→ Result: Stable, actionable guidance that doesn't change on every bar
INSTRUMENT-AWARE CALIBRATION
Automatically detects what you're trading and applies optimized parameters:
→ Forex Majors: Standard ATR, high session weight
→ Forex Crosses: Tighter stops, moderate session weight
→ Crypto: Wider stops (1.8x multiplier), reduced session weight (24/7 markets)
→ Indices: Moderate-wide stops, high session weight
→ Commodities: Moderate stops, moderate session weight
WHAT THIS INDICATOR DOES
The Kinetic Scalper is designed to identify high-confluence reversal opportunities by analyzing multiple dimensions of market behavior simultaneously.
CORE FUNCTIONS:
1. SIGNAL GENERATION
→ Identifies potential reversal points at oversold/overbought extremes
→ Confirms with multi-oscillator divergence detection
→ Validates with volume, higher timeframe, and structural analysis
→ Filters out low-probability setups automatically
→ Grades signals based on total confluence factors present
2. AUTOMATED TRADE TRACKING
→ Calculates structure-based or ATR-based stop loss levels
→ Projects take profit targets using risk-to-reward ratios
→ Monitors live position status (P/L, distance to targets, R-multiple)
→ Tracks TP1 and TP2 hits automatically
→ Displays outcome markers (TP HIT, PARTIAL WIN, STOPPED)
3. REAL-TIME CONDITION MONITORING
→ Analyzes 6 factor categories during active trades
→ Provides confidence scoring (0-100 scale)
→ Generates actionable guidance based on current market state
→ Alerts when conditions deteriorate or improve
→ Helps with trade management decisions
4. COMPREHENSIVE MARKET ANALYSIS
→ Session detection (Asian, London, New York, Overlap)
→ Volatility regime identification (Low, Normal, High, Extreme)
→ Trend state classification (Trending Up/Down, Ranging, Transitioning)
→ Volume analysis (relative volume and delta approximation)
→ Choppiness filtering (blocks signals in ranging markets)
WHY USE THIS INDICATOR
PROBLEM: Most momentum indicators generate too many false signals at extremes.
SOLUTION: The Kinetic Scalper requires MULTIPLE confirming factors before generating a signal, dramatically reducing noise and focusing on high-confluence setups.
ADVANTAGES:
✓ QUALITY OVER QUANTITY
→ Signal grading ensures you can filter for only the highest-quality setups
→ A+ signals have 10-12+ confirming factors aligned
→ Cooldown periods prevent over-trading the same move
✓ COMPLETE TRADE FRAMEWORK
→ Entry signals with confluence justification
→ Calculated stop loss based on market structure or ATR
→ Two profit targets with clear risk-to-reward ratios
→ Live trade monitoring with factor analysis
→ Outcome tracking and visual markers
✓ ADAPTIVE TO MARKET CONDITIONS
→ Volatility-based period adjustment for momentum calculations
→ Instrument-specific ATR multipliers
→ Session awareness for forex traders
→ Higher timeframe trend filtering
→ Automatic regime detection (trending vs. choppy)
✓ TRANSPARENT METHODOLOGY
→ Every input has detailed tooltips explaining its purpose
→ Signal tooltips show exactly why a signal was generated
→ Dashboard displays all relevant market conditions
→ Factor scores are visible during trades
→ No "black box" mystery calculations
✓ NON-REPAINTING & RELIABLE
→ All signals use barstate.isconfirmed (only on closed bars)
→ Higher timeframe data uses lookahead_off with historical offset
→ No future data access or repainting behavior
→ What you see is what you get - signals don't disappear or move
HOW THE INDICATOR WORKS
SIGNAL GENERATION PROCESS:
STEP 1: MOMENTUM ANALYSIS
The Kinetic Pulse engine calculates volume-weighted momentum:
→ Price changes are weighted by volume ratio vs. 20-bar average
→ High-volume moves have more influence on the oscillator
→ Gains and losses are smoothed using EMA (not SMA like RSI)
→ Fisher Transform is applied for normalization to 0-100 scale
→ Result: Momentum reading that emphasizes conviction, not noise
STEP 2: REVERSAL DETECTION
The indicator looks for potential reversal conditions:
→ Kinetic Pulse reaching oversold zone (below dynamic lower threshold)
→ Momentum velocity turning positive after being negative (for longs)
→ OR bullish divergence detected on multiple oscillators
→ Price making lower lows while oscillators make higher lows = divergence
STEP 3: MULTI-OSCILLATOR DIVERGENCE CONFIRMATION
Divergence is validated across three sources:
→ Kinetic Pulse divergence
→ CCI divergence
→ Stochastic divergence
→ Multiple oscillators confirming divergence increases signal reliability
STEP 4: CONFLUENCE FACTOR SCORING
The system evaluates all 15 possible confirming factors:
→ Momentum position: Is pulse oversold/overbought? (+0 to +2 points)
→ Momentum direction: Is velocity reversing? (+0 to +2 points)
→ Momentum acceleration: Is reversal strengthening? (+0 to +1 point)
→ Divergence count: How many oscillators show divergence? (+0 to +2 points)
→ Volume strength: Is volume above 1.3x average? (+0 to +1 point)
→ Volume delta: Is cumulative delta positive/negative? (+0 to +1 point)
→ HTF alignment: Does higher timeframe support direction? (+0 to +2 points)
→ Session timing: Is it a prime trading session? (+0 to +1 point)
→ Clear air: Is path to targets clear of obstacles? (+0 to +1 point)
→ Structure confluence: Are we near support/resistance? (+0 to +1 point)
→ Market regime: Is market trending, not choppy? (+0 to +1 point)
Total possible score: 15 points
Minimum for signal: 3-12 points depending on sensitivity mode
STEP 5: FILTER VALIDATION
Before generating a signal, additional checks are performed:
→ Volume must be above minimum threshold (if filter enabled)
→ Higher timeframe must not oppose the signal direction (if filter enabled)
→ Target path must be clear of major resistance/support (if filter enabled)
→ Volatility must not be EXTREME (blocks signals in chaos)
→ Risk-to-reward ratio must meet minimum requirement
→ Cooldown period must have elapsed since last signal
STEP 6: SIGNAL GRADING
If all filters pass, the signal is graded based on score:
→ A+ Grade: Highest confluence (8-12+ factors depending on sensitivity)
→ A Grade: High confluence (5-9+ factors)
→ B Grade: Moderate confluence (3-7+ factors)
Only graded signals (A+, A, or B) are displayed.
STEP 7: TRADE LEVEL CALCULATION
Stop loss and targets are calculated automatically:
STOP LOSS METHODS:
• Structure-Based: Uses recent swing low/high with ATR buffer, constrained by min/max ATR limits
• ATR-Based: Pure ATR multiplier with min/max constraints
• Fixed ATR: Simple ATR multiplier, no adjustments
TARGET CALCULATION:
• TP1: Entry ± (Stop Distance × Target 1 R:R)
• TP2: Entry ± (Stop Distance × Target 2 R:R)
• Default: TP1 at 1.0 R:R (1:1), TP2 at 2.0 R:R (1:2)
STEP 8: TRADE MONITORING
Once a signal is taken, the indicator tracks:
→ Current P/L in ticks and R-multiples
→ Distance to each target in ATR units
→ Distance to stop loss in ATR units
→ TP1 hit detection (marks with label, updates lines)
→ TP2 hit detection (closes trade, marks outcome)
→ Stop loss hit detection (closes trade, differentiates partial vs. full loss)
STEP 9: FACTOR ANALYSIS (DURING TRADES)
The Trade Analysis Panel monitors 6 key factor categories:
→ Momentum: Is momentum still aligned with trade direction? (-15 to +15 pts)
→ Position: Current R-multiple position (-12 to +12 pts)
→ Volume: Is volume still supportive? (-6 to +6 pts)
→ HTF Alignment: Does HTF still support trade? (-6 to +8 pts)
→ Target Proximity: How close are we to targets? (0 to +10 pts)
→ Stop Proximity: Are we dangerously close to stop? (-15 to +3 pts)
Raw scores are summed and smoothed using 5-bar EMA to create Confidence Score (0-100).
STEP 10: STATE MACHINE TRANSITIONS
Based on smoothed confidence, the system transitions between 5 states:
→ FACTORS ALIGNED (72+): Everything looks good
→ POSITIVE BIAS (58-72): Conditions favorable
→ MIXED SIGNALS (48-58): Neutral conditions
→ FACTORS WEAKENING (22-48): Concerning signals
→ NEGATIVE BIAS (<22): Poor conditions
Hysteresis prevents rapid flipping between states (different entry/exit thresholds).
RECOMMENDED TIMEFRAMES & INSTRUMENTS
TIMEFRAME VERSATILITY:
Despite the name "Scalper," this indicator works on ALL timeframes:
✓ LOWER TIMEFRAMES (1m - 15m)
→ Ideal for: Scalping and very short-term trades
→ Expect: More signals, faster trades, requires active monitoring
→ Best for: Forex majors, liquid crypto pairs
→ Tip: Use Conservative sensitivity to reduce noise
✓ MID TIMEFRAMES (15m - 1H)
→ Ideal for: Intraday trading and day trading
→ Expect: Moderate signal frequency, 1-4 hour trade duration
→ Best for: Forex, indices, major crypto
→ Tip: Balanced sensitivity works well here
✓ HIGHER TIMEFRAMES (4H - Daily)
→ Ideal for: Swing trading and position trading
→ Expect: Fewer signals, higher-quality setups, multi-day trades
→ Best for: All instruments
→ Tip: Can use Aggressive sensitivity for more opportunities
INSTRUMENT COMPATIBILITY:
✓ FOREX MAJORS (EUR/USD, GBP/USD, USD/JPY, etc.)
→ Auto-detected or manually select "Forex Major"
→ Session filtering is highly valuable here
→ London/NY overlap generates best signals
✓ FOREX CROSSES (EUR/GBP, AUD/NZD, etc.)
→ Auto-detected or manually select "Forex Cross"
→ Slightly tighter stops applied automatically
→ Session weight reduced vs. majors
✓ CRYPTOCURRENCIES (BTC, ETH, SOL, etc.)
→ Auto-detected or manually select "Crypto"
→ Wider stops (1.8x multiplier) due to volatility
→ Session filtering less relevant (24/7 markets)
→ Works well on both spot and perpetual futures
✓ INDICES (S&P 500, NASDAQ, DAX, etc.)
→ Auto-detected or manually select "Index"
→ Session opens (NY, London) are important
→ Moderate stop widths applied
✓ COMMODITIES (Gold, Silver, Oil, etc.)
→ Auto-detected or manually select "Commodity"
→ Moderate stops and session awareness
→ Works well on both spot and futures
VISUAL ELEMENTS EXPLAINED
SIGNAL MARKERS:
The indicator offers 3 display styles (choose in settings):
• PREMIUM STYLE (Default)
→ Signal appears below/above candles with connecting line
→ Background panel with grade badge (LONG , SHORT , etc.)
→ Entry price displayed
→ Direction arrow pointing to entry candle
→ Most informative, best for detailed analysis
• MINIMAL STYLE
→ Simple dot marker with grade text next to it
→ Clean, unobtrusive design
→ Best for mobile devices or cluttered charts
→ Less visual noise
• CLASSIC STYLE
→ Diamond marker with grade badge below/above
→ Traditional indicator aesthetic
→ Good balance between info and simplicity
ALL STYLES INCLUDE:
→ Signal tooltips with complete trade plan details
→ Grade display (A+, A, or B)
→ Color coding (bright colors for A+, standard for A/B)
SIGNAL TOOLTIP CONTENTS:
When you hover over any signal marker, you'll see:
→ Signal direction and grade
→ Confluence score (actual points vs. required)
→ Reason for signal (divergence type, reversal pattern)
→ Complete trade plan (Entry, Stop, TP1, TP2)
→ Risk in ticks
→ Risk-to-reward ratios
→ Market conditions at signal (Pulse value, HTF status, Volume, Session)
TRADE LEVEL LINES:
When Trade Tracking is enabled:
• ENTRY LINE (Yellow/Gold)
→ Solid horizontal line at entry price
→ Shaded zone around entry (±ATR buffer)
→ Label showing entry price
→ Extends 20-25 bars into future
• STOP LOSS LINE (Orange/Red)
→ Dashed line at stop level
→ Label showing stop price and distance in ticks
→ Turns dotted and changes color after TP1 hit (breakeven implied)
→ Deleted when trade closes
• TAKE PROFIT 1 LINE (Blue)
→ Dotted line at TP1 level
→ Label showing price and R:R ratio (e.g., "1:1.0")
→ Turns solid and changes to green when hit
→ Deleted after TP1 hit
• TAKE PROFIT 2 LINE (Blue)
→ Solid line at TP2 level
→ Label showing price and R:R ratio (e.g., "1:2.0")
→ This is the "full win" target
→ Deleted when trade closes
OUTCOME MARKERS:
When trade milestones are reached:
• - Green label appears when first target is touched
• - Green label when second target is touched (trade complete)
• - Red label if stop loss hit before any target
• - Orange label if TP1 hit but then stopped out
PREVIOUS DAY LEVELS:
If enabled (Show Previous Day Levels):
• PDH (Previous Day High) - Solid red/orange line
→ Label shows "PDH: "
→ Useful resistance reference for intraday trading
• PDL (Previous Day Low) - Solid green line
→ Label shows "PDL: "
→ Useful support reference for intraday trading
BACKGROUND TINTS:
Subtle background colors indicate states:
→ Light green tint: Active long position being tracked
→ Light red tint: Active short position being tracked
→ Light orange tint: Extreme volatility warning (signals blocked)
DASHBOARD GUIDE
The indicator features TWO dashboard panels:
━━━━━━━━━━━━━━━━━━━━━━━━━━━━━━━━━━━━━━━━━━━━━━━━━━━━━━━━━━━━━━━━━━━━━━━━━━━━━
MAIN DASHBOARD (Top Right by default)
━━━━━━━━━━━━━━━━━━━━━━━━━━━━━━━━━━━━━━━━━━━━━━━━━━━━━━━━━━━━━━━━━━━━━━━━━━━━━
WHEN NO TRADE IS ACTIVE:
→ Bias: Current market bias (BULLISH, BEARISH, NEUTRAL, LEAN LONG/SHORT)
→ Based on Kinetic Pulse position and velocity
→ Helps you understand overall momentum direction
→ Pulse: Current Kinetic Pulse value (0-100 scale)
→ <30 = Oversold (potential long setups developing)
→ >70 = Overbought (potential short setups developing)
→ 40-60 = Neutral zone
→ Volatility: Current volatility regime (LOW, NORMAL, HIGH, EXTREME)
→ Calculated from ATR ratio vs. 100-period average
→ EXTREME volatility blocks all signals (too chaotic)
→ Trend: Market state classification
→ TREND UP / TREND DOWN: ADX > 25, directional movement clear
→ RANGING: ADX < 20, choppy conditions
→ TRANSITIONING: ADX 20-25, developing conditions
→ VOLATILE: Extreme ATR regime
→ Session: Current forex session
→ ASIAN (00:00-08:00 UTC)
→ LONDON (07:00-16:00 UTC)
→ NEW YORK (13:00-22:00 UTC)
→ LDN/NY (13:00-16:00 UTC) - Overlap period, highest volatility
→ OFF-HOURS: Outside major sessions
→ Volume: Current volume vs. 20-bar average
→ Displayed as multiplier (e.g., "1.45x" = 45% above average)
→ Green if >1.3x (high volume, bullish for signal quality)
→ Red if <0.8x (low volume, bearish for signal quality)
→ HTF: Higher timeframe analysis status
→ BULLISH: HTF momentum supports longs
→ BEARISH: HTF momentum supports shorts
→ NEUTRAL: No clear HTF direction
→ Best Score: Highest confluence score currently available
→ Shows both long and short scores
→ Format: " / "
→ Example: "8/7 " means long score is 8, threshold is 7, long is leading
→ Helps you anticipate which direction might signal next
→ PDH/PDL: Previous day high and low prices
→ Quick reference for intraday support/resistance
WHEN TRADE IS ACTIVE:
→ Trade: Direction and grade (e.g., "LONG ")
→ Entry: Entry price of current trade
→ P/L: Current profit/loss
→ Shown in ticks and R-multiples
→ Format: "+45 | +0.75R" or "-20 | -0.35R"
→ Green when positive, red when negative
→ TP1: First target status
→ Shows price and distance if not hit
→ Shows "HIT" in green if reached
→ TP2: Second target price and distance
→ Stop: Stop loss price and current distance from stop
→ Bars: Number of bars since entry (trade duration)
━━━━━━━━━━━━━━━━━━━━━━━━━━━━━━━━━━━━━━━━━━━━━━━━━━━━━━━━━━━━━━━━━━━━━━━━━━━━━
TRADE ANALYSIS PANEL (Bottom Left by default)
━━━━━━━━━━━━━━━━━━━━━━━━━━━━━━━━━━━━━━━━━━━━━━━━━━━━━━━━━━━━━━━━━━━━━━━━━━━━━
This panel provides algorithmic analysis of market conditions. It does NOT provide investment advice or recommendations.
WHEN NO TRADE IS ACTIVE:
Shows scanning status and signal readiness:
→ Long/Short Readiness Gauges
→ Visual bar showing proximity to signal threshold
→ Score display (e.g., "8/7" means 8 points scored, 7 needed)
→ "RDY" indicator when threshold reached
→ Status Messages
→ "Scanning for setups..." - Normal scanning mode
→ "Long setup ready - cooldown: X bars" - Signal qualified but in cooldown
→ "Oversold conditions - watch for reversal" - Setup developing
→ "Choppy conditions detected" - Warning about market state
→ "Extreme volatility - signals blocked" - Safety filter active
WHEN TRADE IS ACTIVE:
Header shows current analysis state:
→ FACTORS ALIGNED (Green) - Everything looks good, confidence 72+
→ POSITIVE BIAS (Light Green) - Conditions favorable, confidence 58-72
→ MIXED SIGNALS (Blue) - Neutral conditions, confidence 48-58
→ FACTORS WEAKENING (Orange) - Concerning signals, confidence 22-48
→ NEGATIVE BIAS (Red) - Poor conditions, confidence <22
Confidence Score:
→ Displayed as percentage (0-100%)
→ Visual gauge (|||||.....)
→ Trend indicator (Rising, Falling, Stable)
→ Shows momentum of confidence change
Factor Breakdown (if enabled):
Shows 6 factor categories with individual scores:
→ Momentum: Is momentum aligned with trade? (-15 to +15 points)
→ Positive if velocity matches trade direction
→ Negative if momentum opposes trade
→ Position: Current R-multiple analysis (-12 to +12 points)
→ Positive if trade is in profit
→ Negative if underwater
→ Score increases as profit grows
→ Volume: Is volume supportive? (-6 to +6 points)
→ Positive if volume above average
→ Negative if volume weak
→ HTF Align: Higher timeframe status (-6 to +8 points)
→ Positive if HTF still supports trade direction
→ Negative if HTF turned against trade
→ Target: Proximity to profit targets (0 to +10 points)
→ Higher score when approaching targets
→ Bonus if TP1 already hit and near TP2
→ Stop Dist: Distance from stop loss (-15 to +3 points)
→ Negative if dangerously close to stop (<0.3 ATR)
→ Positive if well away from stop (>1.5 ATR)
Each factor shows:
• Score value with +/- indicator
• Trend symbol: + (improving), - (deteriorating), = (stable)
• Visual gauge
Guidance Messages:
→ "TARGET 2 APPROACHING" - TP2 within 0.3 ATR
→ "TARGET 1 APPROACHING" - TP1 within 0.3 ATR
→ "STOP PROXIMITY WARNING" - Stop within 0.3 ATR
→ "Factors aligned - Holding" - Positive state, stay in trade
→ "Conditions favorable" - Still looking good
→ "Conditions mixed - " - Neutral assessment
→ "Factors deteriorating" - Warning of weakening setup
→ "Confluence weakening - secure gains" - Consider exit if profitable
COMPACT MODE (Mobile-Friendly):
→ Reduces panel size by showing only essential info
→ Factor icons instead of full breakdowns
→ Simplified guidance messages
→ Perfect for smaller screens
SETTINGS GUIDE
MASTER SETTINGS:
Instrument Type
→ Purpose: Optimizes ATR multipliers and session weights for your asset
→ Options: Auto-Detect (recommended), Forex Major, Forex Cross, Crypto, Index, Commodity
→ Default: Auto-Detect
→ When to change: If auto-detection is incorrect for your symbol
Signal Sensitivity
→ Purpose: Controls how many factors required before generating signals
→ Options:
• Conservative: Requires 12+ for A+, 9+ for A, 7+ for B (fewer, highest quality)
• Balanced: Requires 10+ for A+, 7+ for A, 5+ for B (recommended)
• Aggressive: Requires 8+ for A+, 5+ for A, 3+ for B (more frequent)
→ Default: Balanced
→ When to change: If you want fewer signals (Conservative) or more opportunities (Aggressive)
Enable Trade Signals
→ Purpose: Master on/off switch for signal generation
→ Default: ON
→ When to disable: If you only want to use the analysis dashboards without signals
Enable Trade Tracking
→ Purpose: Tracks active trades and monitors conditions until TP/SL hit
→ Default: ON
→ When to disable: If you manage trades manually and don't want automatic tracking
Show Entry/Stop/Target Levels
→ Purpose: Displays trade plan lines and labels on chart
→ Default: ON
→ When to disable: If you prefer clean charts or manage levels yourself
DISPLAY SETTINGS:
Color Theme
→ Purpose: Optimizes colors for your chart background
→ Options: Dark (for dark charts), Light (for light charts)
→ Default: Dark
Signal Display Style
→ Purpose: Visual style of signal markers
→ Options:
• Premium: Badge with line and background panel (most detailed)
• Minimal: Simple dot with grade text (cleanest)
• Classic: Diamond marker with badge (traditional)
→ Default: Premium
Signal Distance
→ Purpose: How far signal labels appear from price bars (in ATR units)
→ Range: 0.5 to 10.0
→ Default: 2.0
→ When to adjust: Increase to 3.0-4.0 if signals hide behind candle wicks
TP/SL Label Distance
→ Purpose: Spacing of price labels to prevent overlap
→ Range: 0.5 to 5.0
→ Default: 1.5
Show Previous Day Levels
→ Purpose: Display PDH/PDL reference lines
→ Default: ON
→ Best for: Intraday traders who respect previous day levels
MAIN DASHBOARD:
Show Main Dashboard
→ Purpose: Toggle visibility of market conditions table
→ Default: ON
Main Dashboard Position
→ Options: Top Right, Top Left, Bottom Right, Bottom Left
→ Default: Top Right
→ When to change: To avoid overlap with TradingView's built-in panels
TRADE ANALYSIS PANEL:
Show Trade Analysis Panel
→ Purpose: Toggle factor analysis dashboard
→ Default: ON
Analysis Panel Position
→ Options: Top Right, Top Left, Bottom Right, Bottom Left, Middle Right, Middle Left
→ Default: Bottom Left
→ Recommended: Bottom Right or Middle Right to avoid overlap with Main Dashboard
Compact Mode
→ Purpose: Reduces panel size for mobile or smaller screens
→ Default: OFF
→ When to enable: Mobile trading, small screens, or minimalist preference
Show Factor Details
→ Purpose: Displays individual factor scores vs. overall confidence only
→ Default: ON
→ When to disable: For more compact view showing only state and confidence
RISK MANAGEMENT:
Stop Loss Method
→ Purpose: How stop loss distance is calculated
→ Options:
• Structure-Based: Uses swing highs/lows with ATR buffer (recommended)
• ATR-Based: Pure ATR multiplier with min/max constraints
• Fixed ATR: Simple multiplier, no adjustments
→ Default: Structure-Based
→ Impact: Structure-Based respects market geometry but constrains within safe limits
ATR Stop Multiplier
→ Purpose: Multiplier for ATR-based stop calculation
→ Range: 0.5 to 3.0
→ Default: 1.5
→ When to adjust:
• Increase to 2.0-2.5 for more breathing room (fewer false stops)
• Decrease to 1.0-1.2 for tighter stops (but more stop-outs)
Maximum Stop Distance (ATR)
→ Purpose: Cap on stop width to prevent excessive risk
→ Range: 1.0 to 5.0
→ Default: 2.5
→ Impact: If structure-based stop exceeds this, ATR-based stop is used instead
Minimum Stop Distance (ATR)
→ Purpose: Floor on stop width to avoid noise-induced stops
→ Range: 0.2 to 1.0
→ Default: 0.5
→ Impact: Prevents stops too tight to survive normal volatility
Target 1 Risk/Reward Ratio
→ Purpose: R:R for first profit target
→ Range: 0.5 to 2.0
→ Default: 1.0 (1:1 ratio)
→ Common values: 1.0 for quick profit taking, 1.5 for patient trading
Target 2 Risk/Reward Ratio
→ Purpose: R:R for second profit target (full win)
→ Range: 1.0 to 4.0
→ Default: 2.0 (1:2 ratio)
→ Common values: 2.0-3.0 for balanced risk/reward
Minimum R:R Required
→ Purpose: Filters out signals with poor risk/reward
→ Range: 0.5 to 2.0
→ Default: 1.0
→ Impact: Signals where potential reward doesn't meet this ratio are rejected
→ WARNING: Always ensure your position sizing means a stop loss = no more than 1-2% of your account, regardless of R:R ratio
SIGNAL FILTERS:
Session Awareness
→ Purpose: Weights signals higher during major forex sessions
→ Default: ON
→ Impact: Doesn't block signals, but session quality factors into scoring
→ Best for: Forex traders
Session Timezone
→ Purpose: Timezone for session calculations
→ Options: UTC, America/New_York, Europe/London, Asia/Tokyo, Asia/Hong_Kong
→ Default: UTC
→ When to change: Match your broker's server time
Higher Timeframe Alignment
→ Purpose: Checks HTF momentum before generating signals
→ Default: ON
→ Impact: Filters counter-trend signals, improves quality
→ Recommended: Keep enabled
HTF Timeframe
→ Purpose: Which higher timeframe to check
→ Default: Auto (blank field)
→ Auto selection:
• 1m chart → 5m HTF
• 5m chart → 15m HTF
• 15m chart → 1H HTF
• 1H chart → 4H HTF
• 4H+ chart → Daily HTF
→ Manual override: Enter any timeframe (e.g., "60" for 1-hour)
Volume Confirmation
→ Purpose: Requires above-average volume for signals
→ Default: ON
→ Impact: Filters low-liquidity false signals
→ Recommended: Keep enabled
Minimum Volume Ratio
→ Purpose: Volume threshold vs. 20-bar average
→ Range: 0.3 to 2.0
→ Default: 0.8 (80% of average)
→ When to adjust:
• Increase to 1.2-1.5 for only high-volume signals
• Decrease to 0.5-0.7 for more permissive filtering
Structure Clearance Check
→ Purpose: Ensures clear path to targets (no nearby resistance/support)
→ Default: ON
→ Impact: Prevents trades with immediate obstacles
→ Recommended: Keep enabled
Minimum Bars Between Signals
→ Purpose: Cooldown period after each signal
→ Range: 1 to 10
→ Default: 3
→ Impact: After a signal, this many bars must pass before another in same direction
→ When to adjust:
• Increase to 5-7 to prevent over-trading
• Decrease to 1-2 for faster re-entries
ADVANCED TUNING:
Momentum Period
→ Purpose: Base period for Kinetic Pulse calculation
→ Range: 5 to 30
→ Default: 14
→ When to adjust:
• Lower (8-10): More responsive, noisier
• Higher (18-21): Smoother, slower to react
→ Note: If Adaptive Period enabled, this is adjusted automatically
Adaptive Period
→ Purpose: Auto-adjusts momentum period based on volatility
→ Default: ON
→ Impact: Shortens period in high volatility, lengthens in low volatility
→ Recommended: Keep enabled for automatic optimization
Divergence Lookback
→ Purpose: How far back to search for divergence patterns
→ Range: 10 to 60
→ Default: 30
→ When to adjust:
• Shorter (15-20): Only recent divergences
• Longer (40-50): Catches older divergences (may be less relevant)
Swing Detection Bars
→ Purpose: Bars required on each side to confirm swing high/low
→ Range: 2 to 7
→ Default: 3
→ Impact on stops:
• Lower (2-3): More swing points, potentially tighter stops
• Higher (5-7): Only major swings, wider stops
Choppiness Index Threshold
→ Purpose: Threshold above which market considered choppy
→ Range: 38.2 to 80.0
→ Default: 61.8
→ Impact:
• Lower (50-55): Stricter quality filter (fewer signals in ranging markets)
• Higher (65-70): More permissive (allows signals in choppier conditions)
HOW TO READ SIGNALS
SIGNAL ANATOMY:
When a signal appears, you'll see:
1. DIRECTIONAL MARKER
→ Arrow, dot, or diamond pointing to entry candle (depends on style)
→ Positioned below price for LONG, above price for SHORT
→ Connected to price with line (Premium style)
2. GRADE BADGE
→ Displays signal quality: LONG , SHORT , etc.
→ Color coding:
• Bright green/cyan for A+ longs
• Standard green for A/B longs
• Bright pink/magenta for A+ shorts
• Standard red for A/B shorts
3. ENTRY PRICE (Premium style only)
→ Shows exact entry price at signal generation
4. TOOLTIP (all styles)
→ Hover over signal to see complete trade plan
→ Includes: Entry, Stop, TP1, TP2, Risk, R:R ratios, market conditions, signal reason, confluence score
INTERPRETING GRADES:
→ A+ SIGNALS (Highest Quality)
• 8-12+ confirming factors aligned
• Multiple divergences OR strong momentum reversal
• HTF alignment + volume + session timing + clear structure
• These are your highest-probability setups
• Recommended action: Give these priority, consider larger position size
→ A SIGNALS (High Quality)
• 5-9+ confirming factors aligned
• Good confluence, most key factors present
• Missing 1-2 optimal conditions
• These are still quality trades
• Recommended action: Standard position size, solid setups
→ B SIGNALS (Moderate Quality)
• 3-7+ confirming factors aligned
• Minimum viable confluence
• May be missing HTF alignment, volume, or session timing
• Higher variance outcomes
• Recommended action: Smaller position size or skip if conservative
SIGNAL NARRATIVE:
Each signal tooltip includes a narrative explaining WHY it was generated:
→ "Multi-divergence at oversold extreme"
• Multiple oscillators showing bullish divergence
• Kinetic Pulse in oversold zone
• High-quality reversal setup
→ "Bullish divergence near support"
• Divergence detected
• Price near key support level (swing low or PDL)
• Structure confluence
→ "Momentum reversal with HTF alignment"
• Kinetic Pulse velocity reversing
• Higher timeframe supports direction
• Strong trend-following setup
→ "Oversold momentum reversal"
• Extreme Kinetic Pulse reading reversing
• May not have divergence but strong momentum shift
READING THE TRADE PLAN:
Every signal comes with a complete trade plan:
→ ENTRY: The close price of the signal candle
• This is where the signal triggered
• If using limit orders, you might improve on this price
→ STOP: Calculated stop loss level
• Based on your Stop Loss Method setting
• Distance shown in ticks
• Risk tolerance: Ensure this represents ≤1-2% of your account
→ TP1: First profit target
• Default: 1:1 risk-reward
• This is your partial profit or first exit
• Consider taking 50% off at TP1
→ TP2: Second profit target
• Default: 1:2 risk-reward
• This is your "full win" target
• Hold remaining position for this level
SIGNAL FREQUENCY EXPECTATIONS:
Frequency varies by timeframe, sensitivity, and market conditions:
→ AGGRESSIVE MODE
• Lower timeframes (1m-5m): 5-15 signals per day
• Mid timeframes (15m-1H): 2-5 signals per day
• Higher timeframes (4H-D): 1-3 signals per week
→ BALANCED MODE (Default)
• Lower timeframes: 3-8 signals per day
• Mid timeframes: 1-3 signals per day
• Higher timeframes: 2-5 signals per week
→ CONSERVATIVE MODE
• Lower timeframes: 1-4 signals per day
• Mid timeframes: 0-2 signals per day
• Higher timeframes: 1-3 signals per week
Note: Frequency also depends on market volatility and trending vs. ranging conditions.
Example - Kinetic Scalper Trade Sequence
Here's an example showing the complete trade lifecycle with all dashboard transitions, annotations, and descriptions.
INSTRUMENT & TIMEFRAME DETAILS
Symbol: Nifty 50 Index (NSE)
Date: December 15, 2025
Session: London session (active trading hours)
Instrument Type: Index (auto-detected)
TRADE SEQUENCE BREAKDOWN
SCREENSHOT 1: Pre-Signal Setup Building (Image 1)
Time: ~12:00-14:30 UTC+5:30(approx.)
Price Action: Uptrend showing signs of exhaustion near 26,200
Market State: Price at session highs
Main Dashboard (Top Right):
- Bias: LEAN SHORT
- Pulse: 58.9 (approaching overbought)
- Volatility: NORMAL
- Trend: TRANSITIONING
- Session: LONDON (favorable timing)
- Volume: 0.98x (slightly below average)
- HTF: BULLISH (caution for counter-trend)
- Best Score: 9/5 (Short score building)
- PDH/PDL: 26098.25 / 25938.95
Trade Analysis Panel (Bottom Left):
- Status: NO ACTIVE TRADE
- Long Score: 5/5 (RDY)
- Short Score: 9/5 (RDY)
- Panel Message: "Short pattern developing - score: 9"
Description :
Setup Development Phase: The indicator identifies a potential short opportunity as price reaches the previous day's high. The short confluence score has climbed to 9/15 points, meeting the 'Balanced' sensitivity threshold for a Grade B signal. Notice the 'LEAN SHORT' bias and the Kinetic Pulse reading of 58.9 approaching overbought territory. The Trade Analysis panel shows 'Short pattern developing' with 9/5 factors aligned. Key factors: momentum approaching reversal zone, price at resistance (PDH), and London session providing favorable conditions.
SCREENSHOT 2: Signal Generated & Trade Entered (Image 2)
Time: ~13:00 UTC+5:30 (signal bar)
Entry Price: 26,184.65
Signal Grade: Grade
Main Dashboard (Top Right):
- Trade: SHORT
- Entry: 26184.65
- P/L: 5.95 pts | +0.2R (early positive movement)
- TP1: 26157.00 (33.2 pts away)
- TP2: 26129.35 (60.84 pts away)
- Stop: 26212.30 (22.1 pts away)
- Bars: 1 (just entered)
Trade Analysis Panel (Bottom Left):
- Header: TRADE ANALYSIS
- Status Bar: "Conditions mixed - improving 57%"
- Confidence: 57% RISING
- Factor Breakdown:
- Momentum: -4 (velocity not yet aligned)
- Position: +4 (slight profit)
- Volume: +2 = (volume present)
- HTF Align: +2 = (not strongly aligned)
- Target: +0 - (far from TP)
- Stop Dist: +3 - (good distance)
- Bottom Status: "Conditions mixed - Monitoring"
- Disclaimer: "Analysis only - Not financial advice"
Description:
Signal Activation: A Grade A short signal triggers at 26,184.65 after the short confluence score reached qualifying levels. The indicator places a structure-based stop loss at 26,212.30 (27.65 points risk) with dual targets at 1:1 and 1:2 risk-reward ratios.
The Trade Analysis Panel immediately begins monitoring with an initial confidence score of 57% - classified as 'MIXED SIGNALS' but showing a 'RISING' trend. Factor analysis reveals: momentum not yet aligned (-4 points as price just reversed), position slightly favorable (+4 points already +0.2R), volume adequate (+2), HTF showing weak alignment (+2 as we're counter-trend), stop well-placed (+3), but targets still distant (0 points).
Notice how the Main Dashboard switches from market scanning mode to active trade tracking, now displaying entry price, live P/L in both points (5.95 pts) and R-multiples (+0.2R), and distances to all key levels. The analysis panel provides real-time factor scoring to help monitor trade health.
SCREENSHOT 3: TP1 Hit - Trade Performing Well (Image 3)
Time: ~14:20 UTC+5:30(approx)
Price: ~26,154 (TP1 zone)
Bars in Trade: 29
Main Dashboard (Top Right):
- Trade: SHORT
- Entry: 26184.65
- P/L: 30.85 pts | +1.12R (excellent progress)
- TP1: HIT (displayed in green)
- TP2: 26129.35 (24.44 pts away)
- Stop: 26212.30 (58.5 pts away - well protected)
- Bars: 29
Trade Analysis Panel (Bottom Left):
- Header: TRADE ANALYSIS
- Status Bar: "Multiple factors positive"
- Confidence: 78% RISING
- Factor Breakdown:
- Momentum: +8 = (ALIGNED)
- Position: +8 + (strong profit zone)
- Volume: +2 + (continued support)
- HTF Align: +8 = (now strongly aligned)
- Target: +10 + (TP1 achieved, approaching TP2)
- Stop Dist: +3 + (excellent cushion)
- Bottom Status: "Multiple factors positive"
- Visual State: Green background (FACTORS ALIGNED state)
Description:
Trade Execution Phase - First Target Achieved: After 29 bars , price reaches the first take-profit target at 26,157.00. The ' ' marker confirms partial profit taking. Current P/L shows +30.85 points (+1.12R), exceeding the initial 1:1 risk-reward.
The Trade Analysis Panel shows dramatic improvement - confidence has surged to 78% (FACTORS ALIGNED state) with most factors now positive:
- Momentum factor improved to +8 (velocity aligned with trade direction)
- Position factor at +8 (over +1R profit zone)
- HTF Align jumped to +8 (higher timeframe now confirming the move)
- Target factor maxed at +10 (TP1 achieved, TP2 within reach)
- Stop Distance at +3 (58.5 points cushion providing safety)
Notice the panel status displays 'Multiple factors positive' with a green-tinted background, indicating optimal trade conditions. The confidence trend shows 'RISING' suggesting continued momentum. With TP1 secured and only 24.44 points to TP2, the trade is well-positioned for a full 1:2R win.
SCREENSHOT 4: TP2 Reached - Trade Complete (Image 4)
Time: ~15:00+ UTC+5:30
Final Exit: 26,129.35 (TP2)
Final Result: Full TP2 win
Main Dashboard (Top Right):
- Bias: NEUTRAL (reverted to scanning mode)
- Pulse: 45.2 (returned to neutral zone)
- Volatility: NORMAL
- Trend: TREND DOWN (confirmed the move)
- Session: LONDON
- Volume: 1.26x (increased as move developed)
- HTF: BEARISH (fully aligned post-trade)
- Best Score: 5/5 (neutral after completion)
Trade Analysis Panel (Bottom Left):
- Status: NO ACTIVE TRADE (reverted)
- Long Score: 5/5 (RDY)
- Short Score: 5/5 (RDY)
- Panel Message: "Scanning - prime session active"
- Light blue/cyan background (back to scanning mode)
Description:
Trade Completion - Full Target Achieved: The short trade reaches its second take-profit target at 26,129.35, securing a complete 1:2 risk-reward win. The ' ' marker confirms the exit. Final results:
- Entry: 26,184.65
- Exit: 26,129.35
- Profit: 55.30 points (approximately +2.0R)
- Outcome: Full TP2 success
Post-Trade Analysis: After trade closure, the indicator automatically returns to market scanning mode. The Main Dashboard reverts to showing market conditions rather than trade metrics. Notice how the 'Trend' now displays 'TREND DOWN' - confirming the move we captured. Volume increased to 1.26x during the winning move, validating the signal quality.
The Trade Analysis Panel switches back to 'NO ACTIVE TRADE' status and resumes displaying long/short setup scores. The confidence-based factor monitoring was instrumental throughout the trade:
- Initial entry at 57% confidence (MIXED SIGNALS)
- Peak confidence of 78% at TP1 (FACTORS ALIGNED)
- Real-time factor updates helped confirm trade validity
This example demonstrates the indicator's complete workflow: setup identification → signal generation → entry execution → live trade monitoring → systematic exit at targets.
KEY FEATURES DEMONSTRATED
1. Dual Dashboard System
- Main Dashboard: Market conditions (scanning) → Trade metrics (active position)
- Analysis Panel: Setup scores (scanning) → Factor-based confidence (in-trade)
2. Visual Trade Management
- Color-coded entry zones (yellow)
- Risk levels clearly marked (red dashed stop)
- Profit targets with R:R ratios labeled
- Achievement markers ( , )
3. Real-Time Factor Analysis
- 6-factor scoring system (Momentum, Position, Volume, HTF, Target, Stop Dist)
- Confidence percentage with trend indicators
- State machine (MIXED → FACTORS ALIGNED)
- Hysteresis prevents false state changes
4. Risk Management
- Structure-based stop placement (respects swing highs)
- Multiple take-profit levels (1:1 and 1:2 R:R)
- Live P/L tracking in points and R-multiples
- Distance monitoring to all key levels
This complete example showcases the indicator's progression from setup identification through trade completion, demonstrating how the dual-dashboard system and factor-based analysis provide continuous trade guidance. The structured stop-loss and dual-target approach delivered the planned 1:2 risk-reward ratio with systematic, rule-based execution.
ALERT SYSTEM
The indicator includes 9 built-in alert conditions:
SIGNAL ALERTS:
→ High-Grade Long Signal (A+)
• Triggers only on A+ long signals
• For traders who want only the highest-quality longs
• Message: "KINETIC SCALPER: LONG @ "
→ High-Grade Short Signal (A+)
• Triggers only on A+ short signals
• For traders who want only the highest-quality shorts
• Message: "KINETIC SCALPER: SHORT @ "
→ Long Signal
• Triggers on ANY qualified long signal (A+, A, or B)
• For traders who want all long opportunities
• Message: "KINETIC SCALPER: LONG @ "
→ Short Signal
• Triggers on ANY qualified short signal
• For traders who want all short opportunities
• Message: "KINETIC SCALPER: SHORT @ "
TRADE MANAGEMENT ALERTS:
→ TP1 Hit
• Triggers when first profit target is reached
• Useful for partial profit taking notifications
• Message: "KINETIC SCALPER: TP1 REACHED"
→ TP2 Reached
• Triggers when second profit target is reached
• Trade is complete, full win achieved
• Message: "KINETIC SCALPER: TP2 REACHED"
→ Stop Loss Hit
• Triggers when stop loss is reached
• Important for trade management and risk tracking
• Message: "KINETIC SCALPER: STOP LOSS"
ANALYSIS STATE ALERTS:
→ Analysis State: Negative Bias
• Triggers when factor analysis enters "Negative Bias" state
• Warning that trade conditions are deteriorating
• Consider reducing position or preparing to exit
• Message: "KINETIC SCALPER: Analysis state changed to NEGATIVE BIAS"
→ Analysis State: Factors Weakening
• Triggers when factor analysis enters "Factors Weakening" state
• Caution that confluence is diminishing
• Monitor trade closely
• Message: "KINETIC SCALPER: Analysis state changed to FACTORS WEAKENING"
HOW TO SET UP ALERTS:
1. Click the "Create Alert" button in TradingView
2. Condition: Select "Kinetic Scalper "
3. Choose your desired alert from the dropdown
4. Configure your alert options:
→ Once Per Bar Close (recommended for non-repainting)
→ Frequency: Once Per Bar Close or Only Once
5. Set expiration and notification methods (popup, email, webhook, etc.)
6. Create alert
RECOMMENDED ALERT STRATEGY:
For active traders:
→ Set "Long Signal" and "Short Signal" alerts for all opportunities
→ Set "TP1 Hit", "TP2 Reached", and "Stop Loss Hit" for trade management
→ Consider "Analysis State: Negative Bias" for trade monitoring
For selective traders:
→ Set only "High-Grade Long Signal (A+)" and "High-Grade Short Signal (A+)"
→ Focus on the absolute highest-quality setups
→ Set TP/SL alerts for position management
USAGE TIPS & BEST PRACTICES
SIGNAL SELECTION:
✓ GRADE MATTERS
→ A+ signals have statistically more confluence factors
→ If you're conservative, trade only A+ signals
→ B signals can work but require more discretion
✓ CONFLUENCE WITH YOUR ANALYSIS
→ Use this indicator as CONFIRMATION, not sole decision criteria
→ Combine with your own support/resistance analysis
→ Check for fundamental events (news, economic data)
→ Respect major round numbers and psychological levels
✓ SESSION TIMING (Forex)
→ Best signals often occur during London/NY overlap
→ Avoid signals 10 minutes before major news releases
→ Asian session signals can be valid but lower liquidity
✓ TIMEFRAME CONFLUENCE
→ If you get an A+ signal on 15m, check if 1H chart agrees
→ Higher timeframe confirmation adds conviction
→ Avoid signals that oppose the daily/4H trend
TRADE MANAGEMENT:
✓ POSITION SIZING
→ ALWAYS size positions so stop loss = 1-2% of account
→ Never risk more than you can afford to lose
→ Smaller position on B signals, standard on A, larger on A+ (within limits)
✓ PARTIAL PROFIT TAKING
→ Consider taking 50% off at TP1
→ Move stop to breakeven after TP1 hit
→ Let remaining position run to TP2
✓ TRAILING STOPS
→ The indicator doesn't auto-trail stops (manual decision)
→ After TP1, you might manually move stop to entry (breakeven)
→ Consider ATR-based trailing stop for runners
✓ WATCH THE ANALYSIS PANEL
→ If state changes to "Factors Weakening" while in profit, consider exit
→ "Negative Bias" during a trade is a strong warning
→ "Factors Aligned" confirms your trade thesis is still valid
RISK MANAGEMENT:
✓ NEVER IGNORE STOPS
→ The calculated stop is there for a reason
→ Moving stop further away increases risk exponentially
→ If stopped out, accept it and wait for next setup
✓ AVOID REVENGE TRADING
→ If you get stopped out, resist urge to immediately re-enter
→ Signal cooldown helps with this
→ Wait for next qualified signal
✓ RESPECT VOLATILITY WARNINGS
→ If indicator shows "EXTREME" volatility, signals are blocked for a reason
→ Don't force trades in chaotic conditions
→ Wait for regime to normalize
✓ CORRELATION RISK
→ Be aware of correlation if trading multiple pairs
→ EUR/USD and GBP/USD are highly correlated
→ Don't stack risk on correlated instruments
OPTIMIZATION:
✓ START WITH DEFAULTS
→ Default settings are well-tested
→ Don't over-optimize for recent market behavior
→ Give settings at least 20-30 trades before judging
✓ TIMEFRAME-SPECIFIC ADJUSTMENTS
→ Lower timeframes: Consider increasing Signal Distance to 3.0-4.0
→ Higher timeframes: ATR Stop Multiplier might go to 2.0-2.5
→ Crypto: Ensure Instrument Type is set to "Crypto" for proper stops
✓ SENSITIVITY CALIBRATION
→ Too many signals? Switch to Conservative
→ Missing good setups? Try Balanced or Aggressive
→ Quality > Quantity always
✓ KEEP A JOURNAL
→ Track which signal grades work best for you
→ Note which sessions produce best results
→ Review stopped trades for patterns
THINGS TO AVOID:
✗ DON'T chase signals after several bars have passed
✗ DON'T ignore the stop loss or move it further away
✗ DON'T overtrade by taking every B-grade signal
✗ DON'T trade during major news if you're not experienced
✗ DON'T use this as your only analysis tool
✗ DON'T expect 100% win rate (no indicator has this)
✗ DON'T risk more than 1-2% per trade regardless of signal grade
UNDERSTANDING THE METHODOLOGY
WHY VOLUME WEIGHTING?
Traditional momentum oscillators treat all price moves equally. A 10-point move on low volume is weighted the same as a 10-point move on high volume.
The Kinetic Pulse corrects this by:
→ Calculating volume ratio vs. 20-bar average
→ Applying square root transformation to volume ratio (prevents extreme weights)
→ Multiplying price changes by volume weight
→ Result: High-volume moves influence the oscillator more than low-volume noise
This helps filter false breakouts and emphasizes moves with participation.
WHY FISHER TRANSFORM?
Fisher Transform is a mathematical transformation that:
→ Normalizes probability distributions
→ Creates sharper turning points
→ Amplifies extremes while compressing the middle
→ Makes overbought/oversold levels more distinct
Applied to the Kinetic Pulse, it helps identify genuine extremes vs. noise.
WHY MULTI-OSCILLATOR DIVERGENCE?
Single-source divergence can give false signals. By requiring divergence confirmation across multiple oscillators (Kinetic Pulse, CCI, Stochastic), the system filters out:
→ Divergences caused by calculation quirks in one oscillator
→ Temporary momentum anomalies
→ False divergence on noisy, low-timeframe charts
Multiple sources confirming the same pattern increases reliability.
WHY ADAPTIVE PERIODS?
Fixed periods can be:
→ Too slow during high volatility (miss fast reversals)
→ Too fast during low volatility (generate noise)
The adaptive system:
→ Shortens period when ATR ratio > 1.3 (high volatility = need faster response)
→ Lengthens period when ATR ratio < 0.7 (low volatility = need noise filtering)
→ Keeps period in reasonable range (60% to 140% of base period)
→ Result: Oscillator adjusts to current market pace automatically
WHY HYSTERESIS IN STATE MACHINE?
Without hysteresis, the analysis state would flip-flop on every bar, creating:
→ Confusing, contradictory guidance
→ Analysis paralysis
→ Lack of actionable information
Hysteresis solves this by:
→ Using different thresholds to ENTER vs. EXIT a state
→ Example: Enter "Factors Aligned" at 72+ confidence, but don't exit until <62
→ This creates stable states that persist through minor fluctuations
→ Requires minimum commitment period (3 bars) before state changes
→ Overrides commitment for significant events (near TP/SL)
→ Result: Stable, trustworthy analysis that changes only when truly warranted
WHY CONFIDENCE SMOOTHING?
Raw factor scores fluctuate bar-by-bar based on momentary conditions. Smoothing:
→ Uses 5-period EMA on raw confidence scores
→ Filters out single-bar anomalies
→ Preserves genuine trends in confidence
→ Prevents false state transitions
→ Result: More reliable assessment of actual trade health
WHY INSTRUMENT-SPECIFIC PARAMETERS?
Different instruments have different characteristics:
→ Forex is highly liquid, respects technical levels well, standard ATR works
→ Crypto is extremely volatile, needs wider stops (1.8x) to avoid false stops
→ Indices respect session opens strongly, session weighting is important
→ Commodities fall in between
Auto-detection applies research-based multipliers automatically.
WHY STRUCTURE-BASED STOPS?
ATR-based stops can:
→ Place stop in middle of consolidation (easily hit)
→ Ignore obvious invalidation levels
→ Be too tight during expansion or too wide during contraction
Structure-based stops:
→ Use actual swing highs/lows (where traders actually place stops)
→ Add small ATR buffer to avoid stop hunting
→ Constrain within min/max ATR limits for safety
→ Result: Stops that respect market geometry while managing risk
DISCLAIMER & RISK WARNING
READ THIS CAREFULLY BEFORE USING THIS INDICATOR
This indicator is provided for EDUCATIONAL and INFORMATIONAL purposes only.
❌ NOT FINANCIAL ADVICE
This indicator does NOT constitute financial advice, investment recommendations, or solicitation to buy or sell any financial instrument. All information is for educational purposes only.
❌ NO GUARANTEES
→ Past performance does NOT guarantee future results
→ No indicator can predict future price movements with certainty
→ Signal grades represent confluence, NOT win probability
→ A+ signals can lose, B signals can win - markets are probabilistic
❌ SUBSTANTIAL RISK
Trading financial instruments involves SUBSTANTIAL RISK of loss:
→ You can lose your entire investment
→ Leveraged trading amplifies both gains AND losses
→ Never trade with money you cannot afford to lose
→ Never risk more than 1-2% of your account per trade
❌ YOUR RESPONSIBILITY
→ All trading decisions are YOUR responsibility
→ You must conduct your own analysis before entering trades
→ Consult a licensed financial advisor before trading
→ Understand the risks specific to your jurisdiction and situation
→ Only trade with capital you can afford to lose completely
❌ NO HOLY GRAIL
→ This indicator is a TOOL, not a complete trading system
→ It should be used as part of a broader analysis framework
→ Combine with your own technical analysis, risk management, and judgment
→ No indicator works 100% of the time in all market conditions
❌ ANALYSIS PANEL DISCLAIMER
The "Trade Analysis Panel" provides ALGORITHMIC ANALYSIS of market factors.
→ It does NOT provide investment advice or recommendations
→ Factor scores are mathematical calculations, not predictions
→ Guidance messages are informational, not directives
→ All trading decisions remain your responsibility
❌ BACKTESTING LIMITATIONS
→ This is an indicator, not a strategy, so no backtesting results are provided
→ Any backtesting you perform includes hindsight bias and optimization bias
→ Historical performance does not indicate future performance
→ Slippage, commissions, and real-world execution differ from backtests
❌ MARKET CONDITIONS
→ This indicator performs differently in trending vs. ranging markets
→ Extreme volatility can produce false signals or whipsaws
→ Low liquidity periods increase execution risk
→ Major news events can invalidate technical analysis
BY USING THIS INDICATOR, YOU ACKNOWLEDGE:
→ You have read and understood this disclaimer
→ You accept full responsibility for your trading decisions
→ You understand the substantial risks involved in trading
→ You will not hold the author liable for any losses incurred
→ You are using this tool as part of your own due diligence process
KEY FEATURES SUMMARY
✅ Volume-Weighted Kinetic Pulse Engine (proprietary momentum calculation)
✅ 15-Factor Confluence Scoring System (graded signals: A+, A, B)
✅ Multi-Oscillator Divergence Detection (Pulse + CCI + Stochastic)
✅ Higher Timeframe Trend Alignment Filter
✅ Adaptive Period Adjustment (volatility-responsive)
✅ Instrument-Aware Calibration (Forex, Crypto, Indices, Commodities)
✅ Structure-Based Stop Loss Calculation (respects swing highs/lows)
✅ Automated Trade Tracking (entry, stop, TP1, TP2, P/L)
✅ Real-Time Factor Analysis State Machine (5-state system with hysteresis)
✅ Session Awareness (Asian, London, New York, Overlap)
✅ Volatility Regime Detection (blocks signals in extreme conditions)
✅ Choppiness Filter (reduces signals in ranging markets)
✅ Volume Confirmation (relative volume and delta analysis)
✅ Clean Air Check (validates clear path to targets)
✅ Comprehensive Dashboards (market conditions + trade analysis)
✅ Customizable Display (3 signal styles, color themes, positioning)
✅ 9 Built-In Alert Conditions (signals, TP/SL hits, state changes)
✅ Fully Non-Repainting (barstate.isconfirmed, lookahead_off)
✅ Previous Day Levels (PDH/PDL reference lines)
✅ Mobile-Friendly Compact Mode (for smaller screens)
TECHNICAL SPECIFICATIONS
→ Pine Script Version: v6
→ Indicator Type: Overlay (displays on price chart)
→ License: Mozilla Public License 2.0
→ Copyright: BULLBYTE
→ Object Limits: 300 labels, 100 lines, 50 boxes
→ Memory Management: Automatic cleanup system (FIFO queue)
→ Repainting: Non-repainting (signals confirmed on bar close)
→ Timeframe Support: All timeframes (1s to Monthly)
→ Instrument Support: Forex, Crypto, Indices, Commodities, Stocks
→ HTF Data Handling: lookahead_off with historical offset
VERSION HISTORY
v1.0 - Initial Release
→ Kinetic Pulse engine with volume weighting and Fisher Transform
→ 15-factor confluence scoring system
→ Trade analysis state machine with hysteresis
→ Automated trade tracking and monitoring
→ Dual dashboard system (market conditions + factor analysis)
→ 9 alert conditions
→ 3 signal display styles
→ Instrument-aware calibration
→ Full risk management framework
WHO IS THIS INDICATOR FOR?
IDEAL FOR:
✓ Scalpers and day traders seeking high-confluence reversal entries
✓ Swing traders who want quality over quantity
✓ Traders who appreciate systematic, rules-based analysis
✓ Multi-timeframe traders who value HTF confirmation
✓ Forex traders who respect session timing
✓ Crypto traders needing volatility-adjusted parameters
✓ Traders who want complete trade management (entry, stop, targets)
✓ Analytical traders who want transparency in signal generation
NOT IDEAL FOR:
✗ Traders seeking a "set and forget" holy grail system
✗ Traders who don't want to learn the methodology
✗ Traders unwilling to accept losing trades as part of the process
✗ Traders who need constant signals (this is a quality-focused system)
✗ Traders who ignore risk management
FINAL THOUGHTS
The Kinetic Scalper is the result of extensive research into momentum behavior, volume confirmation, and multi-factor confluence analysis. It's designed to identify high-probability reversal setups while maintaining strict risk management and providing complete transparency.
This is NOT a magic solution. It's a sophisticated TOOL that requires:
→ Understanding of the methodology
→ Proper risk management discipline
→ Patience to wait for quality setups
→ Willingness to accept losses as part of trading
→ Integration with your own analysis and judgment
Used properly as part of a complete trading plan, the Kinetic Scalper can help you identify high-confluence opportunities and manage trades systematically.
Remember: Quality over quantity. Discipline over emotion. Risk management over everything.
Trade smart. Trade safe.
© 2025 BULLBYTE | Kinetic Scalper v1.0 | For Educational Purposes Only

RMI Valid FVG & IFVGRMI • Valid FVG & iFVG (Smart Money Concept)
RMI • Valid FVG & iFVG is a precision-focused Fair Value Gap indicator designed for traders who follow Smart Money Concepts (SMC) / ICT logic and want to filter out low-quality, random gaps.
This indicator does not plot every FVG.
It highlights only structurally relevant FVGs that form in the direction of the trend and have a high probability of being filled.
Core Features
Bullish & Bearish Fair Value Gaps
Inverse Fair Value Gaps (iFVG)
Trend-aligned FVG filtering
Automatic invalidation after mitigation
Clean background zones for clear visibility
Optimized for intraday trading
Adjustable settings for scalping, intraday & swing trading
Smart Filtering Logic
FVGs are validated using market structure context
Only FVGs that form within the active trend are displayed
Weak or low-probability gaps are ignored
Inverse FVGs appear after strong displacement and rejection
Zones are visually faded once mitigated
This helps reduce chart noise and keeps the focus on high-probability reaction zones.
Best Use Cases
Entry refinement after BOS / CHoCH
Confluence with liquidity grabs
Premium / discount zone trading
Intraday & session-based trading
Works well with ICT, SMC, price action & structure-based strategies
Recommended Timeframes
Scalping: M1 – M5
Intraday (default): M5 – M15
Swing Trading: M15 – H1
(Default settings are optimized for intraday trading.)
Important Notes
This is not a signal indicator
No repainting
No buy/sell arrows
Designed as a decision-support tool, not an automated system
Always combine with proper risk management and confirmation.
RMI • Precision over noise.
Trade structure, not randomness.

Universe Structure & Trend Zone [All-in-One]**Overview**
The "Universe Structure & Trend Zone" is a comprehensive all-in-one trading toolkit designed to combine Institutional Trend Following with Smart Money Concepts (SMC/ICT). It helps traders identify the dominant trend direction while providing precise entry points based on Market Structure Breaks (MSB) and Order Blocks.
This script aims to filter out market noise by allowing trades only when Price Action aligns with the long-term trend (SMA Zone).
**Key Features**
1. **Market Structure Breaks (MSB) & ZigZag:**
- Detects structural shifts in price (Bullish/Bearish MSB).
- Uses a default Signal Length of 10 to filter out minor swings and focus on significant structural changes.
- Visualizes high and low pivot points.
2. **Smart Trend Zone (SMA 200 Filter):**
- Incorporates a 200-period SMA Zone (Institutional Level) to determine the macro trend.
- **Trend Filter Logic:** The indicator intelligently filters signals. It displays Bullish Order Blocks only when the price is trending *above* the SMA Zone, and Bearish Order Blocks only *below* it. This drastically reduces false signals in choppy markets.
3. **Order Blocks (OB) & Breaker Blocks (BB):**
- Automatically identifies high-probability Order Blocks and Breaker Blocks.
- Includes optional filters for Volume and Premium/Discount zones to validate the blocks.
- Features an auto-cleanup mechanism to remove invalid or broken boxes, keeping the chart clean.
4. **Hull Moving Average (HMA):**
- A fast-reacting 55-period HMA is included to visualize short-term momentum shifts (Green for Bullish, Red for Bearish).
5. **Smart Range (Support/Resistance):**
- Plots the dynamic Highest High and Lowest Low of the selected timeframe (default 4H) to show the current trading range and Equilibrium (EQ) level.
**How to Use**
* **Step 1:** Check the **SMA Zone** (Gray/Green/Red Band). If Price > Zone, look for Longs. If Price < Zone, look for Shorts.
* **Step 2:** Wait for a **Market Structure Break (MSB)** label in the direction of the trend.
* **Step 3:** Look for an entry at the retest of an **Order Block (OB)** or **Breaker Block (BB)**.
* **Step 4:** Use the HMA color change as a confirmation trigger or trailing stop guide.
**Settings**
* **Signal Length:** Default is 10 (Optimized for standard swings).
* **Trend Filter:** Enabled by default (Recommended to stay with the trend).
* **Display:** You can toggle MSB lines, Boxes, and Labels on/off to suit your visual preference.
**Disclaimer**
This indicator is for educational purposes only and does not constitute financial advice. Always use proper risk management.
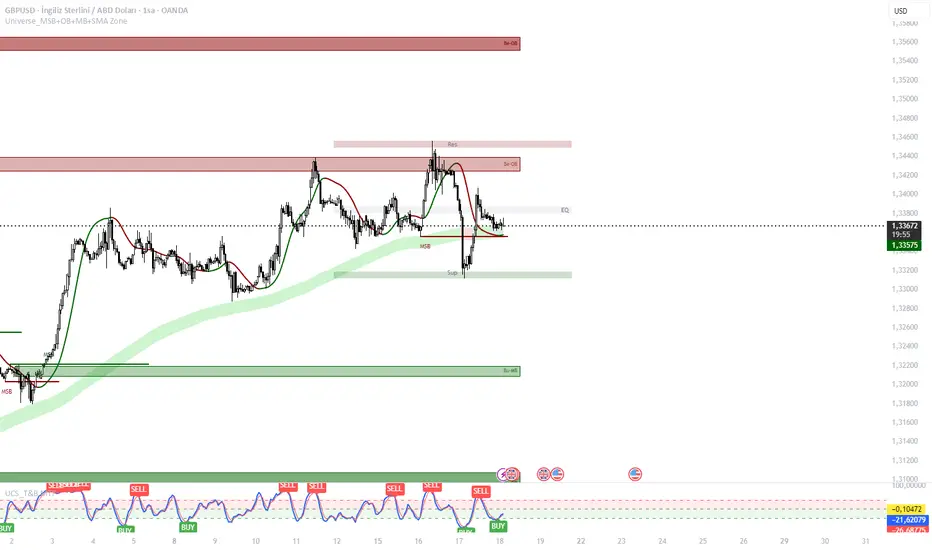
NVentures Liquidity Radar Pro**NVentures Institutional Liquidity Radar Pro (NV-ILR Pro)** is a comprehensive liquidity analysis tool engineered for traders who understand that price moves from liquidity to liquidity. This indicator reveals where stop orders cluster, where institutional players left their footprints, and where the next liquidity grab is likely to occur.
Unlike conventional support/resistance indicators, ILR Pro combines multiple institutional concepts into a unified confluence scoring system — helping you identify high-probability zones where significant price reactions are most likely.
⯌ **Multi-Layer Liquidity Detection**
> The core engine identifies swing-based liquidity pools where retail stop-losses typically cluster. Each zone is dynamically sized using ATR, ensuring relevance across all timeframes and instruments. Zones automatically fade over time through a freshness decay system, keeping your chart focused on what matters now.
⯌ **Institutional Order Block Detection**
> Order Blocks mark the last opposing candle before a strong institutional move — the footprint of smart money entering positions. ILR Pro automatically detects both bullish and bearish Order Blocks using volume confirmation and consecutive candle validation. When price returns to these zones, institutions often defend their positions.
⯌ **Fair Value Gap Integration (Optional)**
> FVGs represent price imbalances where aggressive orders created inefficiencies. These gaps often act as magnets for price or provide optimal entry zones for mean-reversion strategies. FVG detection is disabled by default for a cleaner chart experience — enable it in settings when you want the full picture.
⯌ **Smart Confluence Scoring**
> Each liquidity zone receives a confluence score based on multiple factors:
- Overlapping swing levels (+1 per overlap)
- Nearby Order Blocks (+1)
- Higher Timeframe alignment (+2 bonus)
Zones with scores of 4+ are highlighted as high-confluence areas where institutional activity is most concentrated.
⯌ **Higher Timeframe Confluence**
> A liquidity zone on your current timeframe gains significant weight when it aligns with HTF structure. ILR Pro automatically checks for HTF swing alignment and awards bonus confluence points — no manual multi-timeframe analysis required.
⯌ **Liquidity Sweep Detection**
> Not every break of a level is a true breakout. ILR Pro identifies sweep patterns where price penetrates a liquidity zone but closes back inside, indicating that liquidity was grabbed without genuine continuation. Swept zones are visually marked, helping you avoid false breakout traps.
⯌ **Mitigation & Test Tracking**
> The indicator tracks how many times price has tested each zone and automatically marks Order Blocks as mitigated once price fully trades through them. This helps you focus on fresh, untested levels with higher reaction probability.
⯌ **Volume-Weighted Significance**
> Zones formed on high relative volume carry more weight. The volume scoring system identifies where significant participation occurred, filtering out noise from low-volume price action.
**PRACTICAL APPLICATION**
**For Breakout Traders**
> Identify where liquidity pools cluster above/below current price. When price sweeps these zones and reverses, you have confirmation of a liquidity grab — often the precursor to the real move in the opposite direction.
**For Mean-Reversion Traders**
> Enable FVG detection and look for price returning to unfilled gaps within high-confluence liquidity zones. The combination of gap-fill tendency and institutional defense creates high-probability reversal setups.
**For Trend Traders**
> Use Order Blocks as pullback entry zones within established trends. When price retraces to a bullish OB in an uptrend (or bearish OB in a downtrend), institutions often step in to defend their positions.
**For Multi-Timeframe Analysts**
> The HTF confluence system does the work for you. Zones marked with "HTF" in the label align with higher timeframe structure — these are your highest conviction levels.
**CONFIGURATION GUIDE**
**Essential Settings**
- Swing Detection Length: 5-8 for intraday, 8-15 for swing trading
- HTF Timeframe: One or two timeframes above your trading TF (e.g., D for H4 charts)
- Min Confluence to Display: 2 for comprehensive view, 3-4 for only high-probability zones
**Visual Clarity**
- FVGs are disabled by default — enable under "Fair Value Gaps" section when needed
- Zone transparency adjustable from 50-95%
- Label size options: tiny, small, normal
**Performance Optimization**
- Reduce Max Zones/OBs/FVGs for faster loading on lower-end systems
- Decrease Lookback Period for intraday scalping
**WHAT MAKES THIS DIFFERENT**
Most liquidity indicators simply draw lines at swing highs and lows. ILR Pro goes further:
→ **Confluence over quantity** — Not all levels are equal. The scoring system highlights where multiple institutional concepts align.
→ **Dynamic relevance** — Freshness decay ensures old, tested levels fade while fresh zones remain prominent.
→ **Sweep intelligence** — Distinguishes between genuine breakouts and liquidity grabs through wick analysis.
→ **Institutional integration** — Combines retail liquidity pools with smart money concepts (OBs, FVGs) in one unified tool.
→ **HTF awareness** — Automatic higher timeframe validation without switching charts.
**STATISTICS PANEL**
The built-in statistics table displays:
- Active resistance/support zones
- High confluence zone count
- Swept zone count
- Active Order Blocks
- Active FVGs (when enabled)
- Current ATR value
- Selected HTF
**ALERTS INCLUDED**
- Price approaching high confluence zone
- Liquidity sweep detected
- Bullish/Bearish Order Block formed
- Bullish/Bearish FVG detected (when enabled)
**NOTES**
This indicator works on all markets and timeframes. For optimal results on Forex, consider using Daily as your HTF for H1-H4 trading. For indices and crypto, Weekly HTF often provides stronger confluence.
The indicator uses User-Defined Types (UDTs) for clean data management and respects Pine Script's drawing limits (500 boxes/labels/lines).
**DISCLAIMER**
This indicator is for educational and informational purposes only. It does not constitute financial advice. All trading decisions are solely your responsibility. Past performance of any trading system or methodology is not indicative of future results.

Warpath Structure + Liquidity Tool (Updated - V3)Warpath visually organizes the key elements required to trade Gold professionally:
1. Market Structure Clarity
Automatically labels HH / HL / LH / LL on major pivot points (current chart timeframe). Makes directional bias immediately obvious. Helps prevent counter-trend trading in strong expansions.
2. Liquidity Sweep Detection (Wick-Only)
Highlights true liquidity sweeps using wick behavior (no breakout guessing). Marks the sweep wick with user-defined colors. Draws a swept-zone box that extends forward to show where liquidity was taken. Designed to identify fuel vs reversal behavior in trends.
3. Key Session Levels
Automatically plots:
Asian High / Low
Previous Day High / Low
Equal Highs / Equal Lows from current timeframe and higher timeframes (1H / 4H / Daily)
These levels represent where price is likely to react, not where trades should be forced.
4. Multi-Confluence HTF Bias Dashboard
Small dashboard showing bias for 15M, 1H, 4H, and Daily timeframes. Each timeframe bias is calculated using four confluence factors:
EMA Stack: 8/21/50 alignment and price position relative to EMAs
Structure: Recent HH/HL vs LH/LL pivot behavior
Price Patterns: Engulfing candles, hammers, double bottoms/tops, break of structure
Momentum: Recent candle direction and close trend
Displays a confluence score (e.g., "BULLS (4)") so you can see signal strength, not just direction. Overall bias weights higher timeframes more heavily for smarter alignment.
5. Trade Positioning Dashboard
Replaces basic overbought/oversold readings with actionable positioning context:
Range Position: Shows exactly where price sits within the selected range (Previous Session, Previous Day, or Weekly) as a percentage. Zones include Deep Discount (0-25%), Discount (25-40%), Equilibrium (40-60%), Premium (60-75%), and Deep Premium (75-100%).
VWAP Deviation: Displays distance from VWAP in standard deviations (σ). Readings beyond ±1.5σ indicate meaningful extension. Readings beyond ±2σ suggest caution on continuation and potential mean reversion.
Trade Favor: Combines HTF bias alignment, range position, and VWAP deviation into a single directional score. Displays as "LONGS ●●●○" or "SHORTS ●●○○" so you know at a glance whether conditions favor continuation or reversal.
6. Continuation Reload Awareness (Strong Trend Environments)
Built to handle markets that:
Remain overbought
Stay in premium
Sweep buy-side liquidity repeatedly
The multi-confluence scoring system catches trend continuation setups (like higher lows forming with bullish momentum) even before swing structure fully confirms. Supports compression → expansion continuation behavior. Prevents missed participation during multi-day trends without abandoning discipline.

Lot Size Panel Lite Multi (@JP7FX)Lot Size Panel Lite Multi is a fast, no-nonsense risk and position sizing tool built for active traders who need answers immediately.
This indicator removes all chart clutter and focuses on one thing only. Correct lot size based on your stop loss and risk.
It is designed for scalpers, day traders, and funded account traders who do not want complex menus or slow workflows.
What it does
Calculates precise lot size from stop loss and risk
Supports percentage risk or fixed cash risk
Works across Forex, Gold, Crypto, Index/CFD, and Stocks
Displays results in a clean on-chart panel
Supports multiple accounts at once
Key features
Risk first layout. Stop loss and risk inputs are at the top
Multi account support with A1 enabled by default
Per account currency handling with automatic FX conversion
Manual FX fallback option when TradingView rates are unavailable
Customisable panel colours and layout
Movable panel with multiple screen positions
How to use
Select your Asset Type
Enter your Stop Loss in pips
Choose Risk mode
Percent uses account balance
Cash risks a fixed amount
Set your account balance and currency
Read the calculated lot size instantly
Index and CFD users
For Index and Stock instruments, set the “value per pip per 1 lot” to match your broker.
Example:
If 1 lot equals $10 per point, enter 10
Who this is for
Traders who execute fast and want zero friction
Prop firm traders managing multiple accounts
Traders who want correct risk every trade without thinking
This is the Lite version of the JP7FX lot sizing tools.
It strips everything back to speed, clarity, and accuracy.
Trade smart.
JP7FX

GHOST SNIPERGHOST SNIPER™ – BB Reversal Engine + Smart Entry / Exit Structure Core
MNQ / MES / Stocks / ETFs / Crypto / FX
BB Reversals · Breakouts · PD Structure · Liquidity Sweeps · Displacement · Smart Targets · Quick SL & TP Logic
________________________________________
Summary
Ghost Sniper™ is a high-precision reversal and breakout engine designed for intraday scalping on MNQ/MES, while remaining highly effective across equities, ETFs, crypto, and FX.
It blends a custom Bollinger Reversal Framework (BB Bottom / BB Top Sniper) with an internal ICT-style structure core to filter noise and isolate only high-quality turning points.
The system reads stretch and failure conditions, detects band breakouts, and identifies Bollinger Band failures to anticipate sharp reversals. It includes a Quick TP (QTP) and Quick SL (SL-Q) module for micro-scalps, along with full ICT-style structural targets (TP1, TP2, TP3) for extended runs.
All TP levels and SL placement are derived from smart structural logic, designed to reduce premature stop-outs and improve fill reliability during volatility.
Real-time intrabar logic ensures entries trigger the moment structure confirms — no repainting.
________________________________________
BUY / SELL Signal Activation & Checklist HUD
Ghost Sniper™ uses a rule-based BUY / SELL triggering system driven by real-time structural confirmation — not delayed indicators or hindsight logic.
Entries only activate when a multi-condition internal checklist aligns, combining:
• Bollinger stretch, failure, or breakout behavior
• Liquidity sweep or rejection context
• Micro structure confirmation (BOS / displacement)
• Premium / Discount positioning
• Momentum and reversal candle confirmation
A built-in Checklist Activation HUD visually displays when conditions are forming, aligning, or fully confirmed, allowing traders to see why a signal is valid — not just that it fired.
BUY / SELL signals trigger only when checklist confirmation is reached, filtering low-probability setups and maintaining clean, high-quality entries.
All logic operates intrabar and in real time, with no repainting.
________________________________________
Market Structure & Context Awareness
Ghost Sniper™ incorporates a streamlined ICT-inspired framework, including:
• Liquidity sweep awareness (stop-runs and grabs)
• Micro BOS confirmation
• Premium / Discount context
• Impulse and displacement reads
• Reversal candle assist
• Optional PD / HTF alignment gates
To support institutional-grade context without visual clutter, Ghost Sniper™ also includes a comprehensive set of fully optional, user-selectable tools, allowing traders to tailor the chart to their workflow:
• VWAP
• Up to 5 configurable moving averages
• Bollinger Bands
• Automatic liquidity sweep level detection
• Opening Range Breakout (ORB)
• Midnight Open
• 9:30 AM New York Open
• Previous Day High / Low (PDH / PDL)
• Previous Week High / Low (PWH / PWL)
• Current Week High / Low (CWH / CWL)
• Monthly High / Low
• Previous Month High / Low (PMH / PML)
• Global session tracking, including:
o Asia Session
o London Session
o New York Session
All levels and context tools are individually selectable, designed to provide structure and bias awareness while keeping charts clean and focused.
________________________________________
Execution & Risk Logic
Ghost Sniper™ automatically prints clean, minimal BUY / SELL signals, intelligent stop placement, and progressive target logic:
QTP → TP1 → TP2 → TP3
A built-in Break-Even engine, structural invalidation logic, and one-trade-at-a-time control help maintain disciplined execution and consistent risk management.
Designed for traders who want a fast, decisive, and high-probability entry engine without visual noise or unnecessary complexity.
________________________________________
Disclaimer
This tool is for educational and research purposes only and is not financial advice.
Always test thoroughly in replay or paper trading before using in live markets.

The Physics Engine [@Ash_TheTrader]🏛️ Welcome to the Physics of Finance
By @Ash_TheTrader
Traditional technical analysis often relies on "lagging" indicators. Tools like the RSI or moving averages tell you where price has been. While useful, they are like driving a car looking only in the rearview mirror.
The Kinematic Impulse Engine (KIE) is different. It is designed to be a leading indicator of momentum shifts.
It doesn't just look at price; it treats price action like a physical object moving through space to measure its Velocity (Speed), Acceleration (G-Force), and Mass (Volume). By understanding the physics behind a move, we can determine if a trend is a powerful impulse or an exhausted drift waiting to reverse.
⚛️ The Core Concept: Trading with G-Force
If you step on the gas pedal in a car, you feel pushed back into your seat. That is acceleration (positive G-Force). When you slam on the brakes, you are thrown forward. That is deceleration (negative G-Force).
The market works the same way.
Standard momentum indicators only measure speed. The KIE measures how fast that speed is changing.
The Problem with Standard Indicators: Price can be moving higher (high speed), but the rate at which it is moving higher is slowing down (deceleration). A standard indicator will still look bullish right up until the reversal happens.
The KIE Solution: The KIE detects that deceleration instantly, warning you that the "G-Force" pushing the price up has vanished, often before the price peaks.
🎨 Visual Decoder: Reading the Heatmap
We have eliminated the need to stare at complex oscillator lines below your chart. The KIE paints the candles directly based on their "Kinetic Energy."
1. Neon Cyan : The Impulse (High G-Force) 🚀
Physics State: High Velocity + Positive Acceleration.
Meaning: The market has "pedal to the metal." Buyers are aggressive, and the move is speeding up. This is where you want to be in a trade.
Signal: Look for the small triangles (🚀) marking the start of these impulse moves out of the noise.
2. Deep Purple : Exhaustion (Braking) 🛑
Physics State: High Velocity + Negative Acceleration (Deceleration).
Meaning: The car is still moving forward fast, but the driver has taken their foot off the gas or hit the brakes.
Signal: This is a massive warning sign. If you are long and candles turn purple, the trend is running on fumes. Expect consolidation or a reversal soon.
3. Dark Gray : Equilibrium (Chop) 💤
Physics State: Low Velocity.
Meaning: No significant energy present. The market is chopping sideways.
Signal: Stay out of the market or use range-bound strategies.
⚠️ Unique Feature: Gravity Divergence Detection
This is the most powerful feature of the Kinematic Impulse Engine. It detects when price action is defying the laws of physics.
Imagine throwing a ball into the air. As it reaches the very peak of its arc, it is still moving upward, but gravity is decelerating it rapidly just before it falls back down.
The KIE detects this exact moment in the market:
Gravity Sell Signal: Price makes a new high, but Acceleration (G-Force) crashes rapidly. The market is fighting gravity and will likely snap back.
If you see a "GRAVITY" label pop up on a Deep Purple candle at a high, take notice.
🧠 The Engine Room (Under the Hood)
For the technical traders, here is how @Ash_TheTrader designed the engine:
Relative Velocity: Price changes are normalized against Average True Range (ATR) volatility. A $10 move in Bitcoin is not the same as a $10 move in a penny stock; the KIE adjusts for this automatically.
Mass Integration (Volume Weighting): In physics, Force = Mass x Acceleration. The KIE optionally uses relative Volume as "Mass." A move backed by high volume has more "weight" and is harder to stop than a low-volume move.
The HUD: The on-screen dashboard gives you real-time readings of the current Velocity and raw G-Force metrics, along with an instant trend status summary.
🛡️ How to Use This in Your Trading
The Breakout Trader: Wait for gray candles (chop). Enter when the first Neon Cyan candle appears, ideally accompanied by an Impulse Triangle (🚀). Ride the cyan until it turns purple.
The Reversal Trader: Wait for an extended run of cyan candles. When the candles turn Deep Purple and you see a "GRAVITY" warning label, look for shorting opportunities as the momentum is exhausted.
Trade smart. Trade with physics.
Developed by @Ash_TheTrader
