London Breakout Tracker - Box Style📊 London Breakout Tracker (Pine Script v6)
This script is designed to track the Asian session range and identify breakout opportunities when the London session begins. It highlights high-probability trade setups and helps avoid fakeouts or overly wide ranges.
🧱 1. Session Time Definitions (Adjusted for Kenyan Time)
The Asian session is defined as:
3:00 AM to 11:00 AM (Kenyan Time)
🔐 2. Asian Session High & Low
During the Asian session:
The script tracks the highest high and lowest low to define the range.
These are stored in variables: asianHigh and asianLow.
🧊 3. Box Drawing for the Asian Range
Once the Asian session ends:
A visual box is drawn around the session using box.new().
This box spans from the session start to end bars and from the high to low.
It helps visually see the range price must break out from.
🚨 4. Breakout Signals
After the Asian session:
A Long Breakout signal is generated if:
The candle closes above the Asian High.
A Short Breakout signal is generated if:
The candle closes below the Asian Low.
This corresponds to 00:00 to 08:00 UTC
These are shown with:
✅ Green up label for long breakouts
❌ Red down label for short breakouts
🧯 5. Fakeout Detection
If price breaks out but closes back inside the Asian range, it’s marked as a Fakeout:
Long Fakeout: Price breaks above high, then closes back below.
Short Fakeout: Price breaks below low, then closes back above.
These are marked with orange X-crosses above or below candles.
⚠️ 6. Wide Range Filter
If the Asian session range is too wide (e.g. > 40 pips), a gray background is drawn.
This warns you not to trade that day since breakouts from wide ranges are unreliable.
📣 7. Alert Conditions
The script can trigger alerts in TradingView when:
🔔 A Long or Short Breakout occurs
⚠️ A Fakeout is detected
You can set these up via the TradingView alert system.
🎯 Overall Purpose:
The script helps you:
Clearly see the Asian session range
Identify breakout opportunities at the London open
Avoid trading during fakeouts or wide-range sessions
Get alerted when breakout/fakeout conditions occur
스크립트에서 "session high"에 대해 찾기

Advanced Session Profile Predictor with SR Boxes & ORAdvanced Session Profile Predictor with Momentum Arrows
Designed for intraday traders, this indicator analyzes price action across Asia, London, and New York sessions to predict market profiles and highlight key trading opportunities. By combining session-based profiling, Opening Range (OR) visualization, and momentum signals from Traders Dynamic Index (TDI), it offers a unique tool for anticipating trends, reversals, and breakouts. Ideal for forex, indices, and crypto on 15M–1H charts.
What Makes This Indicator Unique?
Unlike typical session indicators that only mark time zones or standard TDI scripts that focus on momentum, this tool:
Predicts market profiles (e.g., "Trend Continuation," "NY Manipulation") by analyzing session ranges and directional moves, offering actionable insights into how sessions interact.
Visualizes Opening Range (OR) boxes for the first 15 minutes of each session, helping traders spot early breakout levels.
Integrates TDI with momentum to generate precise bullish/bearish arrows, filtered by session context for improved reliability.
Simplifies decision-making with dynamic profile labels showing real-time long/short conditions based on price levels.
How Does It Work?
Session Tracking:
Asia (00:00–08:00 UTC, yellow), London (08:00–16:00 UTC, red), and New York (13:00–21:00 UTC, blue) sessions are highlighted with background colors and high/low lines (crosses).
OR boxes (first 15 minutes) are drawn for each session: yellow for Asia, red for London, blue for NY.
Profile Prediction:
Compares Asia and London session ranges and directions (e.g., trending if range > 1.5x 5-period SMA).
Examples:
Trend Continuation: Asia and London trend in the same direction—long above Asia high (uptrend) or short below Asia low (downtrend).
NY Manipulation: Asia trends, London consolidates—watch for NY breakouts at London high/low.
Displays the predicted profile and entry conditions in labels (e.g., "IF price hits 1.2000 LONG").
Momentum Arrows:
Uses TDI (RSI period 21, bands 34, fast MA 2) and 12-period momentum.
Green up arrow: Fast MA > upper band (>68) and momentum rising (bullish).
Red down arrow: Fast MA < lower band (<32) and momentum falling (bearish).
Support/Resistance (SR):
Plots dynamic SR boxes based on pivot highs/lows, filtered by volume (inspired by ChartPrime’s methodology, credited below).
How to Use It
Setup: Apply to a 15M–1H chart. Adjust time zone (default: UTC) and session times if needed. Customize TDI/momentum settings for sensitivity.
Trading:
Check the top-right labels for the current profile and entry conditions (e.g., "IF price hits LONG/SHORT").
Confirm entries with green up arrows (bullish) or red down arrows (bearish).
Use OR boxes and session high/low lines to identify breakout or reversal levels.
Example: In "NY Manipulation," wait for price to hit London high (long) or low (short) during NY session, confirmed by an arrow.
Best Markets: Forex (EUR/USD), indices (SPX500), crypto (BTC/USD) with sufficient intraday volatility.
Underlying Concepts
Session Profiling: Detects trends (range > SMA * threshold) and manipulation (e.g., London breaking Asia’s high/low) to predict NY behavior.
OR Boxes: Marks the first 15 minutes’ high/low as a breakout zone (time-based, 900,000 ms).
TDI + Momentum: Combines RSI-based bands with price change (close – close ) for momentum signals.
SR Boxes: Identifies pivots over a lookback period (default 20), scaled by ATR and filtered by volume thresholds.
Credits
The SR box logic is inspired by ChartPrime’s volume-filtered support/resistance methodology, adapted with custom breakout/hold detection. Original authors are credited for their foundational work.
Chart Setup
Displays session backgrounds, OR boxes, high/low lines, TDI arrows, and profile labels. Keep other indicators off for clarity.

Pre-London High-Low Breakout IndicatorOverview
The Pre-London High-Low Breakout Indicator helps traders identify breakout opportunities at the London session open. It marks the high and low one hour before London opens (5 PM - 6 PM AEST) and incorporates a 200 SMA filter to confirm trade direction. The indicator also provides real-time breakout markers for precise entries.
How the Indicator Works
1. Pre-London High & Low Identification (5 PM - 6 PM AEST)
The indicator tracks the highest and lowest price levels within this period.
These levels act as key breakout zones once London opens.
The high and low remain visible until 12 AM AEST for reference.
2. 200 SMA as a Trend Filter
A 200 SMA (yellow, thick line) is plotted to filter breakout trades.
Only long (buy) trades are valid if price is above the 200 SMA.
Only short (sell) trades are valid if price is below the 200 SMA.
3. Real-Time Breakout Confirmation
Buy Signal (Green Diamond):
Price breaks above the pre-London high.
Price is above the 200 SMA.
Sell Signal (Red Diamond):
Price breaks below the pre-London low.
Price is below the 200 SMA.
No signal appears if the breakout is against the SMA trend, reducing false trades.
How to Use the Indicator Properly
Step 1: Identify the Pre-London Range (5 PM - 6 PM AEST)
Observe price movements and note the session high & low.
Do not take trades within this period—wait for a clear breakout.
Step 2: Wait for a Breakout After 6 PM AEST
A breakout must occur beyond the session high or low.
The breakout should be clear and decisive, not hovering around the range.
Step 3: Confirm with the 200 SMA
If price is above the 200 SMA, only buy signals are valid.
If price is below the 200 SMA, only sell signals are valid.
If a breakout occurs against the SMA, ignore it.
Step 4: Enter the Trade and Manage Risk
Enter the trade after the breakout candle closes.
Set stop-loss just inside the pre-London range to minimize risk.
Take profit using a 1:2 or 1:3 risk-reward ratio, or trail the stop.
Why This Strategy Works
Pre-London Liquidity Grab: Institutional traders set positions before the London open, making this range significant.
Trend Confirmation with SMA: Reduces false breakouts by filtering trades in the direction of the trend.
Real-Time Breakout Detection: Green and red diamond markers highlight valid breakouts that meet all conditions.
Final Notes
If price breaks out but quickly reverses, it may be a false breakout—avoid impulsive trades.
The indicator works best when combined with other confluences such as volume analysis or key support/resistance levels.
Alerts can be added to notify traders when a valid breakout occurs.
This setup is ideal for traders looking for a structured, rule-based approach to trading London session breakouts with a strong trend confirmation mechanism.

FT SessionsFT Sessions
Overview
The FT Sessions is a highly customizable and powerful indicator designed for intraday traders who focus on session-based analysis. This script visually highlights global market sessions—Asia, Frankfurt, London, and New York (AM & PM)—on the chart, making it easier to track session ranges and analyze intraday price movements.
Key Features
Customizable Session Times and Colors:
Define your own session times and assign unique colors for better visibility.
Session Range Visualization:
Displays high and low ranges for each session.
Optional transparent range areas with outlines for clarity.
Configurable session range labels for enhanced readability.
Flexible Timezone Settings:
Choose a UTC offset or sync with the exchange's timezone.
User-Friendly Customization:
Compact settings for easier adjustments.
Enable or disable specific sessions to focus on relevant market activity.
How This Script Differs from LuxAlgo
This script draws inspiration from LuxAlgo's session tracking concept but has been developed with significant modifications and unique features:
Built from Scratch in Pine Script v5:
Fully optimized for Pine Script’s latest version, improving performance and functionality.
Expanded Session Range Features:
Five unique sessions (Asia, Frankfurt, London, New York AM, New York PM) with customizable ranges, colors, and labels.
Real-time updating of session ranges for improved intraday analysis.
4H Timeframe Optimization:
Automatically notifies users if applied to an unsupported timeframe, ensuring session accuracy.
Highly Configurable Input Options:
Advanced timezone handling and compact session management settings.
Unique Coding Structure:
Designed to maximize efficiency and minimize resource usage on TradingView.
While LuxAlgo focuses on session concepts, this script brings a fresh, customizable approach specifically tailored for intraday traders seeking precision in tracking session activity.
How It Works
The indicator tracks price movements within each session.
Highlights the high and low range of each session directly on the chart.
Updates session ranges in real-time to reflect evolving market conditions.
Practical Applications
Intraday Trading: Plan trades based on major market session ranges.
Breakout Strategies: Use session high and low levels to identify potential breakouts.
Session-Specific Patterns: Spot consolidations and reversals within session activity.
Important Notes
Optimized for the 4H timeframe. If applied to another timeframe, a notification will appear.
Best used in combination with other tools (e.g., volume or trend indicators) for a complete trading strategy.
Credits
This script draws inspiration from LuxAlgo's open-source session-tracking methodology. However, it introduces substantial improvements and unique features that set it apart. Full credit is given to LuxAlgo for their original open-source concept.
Disclaimer
This script is for informational and educational purposes only. Always test on a demo account before applying to live markets.

Session Range Breakouts With Targets [AlgoAlpha]⛓️💥Session Range Breakouts With Targets 🚀
Introducing the "Session Range Breakouts With Targets" indicator by AlgoAlpha, a powerful tool for traders to capitalize on session-based range breakouts and identify precise target zones using ATR-based calculations! Whether you trade the Asian, American, European, or Oceanic sessions, this script highlights key breakout levels and targets that adapt to market volatility, ensuring you're always prepared for those crucial price movements. 🕒📊
Session-based Trading : The indicator highlights session-specific ranges, offering clear breakouts for Asian, American, European, Oceanic, and even custom sessions 🌍.
Adaptive Volatility Zones : Uses ATR to determine dynamic zone widths, filtering out fakeouts and adjusting to market conditions ⚡.
Precise Take-Profit Targets : Set multiple levels of take-profits based on ATR multipliers, ensuring you can manage both aggressive and conservative trades 🎯.
Customizable Appearance : Tailor the look with customizable colors for session highlights and breakout zones to fit your chart style 🎨.
Alerts on Key Events : Built-in alert conditions for breakouts and take-profit hits, so you never miss a trading opportunity 🔔.
🚀 Quick Guide to Using the Indicator
🛠 Add the Indicator : Add the indicator to favorites by pressing the star icon. Choose your session (Asia, America, Europe, Oceana, or Custom) and adjust the ATR length, zone width multiplier, and target multipliers to suit your strategy.
📊 Analyze Breakouts : Watch for the indicator to plot upper and lower range boxes based on session highs and lows. Price breaking through these boxes will signal a potential entry.
📈 Monitor Targets : Track bullish and bearish targets as price moves, with up to three take-profit levels based on ATR multipliers.
🔔 Set Alerts : Enable alerts for session breakouts or when price hits your designated take-profit targets.
🔍 How It Works
This script operates by identifying session-specific ranges based on highs and lows from the beginning of the selected session (Asia, America, Europe, or others). After a user-defined wait period (default: 120 bars), it calculates the highest and lowest points and creates upper and lower zones using the Average True Range (ATR) to adapt to market volatility. If the price breaks above or below these zones, it is identified as a breakout, and the script dynamically calculates up to three take-profit targets for both bullish and bearish scenarios using an ATR multiplier. The indicator also includes alerts for breakouts and take-profit hits, providing real-time trading signals.

Statistics: High & Low timings of custom session; 1yr historyGet statistics of the Session High and Session Low timings for any custom session; based on around 1yr of data.
//Purpose:
-To get data on the 'time of day' tendencies of an asset.
-Narrow in on a custom defined session and get statistics on that session.
//Notes:
-Input times are always in New York time (but changing the timezone after setting WILL adust both table stats and background highlight correctly.
-For particularly long sessions, make sure text size is set to 'tiny' (very long vertical table), or adjust table to display horizontally.
-You'll notice most assets show higher readings around NY equities open (9:30am NY time). Other assets will have 'hot-spots' at other times too.
-Timings represent the beginning of a 15m candle. i.e. reading for 15:45 represents a high occurring between 15:45 and 1600.
-Premium users should get 20k bars => around 1year's worth of data on a 15minute chart. Days of history is displayed in the top left corner of the table.
//Limitations
-only designed and working on 15minute timeframe (to gather a full year of meaningful/comparable % stats, need 15minute 'buckets' of time.
-sessions cannot cross through midnight, or start at midnight (00:15 is ok). 00:15 >> 23:45 is the max session length. On BTC, same applies but 01:00 instead of midnight (all in NY time).
-if your session crosses through 'dead time' (e.g. 17:00-18:00 S&P NY time); table will correctly omit these non-existent candles, but it will add on the missing hour before the start time.
//Cautionary note:
-Since markets are not uncommonly in a trending state when your defined session starts or ends, the high/low timings % readings for start and end of session may be misleadingly high. Try to look for unusually high readings that are not at the start/end of your session.
Wheat (ZW1!) 15min chart; Table displayed vertically:
Nasdaq (NQ1!) 15m chart; Table displayed horizontally and with smaller text to view a very long custom session:

Session TPO Market ProfileIntroduction
Wikipedia: A Market Profile is an intra-day charting technique (price vertical, time/activity horizontal) devised by J. Peter Steidlmayer, a trader at the Chicago Board of Trade (CBOT), ca 1959-1985. Steidlmayer was seeking a way to determine and to evaluate market value as it developed in the day time frame. The concept was to display price on a vertical axis against time on the horizontal, and the ensuing graphic generally is a bell shape--fatter at the middle prices, with activity trailing off and volume diminished at the extreme higher and lower prices. In this structure he recognized the 'normal', Gaussian distribution he had been introduced to in college statistics.
Important : The market profile tool is designed to be used on the 30min timeframe, however, you can modify its parameters and use it on lower timeframes (15/10/5min)
This indicators displays the following information
Session open
TPO
Value area calculation zone
POC
Highlight of Single prints
Session High/Low
The current price (TPO Profile is often used isolated without any candlesticks on it)
Parameters
Session beginning configuration (not coded with a session input yet)
Number of candles to use for calculation (default 13 for a single session)
Extend yesterday's levels (VAH/VAL/POC)
Show/Hide Market profile calculation area (background color)
Bars number (number of rows that will be used to draw the profile)
Show/Hide TPO's
TPO Colors customization (For in/out of VA, VAL/VAH/POC/High/Low levels and single prints)
Show/Hide High/Low levels
Show/Hide VAL/VAH/POC Levels as lines
Enable/Disable Single prints highlighting
Value area size (as percent)
Show/Hide current price (corresponding to a line scaled on the "close" price)
Additional Notes
Each session is drawn when the day is over
To use as much space as possible, TPO's are not directly drawn on the area of their calculation (which can be confusing if you use candlesticks directly over it)
This script will probably be updated in the future (especially concerning its implementation which is a bit spaghetti coded for now) .
If you have interesting suggestions about new features that are usual within market profile tools and missing from this script , don't hesitate to suggest it.

Volume Profile [Makit0]VOLUME PROFILE INDICATOR v0.5 beta
Volume Profile is suitable for day and swing trading on stock and futures markets, is a volume based indicator that gives you 6 key values for each session: POC, VAH, VAL, profile HIGH, LOW and MID levels. This project was born on the idea of plotting the RTH sessions Value Areas for /ES in an automated way, but you can select between 3 different sessions: RTH, GLOBEX and FULL sessions.
Some basic concepts:
- Volume Profile calculates the total volume for the session at each price level and give us market generated information about what price and range of prices are the most traded (where the value is)
- Value Area (VA): range of prices where 70% of the session volume is traded
- Value Area High (VAH): highest price within VA
- Value Area Low (VAL): lowest price within VA
- Point of Control (POC): the most traded price of the session (with the most volume)
- Session HIGH, LOW and MID levels are also important
There are a huge amount of things to know of Market Profile and Auction Theory like types of days, types of openings, relationships between value areas and openings... for those interested Jim Dalton's work is the way to come
I'm in my 2nd trading year and my goal for this year is learning to daytrade the futures markets thru the lens of Market Profile
For info on Volume Profile: TV Volume Profile wiki page at www.tradingview.com
For info on Market Profile and Market Auction Theory: Jim Dalton's book Mind over markets (this is a MUST)
BE AWARE: this indicator is based on the current chart's time interval and it only plots on 1, 2, 3, 5, 10, 15 and 30 minutes charts.
This is the correlation table TV uses in the Volume Profile Session Volume indicator (from the wiki above)
Chart Indicator
1 - 5 1
6 - 15 5
16 - 30 10
31 - 60 15
61 - 120 30
121 - 1D 60
This indicator doesn't follow that correlation, it doesn't get the volume data from a lower timeframe, it gets the data from the current chart resolution.
FEATURES
- 6 key values for each session: POC (solid yellow), VAH (solid red), VAL (solid green), profile HIGH (dashed silver), LOW (dashed silver) and MID (dotted silver) levels
- 3 sessions to choose for: RTH, GLOBEX and FULL
- select the numbers of sessions to plot by adding 12 hours periods back in time
- show/hide POC
- show/hide VAH & VAL
- show/hide session HIGH, LOW & MID levels
- highlight the periods of time out of the session (silver)
- extend the plotted lines all the way to the right, be careful this can turn the chart unreadable if there are a lot of sessions and lines plotted
SETTINGS
- Session: select between RTH (8:30 to 15:15 CT), GLOBEX (17:00 to 8:30 CT) and FULL (17:00 to 15:15 CT) sessions. RTH by default
- Last 12 hour periods to show: select the deph of the study by adding periods, for example, 60 periods are 30 natural days and around 22 trading days. 1 period by default
- Show POC (Point of Control): show/hide POC line. true by default
- Show VA (Value Area High & Low): show/hide VAH & VAL lines. true by default
- Show Range (Session High, Low & Mid): show/hide session HIGH, LOW & MID lines. true by default
- Highlight out of session: show/hide a silver shadow over the non session periods. true by default
- Extension: Extend all the plotted lines to the right. false by default
HOW TO SETUP
BE AWARE THIS INDICATOR PLOTS ONLY IN THE FOLLOWING CHART RESOLUTIONS: 1, 2, 3, 5, 10, 15 AND 30 MINUTES CHARTS. YOU MUST SELECT ONE OF THIS RESOLUTIONS TO THE INDICATOR BE ABLE TO PLOT
- By default this indicator plots all the levels for the last RTH session within the last 12 hours, if there is no plot try to adjust the 12 hours periods until the seesion and the periods match
- For Globex/Full sessions just select what you want from the dropdown menu and adjust the periods to plot the values
- Show or hide the levels you want with the 3 groups: POC line, VA lines and Session Range lines
- The highlight and extension options are for a better visibility of the levels as POC or VAH/VAL
THANKS TO
@watsonexchange for all the help, ideas and insights on this and the last two indicators (Market Delta & Market Internals) I'm working on my way to a 'clean chart' but for me it's not an easy path
@PineCoders for all the amazing stuff they do and all the help and tools they provide, in special the Script-Stopwatch at that was key in lowering this indicator's execution time
All the TV and Pine community, open source and shared knowledge are indeed the best way to help each other
IF YOU REALLY LIKE THIS WORK, please send me a comment or a private message and TELL ME WHAT you trade, HOW you trade it and your FAVOURITE SETUP for pulling out money from the market in a consistent basis, I'm learning to trade (this is my 2nd year) and I need all the help I can get
GOOD LUCK AND HAPPY TRADING

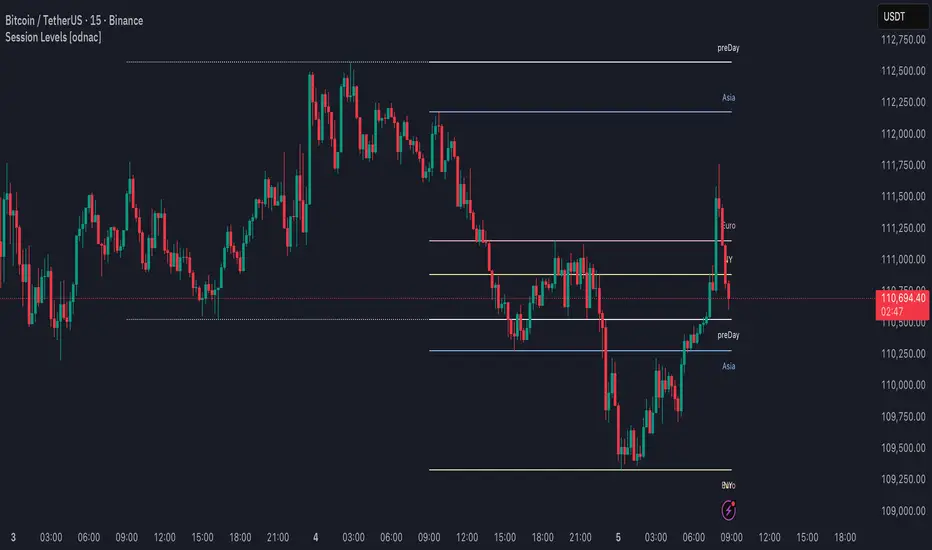
Session Levels [odnac]This indicator plots the high and low levels of the three main trading sessions—Asia, Europe, and New York—along with the previous day’s high, low, and open. Each session’s time range can be customized using a UTC offset, and the indicator automatically tracks session highs and lows as price develops.
Functions:
Plots session highs and lows for Asia, Europe, and New York.
Shows previous day’s high, low, and open as reference levels.
Session times are fully configurable with hour and minute precision, including UTC offset adjustment.
Each session level is marked with both a line and a label for clarity.
Color customization for each session and previous day levels.
Designed for intraday timeframes (1–60 minutes).
Filter Condition:
When the filter option is enabled, the indicator adjusts how levels are drawn:
A session high above the current close is displayed as a solid line with a visible label.
Once price closes above that high, the line becomes dotted and dimmed, and the label also becomes less emphasized.
Similarly, a session low below the current close is displayed as a solid line and label.
If price closes below that low, the line switches to dotted and dimmed, with the label adjusted accordingly.
This behavior highlights only the most relevant levels for the current market position while still keeping breached levels visible in a subdued style, making it easier to spot active breakout or liquidity zones.
Bardhi's ICT Killzone & PivotsThis indicator is a complete ICT-style session and liquidity toolkit designed for precision trading. It automatically marks the most important trading windows (“Killzones”) and provides powerful tools for tracking price action around them.
Key Features:
Killzones: Automatically plots Asia, London, and New York (AM, Lunch, PM) sessions with customizable colors, transparency, and labels.
Session Highs, Lows & Midpoints: Dynamic lines for killzone highs/lows, optional midpoints, and alerts when levels are broken.
Range Statistics: Displays the real-time range of each session plus rolling averages in a customizable table.
Day / Week / Month Levels: Plots opens, highs, lows, and separators for higher-timeframe reference points with optional alerts.
Custom Opening Prices: Define up to 8 custom open lines (e.g., True Day Open, 06:00, 10:00) with cutoff times.
Vertical Timestamp Lines: Highlight important intraday times such as news events or personal strategy triggers.
Day-of-Week Labels: Clean labels for each day, with the option to hide weekends.
Full Customization: Adjustable label sizes, colors, line styles, transparency, and drawing limits.
Why Use It?
This tool combines killzone sessions, pivots, higher-timeframe opens/highs/lows, and range statistics into one clean, automated package. It saves time drawing manually, keeps charts organized, and helps traders apply ICT concepts consistently.

Blue Ocean BOATS 24/5 US Market DataThis script utilizes Blue Ocean's ATS (Alternative Trading System) and U.S. exchange market data to create a continuous candlestick chart. The continuous data has the option to be used as an indicator or strategy source.
Requirements
The main chart symbol (which can be unrelated to the user-input Ticker Symbol) needs to be a 24/7 chart. An example symbol is CRYPTO:BTCUSD. CME_MINI:ES1! and FX:SPX500 work too, but are not truly 24/5 and will miss ~4 hours of the total trading week from the extended U.S. session.
The main chart's timeframe needs to be intraday. Because the script's output is currently inconsistent on daily or higher timeframes, it will disable itself.
The Ticker Symbol chosen should be a ticker that is traded on U.S. exchanges. This will provide both U.S. extended session data and a BOATS equivalent.
Usage & configuration
This script visualizes the 24-hour Monday-Friday chart of a U.S. exchange ticker. Going a step further, it can be used to compare the performance indices or cryptocurrencies to stock constituents of indices, cryptocurrency treasury stocks or holding ETFs.
The script's output, candlesticks, can be overlaid on the main chart or used as is. A "Price Source" plot is used for indicators or strategies.
Ticker Symbol: The U.S. ticker you'd like to view extended session and Blue Ocean ATS session data for.
Price Source: Price source that can be used for indicators or strategies.
Highlight Sessions: Highlight the different trading sessions.
Last Price Line: Show a horizontal line at the last traded price.
Ticker Symbol Check: Plots a label that will display only if the selected Ticker Symbol is not detected as a U.S. exchange traded ticker.
Earnings Label: Creates a label at the time of past earnings of the chosen Ticker Symbol. The time that the earnings are plotted is approximate. Because of this, the label is meant as an explanation for price action.
What this script does and how it works
It creates OHLC candlesticks by merging Blue Ocean's ATS market data and U.S. exchange data. From the OHLC data of both, a single output can be used for indicators or strategies.
References and further information
www.tradingview.com
The Blue Ocean ATS allows trading from 20:00 to 4:00 Eastern Time, Sunday through Thursday. This critical timeframe bridges the eight-hour overnight gap when major U.S. exchanges are closed.
blueocean-tech.io
Blue Ocean ATS, LLC is a US broker dealer which operates the alternative trading system BOATS. Our trading platform offers electronic access, price discovery, compliant regulatory reporting requirements, and standard clearing and settlement processes.
www.nyse.com
Hours mentioned are in Eastern Time.
Overnight trading remains far less active than extended hours trading. The hour with the highest overnight volume is 9:00PM, which averages 2.94 million shares per day and coincides with several Asian market opens. This volume is a fraction of the last hour of extended hours trading, which averages 43.22 million shares. The first hour of pre-core reported volume averages 113.30 million shares per day.
Overnight executions, in addition to the peak in the 9:00PM hour, also exhibits a smaller peak at 3:00AM, of 2.35 million shares. This coincides with several Asian bourses’ end of their regular trading day.
Example of using the script in the main chart window and the difference in how RSI may be calculated.
Note: ATS is not the name of the 20:00 to 4:00 ET session itself, and the term refers to a broader definition of trading systems that include dark pools, which can be different.
24/5 Monday-Friday really means NY time Sunday night to Friday afternoon.

AP Session Liquidity with EQH/EQL and Previous DayThis indicator plots key intraday session highs and lows, along with essential market structure levels, to help traders identify areas of interest, potential liquidity zones, and high-probability trade setups. It includes the Asia Session High and Low (typically 00:00–08:00 UTC), London Session High and Low (08:00–12:00 UTC), New York AM Session High and Low (12:00–15:00 UTC), and New York Lunch High and Low (15:00–17:00 UTC). Additionally, it displays the Previous Day’s High and Low for context on recent price action, as well as automatically detected Equal Highs and Lows based on configurable proximity settings to highlight potential liquidity pools or engineered price levels. These session levels are widely used by institutional traders and are critical for analyzing market behavior during time-based volatility windows. Traders can use this indicator to anticipate breakouts, fakeouts, and reversals around session boundaries—such as liquidity grabs at Asia highs/lows before the London or New York sessions—or to identify key consolidation and expansion zones. Equal Highs and Lows serve as magnets for price, offering insight into potential stop hunts or inducement zones. This tool is ideal for day traders, scalpers, and smart money concept practitioners, and includes full customization for session timings, color schemes, line styles, and alert conditions. Whether you're trading price action, ICT concepts, or supply and demand, this indicator provides a powerful framework for intraday analysis.

Previous Two Days HL + Asia H/L + 4H Vertical Lines📊 Indicator Overview
This custom TradingView indicator visually marks key market structure levels and session data on your chart using lines, labels, boxes, and vertical guides. It is designed for traders who analyze intraday and multi-session behavior — especially around the New York and Asia sessions — with a focus on 4-hour price ranges.
🔍 What the Indicator Tracks
1. Previous Two Days' Ranges (6PM–5PM NY Time)
PDH/PDL (Day 1 & Day 2): Draws horizontal lines marking the previous two trading days’ highs and lows.
Midlines: Calculates and displays the midpoint between each day’s high and low.
Color-Coded: Uses strong colors for Day 1 and more transparent versions for Day 2, to help differentiate them.
2. Asia Session High/Low (6 PM – 2 AM NY Time)
Automatically tracks the high and low during the Asia session.
Extends these levels until the following day’s NY close (4 PM).
Shows a midline of the Asia session (optional dotted line).
Highlights the Asia session background in gray.
Labels Asia High and Low on the chart for easy reference.
3. Last Closed 4-Hour Candle Range
At the start of every new 4H candle, it:
Draws a box from the last closed 4H candle.
Box spans horizontally across a set number of bars (adjustable).
Top and bottom lines indicate the high and low of that 4H candle.
Midline, 25% (Q1) and 75% (Q3) levels are also drawn inside the box using dotted lines.
Helps traders identify premium/discount zones within the previous 4H range.
4. Vertical 4H Time Markers
Draws vertical dashed lines to mark the start and end of the last 4H candle range.
Based on the standard 4H bar timing in NY (e.g. 5:00, 9:00, 13:00, 17:00).
⚙️ Inputs & Options
Line thickness, color customization for all levels.
Option to place labels on the right or left side of the chart.
Toggle for enabling/disabling the 4H box.
Adjustable box extension length (how far to extend the range visually).
✅ Ideal Use Cases
Identifying reaction zones from prior highs/lows.
Spotting reversals during Asia or NY session opens.
Trading intraday setups based on 4H structure.
Anchoring scalping or swing entries off major session levels.

Apex Edge - MTF Confluence PanelApex Edge – MTF Confluence Panel
Description:
The Apex Edge – MTF Confluence Panel is a powerful multi-timeframe analysis tool built to streamline trade decision-making by aggregating key confluences across three user-defined timeframes. The panel visually presents the state of five core market signals—Trend, Momentum, Sweep, Structure, and Trap—alongside a unified Score column that summarizes directional bias with clarity.
Traders can customize the number of bullish/bearish conditions required to trigger a score signal, allowing the tool to be tailored for both conservative and aggressive trading styles. This script is designed for those who value a clean, structured, and objective approach to identifying market alignment—whether scalping or swing trading.
How it Works:
Across each of the three selected timeframes, the panel evaluates:
Trend: Based on a user-configurable Hull Moving Average (HMA), the script compares price relative to trend to determine bullish, bearish, or neutral bias.
Momentum: Uses OBV (On-Balance Volume) with volume spike detection to identify bursts of strong buying or selling pressure.
Sweep: Detects potential liquidity grabs by identifying price rejections beyond prior swing highs/lows. A break below a previous low with reversal signals bullish intent (and vice versa for bearish).
Structure: Uses dynamic pivot-based logic to identify market structure breaks (BOS) beyond recent confirmed swing levels.
Trap: Flags potential false moves by measuring RSI overbought/oversold signal clusters combined with minimal price movement—highlighting exhaustion or deceptive breaks.
Score: A weighted consensus of the above components. The number of required confluences to trigger a score (default: 3) can be set by the user via input, offering flexibility in signal sensitivity.
Why It’s Useful for Traders:
Quick Decision-Making: The color-coded panel provides instant visual feedback on whether confluences align across timeframes—ideal for fast-paced environments like scalping or high-volatility news sessions.
Multi-Timeframe Confidence: Helps eliminate guesswork by confirming whether higher and lower timeframe conditions support your trade idea.
Customizability: Adjustable confluence threshold means traders can fine-tune how sensitive the system is—more signals for faster entries, stricter confluence for higher conviction trades.
Built-In Alerts: Automated alerts for score alignment, trap detection, and liquidity sweeps allow traders to stay informed even when away from the screen.
Strategic Edge: Supports directional bias confirmation and trade filtering with logic designed to mimic professional decision-making workflows.
Features:
Clean, real-time confluence table across three user-selected timeframes
Configurable score sensitivity via “Minimum Confluences for Score” input
Cell-based colour coding for at-a-glance trade direction
Built-in alerts for score alignment, traps, and sweep triggers
Note - This Indicator works great in sync with Apex Edge - Session Sweep Pro
Useful levels for TP = previous session high/low boxes or fib levels.
⚠️ Disclaimer:
This script is for informational and educational purposes only and should not be considered financial advice. Always perform your own due diligence and practice proper risk management when trading.

Opening Range and Market BoundariesOpening Range and Market Boundaries
This versatile and insightful indicator combines two powerful concepts frequently used by professional traders: Opening Range Analysis and Market Boundaries derived from previous high/low levels. It is specifically designed to support intraday trading strategies and helps you identify key price zones for entries, exits, and breakout confirmations.
🔍 Features & Utility
1. Opening Range Box
What it does:
Highlights the high and low of the first candle after market open (9:15 AM IST) with a shaded box. This box spans the full trading session, from 9:15 AM to 3:30 PM, representing the key price range where the initial balance is formed.
Timeframe Compatibility:
The Opening Range box is optimized for 1-minute to 1-hour charts. It is most effective on lower timeframes (1m, 5m, 15m, 30m) where intraday price movements and breakout patterns can be clearly observed.
Usage Tips:
Breakouts above or below the Opening Range box can signal potential directional bias for the rest of the trading day.
Price consolidating within the range may indicate a choppy or range-bound session.
Works well with volume and momentum indicators for confirmation.
2. Market Boundaries
What it does:
Plots horizontal lines at:
Previous Day High/Low
Previous Week High/Low
Previous Month High/Low
Why it matters:
These levels act as natural support and resistance zones, and are commonly watched by institutional traders, making them crucial for:
Spotting reversals or breakouts
Planning stop-loss and target zones
Avoiding trades around high-rejection areas
Customization Options:
Toggle ON/OFF for Daily, Weekly, and Monthly levels.
Independent colors and line thickness for each level, enabling you to distinguish between different timeframes easily.
🛠️ How to Use Effectively
Use during market open:
Switch to a 5-minute or 15-minute chart during the first few candles of the session. Observe the Opening Range box formation and plan trades based on breakout direction.
Confluence Trading:
Look for price action near previous session highs/lows in confluence with the Opening Range box edges. These intersections often become high-probability zones for breakouts or reversals.
Session Preparation:
Before the market opens, analyze where the price is relative to past high/low boundaries. If it's near a weekly/monthly level, be cautious — those areas can cause whipsaws or false breakouts.
Avoid low-volume breakouts:
Use this indicator in conjunction with volume tools or price action confirmation to validate the strength of a move outside the Opening Range or Market Boundaries.
📌 Summary
This indicator is designed for intraday traders, scalpers, and swing traders who want a reliable structure to guide their decisions. It visually marks the opening balance of the market and essential higher timeframe boundaries, helping you trade with discipline and precision.

[TTM] ICT Sessions & Ranges🌟 Overview 🌟
The ICT Sessions & Ranges Indicator helps traders identify key intraday price levels by marking custom session highs/lows and opening ranges.
It helps traders spot potential liquidity grabs, reversals, and breakout zones by tracking price behavior around these key areas
🌟 Session Highs & Lows – Liquidity Zones 🌟
Session highs and lows often attract price due to stop orders resting above or below them. These levels are frequently targeted during high-volatility moves.
🔹 Asia Session
- Usually ranges in low volatility.
- Highs/lows often get swept during early London.
- Price may raid these levels, then reverse.
🔹 London Session
- First major volatility of the day.
- Highs/lows often tested or swept in New York.
- Commonly forms the day’s true high or low.
🌟 Opening Range Concepts 🌟
The Opening Range is the first 15, 30, or 60 minutes of a session (e.g., New York).
The high (ORH) and low (ORL) define the market’s initial balance and key reaction levels.
🔹 Breakout Trade
- Price breaks ORH/ORL with momentum.
- Signals directional intent.
- Traders enter on the breakout, with stops inside the range.
🔹 Liquidity Raid
- Price briefly breaks ORH/ORL to trigger stops.
- Reverses after the sweep.
- Look for structure shift and entry near FVG or OB.
🌟 Customizable Settings 🌟
The indicator includes 3 configurable ranges , each with:
Start & End Time – Set any custom time window.
Display Type – Choose Box (highlight range) or Lines (mark high/low).
Color Settings – Set custom colors for boxes and lines.
🌟 Default Settings 🌟
Range 1 : 19:00–00:00 (Asia Session)
Range 2 : 01:45–05:15 (London Session)
Range 3 : 09:30–10:00 (NY Opening Range – 30m)

VWAP 2.0 with desv + Initial Balance by RiotWolftrading🌟 Overview
This powerful tool is designed for traders who want to harness the power of the Volume Weighted Average Price (VWAP) alongside session-based ranges to make informed trading decisions. Whether you're a day trader or a swing trader, this indicator provides a clean and effective way to identify support, resistance, and market trends—all in one place! 💡
✨ Key Features
Auto-Anchored VWAP 📊
Automatically calculates the VWAP based on a user-defined anchor period (e.g., Daily, Weekly, Monthly).
Resets at the start of each period (e.g., daily for a Daily anchor).
Displays a customizable VWAP line with standard deviation bands to highlight key price levels.
Standard Deviation Bands 📏
Plots up to three sets of standard deviation bands above and below the VWAP (multipliers: 1.0, 2.0, 3.0).
Includes volume percentage labels to show where trading volume is concentrated. 📉
Session High/Low Range 🕒
Identifies the high and low prices within a customizable session (default: 12:00 to 15:31).
Draws horizontal lines at the session high and low, with dotted deviation lines for additional reference points.
Perfect for spotting key levels during your trading session! 🔑
Time-Based Range Box ⏰
Highlights a specific time window (default: 15:40 to 15:50) with a colored box showing the high and low prices.
Ideal for tracking price action during high-impact events like news releases or market opens. 📅
Alerts 🚨
Set up alerts for when the price crosses above or below the VWAP—never miss a potential trading opportunity!
⚙️ Settings
Customize the indicator to fit your trading style with these easy-to-use settings:
VWAP Settings
Timezone 🌍: Select your timezone (default: GMT+2) to align calculations with your local time.
VWAP Source 📈: Choose the price source for VWAP (default: hlc3 - average of high, low, close).
Std Deviation Multipliers 📐: Adjust the multipliers for the bands (default: 1.0, 2.0, 3.0).
Line Width ✏️: Set the thickness of the VWAP and band lines (default: 1).
Session Time ⏳: Define the session window for VWAP calculations (default: 08:00-18:00, all days).
Show Upper/Lower Bands 👀: Toggle visibility for each set of bands (default: Band 1 visible, Bands 2 & 3 hidden).
Range Settings
Range Start/End Time 🕙: Set the time window for the range box (default: 15:40 to 15:50).
Box Color 🎨: Customize the border color (default: blue).
Box Background Color 🖌️: Adjust the background color (default: light aqua, 90% transparency).
I created this indicator to provide a streamlined, clutter-free tool for traders who rely on VWAP and session-based analysis. It focuses on the essentials—VWAP, standard deviation bands, session high/low, and range box—without unnecessary overlays. I hope it helps you in your trading journey! If you have feedback or suggestions, feel free to share—I’d love to hear from you! 😊

Intraday Macro & Flow Indicator# IntraMacroFlow Indicator
## Introduction
IntraMacroFlow is a volume and delta-based indicator that identifies significant price movements within trading sessions. It generates signals when volume spikes coincide with quality price movement, filtered by RSI to avoid overbought/oversold conditions.
> **Note:** This indicator provides multiple signals and should be combined with additional analysis methods such as support/resistance, trend direction, and price action patterns.
## Inputs
### Volume Settings
* **Volume Lookback Period** (14) - Number of bars for volume moving average calculation
* **Volume Threshold Multiplier** (1.5) - Required volume increase over average to generate signals
* **Delta Threshold** (0.3) - Required close-to-open movement relative to bar range (higher = stronger movement)
### Session Configuration
* **Use Dynamic Session Detection** (true) - Automatically determine session times
* **Highlight Market Open Period** (true) - Highlight first third of trading session
* **Highlight Mid-Session Period** (true) - Highlight middle portion of trading session
* **Detect Signals Throughout Whole Session** (true) - Find signals in entire session
* **Session Time** ("0930-1600") - Trading hours in HHMM-HHMM format
* **Session Type** ("Regular") - Select Regular, Extended, or Custom session
### Manual Session Settings
Used when dynamic detection is disabled:
* **Manual Session Open Hour** (9)
* **Manual Session Open Minute** (30)
* **Manual Session Open Duration** (60)
* **Manual Mid-Session Start Hour** (12)
* **Manual Mid-Session End Hour** (14)
## How It Works
The indicator analyzes each bar using three primary conditions:
1. **Volume Condition**: Current volume > Average volume × Threshold
2. **Delta Condition**: |Close-Open|/Range > Delta threshold
3. **Time Condition**: Bar falls within configured session times
When all conditions are met:
* Bullish signals appear when close > open and RSI < 70
* Bearish signals appear when close < open and RSI > 30
## Display Elements
### Shapes and Colors
* Green triangles below bars - Bullish signals
* Red triangles above bars - Bearish signals
* Blue background - Market open period
* Purple background - Mid-session period
* Bar coloring - Green (bullish), Red (bearish), or unchanged
### Information Panel
A dynamic label shows:
* Current volume relative to average (Vol)
* Delta value for current bar (Delta)
* RSI value (RSI)
* Session status (Active/Closed)
## Calculation Method
```
// Volume Condition
volumeMA = ta.sma(volume, lookbackPeriod)
volumeCondition = volume > volumeMA * volumeThreshold
// Delta Calculation (price movement quality)
priceRange = high - low
delta = math.abs(close - open) / priceRange
deltaCondition = delta > deltaThreshold
// Direction and RSI Filter
bullishBias = close > open and entrySignal and not (rsi > 70)
bearishBias = close < open and entrySignal and not (rsi < 30)
```
## Usage Recommendations
### Suitable Markets
* Equities during regular trading hours
* Futures markets
* Forex during active sessions
* Cryptocurrencies with defined volume patterns
### Recommended Timeframes
* 1-minute to 1-hour (optimal: 5 or 15-minute)
### Parameter Adjustments
* For fewer but stronger signals: increase Volume Threshold (2.0+) and Delta Threshold (0.4-0.6)
* For more signals: decrease Volume Threshold (1.2-1.5) and Delta Threshold (0.2-0.3)
### Usage Tips
* Combine with trend analysis for higher-probability entries
* Focus on signals occurring at session boundaries and mid-session
* Use opposite signals as potential exit points
* Configure alerts to receive notifications when signals occur
## Additional Notes
* RSI parameters are fixed at 14 periods with 70/30 thresholds
* The indicator handles overnight sessions correctly
* Fully compatible with TradingView alerts
* Customizable visual elements
## Release Notes
Initial release: This is a template indicator that should be customized to suit your specific trading strategies and preferences.

Key Prices & LevelsThis indicator is designed to visualize key price levels & areas for NY trading sessions based on the price action from previous day, pre-market activity and key areas from NY session itself. The purpose is to unify all key levels into a single indicator, while allowing a user to control which levels they want to visualize and how.
The indicator identifies the following:
Asia Range High/Lows, along with ability to visualize with a box
London Range High/Lows, along with ability to visualize with a box
Previous Day PM Session High/Lows
Current Day Lunch Session High/Lows, starts appearing after 12pm EST once the lunch session starts
New York Open (8:30am EST) price
9:53 Open (root candle) price
New York Midnight (12:00am EST) price
Previous Day High/Lows
First 1m FVG after NY Session Start (after 9:30am), with the ability to configure minimum FVG size.
Opening Range Gap, showing regular market hours close price (previous day 16:15pm EST close), new session open price (9:30am EST open) and optionally the mid-point between the two
Asia Range 50% along with 2, 2.5, 4 and 4.5 deviations of the Asia range in both directions
Configurability:
Each price level can be turned off
Styles in terms of line type, color
Ability to turn on/off labels for price levels and highlighting of prices on price scale
Ability to control label text for price levels
How is it different:
Identifies novel concepts such as 9:53 open, root candle that can be used as a bounce/resistance area during AM/PM sessions as well as confirmation of direction once closed over/under to indicate price's willingness to continue moving in the same direction.
It also shows 1st 1m FVG after New York Session open, that can be used to determine direction of the price action depending on PA's reaction to that area. While both 9:53 and 1m FVG are 1m based markers, these levels are visualized by the indicator on all timeframes from 15s to 1h.
Additionally the indicator is able to both highlight key prices in the price scale pane as well as combine labels to minimize clutter when multiple levels have the same price.
Lastly for in-session ranges such as Lunch High/Low the indicator updates the range in real-time as opposed to waiting for the lunch session to be over.
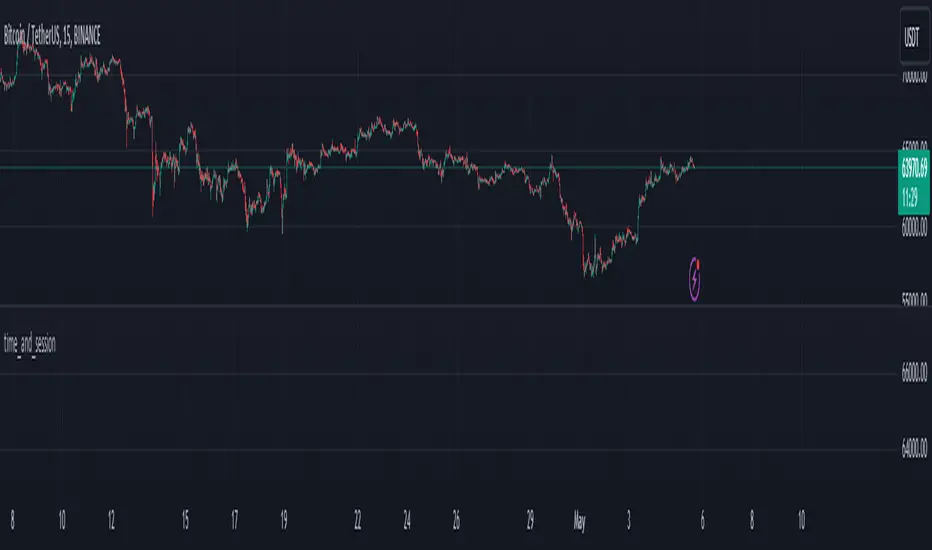
time_and_sessionA library that provides utilities for working with trading sessions and time-based conditions. Functions include session checks, date range checks, day-of-week matching, and session high/low calculations for daily, weekly, monthly, and yearly timeframes. This library streamlines time-related calculations and enhances time-based strategies and indicators.
Library "time_and_session"
Provides functions for checking time and session-based conditions and retrieving session-specific high and low values.
is_session(session, timeframe, timezone)
Checks if the current time is within the specified trading session
Parameters:
session (string) : The trading session, defined using input.session()
timeframe (string) : The timeframe to use, defaults to the current chart's timeframe
timezone (string) : The timezone to use, defaults to the symbol's timezone
Returns: A boolean indicating whether the current time is within the specified trading session
is_date_range(start_time, end_time)
Checks if the current time is within a specified date range
Parameters:
start_time (int) : The start time, defined using input.time()
end_time (int) : The end time, defined using input.time()
Returns: A boolean indicating whether the current time is within the specified date range
is_day_of_week(sunday, monday, tuesday, wednesday, thursday, friday, saturday)
Checks if the current day of the week matches any of the specified days
Parameters:
sunday (bool) : A boolean indicating whether to check for Sunday
monday (bool) : A boolean indicating whether to check for Monday
tuesday (bool) : A boolean indicating whether to check for Tuesday
wednesday (bool) : A boolean indicating whether to check for Wednesday
thursday (bool) : A boolean indicating whether to check for Thursday
friday (bool) : A boolean indicating whether to check for Friday
saturday (bool) : A boolean indicating whether to check for Saturday
Returns: A boolean indicating whether the current day of the week matches any of the specified days
daily_high(source)
Returns the highest value of the specified source during the current daily session
Parameters:
source (float) : The data series to evaluate, defaults to high
Returns: The highest value during the current daily session, or na if the timeframe is not suitable
daily_low(source)
Returns the lowest value of the specified source during the current daily session
Parameters:
source (float) : The data series to evaluate, defaults to low
Returns: The lowest value during the current daily session, or na if the timeframe is not suitable
regular_session_high(source, persist)
Returns the highest value of the specified source during the current regular trading session
Parameters:
source (float) : The data series to evaluate, defaults to high
persist (bool) : A boolean indicating whether to retain the last value outside of regular market hours, defaults to true
Returns: The highest value during the current regular trading session, or na if the timeframe is not suitable
regular_session_low(source, persist)
Returns the lowest value of the specified source during the current regular trading session
Parameters:
source (float) : The data series to evaluate, defaults to low
persist (bool) : A boolean indicating whether to retain the last value outside of regular market hours, defaults to true
Returns: The lowest value during the current regular trading session, or na if the timeframe is not suitable
premarket_session_high(source, persist)
Returns the highest value of the specified source during the current premarket trading session
Parameters:
source (float) : The data series to evaluate, defaults to high
persist (bool) : A boolean indicating whether to retain the last value outside of premarket hours, defaults to true
Returns: The highest value during the current premarket trading session, or na if the timeframe is not suitable
premarket_session_low(source, persist)
Returns the lowest value of the specified source during the current premarket trading session
Parameters:
source (float) : The data series to evaluate, defaults to low
persist (bool) : A boolean indicating whether to retain the last value outside of premarket hours, defaults to true
Returns: The lowest value during the current premarket trading session, or na if the timeframe is not suitable
postmarket_session_high(source, persist)
Returns the highest value of the specified source during the current postmarket trading session
Parameters:
source (float) : The data series to evaluate, defaults to high
persist (bool) : A boolean indicating whether to retain the last value outside of postmarket hours, defaults to true
Returns: The highest value during the current postmarket trading session, or na if the timeframe is not suitable
postmarket_session_low(source, persist)
Returns the lowest value of the specified source during the current postmarket trading session
Parameters:
source (float) : The data series to evaluate, defaults to low
persist (bool) : A boolean indicating whether to retain the last value outside of postmarket hours, defaults to true
Returns: The lowest value during the current postmarket trading session, or na if the timeframe is not suitable
weekly_high(source)
Returns the highest value of the specified source during the current weekly session. Can fail on lower timeframes.
Parameters:
source (float) : The data series to evaluate, defaults to high
Returns: The highest value during the current weekly session, or na if the timeframe is not suitable
weekly_low(source)
Returns the lowest value of the specified source during the current weekly session. Can fail on lower timeframes.
Parameters:
source (float) : The data series to evaluate, defaults to low
Returns: The lowest value during the current weekly session, or na if the timeframe is not suitable
monthly_high(source)
Returns the highest value of the specified source during the current monthly session. Can fail on lower timeframes.
Parameters:
source (float) : The data series to evaluate, defaults to high
Returns: The highest value during the current monthly session, or na if the timeframe is not suitable
monthly_low(source)
Returns the lowest value of the specified source during the current monthly session. Can fail on lower timeframes.
Parameters:
source (float) : The data series to evaluate, defaults to low
Returns: The lowest value during the current monthly session, or na if the timeframe is not suitable
yearly_high(source)
Returns the highest value of the specified source during the current yearly session. Can fail on lower timeframes.
Parameters:
source (float) : The data series to evaluate, defaults to high
Returns: The highest value during the current yearly session, or na if the timeframe is not suitable
yearly_low(source)
Returns the lowest value of the specified source during the current yearly session. Can fail on lower timeframes.
Parameters:
source (float) : The data series to evaluate, defaults to low
Returns: The lowest value during the current yearly session, or na if the timeframe is not suitable
Vanitati's Market Scope=========================================================
How to Use the Indicator
=========================================================
Configuration: Begin by setting the session times to match your trading interests. Customize the colors and styles according to your preferences.
Observation: Watch for the high and low markers of each session to form the initial balance. Note how the price moves in relation to these levels.
Action: Pay special attention to God Candles and engulfing patterns, especially when they coincide with high volume. These may offer trading signals in line with your strategy.
Adjustment: Regularly review and adjust the settings (e.g., session times, lookback periods) based on market conditions and your trading performance.
=========================================================
Initial Balance (IB) Settings:
=========================================================
Purpose: Marks the high and low of a specific trading session to indicate the initial range of market movement.
Usage: Customize session times for New York (NY), London (LN), and Tokyo (TK) to see the initial balance of each. Colors for the high, low, and mid-point lines can be adjusted.
Practical Application: Traders can use these lines to gauge market volatility or breakouts outside of these initial ranges.
=========================================================
Session Settings and Session Highlight Boxes
=========================================================
Purpose: Highlights trading sessions with customizable background colors and border styles, allowing for a quick visual reference of market sessions.
Usage: Set the times for NY, London, and Tokyo sessions along with desired background colors to have these periods visually marked on the chart.
Practical Application: Helps in identifying the overlap between major market sessions and potential increases in trading volume and volatility.
=========================================================
God Candle Settings
=========================================================
Purpose: Identifies significantly large and voluminous candles, known as "God Candles", which could signal strong market movements.
Usage: Adjust the lookback period, line length, and volume criteria to define what constitutes a God Candle. These settings also allow for the display of diamonds on bars that meet certain criteria but are not classified as God Candles.
Practical Application: These candles can signal strong buying or selling pressure and might be used as potential entry or exit points based on the trader's strategy.
=========================================================
Additional Features
=========================================================
Session Time Filters: Allows for filtering signals based on the time of day, useful for focusing on specific market hours.
Engulfing Pattern Detection: The script includes logic to identify bullish and bearish engulfing patterns, adding another layer of analysis for potential trading opportunities.
Volume Analysis: Incorporates volume into the analysis of God Candles and engulfing patterns to identify significant market movements.
Session Sweeps [LuxAlgo]The Session Sweeps indicator combines ICT-based features for a complete trading methodology involving market sessions, market structure, and fair value gaps to find optimal entry conditions for trading price action.
Traders frequently tend to place stop/limit orders at the high and low points of major trading sessions such as Asian (Tokyo), European (London), and North American (New York), resulting in the establishment of liquidity pools at those particular levels. The Session Sweeps indicator is crafted to recognize and underscore occurrences of session sweeps or liquidity sweeps during these major trading sessions.
🔶 USAGE
Default settings utilize major forex trading sessions, yet users can select their preferred opening and closing times, rename the sessions, or adjust the colors. It's important to note that the specified times for each session align with the respective local timezones: Asian (Tokyo) UTC+9, European (London) UTC, and North American (New York) UTC-5.
If the price briefly crosses either the highest or lowest point of a market session. These movements, aiming at triggering stop losses, suggest potential shifts in the market direction. Detecting such movements is the fundamental purpose and core functionality of the script.
🔹Market Structure Shifts
A Market Structure Shift refers to a change in market direction, either from an uptrend to a downtrend or vice versa. A part of a common entry model when using session sweeps is waiting for the formation of a CHoCH after a session sweep.
🔹Fair Value Gaps
A Fair Value Gap (FVG) holds particular appeal for price action traders, emerging when there are inefficiencies or imbalances in the market, often a result of uneven buying and selling activity. The underlying concept of FVGs is that the market tends to revisit these inefficiencies before resuming its trajectory in alignment with the initial impulsive move.
After the formation of a CHoCH traders can enter a position when the price enters the area of a Fair Value Gap (FVG).
🔹Setup Examples
This entry setup is commonly used by ICT traders and is shared for informational & educational purposes only.
Long Positions (5-Minute Timeframe):
Wait for the previous session's low to be swept.
Look for a Bullish Choch.
Find a Bullish FVG formed by or before the Choch.
Entry Point: At the FVG.
Take Profit (TP): At the session high or aim for a 1:2 Risk-Reward Ratio.
Stop Loss (SL): At the session low or nearest Swing Low.
Take partial profits at intermediate swings, but don’t shift SL prematurely.
Short Positions (5-Minute Timeframe):
Wait for the previous session's high to be swept.
Look for a Bearish Choch.
Find a FVG formed by or before the Choch.
Entry Point: At the FVG.
Take Profit (TP): At the previous session's low or aim for a 1:2 RR.
Stop Loss (SL): At the session high or nearest Swing High.
Take partial profits at intermediate swings, but don’t shift SL prematurely.
🔶 SETTINGS
🔹Session Sweeps
Buyside Sweep Zones, Color, and Margin: toggles the visibility of bullside sweep zones, customizes the associated color, and sets the margin value defining the range of a bullside sweep zone.
Sellside Sweep Zones, Color, and Margin: toggles the visibility of sell-side sweep zones, customizes the associated color, and sets the margin value defining the range of a sell-side sweep zone.
Sweep Margin Length: specifies the maximum allowed length of a sweep zone invalidation, the length over which the price slightly invalidated the margin range.
Detect Sweeps Once per Session: if enabled will detect only once a sweep zone within a session.
Hide Fake Sweep Zones, and Color: controls the visibility and color of the fake sweep zones.
🔹Sessions
Session (Asia, London, New York AM, and New York PM), Start Time, and End Time: enables or disables the visibility of the named market session range, and customization of the session hours.
Color: color customization option of the named session.
Extend Max/Min: extends the highest and lowest price levels of the named session until the end of the next enabled session. This option is recommended to be enabled when sweep zone detection is activated to observe the relationship between the sweep zone and previous session extreme levels.
Extend Mid: extends the mean price levels of the named session until the end of the next enabled session. The extended line may serve as potential support and resistance levels.
Fill: enables/disables background coloring of the named session.
New York DST | London DST: enabling this option initiates Daylight Saving Time (DST) for New York or London. Note: Daylight Saving Time is not applied to the Asian (Tokyo) session.
Sessions Extreme Lines | Sessions Names: toggles the visibility of the highest and lowest price levels, as well as the names, for all market sessions.
Session Lines Width: sets the width of the lines for all sessions.
Session Fill Transparency: sets the background color transparency of the range for all sessions.
🔹Market Structure Shifts
Market Structure Shifts: toggles the visibility of market structure shifts, also known as change of character (CHoCH).
Detection Length: specifies the detection length.
Market Structure Shifts; Bull & Bear: color customization options.
🔹Fair Value Gaps
Fair Value Gaps: toggles the visibility of the fair value gaps.
Fair Value Gap Width Filter: specifies the filtering multiplier; additional details can be found in the tooltip of the respective input option.
Bullish & Bearish Imbalance: color customization options.
🔹Sessions Tabular View
Sessions Tabular View: toggles the visibility of the tabular view of the sessions, displaying date &time, status, and countdown counter.
Hide if not Forex Market Instrument: checks the market and automatically enables/disables the option based on the market instrument.
Table Text Size & Position: size and placement customization options
🔶 LIMITATIONS
Please be aware that fair value gap filtering cannot be applied to the initial 144 candles (with a fixed-length ATR) as the ATR value necessary for filtering won't be available during this period.
🔶 RELATED SCRIPTS
Buyside-Sellside-Liquidity
Sessions
Liquidity-Voids-FVG
Thank you to our community for the recommendation of this script. To explore additional conceptual scripts and related content, we invite you to visit >>> LuxAlgo-Scripts .

skThis Pine Script is an indicator designed to mark and highlight specific trading sessions on a TradingView chart. Here's a description of the script's functionality:
1. *Session Selection*: The script allows you to select a session time frame using the `session_input` input. The available options for session time frames are "D" (daily), "W" (weekly), "M" (monthly), "H" (hourly), "15" (15 minutes), "5" (5 minutes), and "1" (1 minute).
2. *Session Times*: You can specify the start and end times for three different trading sessions - CBDR (Central Bank Dealer Range), Asia, and London - using the corresponding input options. These times are specified in Indian Standard Time (IST).
3. *Time Calculation*: The script calculates the start and end times for each session based on the specified hours and minutes. It uses the `timestamp` function to create time objects for these sessions.
4. *Session Highlighting*: The script creates rectangles on the chart to highlight each session:
- CBDR Session: A gray rectangle is drawn during the CBDR session time.
- Asia Session: Another gray rectangle is drawn during the Asia session time.
- London Session: A green rectangle is drawn at the top of the chart during the London session time.
5. *Transparency*: The rectangles have a transparency level of 90%, allowing you to see the price data beneath them while still marking the sessions.
6. *Overlay*: The indicator is set to overlay on the price chart, so it doesn't obstruct the price data.
7. *Customization*: You can customize the session times and appearance by adjusting the input values in the settings panel of the indicator.
Overall, this script provides a visual way to identify and highlight specific trading sessions on your TradingView chart, helping traders understand price action in different market sessions.
