RSI StrategyINTRADAY GO WITH SIGNAL AT THE END OF DAY YOU WILL BE IN PROFITS GURANTEE...............
Just Take Care of one thing only use it for top tarded counters or most volatine scripts...........
스크립트에서 "rsi"에 대해 찾기


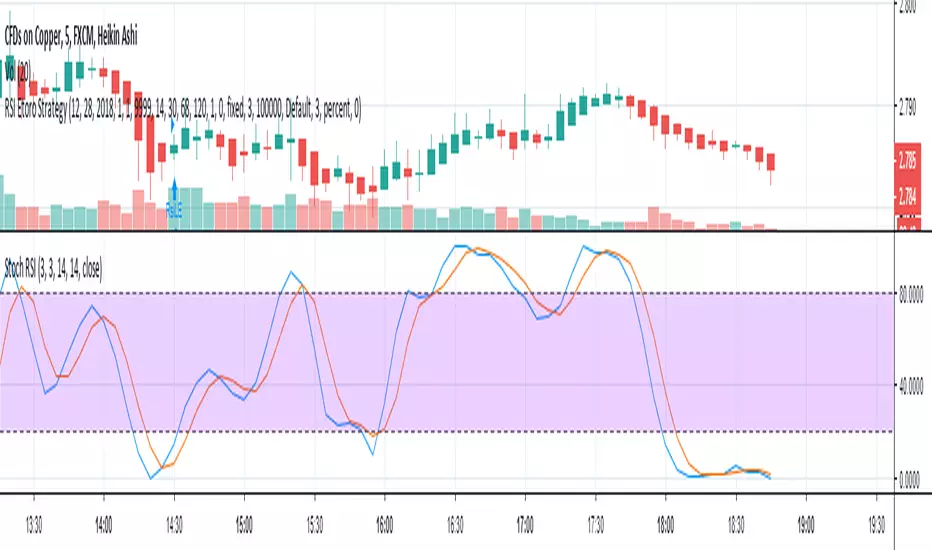
RSI Etoro StrategyTmp (WIP) just for my bro Manu ;)
BTW "Used" on COPPER
Not Good because only one indicator: miss several phenomenon so go to SL stupidly... And fine tuning of parameters is too sensible: it should be adjusted following feedback from other indicators...
Good thing is it takes into account the etoro context (SL at 50%, spread of 3 ticks) and you can back test with any period you want (usefull because parameters depends on "moods")

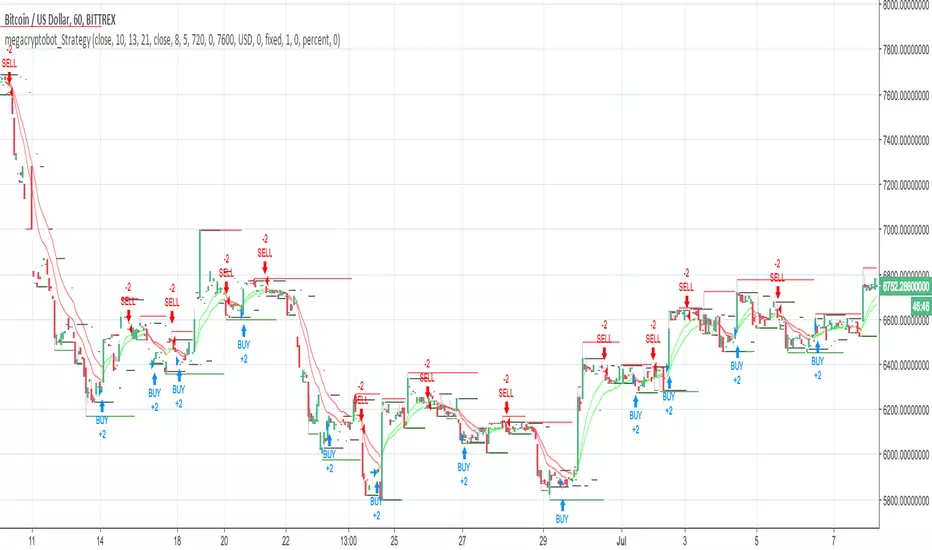
RSI Oscillator 1.0 signalSELL means sell, BUY means buy
D-SELL said that selling is risky. D-BUY indicates that buying is risky


RSI Bollinger Band StrategyIndicator will print when to long and when to short along with when to close positions. Only works on 4 hour time frame.


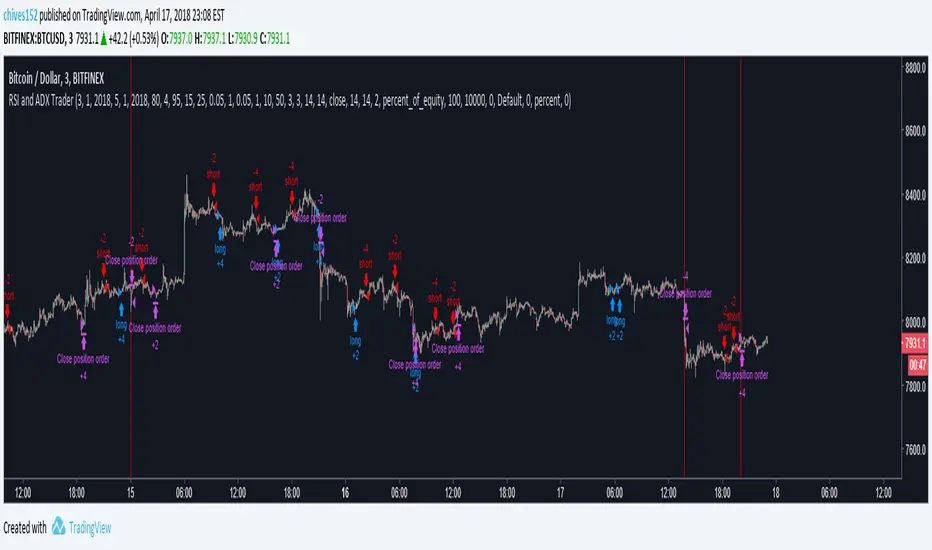
RSI and ADX TraderDevelopment version of 15 minute bitcoin indicator that is not available to the public.
For access to the actual indicator please go here:
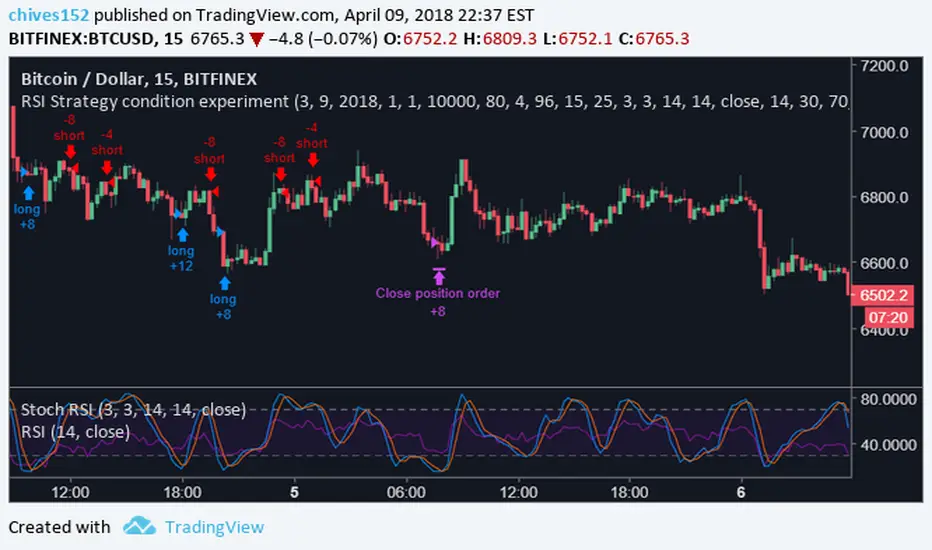
RSI Strategy condition experimentThis is a scalping indicator built for bitcoin on the 15m chart. It uses ADX and SRSI. A full indicator will be released very soon. Please comment with any questions or comments. The strategy ran below is the results if you started trading on 3/9/2018 with 10,000$ usd, and used 100% of your equity to enter positions. This is also designed to allow 2x leverage when certain conditions are met, which is the default. This feature can be turned off in settings.


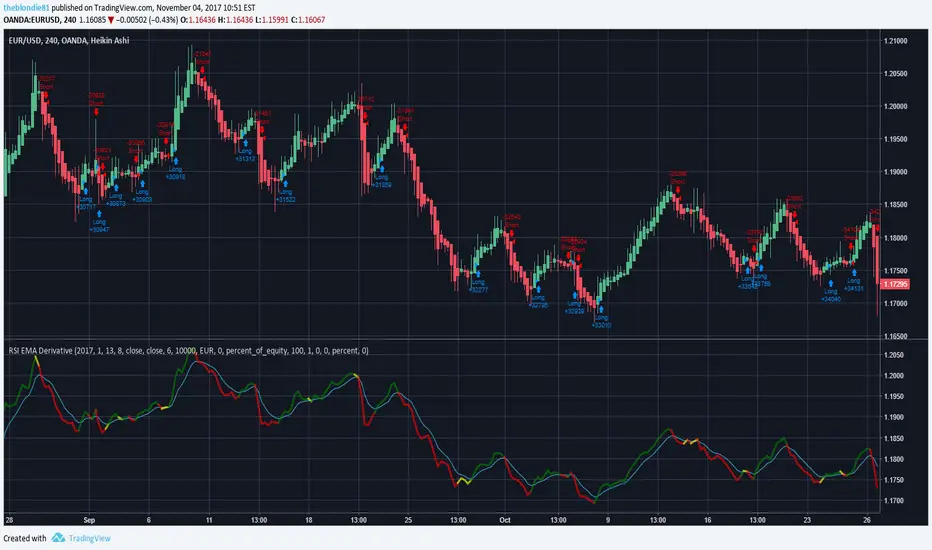
RSI EMA DerivativeUse Heiken Ashi candles to follow trends more easily.
4h or 24h time-frame is advised but any time-frame works.
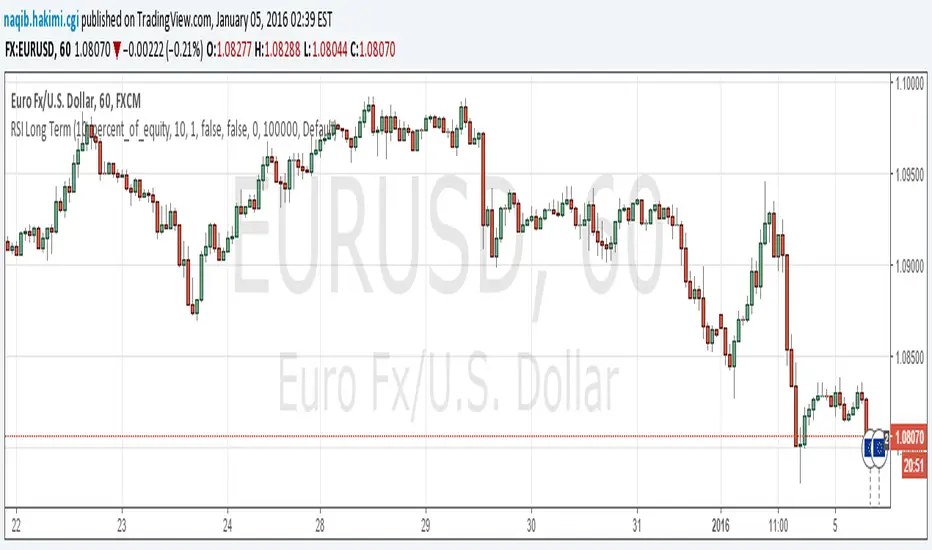
RSI Long TermThis strategy work good with long term ?
but only can check this in 9 month's
i am still working to see if it really works on 10 year data ( actually i still do not know how to do that in this site any idea ?)
and increase the trade number
Sigma Trinity ModelAbstract
Sigma Trinity Model is an educational framework that studies how three layers of market behavior interact within the same trend: (1) structural momentum (Rasta), (2) internal strength (RSI), and (3) continuation/compounding structure (Pyramid). The model deliberately combines bar-close momentum logic with intrabar, wick-aware strength checks to help users see how reversals form, confirm, and extend. It is not a signal service or automation tool; it is a transparent learning instrument for chart study and backtesting.
Why this is not “just a mashup”
Many scripts merge indicators without explaining the purpose. Sigma Trinity is a coordinated, three-engine study designed for a specific learning goal:
Rasta (structure): defines when momentum actually flips using a dual-line EMA vs smoothed EMA. It gives the entry/exit framework on bar close for clean historical study.
RSI (energy): measures internal strength with wick-aware triggers. It uses RSI of LOW (for bottom touches/reclaims) and RSI of HIGH (for top touches/exhaustion) so users can see intrabar strength/weakness that the close can hide.
Pyramid (progression): demonstrates how continuation behaves once momentum and strength align. It shows the logic of adds (compounding) as a didactic layer, also on bar close to keep historical alignment consistent.
These three roles are complementary, not redundant: structure → strength → progression.
Architecture Overview
Execution model
Rasta & Pyramid: bar close only by default (historically stable, easy to audit).
RSI: per tick (realtime) with bar-close backup by default, using RSI of LOW for entries and RSI of HIGH for exits. This makes the module sensitive to intra-bar wicks while still giving a close-based safety net for backtests.
Stops (optional in strategy builds): wick-accurate: trail arms/ratchets on HIGH; stop hit checks with LOW (or Close if selected) with a small undershoot buffer to avoid micro-noise hits.
Visual model
Dual lines (EMA vs smoothed EMA) for Rasta + color fog to see direction and compression/expansion.
Rungs (small vertical lines) drawn between the two Rasta lines to visualize wave spacing and rhythm.
Clean labels for Entry/Exit/Pyramid Add/RSI events. Everything is state-locked to avoid spamming.
Module 1 — Rasta (Structural Momentum Layer)
Goal: Identify structural momentum reversals and maintain a consistent, replayable backbone for study.
Method:
Compute an EMA of a chosen price source (default Close), and a smoothed version (SMA/EMA/RMA/WMA/None selectable).
Flip points occur when the EMA line crosses the smoothed line.
Optional EMA 8/21 trend filter can gate entries (long-bias when EMA8 > EMA21). A small “adaptive on flip” option lets an entry fire when the filter itself flips to ON and the EMA is already above the smoothed line—useful for trend resumption.
Why bar close only?
Bar-close Rasta gives a stable, auditable timeline for the structure of the trend. It teaches users to separate “structure” (close-resolved) from “energy” (intrabar, via RSI).
Visuals:
Fog between the lines (green/red) to show regime.
Rungs between lines to show spread (compression vs expansion).
Optional plotting of EMA8/EMA21 so users can see the gating effect.
Module 2 — RSI (Internal Strength / Energy Layer)
Goal: Reveal the intrabar strength/weakness that often precedes or confirms structural flips.
Method:
Standard RSI with adjustable length and signal smoothing for the panel view.
Logic uses wick-aware sources:
Entry trigger: RSI of LOW (same RSI length) touching or below a lower band (default 15). Think of it as intraband reactivation from the bottom, using the candle’s deepest excursion.
Exit trigger: RSI of HIGH touching or above an upper band (default 85). Think of it as exhaustion at the top, using the candle’s highest excursion.
Realtime + Close Backup: fires intrabar on tick, but if the realtime event was missed, the close backup will note it at bar end.
Cooldown control: optional bars-between-signals to avoid rapid re-triggers on choppy sequences.
Why wick-aware RSI?
A close-only RSI can miss the true micro-extremes that cause reversals. Using LOW/HIGH for triggers captures the behavior that traders actually react to during the bar, while the bar-close backup preserves historical reproducibility.
Module 3 — Pyramid (Continuation / Compounding Layer)
Goal: Teach how continuation behaves once a trend is underway, and how adds can be structured.
Method:
Same dual-line logic as Rasta (EMA vs smoothed EMA), but only fires when already in a position (or after prior entry conditions).
Supports the same EMA 8/21 filter and optional adaptive-on-flip behavior.
Bar close only to maintain historical cohesion.
What it teaches:
Adds tend to cluster when momentum persists.
Students can experiment with add spacing and compare “one-shot entries” vs “laddered adds” during strong regimes.
How the Pieces Work Together
Rasta establishes the structural frame (when the wave flip is real enough to record at close).
RSI validates or challenges that structure by tracking intrabar energy at the extremes (low/high touches).
Pyramid shows what sustained continuation looks like once (1) and (2) align.
This produces a layered view: Structure → Energy → Progression. Users can see when all three line up (strongest phases) and when they diverge (riskier phases or transitions).
How to Use It (Step-by-Step)
Quick Start
Apply script to any symbol/timeframe.
In Strategy/Indicator Properties:
Enable On every tick (recommended).
If available, enable Using bar magnifier and choose a lower resolution (e.g., 1m) to simulate intrabar fills more realistically.
Keep On bar close unchecked if you want to observe realtime logic in live charts (strategies still place orders on close by platform design).
Default behavior: Rasta & Pyramid = bar close; RSI = per tick with close backup.
Reading the Chart
Watch for Rasta Entry/Exit labels: they define clean structural turns on close.
Watch RSI Entry (LOW touch at/below lower band) and RSI Exit (HIGH touch at/above upper band) to gauge internal energy extremes.
Pyramid Add labels reveal continuation phases once a move is already in progress.
Tuning
Rasta smoothing: choose SMA/EMA/RMA/WMA or None. Higher smoothing → later but cleaner flips; lower smoothing → earlier but choppier.
RSI bands: a common educational setting is 15/85 for strong extremes; 20/80 is a bit looser.
Cooldown: increase if you see too many RSI re-fires in chop.
EMA 8/21 filter: toggle ON to study “trend-gated” entries, OFF to study raw momentum flips.
Backtesting Notes (for Strategy Builds)
Stops (optional): trail is armed when price advances by a trigger (default D–F₀), ratchets only upward from HIGH, and hits from LOW (or Close if chosen) with a tiny undershoot buffer to avoid micro-wicks.
Order sequencing per bar (mirrors the script’s code comments):
Trail ratchet via HIGH
Intrabar stop hit via LOW/CLOSE → immediate close
If still in position at bar close: process exits (Rasta/RSI)
If still in position at bar close: process Pyramid Add
If flat at bar close: process entries (Rasta/RSI)
Platform reality: strategies place orders at bar close in historical testing; the intrabar logic improves realism for stops and event marking but final order timestamps are still close-resolved.
Inputs Reference (common)
Modules: enable/disable RSI and Pyramid learning layers.
Rasta: EMA length, smoothing type/length, EMA8/21 filter & adaptive flip, fog opacity, rungs on/off & limit.
RSI: RSI length, signal MA length (panel), Entry band (LOW), Exit band (HIGH), cooldown bars, labels.
Pyramid: EMA length, smoothing, EMA8/21 filter & adaptive adds.
Execution: toggle Bar Close Only for Rasta/Pyramid; toggle Realtime + Close Backup for RSI.
Stops (strategy): Fixed Stop % (first), Fixed Stop % (add), Trail Distance %, Trigger rule (auto D–F₀ or custom), undershoot buffer %, and hit source (LOW/CLOSE).
What to Study With It
Convergence: how often RSI-LOW entry touches precede the next Rasta flip.
Divergence: cases where RSI screams exhaustion (HIGH >= upper band) but Rasta hasn’t flipped yet—often transition zones.
Continuation: how Pyramid adds cluster in strong moves; how spacing changes with smoothing/filter choices.
Regime changes: use EMA8/21 filter toggles to see what happens at macro turns vs chop.
Limitations & Scope
This is a learning tool, not a trade copier. It does not provide financial advice or automated execution.
Intrabar results depend on data granularity; bar magnifier (when available) can help simulate lower-resolution ticks, but true tick-by-tick fills are a platform-level feature and not guaranteed across all symbols.
Suggested Publication Settings (Strategy)
Initial capital: 100
Order size: 100 USD (cash)
Pyramiding: 10
Commission: 0.25%
Slippage: 3 ticks
Recalculate: ✓ On every tick
Fill orders: ✓ Using bar magnifier (choose 1m or similar); leave On bar close unchecked for live viewing.
Educational License
Released under the Michael Culpepper Gratitude License (2025).
Use and modify freely for education and research with attribution. No resale. No promises of profitability. Purpose is understanding, not signals.

DOGE 15MIN**Warm Reminder:** This strategy is intended solely for exploratory research and experimentation to evaluate the effectiveness of various signals. Drawing inspiration from patterns observed on the DOGE cryptocurrency 15-minute chart, it provides a tailored framework to identify potential trading opportunities. For optimal results, it is currently recommended exclusively for DOGE 15min charts. Remember, trading involves inherent risks, and past performance is not indicative of future results. We are dedicated to ongoing optimizations and refinements to enhance its robustness across broader applications—stay tuned for updates!
#### **A. Long Entry Signals**
These conditions trigger a long position entry, provided the strategy has no existing position (position_size == 0) and is not blocked. Signals can be enabled/disabled via input toggles (e.g., enable_vix).
- **VIX Reversal (vix_long)**: VIX signal shifts from high to low volatility (non-high volatility), with RSI between 30-50.
- **RSI Oversold (rsi_long)**: RSI crosses above 30.
- **CVD Bullish (cvd_long)**: CVD is rising.
- **Price RSI Bullish (prsi_long)**: Price RSI crosses above 30 or a long signal is triggered.
- **RangeEMA Bullish (rema_long)**: Candlestick is above POC, with KAMA trend flipping upward.
- **ZVWAP Oversold (zvwap_long)**: ZVWAP enters the oversold zone.
- **KAMA + Volume Bullish (kama_long)**: KAMA trend flips upward, candlestick is above POC, volume is rising, and the candle is bullish (green).
- **Volume Burst Bullish (vol_burst_long)**: Volume RSI crosses below threshold (default 70), open > close (bearish/red candle), triggered within the last two candles. **Special: Ignores all blocks** (bypasses not_long, Pivot, OI, RSI/ADX extreme filters).
#### **B. Short Entry Signals**
Similar to long entries: requires no existing position and no blocks.
- **RSI Overbought (rsi_short)**: RSI crosses below 70.
- **CVD Bearish (cvd_short)**: CVD is declining.
- **Price RSI Bearish (prsi_short)**: Price RSI crosses below 70 or a short signal is triggered.
- **RangeEMA Bearish (rema_short)**: Candlestick is below POC, with KAMA trend flipping downward.
- **ZVWAP Overbought (zvwap_short)**: ZVWAP enters the overbought zone.
- **KAMA + Volume Bearish (kama_short)**: KAMA trend flips downward, candlestick is below POC, volume is declining, and the candle is bearish (red).
- **Chop Bearish (chop_short)**: Chop crosses below 38.2, with RSI > 50.
- **Volume Burst Bearish (vol_burst_short)**: Volume RSI crosses below threshold (default 70), RSI > 70, and close > open (bullish/green candle), triggered within the last two candles. **Special: Ignores all blocks** (bypasses not_short, Pivot, OI, RSI/ADX extreme filters).
#### **C. Long Entry Blocks/Filters**
These conditions block long entries unless the signal ignores blocks (e.g., Volume Burst).
- **Base Prohibition (not_long)**: Volume is declining, or ADX is bearish (di_bear), or VIX is in high volatility (vix_flag), or RSI < 30.
- **Pivot Filter**: Recent Pivot is in a disadvantaged position.
- **OI Filter**: OI is declining.
- **RSI/ADX Extreme Filter**: RSI > 70 or ADX is bullish (di_bull).
- **Other**: Strategy already has a position (position_size != 0), or extreme volatility (is_extreme, though disabled in code).
#### **D. Short Entry Blocks/Filters**
Similar to long blocks.
- **Base Prohibition (not_short)**: Volume is rising, or (Chop < 38.2 and RSI > 50), or ADX is bullish (di_bull), or RSI > 70.
- **Pivot Filter**: Recent Pivot is in a disadvantaged position.
- **OI Filter**: OI is rising.
- **RSI/ADX Extreme Filter**: RSI < 30 or ADX is bearish (di_bear).
- **Other**: Existing position, or extreme volatility.
#### **E. Long Exit Signals**
Triggers closing of long positions, based on states (e.g., super_long, weak_long, only_kama).
- **KAMA Bearish Flip (exist_long)**: KAMA trend flips downward, or KAMA is downward with a short signal.
- **VIX Signal**: VIX shifts from low to high volatility, with RSI < 50.
- **Reversal Signal**: Short signal present and KAMA is downward.
- **Weak Trend Stop-Loss (weak_stop_long)**: In weak_long state, candlestick near POC, and close crosses below POC.
- **Weak KAMA Stop-Loss (weak_kama_long)**: In weak_long state, candlestick far from POC, and KAMA trend reverses.
- **Global Exit (exist_all)**: Volume RSI crosses below threshold (vol_under), or KAMA exit (kama_exit_long), or weak stop-loss, etc.
- **Special**: If in strong_long_hold (only_kama and KAMA remains bullish), ignore certain exit signals to hold the position.
#### **F. Short Exit Signals**
Similar to long exits.
- **KAMA Bullish Flip (exist_short)**: KAMA trend flips upward, or KAMA is upward with a long signal.
- **Reversal Signal**: Long signal present and KAMA is upward.
- **Weak Trend Stop-Loss (weak_stop_short)**: In weak_short state, candlestick near POC, and close crosses above short_state.current_max.
- **Weak KAMA Stop-Loss (weak_kama_short)**: In weak_short state, candlestick far from POC, and KAMA flips upward.
- **Global Exit (exist_all)**: Same as above.

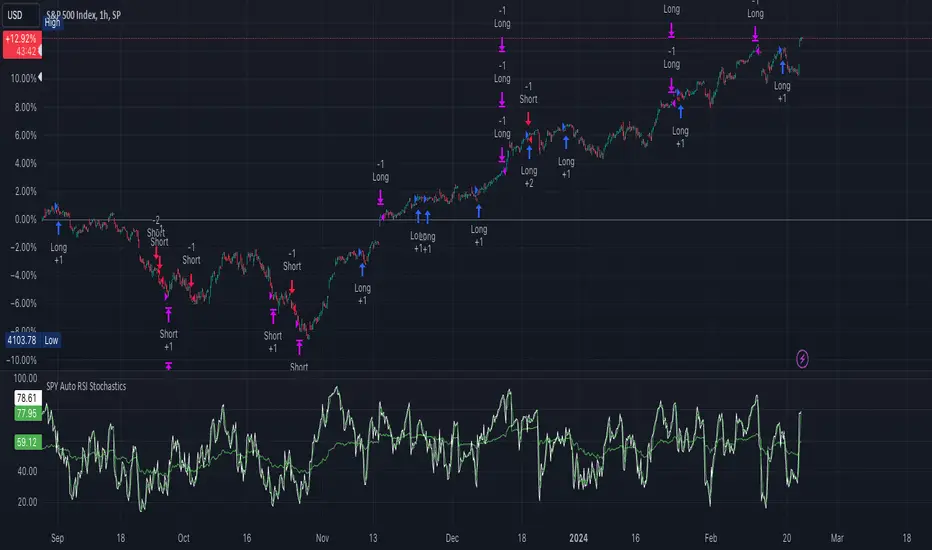
[strategy][1H] SPY slow stochastics
SPY slow stochastics
Overview
The "SPY Auto RSI Stochastics" strategy is designed to leverage a combination of Relative Strength Index (RSI) and Stochastic indicators to identify potential entry and exit points in trading the SPY $SP:SPX.
The technicals:
A simple yet effective strategy for identifying (reversal) trends on SPY (or any asset).
The logic is as follows:
1. Slow stochastics are effective at predicting momentum. They can also be used to effectively identify reversals.
2. A combination of slow and fast RSI (along with an SMA for the fast RSI) can be used to see potential changes in the directional trend of the underlying asset.
3. In order to reduce noise, a band in the middle of RSI values is ignored; think of this as the price converging and potential explosions (sometimes fake) on either side.
4. Outside this noise band, a crossover of fast RSI on slow RSI indicates an upward trend incoming.
5. A crossunder of fast RSI on slow RSI indicates a downward trend incoming.
Strategy Specific Notes -
1. Load this strategy on SPREADEX:SPX on an hourly chart for the best results.
2. This is a generic strategy, use it on anything - index, stocks, etc. You will need to adjust the parameters for the best results.
3. The RSI Upper defines the cutoff for two things -- threshold for entering a long AND exit signal for short. Likewise for RSI Lower.
4. To have alerts on the strategy, add this to your chart, be content with the backtesting results, select "strategy tester", the alert icon, replace the message body with "{{strategy.order.alert_message}}" without the ".
5. In my experience, the strategy won't be immediately profitable upon a signal but it does get there in the backtested results. Intuitively, this makes sense. Reversals take some time to kick in completely.
Inputs
- **slowRSILength**: Length parameter for the slow RSI calculation.
- **fastRSILength**: Length parameter for the fast RSI calculation.
- **smaRSILength**: Length parameter for the Simple Moving Average (SMA) of the fast RSI.
- **RSIUpperThreshold**: Upper threshold for the RSI, used in exit conditions.
- **RSILowerThreshold**: Lower threshold for the RSI, used in exit conditions.
- **RSIUpperDeadzone**: Upper deadzone threshold for the RSI.
- **RSILowerDeadzone**: Lower deadzone threshold for the RSI.
Strategy Logic
- **RSI Calculation**: The script calculates both slow and fast RSI values based on the provided lengths.
- **Entry Condition**: Entry conditions for long and short positions are based on the crossing of fast RSI over slow RSI and SMA RSI, respectively, along with avoidance of RSI deadzones and validation of trade time.
- **Exit Condition**: Exit conditions for both long and short positions are based on crossing RSI thresholds or opposite entry conditions.
Trade Management
- **Position Entry**: Long and short positions are entered based on predefined entry conditions.
- **Position Exit**: Positions are exited based on predefined exit conditions.
- **Alerts**: The script provides alert messages for entry and exit points.
Plotting
- **Slow RSI**: Plots the slow RSI on the chart.
- **SMA RSI**: Plots the Simple Moving Average of fast RSI on the chart.
Example Usage
The defaults work well for SPY on a 1H timeframe.
If you apply this to anything else DAX, EUSTX50, FTSE, CAC (these are what i have); tweak the input parameters.
Plotting
plot(slowRSI, "Slow RSI", color=color.green) //or fastRSI
plot(smaRSI, "SMA RSI", color=color.white)
Conclusion
The "SPY Auto RSI Stochastics" strategy combines RSI and Stochastic indicators to provide potential trade signals for the SPY ETF. Traders can use this strategy with proper risk management and analysis to enhance their trading decisions.