스크립트에서 "rsi"에 대해 찾기
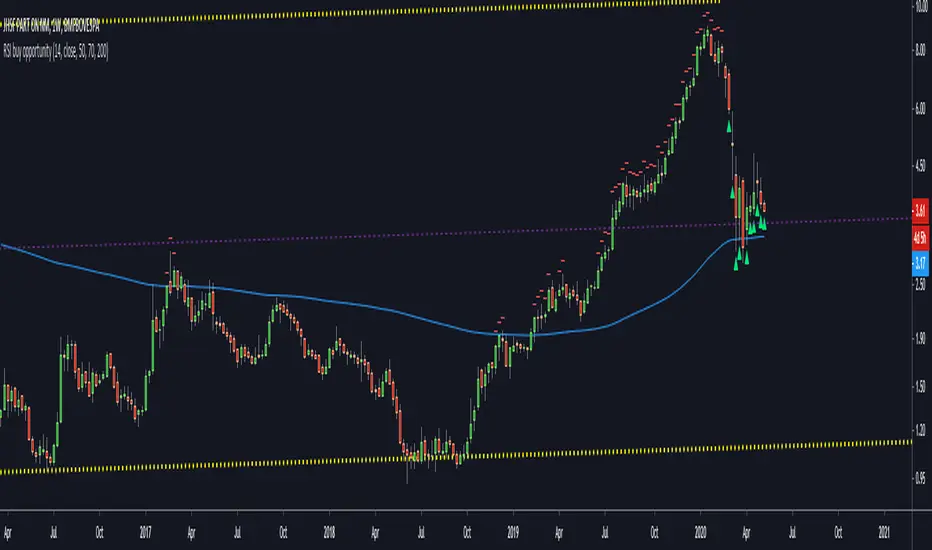
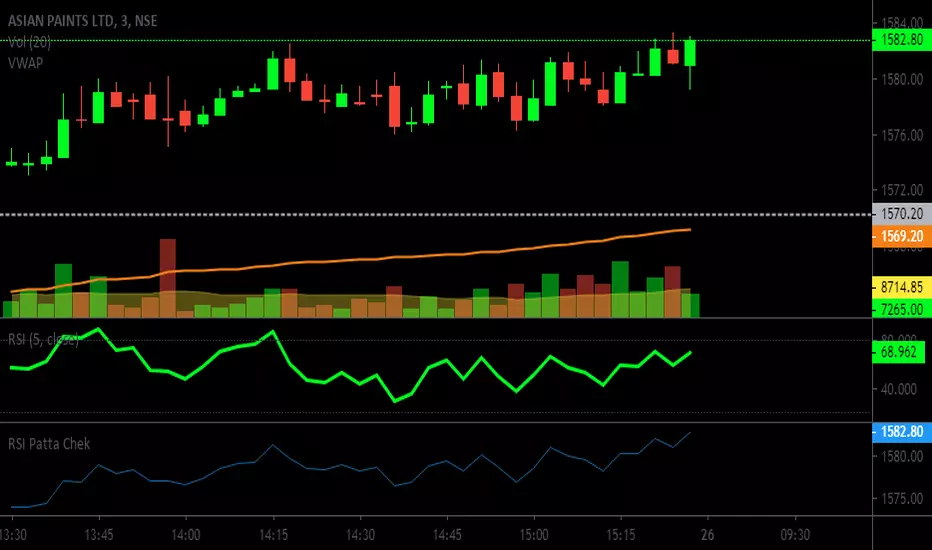
RSI buy opportunityRSI buy opportunity is an indicator to look for the best entries on weekly charts.
It depends on each stock and the values should change to optimize the entry.
Buy when green triangle shows up.
Never buy when red signal appears.

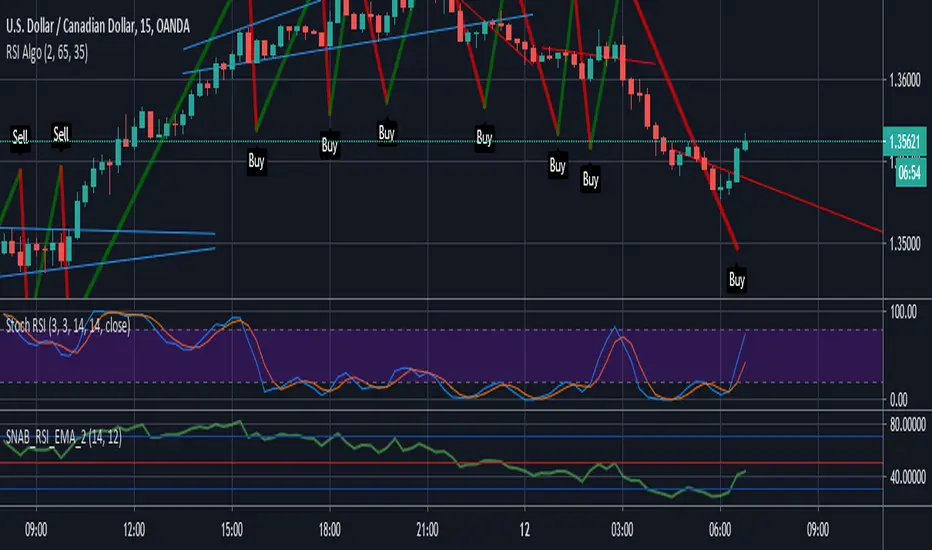
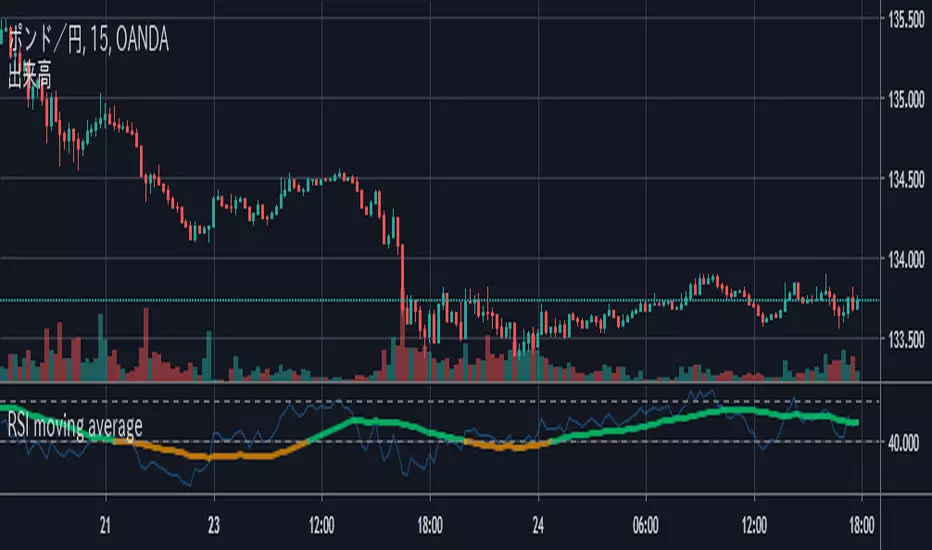
RSI moving averageRSI moving average
The line color changes between the upper and lower lines
Let's eradicate scammers!
Special thanks to Takahiro Seike

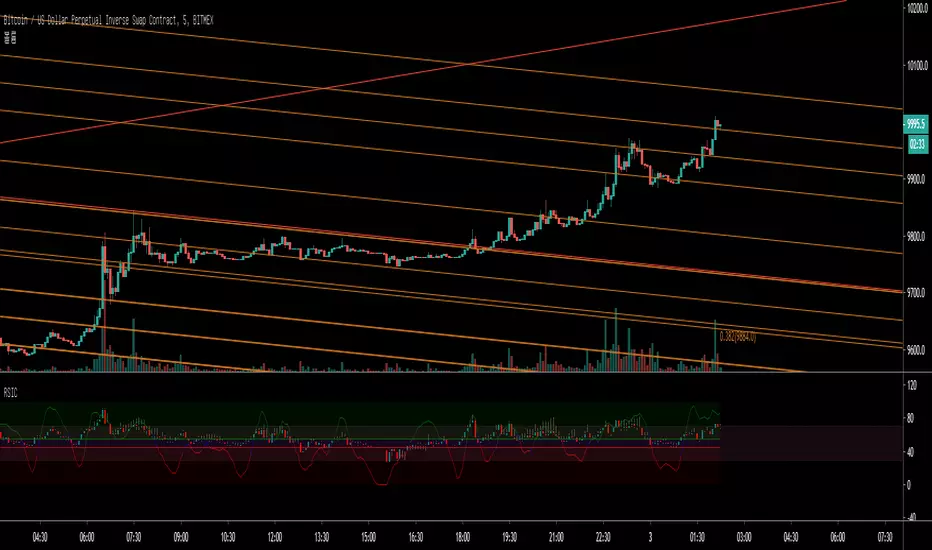


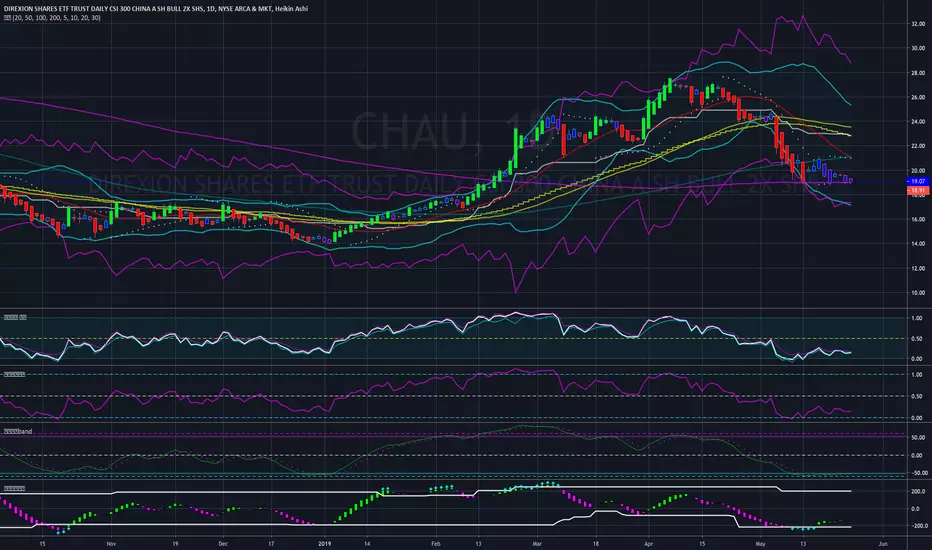
RSI Chart by Atilla YurtsevenRSI Chart helps me to spot divergences easily. Give this a try.
Disclaimer: This is not financial advice
Trade safe,
Atilla Yurtseven