LucciThis indicator identifies trade setups based on session liquidity levels and price structure analysis during New York trading sessions.
Unlike basic support/resistance indicators, this system tracks untested session extremes and monitors their interaction with price. It combines break-and-retest mechanics with bounce detection at key liquidity zones, providing multiple entry methodologies within a single framework.
METHODOLOGY:
The system maps high/low points from each trading session (Asia: 6PM-3AM, London: 3AM-8AM, NY: 8AM-5PM EST) and monitors price behavior around these levels. It identifies two primary setup types: momentum continuation after level breaks and reversal bounces at untested extremes. Visual differentiation shows which levels remain untested (darker) versus swept levels (lighter).
SETUP IDENTIFICATION:
Break & Retest Signals:
- Detects breaks of NY Open range (15-minute candle at 8:00 AM EST)
- Waits minimum bars after break before validating retest
- Triggers when price returns to level within tolerance zone
Bounce Signals:
- Identifies approaches to untested session highs/lows
- Optional wick confirmation for reversal validation
- Signals when price rejects from liquidity zone
CONFIGURATION OPTIONS:
Entry Parameters:
- Min Bars After Break: 1-10 (delay before retest valid)
- Retest Tolerance: 0.1-10 points (precision of level test)
- Bounce Zone: 0.5-5 points (distance from level)
- Wick Confirmation: On/off reversal filter
Risk Management:
- Risk Reward Options: 1:3, 1:5, or Custom (1:1 to 1:10)
- Stop Loss: Configurable in points
- Max Daily Signals: 1-5 trade limiter
- Trading Hours: Customizable active window
Visual Elements:
- Session Levels: Orange (Asian), Yellow (London), Blue (NY)
- Signal Markers: Triangles (B&R), Diamonds (Bounce)
- TP/SL Lines: Automatic calculation and display
- Info Table: Shows bias, untested levels, daily signals
OPTIMAL USAGE:
Trading Windows:
- 9:30-11:00 AM EST: Primary trading window
- First touch of untested levels: Highest probability
- 15-minute timeframe: Recommended for futures
- Volume filter: Optional quality enhancement
Signal Prioritization:
- Untested levels provide stronger reactions
- Multiple confirmations increase probability
- Respect market structure and session context
- Combine with volume for filtering
TECHNICAL SPECIFICATIONS:
- Multi-timeframe: Uses 15-minute data for NY Open
- Session-based: Resets levels at session transitions
- Alert system: Detailed messages with levels
- Position tracking: Manages active trades visually
IMPORTANT NOTES:
This tool maps liquidity zones based on session extremes and price structure. No trading system guarantees profits. Combine with market context and proper risk management. Designed for active intraday trading on liquid instruments.
The indicator provides objective level identification while requiring trader discretion for optimal results.
스크립트에서 "reversal"에 대해 찾기

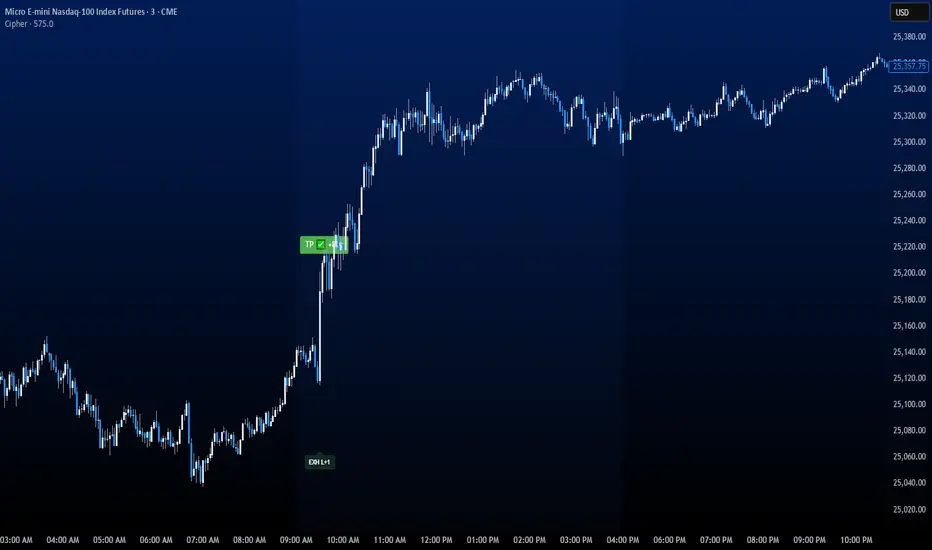
CipherThis indicator identifies potential reversal points through volume exhaustion analysis combined with multi-factor confirmation, volume distribution patterns at price extremes, market state classification based on volatility characteristics, and time-weighted probability calculations. Each component reduces false signals that single-factor indicators typically produce.
METHODOLOGY:
The system continuously monitors market conditions across multiple dimensions. When volume patterns indicate potential exhaustion at significant price levels, it checks for alignment with favorable market conditions and statistical probabilities. Signals only generate when multiple factors confirm, with entry triggered on momentum continuation beyond the exhaustion point.
COMPLETE USAGE GUIDE:
Signal Identification:
- "EXH L+2" = Long exhaustion with 2 confirmations
- "EXH S+3" = Short exhaustion with 3 confirmations
- Higher confirmation numbers indicate stronger setups
Entry Execution:
- Dashed lines mark entry trigger levels
- Entry activates when price breaks trigger within specified bar window
- Buffer setting controls distance from exhaustion bar (ticks)
Position Management:
- Automatic stop loss and target levels display on entry
- Green lines = profit targets
- Red lines = stop loss levels
- Info panel shows real-time position status
CONFIGURABLE PARAMETERS:
Timing Controls:
- Entry Buffer: 0-5 ticks (momentum confirmation distance)
- Max Bars to Wait: 3-10 bars (entry window duration)
- Session Times: Separate London/New York parameters
Sensitivity Settings:
- Volume Multiplier: 1.5-3.0 (vs 20-bar average)
- Lambda Values: Setup frequency expectations per session
- Stop Distances: Session-specific risk parameters
Risk Controls:
- Daily Win Limit: Stops after profitable day
- Daily Loss Limit: Prevents excessive drawdown
- Maximum Daily Trades: Controls overtrading
PERFORMANCE OPTIMIZATION:
Best Trading Windows:
- 10:00 AM EST: Primary reversal window
- 9:30-9:45 AM EST: Opening range exhaustion
- 3:00-4:00 AM EST: European session setups
- 2:30 PM EST: Afternoon reversal potential
Session Characteristics:
- London (2-9 AM EST): Lower frequency, cleaner setups
- New York (9 AM-4 PM EST): Higher frequency, requires filtering
- Background colors indicate active sessions
RISK PARAMETERS:
- Default Stops: 30-40 ticks (session-dependent)
- Risk:Reward Ratios: 1:1.5 to 1:3 (configurable)
- Trade Frequency: 2-4 quality setups weekly
VISUAL REFERENCE:
- Orange Background: London session active
- Blue Background: New York session active
- Yellow Markers: Exhaustion points identified
- Dashed Lines: Pending entry levels
- Solid Lines: Active trade levels
- Info Table: Statistics and system status
IMPORTANT CONSIDERATIONS:
This tool identifies potential setups based on rule-based analysis. Traders should understand that no system guarantees profits and should use appropriate risk management. The indicator works best on 3-minute and 5-minute timeframes in liquid markets. Combine with market context and price action understanding for optimal results.
TECHNICAL REQUIREMENTS:
- Best suited for index and commodites
- Optimized for 3M and 5M
- Requires volume data for proper function
- Best results with consistent market participation
Percentile Rank Oscillator (Price + VWMA)A statistical oscillator designed to identify potential market turning points using percentile-based price analytics and volume-weighted confirmation.
What is PRO?
Percentile Rank Oscillator measures how extreme current price behavior is relative to its own recent history. It calculates a rolling percentile rank of price midpoints and VWMA deviation (volume-weighted price drift). When price reaches historically rare levels – high or low percentiles – it may signal exhaustion and potential reversal conditions.
How it works
Takes midpoint of each candle ((H+L)/2)
Ranks the current value vs previous N bars using rolling percentile rank
Maps percentile to a normalized oscillator scale (-1..+1 or 0–100)
Optionally evaluates VWMA deviation percentile for volume-confirmed signals
Highlights extreme conditions and confluence zones
Why percentile rank?
Median-based percentiles ignore outliers and read the market statistically – not by fixed thresholds. Instead of guessing “overbought/oversold” values, the indicator adapts to current volatility and structure.
Key features
Rolling percentile rank of price action
Optional VWMA-based percentile confirmation
Adaptive, noise-robust structure
User-selectable thresholds (default 95/5)
Confluence highlighting for price + VWMA extremes
Optional smoothing (RMA)
Visual extreme zone fills for rapid signal recognition
How to use
High percentile values –> statistically extreme upward deviation (potential top)
Low percentile values –> statistically extreme downward deviation (potential bottom)
Price + VWMA confluence strengthens reversal context
Best used as part of a broader trading framework (market structure, order flow, etc.)
Tip: Look for percentile spikes at key HTF levels, after extended moves, or where liquidity sweeps occur. Strong moves into rare percentile territory may precede mean reversion.
Suggested settings
Default length: 100 bars
Thresholds: 95 / 5
Smoothing: 1–3 (optional)
Important note
This tool does not predict direction or guarantee outcomes. It provides statistical context for price extremes to help traders frame probability and timing. Always combine with sound risk management and other tools.

Delta Volume ReversalThis script displays Delta Volume-based reversal arrows by analyzing buying vs. selling volume from a lower timeframe. An up arrow appears when a red candle closes with dominant buying volume (bullish delta), while a down arrow appears on green candles with dominant selling volume (bearish delta). This highlights potential hidden strength or weakness in price action.
Credits:
Original from Delta Volume by SiddWolf — adapted and enhanced with reversal arrow visualization.

Entry (MTF) - Three phase Reversal patternOf course. We can absolutely reframe the explanation to give the strategy a more unique or generalized name, focusing on the concepts rather than the specific mentor.
Here is a revised, in-depth guide for your "Entry(MTF)" indicator, presented as the **"Momentum Shift Entry Model."**
***
### Entry (MTF) Indicator: A Guide to the Momentum Shift Model
This powerful indicator is designed to automatically detect a high-probability **Momentum Shift Entry Pattern**. The core strategy is to identify moments where the market's direction is likely to make a significant and sustained reversal, often driven by institutional order flow.
The indicator's key advantage is its **Multi-Timeframe (MTF)** functionality. It allows you to find these robust setups on a higher timeframe (like the daily chart) and then projects those signals onto your active, lower timeframe chart (like the 15-minute), providing a clear strategic edge for timing your entries.
---
## The Core Logic: The Three-Phase Reversal Pattern
This indicator is not based on a simple lagging condition. It looks for a specific three-step sequence of events. This sequence validates a genuine shift in market control from sellers to buyers (or vice-versa), filtering out false moves.
### Step 1: The Liquidity Purge 🎯
First, the indicator identifies recent, significant swing highs and lows on the chart. These price levels are natural magnets for liquidity, as many traders place their stop-loss orders there.
* **A Bullish Setup** begins when the price first dips **below a recent swing low**. This action is often an engineered move to "purge" or "sweep" the sell-side liquidity resting there before a move higher.
* **A Bearish Setup** begins with a price spike **above a recent swing high**, clearing out the buy-side liquidity.
This initial phase is designed to trap traders on the wrong side of the market before the true move begins.
### Step 2: The Market Structure Shift (The Confirmation) 🔄
After the liquidity has been taken, the indicator needs confirmation that a real power shift has occurred. This is confirmed by a **Market Structure Shift (MSS)**.
* After a **bullish purge (of a low)**, an MSS is confirmed when the price aggressively rallies and closes **above a recent swing *high***. This proves that buyers have not only absorbed all the selling but are now strong enough to break previous resistance levels.
* After a **bearish purge (of a high)**, an MSS is confirmed when the price falls and closes **below a recent swing *low***, showing that sellers are now decisively in command.
### Step 3: The Price Imbalance (The Entry Zone) GAP) is created during the same powerful move that caused the Market Structure Shift. A Fair Value Gap, or **price imbalance**, is a three-candle pattern that signifies a very aggressive, one-sided move, leaving a gap in the market that price will often seek to re-fill.
This FVG acts as the signature of institutional activity and becomes a high-probability zone for planning a trade entry.
---
## How to Use the Indicator in Your Trading
The true strength of this indicator lies in combining the higher-timeframe signal with the immediate context of your trading timeframe.
### Reading the Signals and Visuals
* **`BUY` / `SELL` Labels:** These are your primary signals, generated from the **"Signal Timeframe"** you select (e.g., Daily). A "BUY" label indicates that the complete three-phase bullish pattern has been confirmed on that higher timeframe.
* **Dotted Lines (Liquidity Levels):** The red and green dotted lines on your chart mark the most recent swing high and low on your **current timeframe**. These are the levels to watch for a potential "Liquidity Purge."
* **Colored Boxes (Imbalance Zones):** The green (bullish) and red (bearish) boxes highlight the Fair Value Gaps on your **current timeframe**. These are your potential entry zones.
### A Potential Trading Strategy
1. **Set Your Signal Timeframe:** Choose a higher timeframe that you use to define the overall trend (e.g., 'D' for daily, '4H' for 4-hour).
2. **Wait for an HTF Signal:** Patiently wait for a `BUY` or `SELL` label to appear. This is your cue to begin actively looking for an entry.
3. **Find a Local Entry Zone:** Once a `BUY` signal from the higher timeframe appears, look for the price on your current chart to retrace into a nearby **bullish FVG (green box)**. For a `SELL` signal, look for a pullback into a **bearish FVG (red box)**.
4. **Entry:** Plan your entry as the price tests this imbalance zone.
5. **Stop Loss:** A logical stop loss is critical. For a buy trade, place your stop below the swing low that was formed during the MSS. For a sell trade, place it above the corresponding swing high.
6. **Take Profit:** Aim for a significant liquidity level on a higher timeframe or use a predetermined risk-to-reward ratio (e.g., 1:2, 1:3).
---
## Customizing the Settings
* **`Signal Timeframe`**: The most critical setting. It determines the timeframe from which the core buy/sell logic originates. A Daily signal will carry more weight than an H1 signal.
* **`Liquidity/MSS Lookback`**: This controls the significance of the swing points the indicator uses.
* **Higher value:** Finds major, long-term swing points, leading to fewer but more powerful signals.
* **Lower value:** Finds minor, short-term swing points, leading to more frequent but potentially less reliable signals.
* **`Show Current TF Fair Value Gaps`**: This toggles the visibility of the imbalance zones (FVG boxes) on your chart. It is highly recommended to keep this enabled to easily spot your entry areas.

Estimated Manipulation Movement Signal [AlgoPoint]Follow the Footprints of Whale Movements That Drive the Market
Overview
The market is not always driven by natural supply and demand. Large players—often called "whales" or institutions—can create artificial price movements to trigger stop-losses, induce panic or FOMO, and build their large positions at favorable prices. These events are known as "stop hunts" or "liquidity grabs."
The EMMS indicator is a specialized tool designed to detect these specific moments of potential market manipulation. It does not follow trends in a traditional sense; instead, it identifies high-probability reversal points created by the calculated actions of Smart Money trapping other market participants.
How It Works: The 3-Module Logic
The indicator uses a multi-stage confirmation process to identify a potential stop hunt:
1. Anomaly Detection: The engine first scans the chart for "Anomaly Candles." These are candles with unusually high volume and a very long wick relative to their body. This combination signals a sudden, forceful, and potentially unnatural price push.
2. Liquidity Zone Detection: The indicator automatically identifies and tracks recent significant swing highs and lows. These levels are considered "Liquidity Zones" because they are areas where a large number of stop-loss orders are likely clustered. These are the "hunting grounds" for whales.
3. The Stop Hunt Signal: A final signal is generated only when these two events align in a specific sequence:
An Anomaly Candle (high volume, long wick) spikes through a previously identified Liquidity Zone.
The same candle then reverses, closing back inside the previous price range.
This sequence confirms that the move was likely a "trap" designed to engineer liquidity, and a reversal in the opposite direction is now highly probable.
How to Interpret & Use This Indicator
BUY Signal: A BUY signal appears after a sharp price drop that pierces a recent swing low (taking out the stops of long positions) and then aggressively reverses to close higher. This suggests that Smart Money has absorbed the panic selling they just induced. The signal indicates a potential move UP.
SELL Signal: A SELL signal appears after a sharp price spike that pierces a recent swing high (taking out the stops of short positions) and then aggressively reverses to close lower. This suggests that Smart Money has sold into the FOMO buying they just created. The signal indicates a potential move DOWN.
This indicator is best used as a high-probability confirmation tool, ideally in conjunction with your understanding of the overall market trend and structure.

[DEM] Floating Reversal Signal (With Backtesting) Floating Reversal Signal (With Backtesting) is designed to identify potential reversal opportunities by detecting counter-trend momentum shifts using a combination of SuperTrend analysis, ATR-based candle size filtering, and RSI oversold/overbought conditions. It also includes a comprehensive backtesting framework to evaluate the historical performance of these signals. The indicator overlays directly on the price chart, plotting signals and displaying performance statistics in a table. The strategy generates buy signals when price forms a bullish candle during a SuperTrend downtrend, with the previous candle's body size falling within specified ATR multiplier ranges (default 0.5x to 2x) and RSI showing oversold conditions below a configurable threshold, while sell signals are triggered under opposite conditions during uptrends with overbought RSI readings, aiming to capture "floating" reversal setups where price temporarily moves against the prevailing trend before resuming in the original direction.

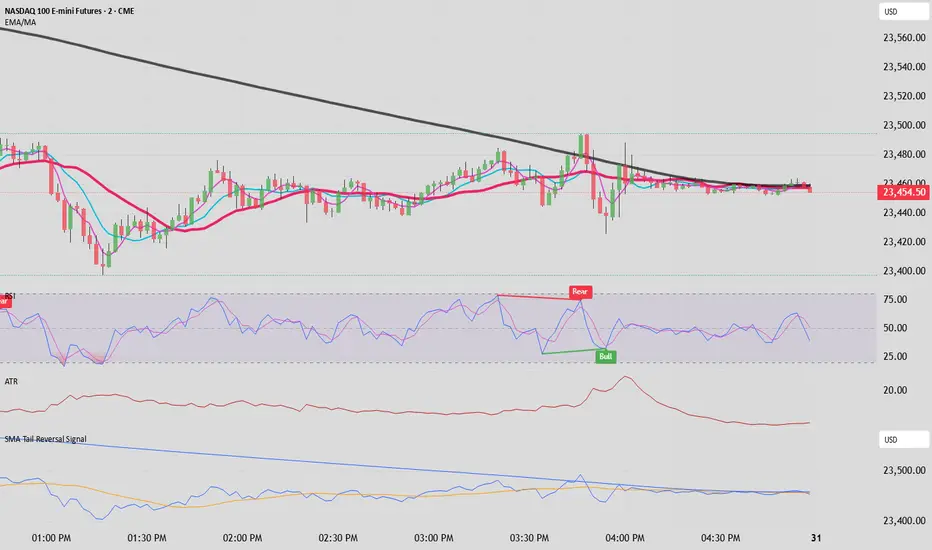
Peak Reversal v3# Peak Reversal v3
## Summary
Peak Reversal v3 adds new configurability, clearer visuals, and a faster trader workflow. The release introduces a new Squeeze Detector , expanded Keltner Channels , and streamlined Momentum signals , with no repaints and improved performance. The menus have been reorganized and simplified. Color swatches have been added for better customization. All other colors will be derived from these swatches.
## Highlights
New Squeeze Detector to mark low-volatility periods and prepare for breakouts.
New: Bands are now fully configurable with independent MA length, ATR length, and multipliers.
Five moving average bases for bands: EMA (from v2), SMA, RMA, VMA, HMA.
Simplified color system: three swatches drive candles, on-chart marks, and band fill.
Reorganized menu with focused sections and tooltips for each parameter making the entire trader experience more intuitive.
No repaints and faster performance across calculations.
## Overview
Configuration : Pick from three color swatches and apply them to candles, plotted characters, and band fill for consistent chart context. Use the reorganized menu to reach Keltner settings, momentum signals, and squeeze detection without extra clicks; tooltips clarify each input.
Bands and averages: Choose the band basis from EMA, SMA, RMA, VMA, or HMA to match your strategy. Configure two bands independently by setting MA length, ATR length, and band multipliers for the inner and outer envelopes.
Signals : Select the band responsible for momentum signals. Choose wick or close as the price source for entries and exits. Control the window for extreme momentum with “Max Momentum Bars,” a setting now exposed in v3 for direct tuning.
Squeeze detection : The Squeeze Detector normalizes band width and uses percentile ranking to highlight volatility compression. When the market falls below a user-defined threshold, the indicator colors the region with a gradient to signal potential expansion.
## Details about major features and changes
### New
Squeeze Detector to highlight low-volatility conditions.
Five MA bases for bands: EMA, SMA, RMA, VMA, HMA.
“Max Momentum Bars” to cap the bars used for extreme momentum.
### Keltner channel improvements
Refactored Keltner settings for flexible inner and outer band control.
MA type selection added; band calculations updated for consistency.
Removed the third Keltner band to reduce noise and simplify setup.
### Display and signals
Gradient fills for band breakouts, mean deviations, and squeeze periods.
“Show Mean EMA?” set to true and default “Signal Band” set to “Inner.”
Clearer tooltips and input descriptions.
### Reliability and performance
No more repaints. The indicator waits for confirmation before drawing occurs.
Faster execution through targeted refactors.
All algorithms have been reviewed and now use a consistent logic, naming, and structure.

SMA Tail Reversal Signalrubber band trade possible trend reversal bottom and top tail bars a distance away from 200sma can very well start the reversal back toward the 200sma
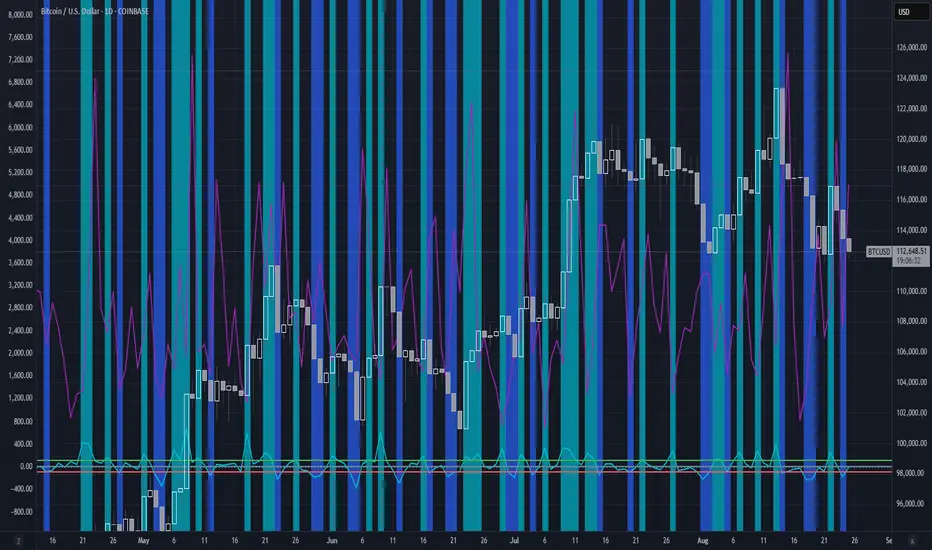
Dynamic Value Zone Oscillator (DVZO) - @CRYPTIK1Dynamic Value Zone Oscillator (DVZO) @CRYPTIK1
Introduction: What is the DVZO?
The Dynamic Value Zone Oscillator (DVZO) is a powerful momentum indicator that reframes the classic "overbought" and "oversold" concept. Instead of relying on a fixed lookback period like a standard RSI or Stochastics, the DVZO measures the current price relative to a significant, higher-timeframe Value Zone (e.g., the previous week's entire price range).
This gives you a more contextual and structural understanding of price. The core question it answers is not just "Is the price moving up or down quickly?" but rather, "Where is the current price in relation to its recently established area of value?"
This allows traders to identify true "premium" (overbought) and "discount" (oversold) levels with greater accuracy, leading to higher-probability reversal and trend-following signals.
The Core Concept: Price vs. Value
The market is constantly trying to find equilibrium or "fair value." The DVZO is built on the principle that the high and low of a significant prior period (like the previous day, week, or month) create a powerful area of perceived value.
The Value Zone: The range between the high and low of the selected higher timeframe. The midpoint of this zone is the equilibrium (0 line on the oscillator).
Premium Territory (Distribution Zone): When price breaks above the Value Zone High (+100 line), it is trading at a premium. This is an area where sellers are more likely to become active and buyers may be over-extending.
Discount Territory (Accumulation Zone): When price breaks below the Value Zone Low (-100 line), it is trading at a discount. This is an area where buyers are more likely to see value and sellers may be exhausted.
By anchoring its analysis to these significant structural levels, the DVZO filters out much of the noise from lower-timeframe price fluctuations.
Key Features
The Oscillator:
The main blue line visualizes exactly where the current price is within the context of the Value Zone.
+100: The high of the Value Zone.
0: The midpoint/equilibrium of the Value Zone.
-100: The low of the Value Zone.
Automatic Divergence Detection:
The DVZO automatically identifies and plots bullish and bearish divergences on both the price chart and the oscillator itself.
Bullish Divergence: Price makes a new low, but the DVZO makes a higher low. This is a strong signal that downside momentum is fading and a reversal to the upside is likely.
Bearish Divergence: Price makes a new high, but the DVZO makes a lower high. This indicates that upside momentum is waning and a pullback is probable.
Value Migration Histogram:
The purple histogram in the background visualizes the width of the Value Zone.
Expanding Histogram: Volatility is increasing, and the accepted value range is getting wider.
Contracting Histogram: Volatility is decreasing, and the price is coiling in a tight range, often in anticipation of a major breakout.
How to Use the DVZO: Trading Strategies
1. Reversion Trading
This is the most direct way to use the indicator.
Look for Buys: When the DVZO line drops below -100, the price is in the "Accumulation Zone." Wait for the price to show signs of strength (e.g., a bullish candle pattern) and the DVZO line to start turning back up towards the -100 level. This is a high-probability mean reversion setup.
Look for Sells: When the DVZO line moves above +100, the price is in the "Distribution Zone." Look for signs of weakness (e.g., a bearish engulfing candle) and the DVZO line to start turning back down towards the +100 level.
2. Divergence Trading
Divergences are powerful confirmation signals.
Entry Signal: When a Bullish Divergence appears, it provides a strong entry signal for a long position, especially if it occurs within the Accumulation Zone (below -100).
Exit/Short Signal: When a Bearish Divergence appears, it can serve as a signal to take profit on long positions or to look for a short entry, especially if it occurs in the Distribution Zone (above +100).
3. Best Practices & Settings
Timeframe Synergy: The DVZO is most effective when your chart timeframe is lower than your selected Value Zone Source.
For Day Trading (e.g., 1H, 4H chart): Use the "Previous Day" Value Zone.
For Swing Trading (e.g., 1D, 12H chart): Use the "Previous Week" or "Previous Month" Value Zone.
Confirmation is Key: The DVZO is a powerful tool, but it should not be used in isolation. Always combine its signals with other forms of analysis, such as market structure, support/resistance levels, and candlestick patterns, for confirmation.
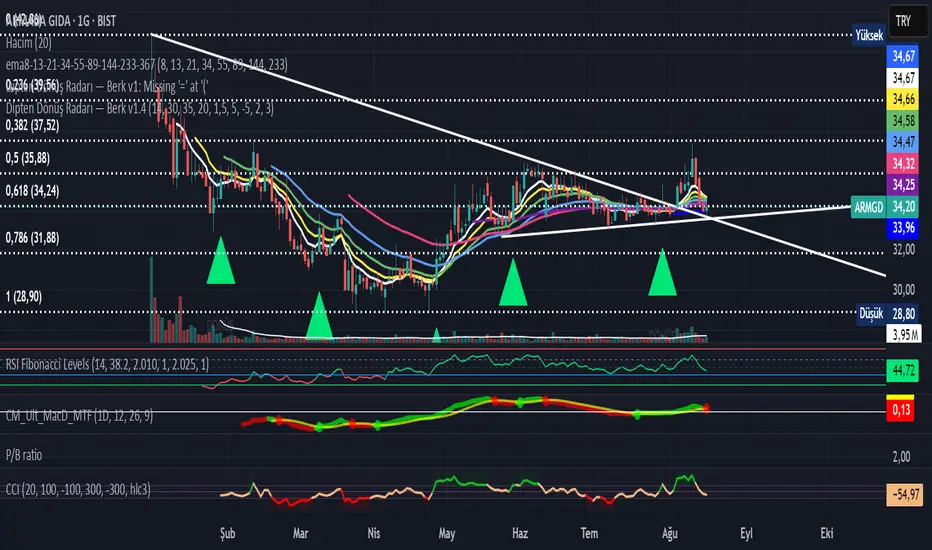
Bottom Reversal Radar — Berk v1.4Bottom Reversal Radar — Berk v1.4
What it does:
Combines RSI recovery after oversold, MACD bull cross, close above EMA8, near-EMA200 proximity, volume expansion, and simple bullish divergence (pivot lows) into a single score.
Signal: Trigger when Score ≥ Threshold (default 3). Set alert via Create Alert → “Dipten Dönüş — Ana Sinyal” → Once per bar close.
How it works
RSI recovery: After touching oversold (30), RSI crosses up 35 within last X bars.
MACD bull cross: MACD Line crosses above Signal.
Close above EMA8 and BOS (close above recent swing high) confirm momentum.
Near EMA200: Price within −5%…+2% band adds a point.
Volume spike: Volume ≥ 1.5× SMA(20) adds a point.
Bullish divergence: Lower price low + higher RSI low (pivot 3/3) adds a point.
Inputs
RSI(14), rsiOS=30, rsiRecover=35, Volume SMA(20) with 1.5× multiplier, EMA200 proximity band −5%…+2%, lookbackBars=5, Score threshold default 3.
Usage tips
Best on Daily / 4H. If too many false positives: raise threshold to 4 and volume to 1.8–2.0×.
Pair with Screener filters: RSI≥35, MACD Line>Signal, Price above EMA8, Volume/Avg(20)≥1.5, and near EMA200 (%).
Disclaimer
For educational purposes only. Not financial advice.
Release notes (v1.4)
Fixed bullDiv typo; simplified visuals; Pine v5.
Tags: rsi, macd, ema, volume, divergence, reversal, trend, screener, bist, stocks, crypto
DTLLC Time & PriceDTLLC Time and Price with Signals
This indicator is built for traders who understand ICT concepts and want a structured, visual way to align time-based price action with key market levels. By combining customizable trading windows, breakout logic, and daily reference points, it helps you identify high-probability trade opportunities while filtering out market noise.
Key Features
1. Dual Custom Time Ranges (Kill Zones)
Set two independent time ranges per day (start/end hour and minute).
Each range identifies the highest high and lowest low within its window.
Built-in breakout detection generates buy/sell signals when price moves beyond these levels.
2. Volatility Filtering
Adjustable volatility threshold based on True Range relative to ATR.
Filters out low-quality signals during choppy, low-volatility conditions.
3. ATR-Based Stop Loss
Custom ATR length and stop-loss multiplier settings.
Automatically plots ATR-based stop levels for triggered trades.
4. Daily Key Levels
Plots Previous Day High, Previous Day Low, and Midnight Open continuously on the chart.
Useful for spotting breakout and reversal opportunities in line with ICT market structure concepts.
5. Liquidity & Engulfing Candle Highlights
Highlights potential liquidity grab zones (yellow candles) when significant highs/lows are set within your lookback period.
Detects bullish (green) and bearish (red) engulfing patterns for added confluence.
6. Visual & Signal Tools
Buy/Sell signals plotted directly on chart (separate colors for Range 1 and Range 2). Continuous plotting of reference levels to maintain market context throughout the session.
Example Use Case:
A common ICT-inspired reversal setup:
Wait for price to sweep the Previous Day’s High or Low during your chosen time range.
Look for a buy or sell signal with volatility confirmation.
Manage risk using the ATR-based stop-loss plot.
Disclaimer: This script is for educational purposes only and is not financial advice. Trade responsibly and always test strategies before applying them in live markets.

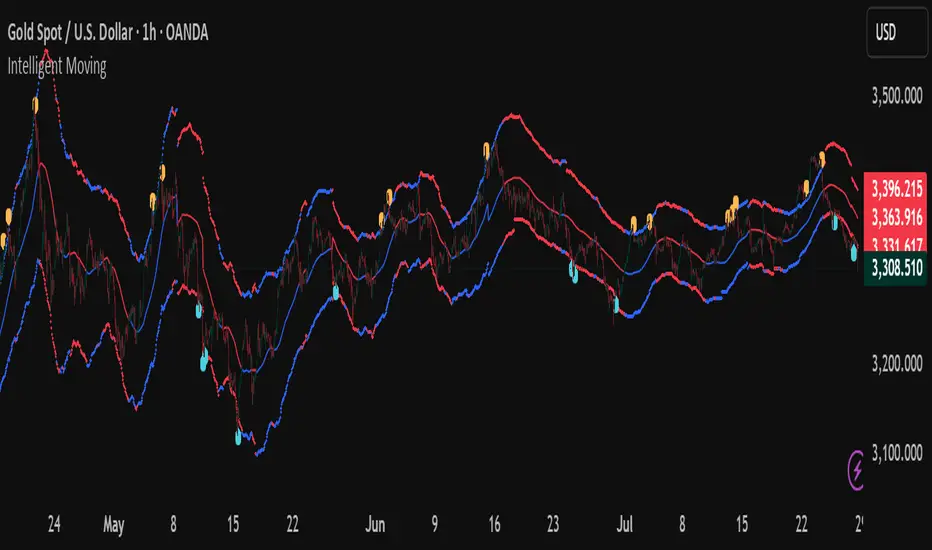
Intelligent Moving📘 Intelligent Moving – Adaptive Neural Trend Engine
Intelligent Moving is an invite-only, closed-source indicator that dynamically adjusts itself to evolving market conditions using a built-in neural optimizer. It combines a custom adaptive Moving Average, ATR-based deviation bands, and a fully internal virtual trade simulator to deliver smart trend signals and automatic parameter tuning — all without repainting or manual intervention.
This script is built entirely from original code and does not use any open-source components or built-in TradingView indicators.
🧠 Core Logic and Visual Structure
The indicator plots:
- A central moving average (optimized dynamically),
- Upper and lower deviation bands based on ATR × adaptive coefficients,
- Buy (aqua) and Sell (orange) arrows on reversion signals,
- Color-coded trend zones based on price vs. moving average.
All three bands change color in real time depending on the price’s position relative to the MA, clearly showing uptrends (e.g. blue) and downtrends (e.g. red).
📈 Signal Logic: Reversion from Extremes
- Buy Signal: After price closes below the lower deviation band, it then closes back above it.
- Sell Signal: After price closes above the upper deviation band, it then closes back below it.
These signals are not based on crossovers, oscillators, or lagging logic — they are pure structure-based reversion entries, designed to detect exhaustion and reversal zones.
🤖 Built-In Neural Optimizer (Perceptron Engine)
At the heart of Intelligent Moving lies a self-training engine that uses simulated (virtual) positions to test multiple configurations and pick the best one. Here’s how it works:
🔄 Virtual Trade Simulation
At regular intervals (user-defined), the script:
- Simulates virtual buy/sell positions based on its signal logic.
- Applies virtual Stop-Loss (just beyond the signal zone) and virtual Take-Profit (when price crosses back over the MA).
- Calculates simulated profit for each combination of:
- - MA periods,
- - Upper/lower ATR multipliers.
🧠 Neural Training Process
- A perceptron-like engine evaluates the simulated results.
- It selects the best-performing configuration and applies it to live plotting.
- You can choose whether optimization uses a base value or the last best result from the previous training pass.
This process runs forward-only and never overwrites history or uses future data. It's completely transparent and non-repainting.
⚙️ Customization and Parameters
Users can control:
- MA period range, step, and training type (base vs last best)
- Deviation multiplier ranges and step
- Training depth (number of bars in history)
- Training interval (how often to retrain)
- Spread simulation, alert options, and all visual settings
💡 What Makes It Unique
- ✅ Self-optimization with virtual trades and perceptron logic
- ✅ Adaptive deviation bands based on ATR (not standard deviation)
- ✅ No built-in indicators, no repaints, no curve-fitting
- ✅ Clear trend zones and reversal signals
- ✅ Optimized for live use and consistent behavior across assets
Unlike typical moving average tools, Intelligent Moving thinks, adapts, and reacts — turning a standard concept into a living, learning trend engine.
📊 Use Cases
- Trend detection with adaptive coloring
- Reversion trading from volatility extremes
- Dynamic strategy building with minimal manual input
- Alerts for automated or discretionary traders
🔒 Invite-Only Notice
This script is invite-only and closed-source.
The optimization logic, trade simulation system, and perceptron engine were developed from scratch, specifically for this indicator. No built-in functions (e.g. MA, BB, RSI) or public scripts were used or copied.
All decisions and calculations are based on current and past price only — no repainting, retrofitting, or future leakage.
⚠️ Disclaimer
This indicator is for educational and analytical use only.
It does not predict future prices or guarantee profits. Always use appropriate risk management and test thoroughly before live trading.
WT + Stoch RSI Reversal ComboOverview – WT + Stoch RSI Reversal Combo
This custom TradingView indicator combines WaveTrend (WT) and Stochastic RSI (Stoch RSI) to detect high-probability market reversal zones and generate Buy/Sell signals.
It enhances accuracy by requiring confirmation from both oscillators, helping traders avoid false signals during noisy or weak trends.
🔧 Key Features:
WaveTrend Oscillator with optional Laguerre smoothing.
Stochastic RSI with adjustable smoothing and thresholds.
Buy/Sell combo signals when both indicators agree.
Histogram for WT momentum visualization.
Configurable overbought/oversold levels.
Custom dotted white lines at +100 / -100 levels for reference.
Alerts for buy/sell combo signals.
Toggle visibility for each element (lines, signals, histogram, etc.).
✅ How to Use the Indicator
1. Add to Chart
Paste the full Pine Script code into TradingView's Pine Editor and click "Add to Chart".
2. Understand the Signals
Green Triangle (BUY) – Appears when:
WT1 crosses above WT2 in oversold zone.
Stoch RSI %K crosses above %D in oversold region.
Red Triangle (SELL) – Appears when:
WT1 crosses below WT2 in overbought zone.
Stoch RSI %K crosses below %D in overbought region.
⚠️ A signal only appears when both WT and Stoch RSI agree, increasing reliability.
3. Tune Settings
Open the settings ⚙️ and adjust:
Channel Lengths, smoothing, and thresholds for both indicators.
Enable/disable visibility of:
WT lines
Histogram
Stoch RSI
Horizontal level lines
Combo signals
4. Use with Price Action
Use this indicator in conjunction with support/resistance zones, chart patterns, or trendlines.
Works best on lower timeframes (5m–1h) for scalping or 1h–4h for swing trading.
5. Set Alerts
Set alerts using:
"WT + Stoch RSI Combo BUY Signal"
"WT + Stoch RSI Combo SELL Signal"
This helps you catch setups in real time without watching the chart constantly.
📊 Ideal Use Cases
Reversal trading from extremes
Mean reversion strategies
Timing entries/exits during consolidations
Momentum confirmation for breakouts

FVG-Bully BearsFVG-Bully Bears Indicator
The FVG-Bully Bears indicator is a powerful tool designed to identify Fair Value Gaps (FVGs) on your TradingView charts. FVGs are price gaps that occur when the market moves sharply, leaving areas where little to no trading activity took place. These gaps often act as key support or resistance zones, making them valuable for traders looking to spot potential reversal or continuation points.
This indicator highlights Bullish FVGs (potential support zones) and Bearish FVGs (potential resistance zones) with customizable boxes and labels, helping you visualize these critical price levels with ease.
Features
Bullish and Bearish FVGs: Detects gaps where price has left untested areas, marking bullish (green) and bearish (red) FVGs.
Customizable Display: Choose to show or hide bullish/bearish FVGs, adjust colors, and control box visibility.
FVG Labels: Optional labels on each FVG box to clearly identify bullish or bearish gaps, with adjustable text size.
Delete Filled FVGs: Automatically removes FVGs once price revisits and fills the gap, keeping your chart clean.
Box Extension: Extend FVG boxes into the future (up to 100 bars) to track unfilled gaps over time.
Performance Optimization: Limits the number of displayed FVG boxes (default: 50) to ensure smooth chart performance.
How It Works
Bullish FVG: Identified when the high of a candle two bars ago is lower than the low of the current candle, indicating a sharp upward move.
Bearish FVG: Identified when the low of a candle two bars ago is higher than the high of the current candle, indicating a sharp downward move.
FVGs are drawn as colored boxes (green for bullish, red for bearish) and can include labels for easy identification.
If enabled, filled FVGs (where price revisits the gap) are deleted to reduce chart clutter.
Settings
FVG Settings
Show Bullish FVGs: Enable/disable bullish FVG boxes (default: enabled).
Show Bearish FVGs: Enable/disable bearish FVG boxes (default: enabled).
Bullish FVG Color: Customize the color and transparency of bullish FVG boxes (default: light green).
Bearish FVG Color: Customize the color and transparency of bearish FVG boxes (default: light red).
Max FVG Boxes: Set the maximum number of FVG boxes displayed (default: 50, range: 1–500).
Extend FVG Boxes (Bars): Extend FVG boxes into the future by a specified number of bars (default: 8, range: 0–100).
Show FVG Labels: Enable/disable text labels on FVG boxes (default: enabled).
Label Size: Choose the size of FVG labels (options: Tiny, Small, Normal, Large, Huge; default: Small).
Delete Filled FVGs: Automatically remove FVGs when price fills the gap (default: enabled).
How to Use
Add the FVG-Bully Bears indicator to your TradingView chart.
Customize the settings to match your trading style (e.g., adjust colors, toggle labels, or change box extensions).
Watch for green (bullish) and red (bearish) FVG boxes:
Bullish FVGs: Potential support zones where price may bounce or consolidate.
Bearish FVGs: Potential resistance zones where price may reverse or stall.
Use FVGs in combination with other indicators (e.g., support/resistance, trendlines) for better trade decisions.
If “Delete Filled FVGs” is enabled, filled gaps will disappear, keeping your chart focused on active FVGs.
Ideal For
Swing Traders: Identify key price zones for entries or exits.
Day Traders: Spot intraday support/resistance levels created by rapid price moves.
Price Action Traders: Use FVGs to confirm market structure and potential reversal points.
Notes
For best performance, keep “Max FVG Boxes” at a reasonable value (e.g., 50) to avoid chart lag.
FVGs are most effective on lower timeframes (e.g., 5m, 15m, 1H) but can be used on any timeframe.
Combine with other tools like volume or trend indicators for a complete trading strategy.
Enjoy trading with FVG-Bully Bears and take advantage of Fair Valu

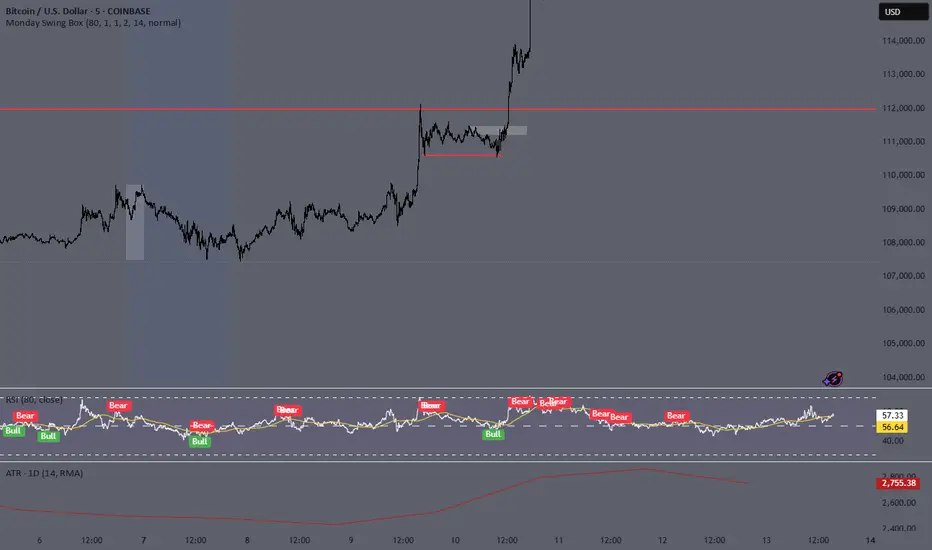
Monday Swing Box# Monday Swing Box Indicator - Trading Applications
This "Monday Swing Box" indicator can be very useful in trading for several strategic reasons:
## 1. **"Monday Effect" Analysis**
* **Concept**: Mondays often have particular characteristics in the markets (opening gaps, weekend catch-up, different volumes)
* **Utility**: Allows visualization and quantification of these Monday-specific movements
* **Application**: Helps identify recurring patterns in your strategy
## 2. **Relative Volatility Measurement with ATR**
* **The ATR percentage tells you**:
* **< 50%**: Low volatility Monday (possible consolidation)
* **50-100%**: Normal volatility
* **> 100%**: Very volatile Monday (important event, potential breakout)
* **Advantage**: Contextualizes the movement relative to historical volatility
## 3. **Practical Trading Applications**
### **For Day Trading**:
* **Entry**: A Monday with >150% ATR may signal a strong movement to follow
* **Stop Loss**: Adjust stop sizes according to Monday's volatility
* **Targets**: Calibrate targets according to the movement's magnitude
### **For Swing Trading**:
* **Support/Resistance**: Monday's high/low often become key levels
* **Breakout**: Breaking above/below Monday's box may signal continuation
* **Retracement**: Return to Monday's box = support/resistance zone
### **For Risk Management**:
* **Sizing**: Adapt position sizes according to measured volatility
* **Timing**: Avoid trading abnormally volatile Mondays if you prefer stability
## 4. **Specific Possible Strategies**
### **"Monday Breakout"**:
* Wait for a break above/below Monday's box
* Enter in the direction of the breakout
* Stop at the other end of the box
### **"Monday Reversal"**:
* If Monday shows >200% ATR, look for a reversal
* The box becomes a resistance/support zone
### **"Monday Range"**:
* Trade bounces off the box limits
* Particularly effective if ATR % is normal (50-100%)
## 5. **Visualization Advantages**
* **Historical**: See past patterns across multiple Mondays
* **Comparison**: Compare current volatility to previous Mondays
* **Anticipation**: Prepare your strategy according to the type of Monday observed
## 6. **Limitations to Consider**
* Monday patterns can vary according to markets and periods
* Don't trade solely on this indicator, but use it as a complement
* Consider macroeconomic context and news
This indicator is therefore particularly useful for traders who want to exploit Monday's specificities and have an objective measure of this day's relative volatility compared to normal market conditions.
ATR Trailing + Alerts + Price LabelsATR Trend is a clean and intelligent trend-following overlay built for traders who want clarity during both trending and ranging markets.
This indicator dynamically detects bullish and bearish market trends using the Average True Range (ATR), applying a confirmation-based approach to filter out false signals and minor pullbacks.
The trend line is:
Blue 🔵 during uptrends.
Black ⚫ during downtrends.
Continuous, recalculating only when the market truly shifts — not just when price temporarily crosses the line.
When a confirmed trend reversal occurs:
A 🔼 or 🔽 label shows the exact price of the flip.
An alert can be triggered to notify the user immediately.
💡 Features:
✅ Single-line trend direction
✅ Filters out short-term noise
✅ Exact price labeling on trend change
✅ Built-in alerts for up/down trend shifts
⚙️ Inputs:
ATR Period – Length of ATR calculation (default: 14)
ATR Multiplier – Offset for trend line placement (default: 2.0)
Flip Sensitivity – Number of bars required to confirm a trend reversal (default: 3)
This tool is suitable for:
Swing traders avoid false breakouts
Scalpers looking for high-probability trend entries
Algorithmic setups requiring structured trend logic

Liquidity Sweep Reversal [Grimoire]The Liquidity Sweep Reversal indicator is designed to spot potential turning points by watching for “liquidity sweeps” above key prior highs. Specifically, it marks when price briefly pushes above levels such as:
The high of the previous candle
The high of the prior trading day
The high of the previous week
These sweeps often trigger stop-hunts or liquidity hunts, after which price frequently reverses. By highlighting those moments, the indicator helps you anticipate and trade these reversal moves more easily.

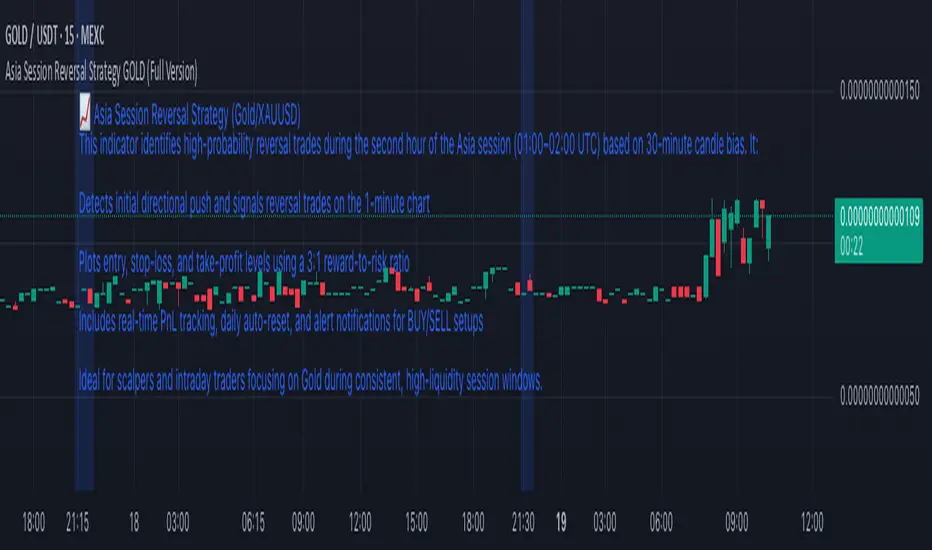
Asia Session Reversal Strategy GOLD (Full Version)📈 Asia Session Reversal Strategy (Gold/XAUUSD)
This indicator identifies high-probability reversal trades during the second hour of the Asia session (01:00–02:00 UTC) based on 30-minute candle bias. It:
Detects initial directional push and signals reversal trades on the 1-minute chart
Plots entry, stop-loss, and take-profit levels using a 3:1 reward-to-risk ratio
Includes real-time PnL tracking, daily auto-reset, and alert notifications for BUY/SELL setups
Ideal for scalpers and intraday traders focusing on Gold during consistent, high-liquidity session windows.
OB Sweeps ReversalOB Sweeps Reversal is a high-precision market structure tool that identifies and dynamically tracks bullish and bearish order blocks — key zones where institutional participants are likely to be active. These zones act as support and resistance levels, adapting to market behavior in real time.
The script monitors price interaction with each OB and classifies its status as:
Unmitigated (price has not yet returned)
Mitigating (price is testing the zone)
Invalidated (zone has been broken)
Traders can use these zones directly as actionable support/resistance — or wait for additional confirmation via the system’s liquidity sweep detection and optional filters.
🔍 Key Features:
Automatically detects and plots bullish and bearish OBs
Tracks mitigation status and updates visuals accordingly
Detects liquidity sweeps of recent highs/lows
Optional filters:
• 200 EMA trend direction
• Momentum of current or previous candle
Plots stop-loss and take-profit lines using ATR-based logic
Clean entry labels with full contextual data
Built-in alert system with constant-string messages (automation ready)
📈 How to Use:
Load the script on any timeframe (15m–4H recommended)
Observe the live OB zones as they develop
Trade based on price interaction:
• Bounce off a bullish OB = potential long setup
• Rejection from a bearish OB = potential short
• Sweep + snapback into an OB = optional trap reversal entry
SL/TP levels are drawn automatically for reference
Use alerts to automate or monitor high-conviction setups
The order blocks themselves are valuable on their own — even without waiting for a signal. They can be used as dynamic support and resistance zones, offering excellent structure-based trading opportunities.
🧠 Ideal For:
Traders who follow price action and market structure
Those using support/resistance, OBs, or supply/demand
Intraday and swing traders looking for cleaner structure alignment
Users who prefer low-frequency, high-quality setups
⚠️ Note:
This tool does not produce frequent signals. It is designed for precision and discipline, with a focus on clarity and confluence. It complements — not replaces — a trader’s decision-making process.
This script is open-source and designed with integrity, precision, and trader usability in mind. No links, no upsells, no promotions — just a reliable system for structural market analysis.

Auto TrendLines [TradingFinder] Support Resistance Signal Alerts🔵 Introduction
The trendline is one of the most essential tools in technical analysis, widely used in financial markets such as Forex, cryptocurrency, and stocks. A trendline is a straight line that connects swing highs or swing lows and visually indicates the market’s trend direction.
Traders use trendlines to identify price structure, the strength of buyers and sellers, dynamic support and resistance zones, and optimal entry and exit points.
In technical analysis, trendlines are typically classified into three categories: uptrend lines (drawn by connecting higher lows), downtrend lines (formed by connecting lower highs), and sideways trends (moving horizontally). A valid trendline usually requires at least three confirmed touchpoints to be considered reliable for trading decisions.
Trendlines can serve as the foundation for a variety of trading strategies, such as the trendline bounce strategy, valid breakout setups, and confluence-based analysis with other tools like candlestick patterns, divergences, moving averages, and Fibonacci levels.
Additionally, trendlines are categorized into internal and external, and further into major and minor levels, each serving unique roles in market structure analysis.
🔵 How to Use
Trendlines are a key component in technical analysis, used to identify market direction, define dynamic support and resistance zones, highlight strategic entry and exit points, and manage risk. For a trendline to be reliable, it must be drawn based on structural principles—not by simply connecting two arbitrary points.
🟣 Selecting Pivot Types Based on Trend Direction
The first step is to determine the market trend: uptrend, downtrend, or sideways.
Then, choose pivot points that match the trend type :
In an uptrend, trendlines are drawn by connecting low pivots, especially higher lows.
In a downtrend, trendlines are formed by connecting high pivots, specifically lower highs.
It is crucial to connect pivots of the same type and structure to ensure the trendline is valid and analytically sound.
🟣 Pivot Classification
This indicator automatically classifies pivot points into two categories :
Major Pivots :
MLL : Major Lower Low
MHL : Major Higher Low
MHH : Major Higher High
MLH : Major Lower High
These define the primary structure of the market and are typically used in broader structural analysis.
Minor Pivots :
mLL: minor Lower Low
mHL: minor Higher Low
mHH: minor Higher High
mLH: minor Lower High
These are used for drawing more precise trendlines within corrective waves or internal price movements.
Example : In a downtrend, drawing a trendline from an MHH to an mHH creates structural inconsistency and introduces noise. Instead, connect points like MHL to MHL or mLH to mLH for a valid trendline.
🟣 Drawing High-Precision Trendlines
To ensure a reliable trendline :
Use pivots of the same classification (Major with Major or Minor with Minor).
Ensure at least three valid contact points (three touches = structural confirmation).
Draw through candles with the least deviation (choose wicks or bodies based on confluence).
Preferably draw from right to left for better alignment with current market behavior.
Use parallel lines to turn a single trendline into a trendline zone, if needed.
🟣 Using Trendlines for Trade Entries
Bounce Entry: When price approaches the trendline and shows signs of reversal (e.g., a reversal candle, divergence, or support/resistance), enter in the direction of the trend with a logical stop-loss.
Breakout Entry: When price breaks through the trendline with strong momentum and a confirmation (such as a retest or break of structure), consider trading in the direction of the breakout.
🟣 Trendline-Based Risk Management
For bounce entries, the stop-loss is placed below the trendline or the last pivot low (in an uptrend).
For breakout entries, the stop-loss is set behind the breakout candle or the last structural level.
A broken trendline can also act as an exit signal from a trade.
🟣 Combining Trendlines with Other Tools (Confluence)
Trendlines gain much more strength when used alongside other analytical tools :
Horizontal support and resistance levels
Moving averages (such as EMA 50 or EMA 200)
Fibonacci retracement zones
Candlestick patterns (e.g., Engulfing, Pin Bar)
RSI or MACD divergences
Market structure breaks (BoS / ChoCH)
🔵 Settings
Pivot Period : This defines how sensitive the pivot detection is. A higher number means the algorithm will identify more significant pivot points, resulting in longer-term trendlines.
Alerts
Alert :
Enable or disable the entire alert system
Set a custom alert name
Choose how often alerts trigger (every time, once per bar, or on bar close)
Select the time zone for alert timestamps (e.g., UTC)
Each trendline type supports two alert types :
Break Alert : Triggered when price breaks the trendline
React Alert : Triggered when price reacts or bounces off the trendline
These alerts can be independently enabled or disabled for all trendline categories (Major/Minor, Internal/External, Up/Down).
Display :
For each of the eight trendline types, you can control :
Whether to show or hide the line
Whether to delete the previous line when a new one is drawn
Color, line style (solid, dashed, dotted), extension direction (e.g., right only), and width
Major lines are typically thicker and more opaque, while minor lines appear thinner and more transparent.
All settings are designed to give the user full control over the appearance, behavior, and alert system of the indicator, without requiring manual drawing or adjustments.
🔵 Conclusion
A trendline is more than just a line on the chart—it is a structural, strategic, and flexible tool in technical analysis that can serve as the foundation for understanding price behavior and making trading decisions. Whether in trending markets or during corrections, trendlines help traders identify market direction, key zones, and high-potential entry and exit points with precision.
The accuracy and effectiveness of a trendline depend on using structurally valid pivot points and adhering to proper market logic, rather than relying on guesswork or personal bias.
This indicator is built to solve that exact problem. It automatically detects and draws multiple types of trendlines based on actual price structure, separating them into Major/Minor and Internal/External categories, and respecting professional analytical principles such as pivot type, trend direction, and structural location.

SMA7 Tail Reversal📌 Description:
The SMA7 Tail Reversal indicator is designed to identify potential counter-trend trading opportunities by checking if candle wicks (tails) respect a key moving average level (SMA7).
This indicator highlights price action where candles are clearly separated from the moving average, suggesting a possible reversal or temporary correction.
📌 How It Works:
Moving Average Calculation:
Calculates a simple moving average (SMA) of length 7 to act as the primary trend filter.
Candle Classification:
Bullish Candle: A candle where the closing price is higher than the opening price, with a short upper wick.
Bearish Candle: A candle where the closing price is lower than the opening price, with a short lower wick.
Conditions for Coloring Candles:
Long Condition (Green Candle):
High & Low are both below the SMA7 line.
Volume is above the 20-period average.
A bullish candle is detected.
Short Condition (Red Candle):
High & Low are both above the SMA7 line.
Volume is above the 20-period average.
A bearish candle is detected.
📌 Visual Representation:
Green Candles: Potential long signals when price action stays below the SMA7 line.
Red Candles: Potential short signals when price action stays above the SMA7 line.
Yellow Line: SMA7, used as the dynamic threshold for signal generation.
📌 Usage:
Best applied to volatile markets with clear trends.
Effective in detecting counter-trend opportunities where price diverges from the SMA7 line.
Works well with additional confirmation tools for better accuracy.

FVG Reversal Sentinel🔵 FVG Reversal Sentinel – Multi-Timeframe Fair Value Gap Indicator
The FVG Reversal Sentinel is a powerful TradingView indicator designed to help traders identify and track Fair Value Gaps (FVGs) across multiple timeframes, all within a single chart.
This tool allows you to select up to five separate timeframes, ensuring you never miss key market shifts, whether you are scalping, day trading, or swing trading. You can use this indicator in any asset (Cryptos, Futures, Indices, Forex Pairs, etc.).
🔵 - Key Features -
Multi-Timeframe FVG Tracking – Select and display up to five different timeframes on one chart, providing a comprehensive view of market structure.
Customizable Colors – Adjust bullish and bearish FVG colors to match your chart theme for a seamless trading experience.
Enhanced Market Context – Quickly identify key liquidity zones and refine your entries and exits with precision.
Hide the lower timeframes FVGs to get a clear view in a custom timeframe.
Show or hide mitigated FVGs to declutter the chart.
FVGs boxes are going to be displayed only when the candle bar closes
FVGs are going to be mitigated only when the body of the candle closes above or below the FVG area.
No repainting
Whether you're looking to fine-tune your entries or gain a broader market perspective, the FVG Reversal Sentinel indicator ensures you have the tools to stay ahead of price action and capitalize on market inefficiencies.
🔵 - Customization-
You can change the indicator settings as you see fit to achieve the best results for your use case.
TIMEFRAMES
This indicator provides the ability to select up to 5 timeframes. These timeframes are based on the trader's timeframes including any custom timeframes.
Select the desired timeframe from the options list.
Add the label text you would like to show for the selected timeframe.
Check or uncheck the box to display or hide the timeframe from your chart.
FVG SETTINGS
Length of boxes: allows you to select the length of the box that is going to be displayed for the FVGs.
Delete boxes after fill?: allows you to show or hide mitigated FVGs on your chart.
Hide FVGs lower than enabled timeframes?: allows you to show or hide lower timeframe FVGs on your chart. Example - You are in a 15 minutes timeframe chart, if you choose to hide lower timeframe FVGs you will not be able to see 5 minutes FVG defined in your Timeframes Settings, only 15 minutes or higher timeframe FVGs will be displayed on your chart.
BOX VISUALS
Bullish FVG box color: the color and opacity of the box for the bullish FVGs.
Bearish FVG box color: the color and opacity of the box for the bearish FVGs.
LABELS VISUALS
Bullish FVG labels color: the color for bullish labels.
Bearish FVG labels color: the color for bearish labels.
Labels size: the size of the text displayed in the labels.
Labels position: the position of the label inside the FVGs boxes (right, left or center).
BORDER VISUALS
Border width: the width of the border (the thickness).
Bullish FVG border color: the color and the opacity of the bullish box border.
Bearish FVG border color: the color and the opacity of the bearish box border.
🔵 - How to use the indicator -
Just add the indicator in your chart and click in the settings option to customize it.
Make sure you select the desired timeframes and set the colors and opacity for the FVGs boxes.
This indicator can be used in many trading strategies, such as:
SILVER BULLET
iFVG
iFVG RETEST
These strategies are based on the use of FVGs, this tool can help you analyze the market and make the right decision.
🔵 - How was the indicator designed? -
I have spent a lot of time testing other open source indicators from the community. All of these indicators do a great job, but they have a problem, they not only mitigate FVGs when a candle closes above or below the FVG, they also mitigate FVGs when the candle closes exactly to the tick (not above or below the FVG). This is a problem for many strategies that rely on FVGs mitigation.
What makes this indicator different is that it focuses on just mitigating imbalances at the right time for these strategies.
I have taken ideas and some pieces of code from many community indicator developers, such as:
@twingall
@tflab
@marktools
@nacho-fx
@pmk07
... and many other people, to whom I thank for their valuable work and have allowed me to create this tool by making modifications to their source code.
🔵 - Disclaimer -
This tool is intended solely for informational and educational purposes and should not be regarded as financial, investment, or trading advice. It's not designed to predict market movements or offer specific recommendations. Users should be aware that past performance is not indicative of future results and should not rely on any indicator for financial decisions.
