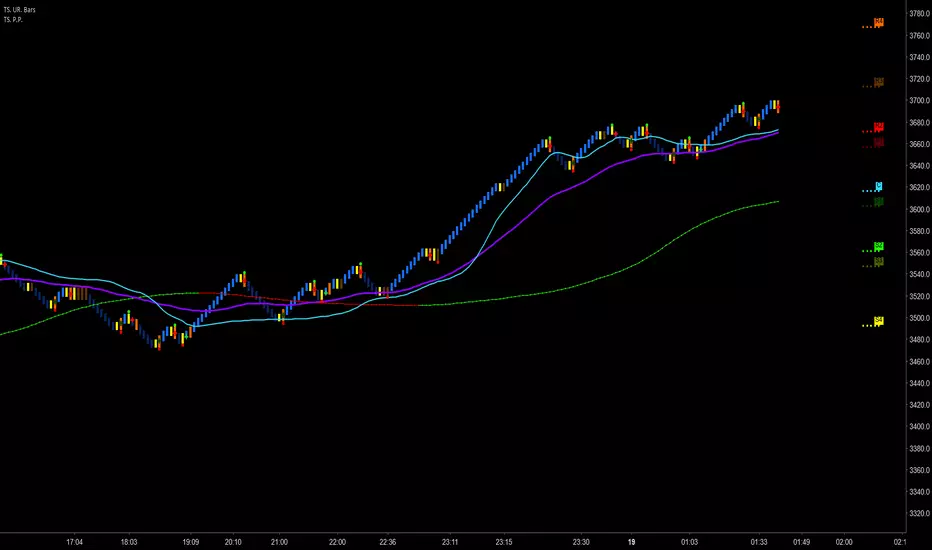
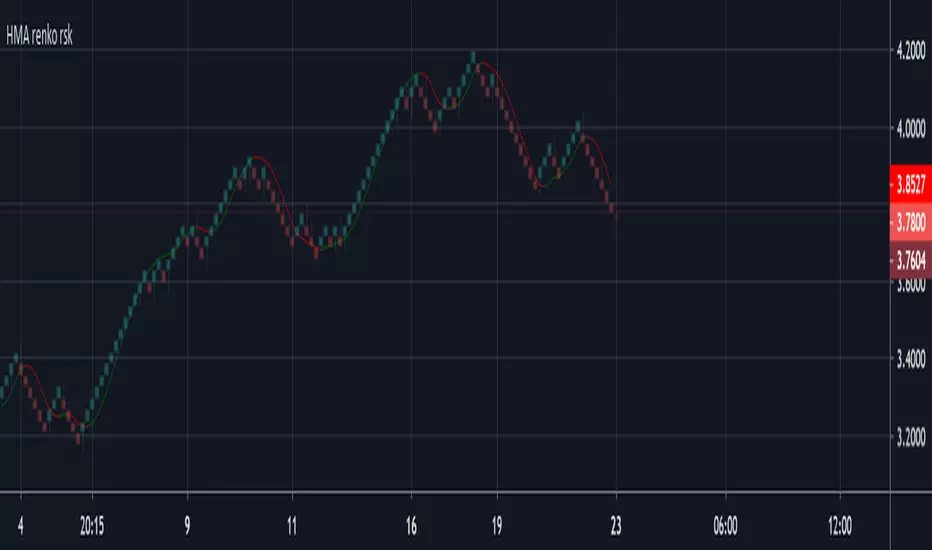
MBY_Bigginger Pack for Renko Reading(ver.1.0)Hi, This is MBY with RR_Pack indicator.
This indicator include 3 Things each different 2 Moving averages, 1 bollinger bands.
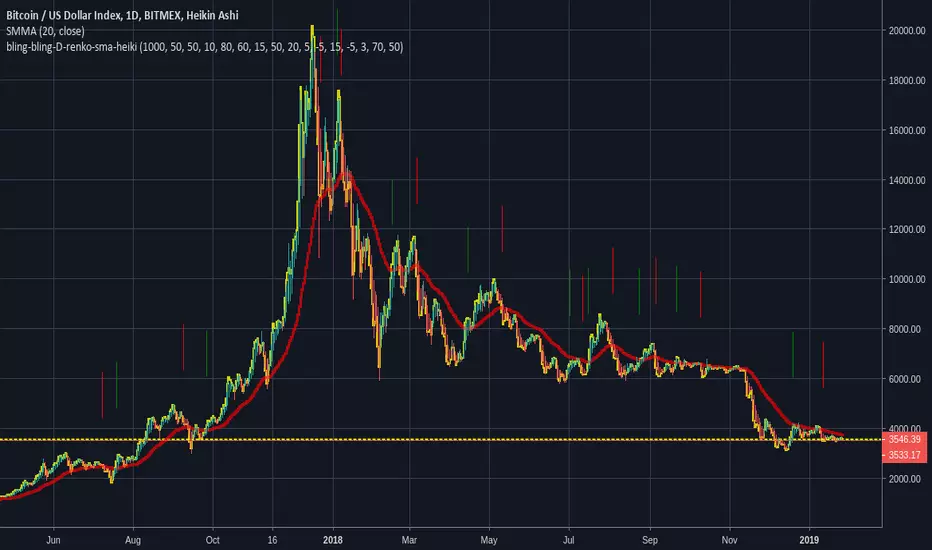
Using this indicator on your chart, be sure to use it on the Renko chart.
The peak of the Price on RenKo sheet will not reach the top of the Bollinger band.
Trend transition-----
1) Down -> Up : Break through 9MA with crossover 9MA & 15MA -> The Peak will be reach bollinger bands upper.
2) Up-> Down : :)
Thank you for your attention!!!
스크립트에서 "renko"에 대해 찾기

[astropark - Premium] 3m-5m-15m-30m Renko ScalperHi Followers!
Is it possibile to multiply your capital by 30 times in one year?
YES, it is! Just use this script on Renko charts!
This script is the study version of this strategy:
Why is this version necessary? With this script you can set alarms and get notified when a new signal appears on the Renko chart ! With strategy you can't!
This strategy works great at following timeframes:
30 minutes
15 minutes
5 minutes
3 minutes
Keep in mind that this is not the Holy Grail and price manipulation can create great volatility!
So always set a stop loss in trades, like -3%/-5% from entry point, depending on your risk management style.
This is a premium indicator , so send me a private message in order to get access to this script.
Do you like my scripts? Offer me a coffee, a beer, a pizza or whatever :)
BTC jar: 1K5kuYQPEqoNo6GRmJbHWMPmqwKM5S3oRR
ETH jar: 0x091b541a6dd6fe08c4e7bd909baafb2fce9b975e
LTC jar: LSVoAChsZrVsvbNyUfdpxtFpDAUSaUTUig
XRP jar: (XRP deposit tag) 103997763 (XRP deposit address) rEb8TK3gBgk5auZkwc6sHnwrGVJH8DuaLh
PS: Do you need a customization or do you need a dev who implements your strategy? send me a private message ;-)

Trader Set - Pivot PointsThis is a Pivot Point indicator that has the ability to sit on top of Uni Renko Charts to show the center pivot (others don't work because of specifications of uni renko chart unless i figure something in future) but on price charts and range charts they work like charm.
Unlike the built in indicator, you can choose separately to draw each support or resistance level. Other than Standard draw from the built in indicator, all other types are included in this indicator.
Please, don't ask for access, only my students from my classes will have access to this indicator, at least for time being. If at any time in future I wish to sell, you will find the price and how to buy in the comments bellow.
Previous Day/Week/Month OHLC for renko (from Regular Candles)this indiactor gives you previous day/week/month levels on a renko chart based on the ohlc data of normal candles

[JL] 3-Color Renko High-Low AlertI am playing Renko and made this script.
- Ignore ATR mode because it will repaint. Instead setting the boxsize and SL index by wathching ATR Labels
- pipmode is because I always trading forex. Normally I use pips. If you are trading others just set it to false.
- Set up box size and SL index based on ATR Labels
GODMODE reversal points Script shows reversal points on renko candles
Green shape = buy point
Red shape = sell point
Ema's works as support and resistance
Also ema's can be useful as a stoploss
Ema's available
55 = yellow
99 = aqua
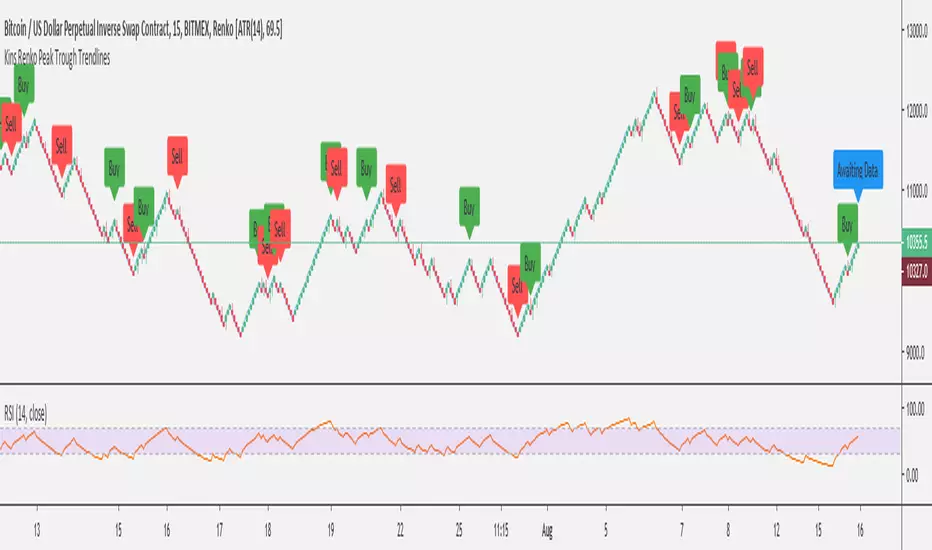
Kins Renko Peak Trough TrendlinesScript is built on the Renko Chart for Bitmex XBT. Looks for swing high/low and RSI divergences as well as some other bits.
This is my first week with Pine Script so there's probably some terrible coding practices in here but the functionality seems acceptable.
Wyckoff Trend Tracking Renko with TimeWyckoff Trend Tracking Renko with Time 该指标用于计算砖形图每个砖块的时间。必须与砖形图配合使用效果才会体现。

Wyckoff Trend Tracking Renko VolumeWyckoff Trend Tracking Renko Volume 该指标用于计算砖形图每个砖块的交易量。必须与砖形图配合使用效果才会体现。

Stochastic RSI Signal LinesThis script is for private use only. I created it as step 1 for my Renko Trading Strategy.
Tested on BitMex on XBTUSD.


Trader Set - MTF Reversal Bar SignalsThis is Multi Tile Frame signalling of reversal bar strategy. Using this, you can easily Identify if you had a reversal bar signal in 1,2,3,4,5,10,15, and 30 minute based renko charts.
The more time frames get in sync with each other, the higher possibility for a more powerful signal.
The least you would need is for 1,2 and 3 minutes to have 2 out of 3 of them showing same signal.
Please don't ask for getting access, the licensing will be available for purchase soon in the website and I will announce it in the comment section.

#102f Renko OBZ [bionis]Indicator #102f is an attempt to measure Normalized Price Movement/Volume adding Renko capabilities in order to filter out noise. Very similar to the RSI, this indicator can be categorized as an oscillator - type one and should be used to detect overbought/oversold conditions, as well as divergences with main price.
Access to the indicator is granted to all CryptoSociety Members and Team.


