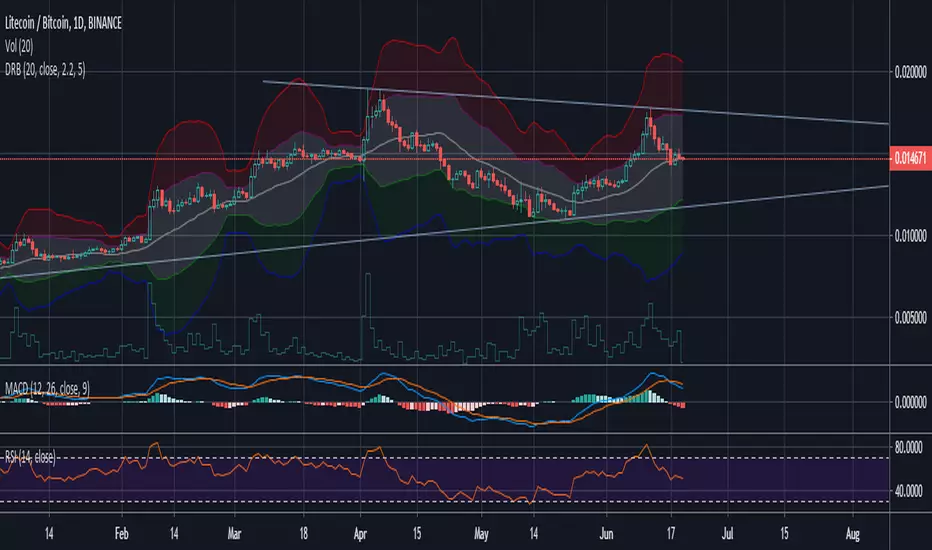
Dynamic Range BandsBased off of bollinger bands, used to find ranged loose buy/sell areas. Pair with other indicators.
스크립트에서 "range"에 대해 찾기
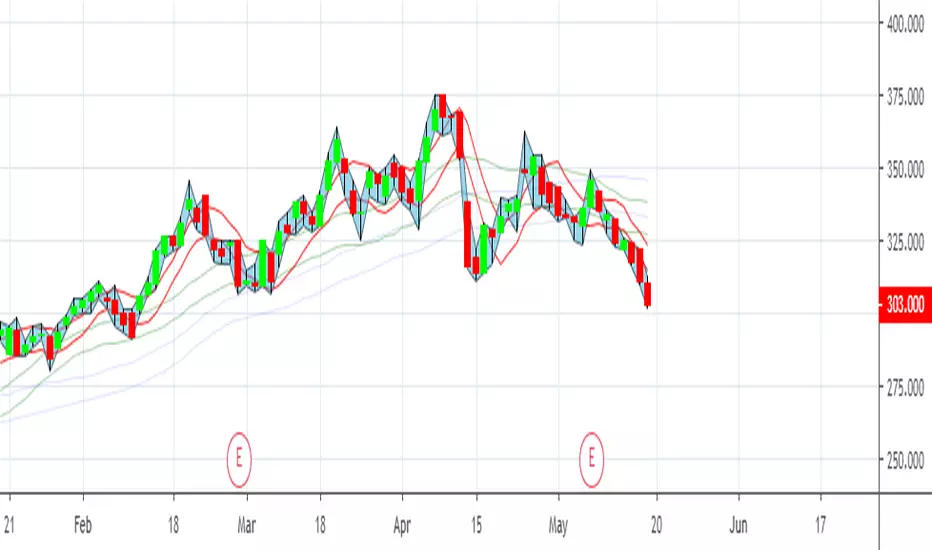
Moving RangesThis excersice was done to help to analize the price range, its historical average from three different time frames, showing their values with decreasing transparencies.
The good thing is that it can be setup for almost all parameters
It also shows that price ranges are more probable than lines, as you can see.
A trading strategy similar to Bollinger Bands can be applied to use it as indicator.
Fib Signals | -- MoonLaunchr --Script that can display signals against key Fibonacci levels based on highs and lows within a given time-frame
Set the number of days back in time that you would like the indicator to look for the high and low for calculating fibs.
Bear Market options include sub-level fibs within the 12.3% range - 38.2 and 61.8% 3 levels deep.
Signals when crossing over and under key fibs.
Set ALERTS for each key fib piercing.
Set ALERTS when new highs or lows are made.
All levels and signals can be displayed or hidden and customised within the indicator options.
Next candle price projection.
Bull Market key fib sub-levels will be added in the next update (top 12.8% sub-levels 1,2 & 3).
Happy trading!

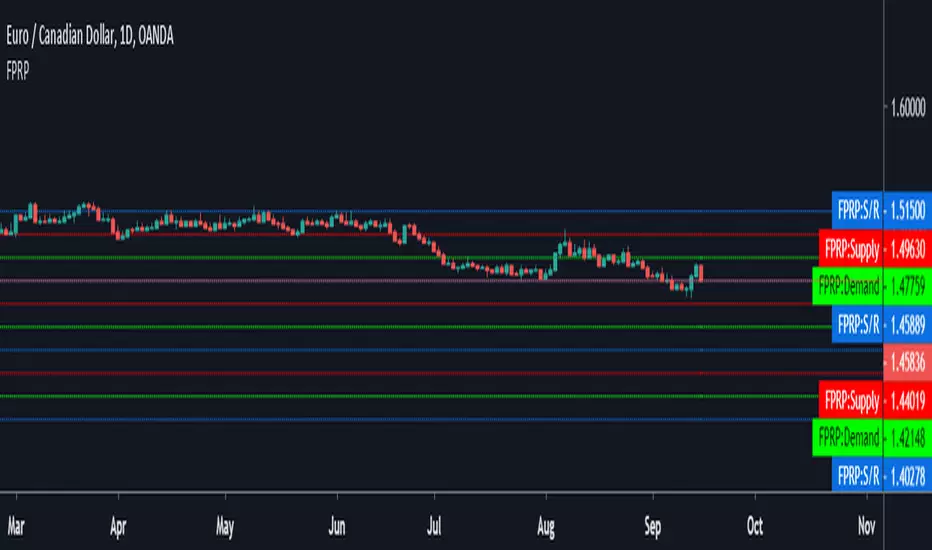
Fibonacci Price Range PlotterFibonacci levels set to fixed price values based on a timeframe.
Levels show probability of turning point based on extreme price ranges.
ColorPatternColorChart Range Trading...testing phase only, hence NOT for trading. To be improved further.

ADR - Average Daily Range [@treypeng] [v2]
This is an intraday indicator.
Average Daily Range provides an upper and lower level around the daily open. It is calculated by taking an EMA/SMA average of a given number of previous days' True Range.
It can be useful for helping guide support and resistance, for taking profits and for placing stops.
It's a similar idea to the ATR indicator, but calculated on a daily timeframe only.
Settings:
Length: number of days to take an average from
Offset: Set this to 0 to include today's range. Set to 1 to exclude today. Set to 2 to exclude today and yesterday.....and so on.
The other settings should be self explanatory :)

Opening asian Range 7 h FOREX.COM by Blackwolf v2.0This script is programmed for FOREX.COM with Rome Time Zone and is shows the min & max price reached in asian session every day.
Lo script mostra il massimo ed il minimo della sessione asiatica. Impostato per broker FOREX.COM e fuso orario di ROMA

Opening-RangesThis indicator will give you expansion levels of the opening range ( I recommend/use 15 min opening range) to trade futures and stocks. There are two colors used, the Fuchsia(Magenta) colored dots are the opening range added and subtracted from opening price. The Aqua(Cyan) colored dots are the opening range stacked. Like blocks. They are both respected during the day. But not as much as longer time frame fib levels.
Securities day session - Opening-Range- Jayy Opening Range (OR) for regular daytime session eg NYSE 0 930hrs to 1600 hrs.
This is not for Forex sessions which is addressed in a separate script.
This script fixes two issues:
syntax error when code compiles
flaky plotting of the opening range and targets that required page reloading
Additions:
In this code there are more more opening range time period choices at the bottom of the format dialogue box
Opening Range Targets:
Opening Range Targets as per Leaf_West
Targets are set at 127% , 162%, 200 %, 262 %, 362%, 423%, 685%, 1109% and 1794% and this can be traded intraday using methods described at charts-by-leaf.com I also have some Leaf West PDFs that describe how the targets are set and how they are traded. There are others that use opening range.
See the notes in the script for more detail.
My first opening range script originated from work done by Chris Moody. This script has changed significantly but there are small remnants of Chris Moody's script lurking within.
This script is available to all.
Cheers Jayy

2% candlePart of my strategy involves entering a trade based on a candle on a 5-min chart being < 2% (ignoring major volatility).
I got tired of calculating the range of a single candle either in my head or on a calculator, so I wrote this up. Feel free to share it.
Shows the %move of any single candle, default horizontal lines are 1% & 2%, can be changed by clicking the gear icon next to the indicator after you have added the indicator to your chart. Works on any timeframe, 5m, 1h, 1d, etc , obviously
the higher the timeframe, the larger the move.

extended session - Regular Opening-Range- JayyOpening Range and some other scripts updated to plot correctly (see comments below.) There are three variations of the fibonacci expansion beyond the opening range and retracements within the opening range of the US Market session - I have not put in the script for the other markets yet.
The three scripts have different uses and strengths:
The extended session script (with the script here below) will plot the opening range whether you are using the extended session or the regular session. (that is to say whether "ext" in the lower right hand corner is highlighted or not.). While in the extended session the opening range has some plotting issues with periods like 13 minutes or any period that is not divisible into 330 mins with a round number outcome (eg 330/60 =5.5. Therefore an hour long opening range has problems in the extended session.
The pre session script is only for the premarket. You can select any opening range period you like. I have set the opening range to be the full premarket session. If you select a different session you will have to unselect "pre open to 9:30 EST for Opening Range?" in the format section. The script defaults to 15 minutes in the "period Of Pre Opening Range?". To go back to the 4 am to 9:30 pre opening range select "pre open to 9:30 EST for Opening Range?" there is no automatic 330 minute selection.
The past days offset script only works in 5 min or 15 minute period. It will show the opening range from up to 20 days past over the current days price action. Use this for the regular session only. 0 shows the current day's opening range. Use the positive integers for number of days back ie 1, 2, 3 etc not -1, -2, -3 etc. The script is preprogrammed to use the current day (0).
Scripts updated to plot correctly: One thing they all have in common is a way of they deal with a somewhat random problem that shifts the plots 4 hours in one direction or the other ie the plot started at 9:30 EST or 1:30PM EST. This issue started to occur approximately June 22, 2015 and impacts any script that tried to use "session" times to manage a plot in my scripts. The issue now seems to have been resolved during this past week.
Just in case the problem reoccurs I have added a "Switch session plot?" to each script. If the plot looks funny check or uncheck the "Switch session plot?" and see the difference. Of course if a new issue crops up it will likely require a different fix.
I have updated all of the scripts shown on this chart. If you are using a script of mine that suffers from the compiler issue then you will find an update on this chart. You can get any and all of the scripts by clicking on the small sideways wishbone on the left middle of the chart. You will see a dialogue box. Then click "make it mine". This will import all of the scripts to your computer and you can play around with them all to decide what you want and what you don't want. This is the easiest way to get all of the scripts in one fell swoop. It is also the easiest way for me to make all of the scripts available. I do not have all of the plots visible since it is too messy and one of the scripts (pre OR) is only for the regular session. To view the scripts click on the blue eye to the right of the script title to show it on this script. If you can only use the regular session. The scripts will all (with the exception of the pre OR) work fine.
If for any reason this script seems flakey refresh the page r try a slightly different period. I have noticed that sometimes randomly the script loves to return to the 5 min OR. This is a very new issue transient issue. As always if you see an issue please let me know.
Cheers Jayy

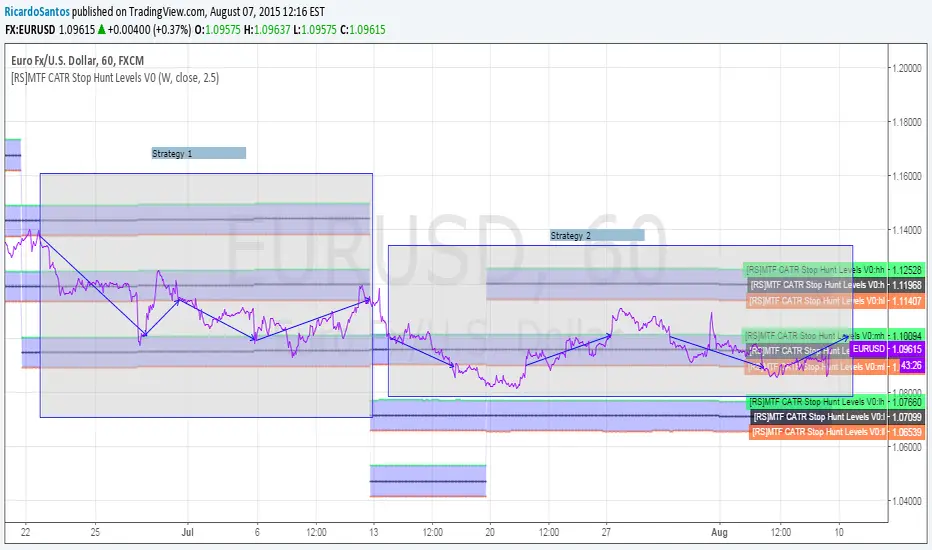
[RS]MTF CATR Stop Hunt Levels V0EXPERIMENTAL:
Adaptation from stop hunt levels:
Uses timeframe and atr to set ranges.
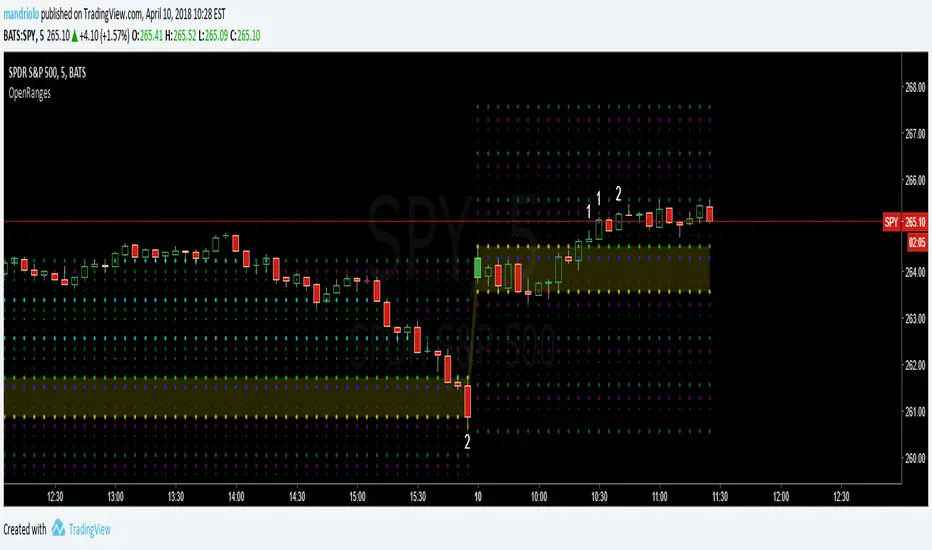
Opening Range Breakout with 2 Profit Targets.Opening Range Breakout with 2 Profit Targets.
Updated Indicator now works on all Symbols with Many Different Session Options.
***Known PineScript Issue…While the Opening Range is being Formed the lines only adjust for that individual bar. Just reset Indicator after Opening Range Completes.
***All Times are Based on New York Time
Session Options Forex U.S. Banks Open (8:00), Gold U.S. Open (8:20), Oil U.S. Open (9:00), U.S. Cash Session - Stocks (9:30), NY Forex Open (17:00) , Europe Open (02:00), or if you choose Setting 0 the Session Runs from 00:00 to 00:00 (Midnight to Midnight).
***Ability to use 60 minute Opening Range, 30 minute, 15 minute, and many other options.
***However you can manually change the times in the Inputs Tab to adjust for any session you prefer. This is useful for Day Light Savings Adjustments. Also the default times work if your charts are set to EST Time. If you use A different time zone in your settings you need to Adjust the times in the inputs tab.
Initially Opening Range High and Low plot as Yellow Lines. If Price Goes Above Opening Range then Line Turns Green. If Price Goes Below Opening Range Line Turns Red.
By default the First Profit Target is 1/2 the Width of the Opening Range and the 2nd Profit Target is 1 Times the Opening Range. However these are Adjustable in the Inputs Tab.
By Default the Opening Range Length is 1 Hour. However, you can Change the Opening Range Length to 15 min, 30 min, 2 hours etc. in the Inputs Tab.
Plots a 1 Above or Below Candle when 1st Profit Target is Achieved, and a 2 when 2nd Profit Target is Achieved.

Couple Candle RangeCouple Candle Range
We are looking for a 2-candle pattern where body of candle-1 is within the range of candle-2 and similarly, body of candle-2 is within the range of candle-1.
With this indicator, we are auto-calculating the couple candle range.

Hedge Fund Session Ranges [GMT+2] - Multi-Timezone TrackingOverview
This professional-grade tool is designed for institutional-style trading, specifically focusing on the Liquidity Cycles of the global markets. It allows traders to visualize key trading windows (Asia, Europe, and US) with precision, using a fixed GMT+2 offset—ideal for traders aligned with Middle Eastern or Eastern European timezones.
Key Features
Triple Session Tracking: Includes pre-defined windows for Asia, London Morning, and NY Afternoon.
Dynamic Box Scaling: Automatically calculates and visualizes the High/Low range of each session in real-time.
GMT+2 Optimization: Built-in timezone handling to ensure your charts align perfectly with local bank hours.
Clean Visuals: Minimalist design to avoid chart clutter, allowing for clear price action analysis.
Why Trade Sessions?
Institutional volume isn't distributed evenly throughout the day. By identifying the Asian Range (01:00-06:00), the London Open (10:00-12:00), and the NY Reversal/Trend (16:30-18:30), traders can identify "Liquidity Grabs" and "Expansion Phases" more effectively.

Last Closed 4H Range + Fibs + Bias + CountdownLast Closed 4H Range + Fibs + Bias + Countdown
This indicator displays the most recent fully closed 4-hour (4H) candle range and projects it forward to provide a clear higher-timeframe framework for intraday trading.
🔹 Features
Last Closed 4H Range Box
Shows the high and low of the previous completed 4H candle (non-repainting).
Internal Fibonacci Levels
Automatically plots 25%, 50% (EQ), 75%, 61.8%, and 78.6% levels inside the 4H range.
4H Directional Bias
Bias is determined by the 4H close relative to the 50% equilibrium:
Above EQ → Bullish Bias
Below EQ → Bearish Bias
Bias Flip Alerts
Alerts trigger only when bias changes on a confirmed 4H candle close.
Live 4H Countdown Timer
Displays the remaining time until the current 4H candle closes, positioned below the range box.

Tom Hougaards Overnight Range by exp3rtsThis indicator visualizes the School Run concept popularized by Tom Hougaard.
It draws a session range box that continuously expands to include the highest high and lowest low formed during a user-defined time window.
The box starts exactly at the session open and dynamically updates as new candles print, capturing the full pre-move accumulation range. Once the session ends, the box remains fixed, providing a clear reference for liquidity runs, stop hunts, and directional expansion.
Key features:
Session-based logic using TradingView’s native session handling (works correctly across midnight)
Dynamic high/low tracking throughout the session
Clean, minimal visual representation of the accumulation range
Ideal for identifying School Runs, liquidity sweeps, and bias formation
How to use it:
If the price goes above the range (on the second 15min candle) after RTH opening, chances are high that price will continue going higher.
If the price goes below the range (on the second 15min candle) after RTH opening, chances are high that the price will continue going lower.
Best for Indices.

Fibonacci Active Timeframe Range [UkutaLabs]█ OVERVIEW
Fibonacci Active Timeframe Range is a precision intraday structure tool that uses real-time price expansion combined with Fibonacci ratios to map dynamic support and resistance levels directly from the active timeframe.
Rather than relying on fixed historical averages, this indicator continuously builds a live range from current price action, projecting Fibonacci-derived levels that adapt to market conditions as they develop.
The goal is to give traders a clear structural framework for:
Intraday bias
Reaction zones
Volatility expansion
Pullback levels
Continuation targets
—all in a clean, visual format that integrates seamlessly into any strategy or system.
█ USAGE
The indicator calculates the current timeframe range in real time, anchoring from the active session’s open and projecting multiple Fibonacci levels within that range.
These levels act as dynamic support and resistance zones, updating as price evolves — allowing traders to:
Identify high-probability reaction areas
Define structure for entries and exits
Frame risk more precisely
Align trades with real-time volatility
Anticipate expansion and contraction phases
Each level is clearly labeled for instant recognition and can be used across scalping, intraday, and short-term swing strategies.
█ SETTINGS
Configuration
• Show Labels – Toggle labels on/off for a clean or informational view
• Display Mode – Control how much historical structure is visible
• Font Size – Adjust label size for readability
• Text Alignment – Align labels relative to each level
• Fibonacci Levels – Enable/disable specific ratios
• Range Mode – Select how the current timeframe range is calculated

Tokyo Sessions HighlighterOverview
This indicator provides a clean, visual representation of the Asian (Tokyo) trading session by highlighting its specific price range. It is designed to help traders identify the initial intraday range and key liquidity levels established during the Tokyo open.
Features
Dynamic Range Box: Automatically plots a box from the session's highest high to its lowest low.
Real-Time Updates: The box height and price labels update live as new session extremes are reached during the designated hours.
Professional Aesthetic: Features a minimalist gray fill, solid black borders, and black text for a clean, professional look on both light and dark chart themes.
Instant Data: Displays a label at the bottom of the box showing the exact price range in the format: Tokyo (Lowest Value - Highest Value).
How To Use
Settings: Adjust the Tokyo Session Time and Timezone in the indicator inputs to match your broker's server time or local requirements.
Strategy: Use the highlighted range to identify potential breakouts or to treat the session high and low as institutional liquidity zones for the London and New York sessions.
Customization: You can adjust the colors and transparency of the box through the script settings menu.

Open Range BreakoutOpen Range Breakout is a volatility harvesting tool designed to exploit directional expansion following major market opens. It isolates price action during initial liquidity injections to project institutional-grade zones that define a session's structural bias.
Core Methodology
The script uses a time-anchored engine to map critical supply and demand boundaries:
Anchor Identification: The algorithm captures the absolute High and Low within a user-defined window at the start of Tokyo, London, or New York sessions.
Structural Projection: It generates a Neutrality Box. A breach via candle close signals the transition from consolidation to expansion.
Mathematical Risk Modeling: Upon breakout, it calculates a 3:1 Risk-Reward framework based on fixed percentage volatility.
Session Dynamics
The system is optimized for the global liquidity cycle:
Session 1 (Asia): Maps early-day consolidation and range-bound liquidity.
Session 2 (Europe): Captures the London Move to identify the trend.
Session 3 (US): Analyzes high-volume New York opens for maximum momentum.
Key Features
Dynamic Price Mitigation: TP/SL zones stop extending the moment price touches the target or invalidation level to keep charts clean.
Volatility-Adjusted Levels: Stop Loss parameters are normalized to price percentage for consistency across Indices, Forex, or Crypto.
Minimalist Interface: Professional aesthetic with high-contrast visual cues for instant scannability.
Use Cases
Momentum Trading: Identifying the Origin of the Move post-open.
Mean Reversion: Recognizing failed breakouts when price returns inside the range.
Quantitative Backtesting: Benchmarking 3.0 RR targets across different session anchors.

GHOST | Market Sessions Ranges MTF👻 GHOST | Market Sessions Ranges MTF
Master Time and Price with Ghost-Level Precision
Stop cluttering your charts with old, irrelevant levels. GHOST is a professional-grade tool designed for traders who prioritize institutional liquidity and crystal-clear price action.
This isn't just a level-drawer; it’s a dynamic liquidity manager that understands when and where price matters.
💎 Why GHOST is a Game Changer:
⚡ Smart Mitigation: Lines automatically disappear ("ghosting") as soon as price taps them. You only see the fresh liquidity that hasn't been mitigated yet.
🕒 Pro Session Filtering: Sync your levels with specific trading windows (London, New York, Asia). Colors and ranges adapt to the exact time you trade.
📊 True MTF Power: Monitor Daily, Weekly, and Monthly Highs and Lows (PDH/L, PWH/L, PMH/L) independently.
🎨 Minimalist "Ghost" Aesthetic: Say goodbye to lines crossing your entire screen. GHOST uses short, dashed lines with right-aligned labels and adjustable forward projection, keeping your "candle field" clean.
🛠️ Key Features & Customization:
✅ Dynamic Length: You control where the line starts and how far it projects into the future.
✅ One-Click Visibility: Toggle Daily, Weekly, or Monthly levels on/off instantly via the settings panel.
✅ 100% Free: A premium-quality tool shared openly with the global trading community.
💎 Key Features:
⚡ Smart Mitigation: Lines "ghost" away automatically once price taps them, keeping your chart focused on fresh liquidity.
🕒 Session Confluence: Sync your ranges with specific time zones (NY, London, Tokyo) to find the perfect trade window.
🎨 Clean Aesthetic: Labels are perfectly aligned to the right, ensuring your price action reading is never obstructed.
Autor : The ghost of trading 👻

CRT INTRADAY + MTF (15M/30M-12H custom) Candle Range TheoryCRT INTRADAY + MTF (15M/30M–12H) — Candle Range Theory
This indicator plots previous completed range High/Low levels for multiple time blocks, based on Candle Range Theory (CRT).
It can display:
Previous Day High / Low (CRT DAY)
Previous block High / Low for: 15M, 30M, 1H, 2H, 3H, 4H, 5H, 6H, 7H, 8H, 9H, 10H, 11H, 12H
Each block has its own color / line style / width, and optional time separators to visually mark new periods.
How it works
When a new time block starts (e.g., new 4H candle), the indicator stores the High/Low of the previous completed block and extends those levels forward on the chart.
How to use
CRT levels are commonly used as:
intraday support/resistance
liquidity reference levels
targets and invalidation points
breakout / rejection confirmation zones
Typical approach:
Watch how price reacts when returning to the previous block range.
Use confluence with structure (BOS/CHOCH), volume, or your entry model.
Settings
Turn each timeframe ON/OFF (15M → 12H)
Enable/disable separators for each timeframe
Customize line colors, widths, and styles
Optional labels with configurable size
UTC Offset to align session/day boundaries with your preferred timezone
Notes
For performance, the MTF blocks are designed for lower timeframes (≤ 60 minutes).
This indicator is a visual reference tool and does not generate trade signals.
Recommended Confluence (Optional)
This CRT tool is designed to be used as a price reference framework. For higher-quality setups, combine CRT levels with confirmation tools such as:
Crypto Radar / multi-symbol market context (trend strength, market regime, relative performance)
SETUP HMTR (risk zones, extremes, pressure zones)
Structure & price action (breakout + retest, rejection, liquidity sweep)
A common workflow:
Start with market context (risk / regime)
Mark CRT levels (previous range highs/lows)
Wait for a Setup/confirmation signal + clean price reaction at CRT
Use CRT levels as targets / invalidation / S/R

VORB DJB Trades V1VORB by DJB Trades (Version 1) is a complete intraday framework built around the New York session Opening Range Breakout (ORB), combined with higher-timeframe VWAPs and precise Fair Value Gap mapping.
This tool is designed to give you context, levels and confluence at a glance – no more stacking 5 different indicators on your chart.
🔶 Core ORB Logic (NY Session)
• Uses the 09:30–09:45 NY time 15-minute ORB range.
• Draws an ORB box from high to low during the ORB window.
• Projects clean high/low ORB lines across the session (up to your chosen end time, default 18:00 NY).
• Displays the ORB size in points above the box
• 1 point = 4 ticks (futures-style logic).
This gives an instant sense of how “wide” or “tight” the opening drive was, and how much room you have for trend or mean-reversion plays.
📐 Daily VWAP (Intraday Bias)
• Custom anchor time (default 18:00, NY session close style).
• Plots Daily VWAP plus +/-1 standard deviation bands.
• Full styling controls: colors, line widths, band fill etc.
• You can limit visibility to specific timeframes via dropdown (e.g. only show on 1–5m, or just intraday).
VWAP +/-1 deviation bands gives you intraday bias and “fair value” zones to frame trades around the ORB.
🕒 Higher Timeframe VWAPs (Weekly, Monthly, Yearly)
All three higher-TF VWAPs are calculated the same way (volume-weighted, streaming) but anchored at different structural points:
• Weekly VWAP – resets at the start of each week
• Monthly VWAP – resets at the start of each month
• Yearly VWAP – resets at the start of each year
Each has:
• Main VWAP line
• ±/-1 standard deviation bands
• Independent color / width / band fill settings
• Timeframe visibility controls (“show from TF” & “show up to TF”) so you can do things like:
⁃ Weekly VWAP only from 5m and above
⁃ Monthly on 1h and higher
⁃ Yearly only on Daily/Weekly/Monthly
Use these as higher-timeframe bias references and key dynamic value areas above/below the ORB.
📊 1m FVGs (Outside ORB & VWAP Bands)
For precision entries:
• Detects 1-minute Fair Value Gaps (classic 3-candle pattern):
⁃ Bullish FVG: low > high
⁃ Bearish FVG: high < low
• Only plots FVGs that are:
⁃ Outside the ORB range, and
⁃ Outside the Daily VWAP +/-1 bands
• FVG boxes are auto-extended to the right (4× original width) for clear “liquidity pockets”.
• Separate colors for bullish and bearish FVGs.
This helps you focus only on “clean” imbalances away from the opening chop and mid-range value.
⚙️ Customisation & Use
• Works best on US indices, FX and futures during the NY session.
• Optimised for 1m–15m ORB trading, but higher-TF VWAPs shine on 5m, 15m, 1h and Daily.
• Every visual element (ORB box, lines, VWAPs, bands, FVGs, label text/bg) is fully customisable in the settings.
⚠️ Disclaimer
This script is for educational and informational purposes only.
It does not constitute financial advice or a signal service.
Always test on a demo account and use your own risk management before trading live.
