VWolf – Slope GuardOVERVIEW
Slope Guard combines a momentum core (WaveTrend + RSI/MFI + QQE family) with a directional bias (EMA/DEMA and a DEMA-slope filter). Trade direction can be constrained by the Supertrend regime (Normal or Pivot). Risk is managed with ATR-based stops and targets, optional Supertrend-anchored dynamic levels, and a two-stage take-profit that can shift the stop to break-even after the first partial. The strategy supports explicit Backtest and Forward-test windows and adapts certain thresholds by market type (Forex vs. Stocks).
RECOMMENDED USE
Markets: Forex and equities; use Market Type to properly scale the DEMA-slope gate.
Timeframes: M15–H4 for intraday-swing and H1–D1 for slower swing; avoid ultra-low TFs without tightening ADX/QQE.
Assets: Instruments with persistent trends and orderly pullbacks; avoid flat ranges without sufficient ADX.
Strengths
Multi-layer confluence: trend bias + momentum + regime + strength.
Flexible risk engine: ATR vs. Supertrend anchoring, staged exits, and automatic break-even.
Clean research workflow: separated Backtest and Forward-test windows.
Precautions
Structural latency: Pivot-based constructs confirm with delay; validate with Forward-test.
Filter interaction: QQE Strict + ADX + WT zero-line can become overly selective; calibrate by asset/TF.
Overfitting risk: Prefer simple, portable parameter sets and validate across symbols/TFs.
CONCLUSION
Slope Guard is a “trend + momentum” framework with risk control at its core. By enforcing a baseline bias, validating momentum with the Vuman composite, and offering ATR or Supertrend-anchored exits—plus staged profits and break-even shifts—it seeks to capture the core of directional swings while compressing drawdowns. Keep testing windows isolated, start with moderate filters (QQE Normal, ADX ~20–25), and only add stricter gates (WT zero-line, DEMA slope) once they demonstrably improve stability without starving signals.
FOR MORE INFORMATION VISIT vwolftrading.com
스크립트에서 "range"에 대해 찾기

VWolf – Hull VectorOVERVIEW
VWolf – Hull Vector is a momentum-driven trend strategy centered on the Hull Moving Average (HMA) angle. It layers optional confirmations from EMA/DEMA alignment, DMI/ADX strength, and Supertrend triggers to filter lower-quality entries and improve trade quality.
Risk is controlled through capital-based position sizing, ATR-anchored stops and targets, and dynamic trade management (partial exits and stop movement). The strategy supports Backtest and Forwardtest modes with configurable date ranges, and a market profile toggle (Forex vs. Stocks) to adjust internal scaling for price behavior.
RECOMMENDED USE
Markets: Major Forex pairs, index CFDs/futures, and liquid stocks with clean trend legs.
Styles: Intraday and swing applications where momentum continuation is common.
Volatility Regimes: Performs best in trending or expanding-volatility environments; consider tightening thresholds in choppy phases.
Workflow Tips:Start with HMA angle + ST trigger only; then layer DEMA and DMI/ADX if you need more selectivity.
Use Forwardtest dates to simulate out-of-sample performance after tuning Backtest parameters.
Re-evaluate angle thresholds when switching between Forex and Stocks modes.
Strengths
Clear momentum core (HMA angle) with optional, orthogonal filters (trend alignment, strength, trigger).
Robust risk tooling: ATR/ST stops, two-step profits, and capital-based sizing.
Testing discipline: Native Backtest/Forwardtest scoping supports walk-forward validation.
Broad portability: Works across instruments thanks to market-aware scaling.
Precautions
Over-filtering risk: Enabling all gates simultaneously may under-trade; calibrate selectivity to your timeframe.
Sideways markets: Expect more whipsaws when slope hovers near zero; raise angle threshold or rely more on ADX gating.
Overfitting hazard: Tune on one regime, then verify with Forwardtest windows and alternative markets/timeframes.

VWolf - Basic EdgeOVERVIEW
VWolf - Basic Edge is a clean and accessible crossover strategy built on the core principle of moving average convergence. Designed for simplicity and ease of use, it allows traders to select from multiple types of moving averages—including EMA, SMA, HULL, and DEMA—and defines entry points strictly based on the crossover of two user-defined MAs.
This strategy is ideal for traders seeking a minimal, no-frills trend-following system with flexible exit conditions. Upon crossover in the selected direction (e.g., fast MA crossing above slow MA for a long entry), the strategy opens a trade and then manages the exit based on the user’s chosen method:
Signal-Based Exit:Trades are closed on the opposite crossover signal (e.g., long is exited when the fast MA crosses below the slow MA).
Fixed SL/TP Exit:The trade is closed based on fixed Stop Loss and Take Profit levels.Both SL and TP values are customizable via the strategy’s input settings.Once either the TP or SL is reached, the position is exited.
Additional filters such as date ranges and session times are available for backtesting control, but no extra indicators are used—staying true to the “basic edge” philosophy. This strategy works well as a starting framework for beginners or as a reliable, lightweight system for experienced traders wanting clean, rule-based entries and exits.
RECOMMENDED FOR
- Beginner to intermediate traders who want a transparent and easy-to-follow system.
- Traders looking to understand or build upon classic moving average crossover logic.
- Users who want a customizable but uncluttered strategy framework.
🌍 Markets & Instruments:
Well-suited for liquid and trending markets, including:Major forex pairs
Stock indices
Commodities (e.g., gold, oil)
Cryptocurrencies with stable trends (e.g., BTC, ETH)
⏱ Recommended Timeframes:
Performs best on higher intraday or swing trading timeframes, such as:15m, 1h, 4h, and 1D
Avoid low-timeframe noise (e.g., 1m, 3m) unless paired with strict filters or volatility controls.
FOR MORE INFORMATION VISIT vwolftrading.com

Logic Flow Signals & Backtest [bercutiatia]To understand the advanced logic of the tool, it is essential that you carefully read each topic and check the visual examples in this presentation.
--
Who is the Logic Flow Signals & Backtest tool recommended for?
Ideal for traders looking to increase the reliability and level of their operations. Recommended for those who want to create rigorous confluences, validate strategies with backtesting, and transform emotional management into systematic and measurable processes.
How can the Logic Flow Signals & Backtest tool help me?
High-confidence signals! You combine TradingView indicators and create a single robust signal, eliminating the frustration of having to spend hours in front of the chart and still clicking at the wrong time. This ensures that your entry is validated by logic, not emotional impulse.
--
Logic Flow Signals & Backtest is a versatile and powerful tool designed to test and validate your trading ideas with indicators from the TradingView community.
Extreme flexibility: Allows you to combine indicators available on TradingView (EMAs, RSI, MACD, SMC, etc.) to create custom entry and exit logics.
Sequential Logic: Goes far beyond simple crossovers. You can define rules where signal A must occur before signal B — and, if desired, before signal C or D — to validate an entry. Add time, order, and context filters, creating truly intelligent sequential logic that generates a single final alert only when all conditions align.
With Stages (Stage 1, Stage 2, etc.), your entries follow the exact sequence you define. And the best part: you no longer need to spend hours in front of the chart waiting for confluences. Simply set up your stages once, create an alert in TradingView, and the system will automatically notify you when the ideal combination of signals occurs.
Sequence Invalidation: Offers the option to define conditions that, if they occur, immediately cancel an ongoing entry sequence, helping to avoid entries in unfavorable scenarios.
Explaining the first image example (chart below):
LONG INDICATOR 1 (Stage 1): The market confirms a change in character (CHoCH Bullish). The system enters an alert state awaiting the confluence of the next indicators.
LONG INDICATOR 2 and 3 (Stage 2): Entry is only released when the SMA17 crosses above the SMA72 (indicator 2), but with one condition: The SMA72 must be ABOVE the SMA305 (indicator 3); Without this alignment of indicator 3, the signal of indicator 2 does not occur.
LONG INDICATOR 4 (Invalidation Rule): If at any point in the sequence the SMA72 crosses below the SMA305, the setup is immediately canceled and no entry signal is generated. The sequence restarts with indicator 1.
EXIT LONG (Hybrid Exit TP + SIGNAL): The trade seeks a TP target of 1000 ticks, but has a technical "Trailing Stop": if the trend reverses (Exit Long Indicator 1 = SMA72 crosses below the SMA305) before the target, the position is closed to protect capital.
SHORT INDICATOR 1 (Stage 1): Identification of weakness in the market with a Bearish CHoCH.
SHORT INDICATOR 2 and 3 (Stage 2): Entry is only released when the SMA17 crosses below the SMA72 (indicator 2), but with a strict condition: The SMA72 must be BELOW the SMA305 (indicator 3); Without this STATE of indicator 3, the signal from indicator 2 does not occur.
SHORT INDICATOR 4 (Invalidation Rule): If at any point in the sequence the SMA72 crosses above the SMA305, the setup is immediately canceled and no entry signal is generated. The sequence starts again with indicator 1.
EXIT SHORT (Hybrid Exit TP + SIGNAL): The trade seeks a target of 1000 ticks, but has a technical "Trailing Stop": if the downtrend reverses (Exit Short Indicator 1 = SMA72 crosses above the SMA305) before the target, the position is closed to protect capital.
In this strategy, we use the external indicators: Multiple MTF MA and Smart Money Concepts (Advanced)
--
Stage Duration: In STAGE DURATION , you control the maximum time (in candles) allowed for each transition between stages to occur. If the time limit expires before the next stage is reached, the sequence is reset. Keep it at 0 to disable the time limit.
The "Stage Duration" function is available in four separate blocks on the settings panel:
- LONG - STAGE DURATION: Controls the time limit (in candles) between Long entry stages (for example from Stage 1 to Stage 2).
- LONG EXIT - STAGE DURATION: Controls the time limit between Long exit stages.
- SHORT - STAGE DURATION: Controls the time limit between Short entry stages.
- SHORT EXIT - STAGE DURATION: Controls the time limit between Short exit stages.
Explaining the second image example (chart below):
Stage 1 (INDICATOR 1): New Fair Value Gap (FVG) Bullish Confirmed.
- Meaning: The move starts with a bullish FVG (Fair Value Gap), indicating a confirmed imbalance where buyers were much more aggressive than sellers.
Stage 2 (INDICATOR 2): EMA10 crossing above the EMA50.
- Meaning: Immediately after the FVG trigger, the fast moving average (10 periods) crosses the intermediate moving average (50 periods). This confirms that the initial FVG impulse was not an isolated event but the beginning of a short-term trend.
Stage 3: In this final stage, we require two simultaneous confirmations to validate the entry:
- INDICATOR 3: The EMA10 crosses above the EMA100, indicating that the movement has enough strength to break through larger barriers.
- INDICATOR 4: The RSI must be above its own moving average (SMA14). This ensures the asset is gaining momentum at the exact moment the averages are broken, avoiding entries in "tired" markets.
Stage Duration: The most important feature of this setup is the restricted time window.
- Rule: From Stage 1 to 2, and from Stage 2 to 3, the maximum interval to accept confluences is only 3 candles.
- Why this is vital? If the market took 20 candles to align these conditions, it would indicate weakness or indecision. By demanding that everything happens within a maximum of 3 candles per step, the setup filters only the moves where buying pressure is urgent and aggressive, increasing the probability of an explosive move in favor of the trade.
Asymmetric Risk Management: To complement a high-probability and high-pressure setup, we use aggressive risk management:
- Stop Loss (Technical/Short): 200 Ticks. If the buying pressure fails quickly, we exit early with a small loss.
- Take Profit (Long Target): 1000 Ticks. We aim to ride the impulse "leg" that the setup identified.
- Risk/Reward: 5:1. This means a single winning trade covers five losing trades, making the strategy mathematically viable in the long term.
In this strategy, we use the external indicators: Multiple MTF MA , Smart Money Concepts (Advanced) and Relative Strength Index (RSI) .
--
Multiple Operating Modes
It is not limited to sequences. It can operate by confluence (where all signals must be valid at the same time), by single trigger (only one signal is required), or by "OR" logic (any one of the defined signals).
- If you use only Stage 1 in more than one indicator session, the entry will only occur if all enabled conditions are true simultaneously.
- Any condition defined as OR can trigger the entry by itself.
- If only one condition block is enabled, the single indicator will function as a simple signal.
Multiple and Simultaneous Exits
It allows for the configuration of exits by both indicators and TP/SL targets. The strategy will close the trade as soon as any of these conditions are met first (indicator signal, profit target, or loss limit
Integrated Risk Management
It includes Stop Loss and Take Profit exits by percentage and ticks, which are easy to configure and essential for risk management. The strategy calculates the exact TP and SL prices based on your entry price and monitors the market on every tick.
Explaining the Third Image Example (Chart Below)
The move was validated by a 4-step logical sequence (Stage 1) and managed by a hybrid exit system.
Short Indicator 1, 2, and 3: The price (Close) crossed below the SMA200, SMA72, and SMA17 averages simultaneously.
- What this means: When a single candle has the strength to break below the short-term (17), mid-term (72), and long-term (200) averages, it indicates a high probability for the price to seek lower levels.
To reinforce Indicators 1 through 3, we added an extra layer of confirmation.
Short Indicator 4: The Positive Volume Index (PVI) needed to be below its own long-term average (EMA300).
- Why this is important: PVI below the average confirms that selling volume is dominant, validating that the break of the averages was not just noise.
Triple Exit Management (Maximum Security)
The great advantage of this tool is the ability to manage risk dynamically. In this trade, we configured three simultaneous exit conditions, where the first one to be met closes the position:
1. Financial Target (TP): A fixed Take Profit of 15%.
2. Exit Short Indicator 1 (Technical Exit 1): If the average (SMA72) crosses above the average (SMA200), the trade is closed.
3. Exit Short Indicator 2 (Technical Exit 2): If the PVI crosses above the EMA300, indicating an entry of buying strength, the trade is closed.
"OR" Logic: The tool monitors these conditions in real-time. Whichever occurs first triggers the exit, ensuring you lock in profit (TP) or protect your capital at the first sign from the indicators.
In this strategy, we use the external indicators: Multiple MTF MA and Positive Volume Index .
--
Reversal Mode (Stop and Reverse)
The Reversal Mode (Stop and Reverse) allows a new signal in the opposite direction (e.g., a SELL signal) to automatically close an existing position (e.g., BUY) and open a new one (sell). This "stop and reverse" function can be enabled or disabled in the settings, giving you full control over whether the strategy should only exit (awaiting a new signal) or immediately reverse the position.
Explaining the Fourth Image Example (Chart Below)
In this example, we demonstrate a setup focused on capturing every market "flip," keeping the trader positioned 100% of the time ("Always-in"), a technique widely used in automation.
- Long Entry: Occurs immediately upon confirming a bullish change of character (New CHoCH Bullish).
- Short Entry: Occurs immediately upon confirming a bearish change of character (New CHoCH Bearish).
- Exit (The Differentiator): We are not using fixed TP or SL here. The exit is triggered by Automatic Reversal.
The Power of "Exit by Opposite Signal"
Notice the labels on the chart: "Close Short" followed immediately by a "Long." This happens because the Allow Reversal function is enabled in the tool's settings.
When the market generates a buy signal, the tool understands that the sell thesis has been invalidated. It simultaneously sends an order to close the Short position and open a new Long position.
When to use this exit rule?
- Capturing Long Trends / Directional Movements: Ideal for volatile assets where you want to ride the trend until the market structure effectively changes.
- Operational Simplification: Eliminates the need to guess profit targets and acts as a loss limiter when the price moves against your position. The market dictates when to enter and when to exit.
Hybrid Flexibility:
The strongest point of Logic Flow is that you don't have to choose just one method. Reversal can be used in two ways:
1. Individually (as in the image): Reversal is the only form of exit. You stay in the move until the opposite signal.
2. Combined (Hybrid): You can enable Reversal and configure a safety Stop Loss + technical Take Profit (Exit Long/Short Indicator).
- Example: If the price hits your TP/SL first, you exit. If the market turns before the TP, the Reversal takes you out of the trade and generates a new trend alert.
In this strategy, we use the external indicators: Smart Money Concepts .
--
Backtesting: Far beyond creating logic and generating signals, Logic Flow Signals stands out due to its Integrated Backtest.
Backtesting serves as a reality check for the trader. It takes the strategy out of the realm of "imagination" and puts it to the test against historical data.
Here are the 4 main practical uses:
1. Verifying Feasibility (Proof of Concept): The most obvious use is to answer: "Does this idea make money?". Many strategies look visually perfect on the chart, but when you run the backtest, you discover that brokerage fees or frequent "stops" consume all the profit.
2. Knowing the "Worst-Case Scenario" (Drawdown): Maximum Drawdown: It shows you what the largest accumulated drop the strategy has ever experienced was. By identifying a Drawdown that exceeds the desired risk tolerance, the backtest allows for parameter optimization in search of a more efficient balance between risk and return.
3. Fine-Tuning (Optimization): It allows you to make changes such as: Increasing the profit target, changing the stop, removing an indicator, changing the chart timeframe, among other actions. You can test various variations instantly to find the most efficient configuration.
4. Expectation Management and Discipline: Backtesting does not eliminate fear nor guarantee that the future will repeat the past, but it serves as a reference map.
The Real Role: Aligning expectation with reality.
In the image below, you can check out how a backtest result is generated:
To understand the backtest results shown above, check the chart and the detailed operational logic below:
This operational example seeks to identify altcoins that are demonstrating an explosive decorrelation relative to Bitcoin. The logic is: we want to buy only the assets that are outperforming the market leader, precisely at the moment when speculative money (Open Interest) heavily enters the market.
For the buy signal (Long) to be triggered, three conditions must be simultaneously true (Stage 1):
Long Indicator 1 (Altcoin Strength): The asset's RSI must be above the 70 level (Overbought), indicating extremely strong bullish momentum.
Long Indicator 2 (Bitcoin Weakness): Bitcoin's RSI must be below the 50 level. This confirms that the Altcoin's rally is genuine and independent.
Long Indicator 3 (Money Flow): The Open Interest (open contracts) must be above the Extreme level of the OI DELTA indicator. This validates that new money is aggressively entering the asset to sustain the rally.
Risk Management: In this example, we configured an aggressive target to capture the altcoin volatility:
- Take Profit: 100%
- Stop Loss: 20%
- Risk/Reward: 5:1
In this strategy, we use the external indicators: RSI Crypto Strength (Asset vs BTC) and Open Interest Delta .
--
Configuring an Indicator Block
Each block (BUY INDICATOR 1, BUY INDICATOR 2, ...) allows you to define a complete condition.
- Enable (Activate): Simply turns this indicator block on or off.
- Source A: The first value you want to analyze.
example: The Closing Price (Close), Opening Price (Open), or another TradingView indicator.
- Condition: How 'Source A' will be compared.
example: Crossover/Crossunder, Greater Than, Less Than, Cross Up.
- Comparison Type: The option that defines whether you will compare 'Source A' with a fixed number or with another indicator.
- Fixed Value: Used if you selected "Fixed Value".
example: For an RSI greater than 70 condition, Source A would be the RSI, the Condition would be Greater Than, and the Fixed Value would be 70.
- Source B: Used if you selected "Source B".
example: For a condition where the EMA10 crosses above the EMA200, Source A would be the EMA10, the Condition would be 'Cross Up', and Source B would be the EMA200.
--
Configurable Alert Signals
Configurable Alert Signals: The tool allows for the creation of fully customized alerts for different types of events, such as entries, signal-based exits, take profit, and stop loss. These alerts can be used for both strategy automation and manual, real-time notifications.
The message field is highly flexible: it accepts dynamic placeholders, JSON structure, UUID identifiers, or any custom text, allowing integration with other external tools and systems via webhook.
Configuring Your Messages:
- LONG/SHORT - ALERTS: Defines the message for new entries.
- LONG/SHORT INDICATOR EXIT - ALERTS: Defines the message for signal-based exits (e.g., moving average cross).
- REVERSAL - ALERTS: Defines the message for when a position is closed by an opposite signal (stop-and-reverse).
- LONG/SHORT TP/SL EXIT - ALERTS: Defines the message for exits triggered by take profit (TP) or stop loss (SL), via percentage or ticks.
A Single Alert to Control Everything
You don't need to create separate alerts for "Buy," "Sell," or "Exits." On a single screen, you can create strategies by defining entries, signal-based exits, profit targets, or stop limits.
Alert Times (Operating Window)
In the Alert Times section, you can define a specific time (and time zone) for the strategy to generate entry or exit signals.
--
To create your alert, simply follow these steps:
- Condition: Select the script name: "Logic Flow Signals & Backtest".
- Message: Insert only the placeholder: {{strategy.order.alert_message}}
Once this single alert is active, it will "listen" to all orders executed by the strategy.
This means you can have your Long-Term, Short-Term, Signal-Based Exits, and TP/SL strategies active simultaneously. When any of these events are plotted on the chart, the script will send the customized message (which you wrote in the fields) to your single alert.
--
Advanced period filters: Allow you to test the strategy in specific date ranges, over the last X days, or over the last X bars, facilitating performance analysis in different market environments.
--
Status Panel: Displays a clear summary of all active rules and settings directly on the chart, facilitating the visualization and confirmation of the running logic.
Additionally, it has a settings box where you can activate or deactivate the panel, choose its position (such as at the bottom or side), and adjust its size.
--
The Thumbnail strategy uses the following external indicators: Multiple MTF MA and Breakout Finder .
--
Final Considerations:
The Logic Flow Signals & Backtest tool is a versatile and powerful system, designed to test and apply trading ideas based on multiple indicators from TradingView.
Its differential is being a customization environment: the script does not have integrated graphical indicators, as the objective is precisely to allow the user to combine and integrate multiple existing indicators in the TradingView community to build unique entry and exit logics.
It offers flexibility and precision, but the true value emerges when the trader integrates the tool into a consistent trading plan, with efficient risk management (Stop Loss and Take Profit), leverage control, and a professional mindset.
Important: Risk of Repainting (Unstable Data): Avoid indicators that 'repaint' (those that change their values in past bars after the closing of new candles). The backtest will be invalidated, and the actual performance of the strategy will fail.
Legal Warning and Didactic Purpose:
It is fundamental to understand that all visual examples, charts, and texts contained in this description do not constitute financial advice, buy or sell recommendations, nor a promise of easy or guaranteed gains.
This is an advanced support tool, not an automatic profit system. Use the integrated backtesting to evaluate the historical behavior of strategies before real execution and understand how different market conditions impact your results. The sole purpose of this material is to demonstrate the logical and execution capacity of the script, serving as a didactic guide for you to test and validate your own ideas.
Conclusion and Risk Warning:
Success in financial markets comes not only from a set of charting indicators, but from the trader's understanding, practice, and discipline. Our objective is to provide a robust, customizable, and intuitive solution, created to enhance your technical analysis and broaden your strategic vision, without replacing critical thinking and conscious decision-making.
Finally, remember: past results do not guarantee future performance. The real differentiator lies in continuous learning, testing, and evolution.

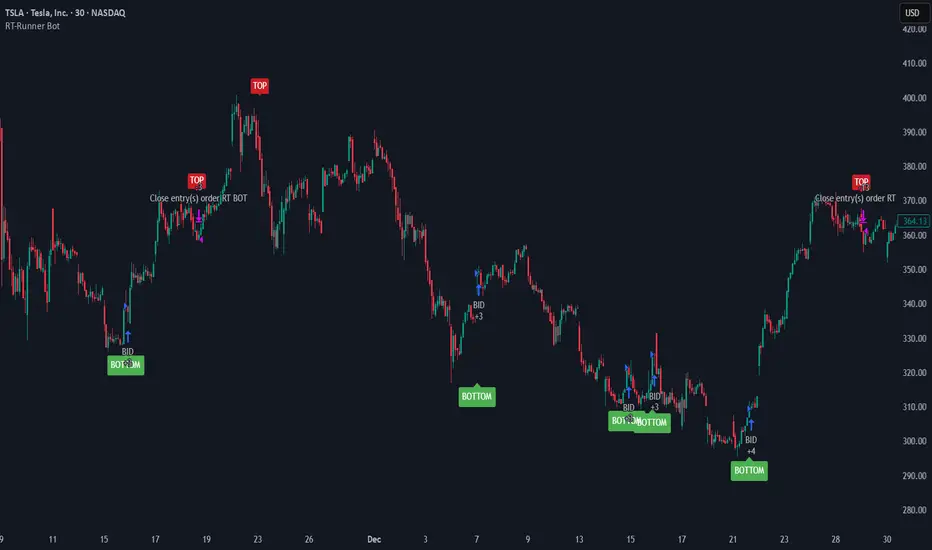
RT-Runner BotRunner Bot is a trend following tool designed to highlight when price shifts from normal back and forth rotation into stronger directional moves. It is built to help traders focus on higher quality trend legs, stay patient during chop, and avoid forcing trades when conditions are not aligned.
Blurring The Lines - Indicator vs Bot
Rainbow Trends set out to combine some of the ideas behind automated trading bots with the flexibility of trading indicators. After years of development, Runner Bot was built as an "indicator bot" that can be applied across multiple assets and multiple timeframes from the same interface.
How It Works
This tool aims to identify points where large market players - the "whales" - may be more likely to reverse the trend. It generates BOTTOM signals when its conditions suggest a potential market bottom has formed, and TOP signals when it detects that a potential top has been reached.
These signals are plotted directly on the chart so traders can visually review where Runner Bot has flagged prior tops and bottoms and compare them with their own levels, structure, and risk management.
How It Changes With Timeframe
Runner Bot identifies trend reversals based on the selected timeframe. The same logic can be applied across intraday, swing, and macro views, but its behavior will naturally change:
For macro level reversals, many traders focus on higher timeframes such as H4 to H12.
If you are scalping, you can switch to much lower timeframes, but keep in mind that bottoms detected on shorter intervals are less reliable at predicting a true long term bottom.
Choosing the timeframe intentionally is important: higher timeframes tend to highlight larger structural tops and bottoms, while lower timeframes are more sensitive to short term noise.
Tuning The Bot
Runner Bot was built to be relatively turnkey, but it does allow users to tune it for specific timeframes and assets.
To adjust the sensitivity of the TOP/BOTTOM prints, adjust the first two values in the settings column:
Decreasing these values (negative adjustments) will generally increase the number of TOP/BOTTOM signals the bot will fire.
Increasing these values will do the opposite and make TOP/BOTTOM signals less common.
This lets traders decide whether they want Runner Bot to be more selective (fewer, higher conviction style signals) or more frequent (more signals for active traders).
The trader also has the option to toggle the signals On/Off as desired. Some traders prefer to only plot TOPs and not BOTTOMs, or only BOTTOMs and not TOPs, depending on their strategy.
Limitations Of The Tool
Under the hood, Runner Bot uses internal algorithms working together to analyze price action. It can be applied across multiple timeframes, but like any tool, it has its sweet spots:
On higher ranges like 12H to 1D, you will mostly see TOP signals, which can be useful for monitoring extended moves.
On ultra low timeframes under 15 minutes, market noise can increase and short term bottoms are less reliable as long term turning points.
Fine tuning your settings to match your strategy, asset, and timeframe is recommended rather than relying on one configuration for every situation.
Preferred Settings
Over time, a few configurations have become common starting points:
H4 - A core timeframe to start catching both Tops and Bottoms across TradFi, Crypto, and Commodities.
H2/H4 Combo - Monitoring Bottoms on H2 and taking profits on H4 has been a popular combination among Rainbow Theory traders. H2 can provide earlier entries, while H4 offers a more conservative, lagging exit.
1D/H24 - Helpful for macro Tops in both TradFi and Crypto when combined with other higher timeframe context.
These are not rules, but practical examples of how some traders choose to deploy Runner Bot.
Automating Alerts
Runner Bot can also be connected to standard TradingView alerts so TOP and BOTTOM signals do not need to be watched manually on every bar.
A typical alert setup:
Symbol - Set to the asset you are charting.
Condition - Set to Runner Bot (this will use the settings you currently have on the chart).
Condition detail - Use the alert() function calls only so the tool can send alerts when TOP or BOTTOM signals fire.
Interval - Same as chart (this locks alerts to the timeframe you set them up on).
Once alerts are configured, TradingView can notify you according to your alert preferences whenever Runner Bot detects a new TOP or BOTTOM based on your current settings.
Important Note
Runner Bot is intended to provide additional context around tops, bottoms, and broader trend behavior. It is not a standalone signal generator and should always be used together with your own analysis, testing, and risk management. Historical Runner Bot signals and past market reversals do not guarantee future results.
🐋 Tight lines and happy trading!
[Aegis]Original Turtle System for CryptoAs Richard Dennis once said, "Even if I published all the Turtle rules in the newspaper right now, no one would be able to 'execute' them," and 40 years later, even in modern financial markets (like the crypto market) where all the conditions have been disclosed, this strategy continues to deliver amazing performance. The following outlines the original Turtle rules as disclosed by Curtis Faith in his book *Way of the Turtle*, and a TradingView algorithm that translates these rules for application in the crypto market.
---
### **The Original Turtle Trading Rules**
#### **1. Markets**
* Trade in liquid futures markets.
#### **2. Position Sizing**
The volatility measure, **N**, is used as the basis for all calculations.
**True Range (TR) Calculation:** Select the largest of the following three values:
* Current High - Current Low
* $|\text{Current High} - \text{Previous Close}|$ (Absolute Value)
* $|\text{Current Low} - \text{Previous Close}|$ (Absolute Value)
**N (Average True Range, ATR) Calculation:**
$$N = \frac{(19 \times \text{PDN} + \text{TR})}{20}$$
* **PDN:** Previous Day's N value
* **TR:** Current True Range
This is similar to a 20-day Exponential Moving Average, and is sometimes calculated using a Simple Moving Average.
**Unit Size Calculation:**
$$\text{Unit Size (Number of Contracts)} = \frac{1\% \text{ of Account Equity}}{(\text{N} \times \text{Dollars per Point})}$$
* **Dollars per Point (Tick Value):** The value of a 1-point change in price.
#### **3. Entries**
* **Entry:** Buy when the 55-day high is broken to the upside, and sell when the 55-day low is broken to the downside.
#### **5. Stops**
* The stop-loss for every unit is set at a price **2N** unfavorable from the entry price.
* For each additional unit added, the stop price for the **entire position** is adjusted favorably by **1/2 N**.
* In other words, the stop price of the last unit entered becomes the stop price for the entire position.
#### **6. Exits**
The exit rule for profitable positions (before a stop is hit) is as follows:
* **Long Positions:** Exit when the 20-day low is broken to the downside.
* **Short Positions:** Exit when the 20-day high is broken to the upside.
*Note: This exit rule is followed only if the price has moved up by a value greater than or equal to the N value multiplied by the criterion for changing the take-profit line (the original Korean text mentions a condition based on N, which is commonly interpreted as requiring a profit before applying the channel exit).*
리처드 데니스가 앞서 "내가 지금 당장 터틀의 모든 규칙을 신문에 공표한다고 해도 아무도 '실행'하지 못할 것"라고 말했듯 40년이 흘러 모든 조건이 공개된 현대 금융시장(크립토 시장)에서도 여전히 이 전략은 놀라운 퍼포먼스를 기록하고 있습니다. 아래는 커티스 페이스가 자신의 저서 '터틀의 방식'에 공개한 오리지널 터틀 규칙과 이를 알고리즘으로 변환하여 크립토마켓에 적용한 트레이딩뷰 알고리즘 입니다.
##### 1. 시장 (Markets)
• 유동성이 풍부한 선물 시장에서 거래한다.
##### 2. 포지션 크기 (Position Sizing)
변동성 측정 단위인 N을 모든 계산의 기초로 사용한다.
**True Range (TR) 계산:** 다음 세 가지 값 중 가장 큰 값을 선택한다.
- • 현재 고가 - 현재 저가
- • |현재 고가 - 전일 종가| (절대값)
- • |현재 저가 - 전일 종가| (절대값)
**N (Average True Range, ATR) 계산:**
N = (19 × PDN + TR) / 20
- • PDN: 이전 날의 N 값
- • TR: 현재 True Range
이는 20일 지수이동평균과 유사하며, 단순이동평균으로 계산하기도 한다.
**1 유닛(Unit)의 크기 계산:**
유닛 크기 (계약 수) = 계좌 자산의 1% / (N × 틱 가치)
• 틱 가치(Dollars per Point): 1포인트 변동 시의 가치
##### 3. 진입 (Entries)
- • 진입: 55일 고가를 상향 돌파하면 매수, 55일 저가를 하향 돌파하면 매도한다.
##### 5. 손절 (Stops)
- • 모든 유닛에 대한 손절 기준은 진입 가격으로부터 2N 만큼 불리한 가격에 설정한다.
- • 유닛이 추가될 때마다 전체 포지션의 손절 가격을 1/2 N 만큼 유리한 방향으로 상향 조정한다.
- • 즉, 마지막으로 진입한 유닛의 손절 가격이 전체 포지션의 손절 가격이 된다.
##### 6. 청산 (Exits)
손절에 도달하기 전 수익 중인 포지션의 청산 규칙은 다음과 같다.
- • 매수 포지션: 20일 저가를 하향 돌파할 때 청산한다.
- • 매도 포지션: 20일 고가를 상향 돌파할 때 청산한다.
단, N값에 익절선 변경 기준을 곱한 값 이상으로 가격이 상승할 경우, 위 규칙을 따른다.

RSI Divergence Strategy v6 What this does
Detects regular and hidden divergences between price and RSI using confirmed RSI pivots. Adds RSI@pivot entry gates, a normalized strength + volume filter, optional volume gate, delayed entries, and transparent risk management with rigid SL and activatable trailing. Visuals are throttled for clarity and include a gap-free horizontal RSI gradient.
How it works (simple)
🧮 RSI is calculated on your selected source/period.
📌 RSI pivots are confirmed with left/right lookbacks (lbL/lbR). A pivot becomes final only after lbR bars; before that, it can move (expected).
🔎 The latest confirmed pivot is compared against the previous confirmed pivot within your bar window:
• Regular Bullish = price lower low + RSI higher low
• Hidden Bullish = price higher low + RSI lower low
• Regular Bearish = price higher high + RSI lower high
• Hidden Bearish = price lower high + RSI higher high
💪 Each divergence gets a strength score that multiplies price % change, RSI change, and a volume ratio (Volume SMA / Baseline Volume SMA).
• Set Min divergence strength to filter tiny/noisy signals.
• Turn on the volume gate to require volume ratio ≥ your threshold (e.g., 1.0).
🎯 RSI@pivot gating:
• Longs only if RSI at the bullish pivot ≤ 30 (default).
• Shorts only if RSI at the bearish pivot ≥ 70 (default).
⏱ Entry timing:
• Immediate: on divergence confirm (delay = 0).
• Delayed: after N bars if RSI is still valid.
• RSI-only mode: ignore divergences; use RSI thresholds only.
🛡 Risk:
• Rigid SL is placed from average entry.
• Trailing activates only after unrealized gain ≥ threshold; it re-anchors on new highs (long) or new lows (short).
What’s NEW here (vs. the reference) — and why you may care
• Improved pivots + bar window → fewer early/misaligned signals; cleaner drawings.
• RSI@pivot gates → entries aligned with true oversold/overbought at the exact decision bar.
• Normalized strength + volume gate → ignore weak or low-volume divergences.
• Delayed entries → require the signal to persist N bars if you want more confirmation.
• Rigid SL + activatable trailing → trailing engages only after a cushion, so it’s less noisy.
• Clutter control + gradient → readable chart with a smooth RSI band look.
Suggested starting values (clear ranges)
• RSI@pivot thresholds: LONG ≤ 30 (oversold), SHORT ≥ 70 (overbought).
• Min divergence strength:
0.0 = off
3–6 = moderate filter
7–12 = strict filter for noisy LTFs
• Volume gate (ratio):
1.0 = at least baseline volume
1.2–1.5 = strong-volume only (fewer but cleaner signals)
• Pivot lookbacks:
lbL 1–2, lbR 3–4 (raise lbR to confirm later and reduce noise)
• Bar window (between pivots):
Min 5–10, Max 30–60 (increase Min if you see micro-pivots; increase Max for wider structures)
• Risk:
Rigid SL 2–5% on liquid majors; 5–10% on higher-volatility symbols
Trailing activation 1–3%, trailing 0.5–1.5% are common intraday starts
Plain-text examples
• BTCUSDT 1h → RSI 9, lbL 1, lbR 3, Min strength 5.0, Volume gate 1.0, SL 4.5%, Trail on 2.0%, Trail 1.0%.
• SPY 15m → RSI 8, lbL 1, lbR 3, Min strength 7.0, Volume gate 1.2, SL 3.0%, Trail on 1.5%, Trail 0.8%.
• EURUSD 4h → RSI 14, lbL 2, lbR 4, Min strength 4.0, Volume gate 1.0, SL 2.5%, Trail on 1.0%, Trail 0.5%.
Notes & limitations
• Pivot confirmation means the newest candidate pivot can move until lbR confirms it (expected).
• Results vary by timeframe/symbol/settings; always forward-test.
• Educational tool — no performance or profit claims.
Credits
• RSI by J. Welles Wilder Jr. (1978).
• Reference divergence script by eemani123:
• This version by tagstrading 2025 adds: improved pivot engine, RSI@pivot gating, normalized strength + optional volume gate, delayed entries, rigid SL and activatable trailing, and a gap-free RSI gradient.

ICT Liquidity Sweep Asia/London 1 Trade per High & Low🧠 ICT Liquidity Sweep Asia/London — 1 Trade per High & Low
This strategy is inspired by the ICT (Inner Circle Trader) concepts of liquidity sweeps and market structure, focusing on the Asia and London sessions.
It automatically identifies liquidity grabs (sweeps) above or below key session highs/lows and enters trades with a fixed risk/reward ratio (RR).
----------------------------------------------------------------------------------
----------------------------------------------------------------------------------
⚙️ Core Logic
-Asia Session: 8:00 PM – 11:59 PM (New York time)
-London Session: 2:00 AM – 5:00 AM (New York time)
-The script marks the Asia High/Low and London High/Low ranges for each day.
-When the market sweeps above a session high → potential Short setup
-When the market sweeps below a session low → potential Long setup
-A trade is triggered when the confirmation candle closes in the opposite direction of the sweep (bearish after a high sweep, bullish after a low sweep).
-Only one trade per sweep type (1 per High, 1 per Low) is allowed per session.
----------------------------------------------------------------------------------
----------------------------------------------------------------------------------
📈 Risk Management
-Configurable Risk/Reward Target (default = 2:1)
-Configurable Position Size (number of contracts)
-Each trade uses a fixed Stop Loss (beyond the wick of the sweep) and a Take Profit calculated from the RR setting.
-All trades are automatically logged in the Strategy Tester with performance metrics.
----------------------------------------------------------------------------------
----------------------------------------------------------------------------------
💡 Features
✅ Visual session highlighting (Asia = Aqua, London = Orange)
✅ Automatic liquidity line plotting (session highs/lows)
✅ Entry & exit labels (optional visual display)
✅ Customizable RR and contract size
✅ Works on any instrument (ideal for indices, futures, or forex)
✅ Compatible with all timeframes (optimized for 1M–15M)
----------------------------------------------------------------------------------
----------------------------------------------------------------------------------
⚠️ Notes
-Best used on New York time-based charts.
-Designed for educational and backtesting purposes — not financial advice.
-Use as a foundation for further optimization (e.g., SMT confirmation, FVG filter, or time-based restrictions).
----------------------------------------------------------------------------------
----------------------------------------------------------------------------------
🧩 Recommended Use
Pair this with:
-ICT’s concepts like CISD (Change in State of Delivery) and FVGs (Fair Value Gaps)
-Higher timeframe liquidity maps
-Session bias or daily narrative filters
----------------------------------------------------------------------------------
----------------------------------------------------------------------------------
Author: jygirouard
Strategy Version: 1.3
Type: ICT Liquidity Sweep Automation
Timezone: America/New_York

ProbRSI Adaptive SPY and QQQ Swing One Hour Strategy Summary in one paragraph
A probabilistic RSI engine for large cap ETFs and index names on intraday and swing timeframes. It converts ATR scaled returns into a 0 to 100 probability line, adapts its smoothing from path efficiency, and gates flips with simple percent levels. It is original because it fuses three pieces that traders rarely combine in one signal line: ATR normalized return probability, curvature compression, and per bar adaptive EMA. Add it to a clean chart, keep the default one hour signal on QQQ, and read the entry and exit markers generated by the strategy. For conservative alerts select on bar close.
Scope and intent
• Markets. Major ETFs and large cap equities. Index futures. Liquid crypto. Major FX pairs
• Timeframes. One minute to daily. Defaults to one hour for swing pace
• Default demo used in this publication. SPY/QQQ on one hour
• Purpose. Reduce false flips by adapting to path efficiency and by gating long and short separately
• Limits. This is a strategy. Orders are simulated on standard candles only
Originality and usefulness
• Unique fusion. Logistic probability of ATR scaled returns with arcsine pre transform, optional curvature compression, and per bar adaptive EMA steered by an efficiency ratio
• Failure mode addressed. Fast whips in congestion and late entries after spikes
• Testability. Each component has a named input and can be tuned directly. Entry names Long and Short are visible in the list of trades
• Portable yardstick. ATR scaled return is a common unit across symbols and venues
• Protected rationale. The code stays protected to preserve implementation details of the adaptive engine and curvature assist while the method and usage are fully explained here for community review
Method overview in plain language
You convert raw returns into a probability scale, adapt the smoothing to the straightness of the path, and only allow flips when a simple gate is satisfied. The probability line crosses its own EMA to generate signals. When the cross happens below a short gate or above a long gate, the flip is allowed. Otherwise it is ignored.
Base measures
• Return basis. Close minus prior close normalized by ATR, then arcsine to damp large steps. ATR window is set by ATR length. Sensitivity is adjusted by an ATR scale input
• Probability map. A logistic function maps the normalized return to 0 to 1 which becomes 0 to 100 after scaling
Components
• Probability core. Logistic probability of ATR scaled returns. Higher values imply upside pressure. Smoothed by an adaptive EMA
• Curvature assist optional. A curvature proxy compresses extreme spikes toward neutral. Useful after news bars. Weight controls strength
• Efficiency ratio. A path efficiency score from 0 to 1 extends the smoothing length during noisy paths and shortens it during directional paths
• Signal line. An EMA of the probability line creates the reference for cross up and cross down
• Gates. Two simple percent levels define when long and short flips are allowed
Fusion rule
• The adaptive EMA length is computed as a linear map between a minimum and a maximum bound based on one minus efficiency
• If curvature assist is enabled the probability is adjusted by a small counter spike term
• Final probability is compared to its EMA
Signal rule
• Long. A long entry is suggested when probability crosses above the signal line and the current probability is above the Long gate level
• Short. A short entry is suggested when probability crosses below the signal line and the current probability is below the Short gate level
• Exit and flip. When an opposite entry condition appears the current position is closed and a new position opens in the opposite direction
What you will see on the chart
• Strategy markers on suggestion bars. Orders named Long and Short
• Exit marker when the opposite signal closes the open side
• No table by design. All tuning lives in Inputs for a clean chart
Inputs with guidance
Market TF
• Symbol. Series used for oscillator computation. Use the instrument you trade or a close proxy
• Signal timeframe. Timeframe where the oscillator is evaluated. Leave blank to follow the chart
Core
• Price source. Series used for returns. Typical choice close
• Base length. Fallback EMA length used when adaptation is off. Typical range 20 to 200. Larger smooths more
• ATR length. Window for ATR that scales returns. Typical range 10 to 30. Larger normalizes more and lowers sensitivity
• Logit sharpness. Steepness of the logistic link. Typical range 1 to 8. Raising it reacts more to the same input
• ATR scale. Extra divisor on ATR. Typical range 0.5 to 2. Smaller is more sensitive
• Signal length. EMA of the probability line. Typical range 5 to 20. Larger gives fewer flips
• Long gate. Allow long flips only above this level. Typical range 20 to 40
• Short gate. Allow short flips only below this level. Typical range 20 to 40
Adaptive
• Adaptive smoothing. If on, the efficiency ratio controls the per bar EMA length
• Min effective length. Lower bound of adaptive EMA. Typical range 5 to 50
• Max effective length. Upper bound of adaptive EMA. Typical range 50 to 300
• Efficiency window. Window for efficiency ratio. Typical range 30 to 100
Shape Assist
• Curvature influence. If on, extreme spikes are nudged toward neutral
• Curvature weight. Strength of compression. Typical range 0.1 to 0.3
Properties visible in this publication
• Initial capital. 25000
• Base currency. USD
• request.security lookahead off everywhere
• Commission. 0.03 percent
• Slippage. 5 ticks
• Default order size method percent of equity with value 3 for realistic testing
• Pyramiding 0
• Process orders on close ON
• Bar magnifier OFF
• Recalculate after order is filled OFF
• Calc on every tick OFF
Realism and responsible publication
• No performance claims. Past results never guarantee future outcomes
• Shapes can move while a bar forms and settle on close
• Strategies use standard candles for signals and orders only
Honest limitations and failure modes
• Economic releases and thin liquidity can break assumptions behind the curvature assist
• Gap heavy symbols may prefer a longer ATR window
• Very quiet regimes can reduce signal contrast. Consider higher gates or longer signal length
• Session time follows the exchange of the chart and can change symbol to symbol
• Symbol sensitivity is expected. Use the gates and length inputs to find stable settings
• Past results never guarantee future outcomes
Open source reuse and credits
• None
Mode
Public protected. Source is hidden while access is free. Implementation detail remains private. Method and use are fully disclosed here
Legal
Education and research only. Not investment advice. You are responsible for your decisions. Test on historical data and in simulation before any live use. Use realistic costs.

Quantum Flux Universal Strategy Summary in one paragraph
Quantum Flux Universal is a regime switching strategy for stocks, ETFs, index futures, major FX pairs, and liquid crypto on intraday and swing timeframes. It helps you act only when the normalized core signal and its guide agree on direction. It is original because the engine fuses three adaptive drivers into the smoothing gains itself. Directional intensity is measured with binary entropy, path efficiency shapes trend quality, and a volatility squash preserves contrast. Add it to a clean chart, watch the polarity lane and background, and trade from positive or negative alignment. For conservative workflows use on bar close in the alert settings when you add alerts in a later version.
Scope and intent
• Markets. Large cap equities and ETFs. Index futures. Major FX pairs. Liquid crypto
• Timeframes. One minute to daily
• Default demo used in the publication. QQQ on one hour
• Purpose. Provide a robust and portable way to detect when momentum and confirmation align, while dampening chop and preserving turns
• Limits. This is a strategy. Orders are simulated on standard candles only
Originality and usefulness
• Unique concept or fusion. The novelty sits in the gain map. Instead of gating separate indicators, the model mixes three drivers into the adaptive gains that power two one pole filters. Directional entropy measures how one sided recent movement has been. Kaufman style path efficiency scores how direct the path has been. A volatility squash stabilizes step size. The drivers are blended into the gains with visible inputs for strength, windows, and clamps.
• What failure mode it addresses. False starts in chop and whipsaw after fast spikes. Efficiency and the squash reduce over reaction in noise.
• Testability. Every component has an input. You can lengthen or shorten each window and change the normalization mode. The polarity plot and background provide a direct readout of state.
• Portable yardstick. The core is normalized with three options. Z score, percent rank mapped to a symmetric range, and MAD based Z score. Clamp bounds define the effective unit so context transfers across symbols.
Method overview in plain language
The strategy computes two smoothed tracks from the chart price source. The fast track and the slow track use gains that are not fixed. Each gain is modulated by three drivers. A driver for directional intensity, a driver for path efficiency, and a driver for volatility. The difference between the fast and the slow tracks forms the raw flux. A small phase assist reduces lag by subtracting a portion of the delayed value. The flux is then normalized. A guide line is an EMA of a small lead on the flux. When the flux and its guide are both above zero, the polarity is positive. When both are below zero, the polarity is negative. Polarity changes create the trade direction.
Base measures
• Return basis. The step is the change in the chosen price source. Its absolute value feeds the volatility estimate. Mean absolute step over the window gives a stable scale.
• Efficiency basis. The ratio of net move to the sum of absolute step over the window gives a value between zero and one. High values mean trend quality. Low values mean chop.
• Intensity basis. The fraction of up moves over the window plugs into binary entropy. Intensity is one minus entropy, which maps to zero in uncertainty and one in very one sided moves.
Components
• Directional Intensity. Measures how one sided recent bars have been. Smoothed with RMA. More intensity increases the gain and makes the fast and slow tracks react sooner.
• Path Efficiency. Measures the straightness of the price path. A gamma input shapes the curve so you can make trend quality count more or less. Higher efficiency lifts the gain in clean trends.
• Volatility Squash. Normalizes the absolute step with Z score then pushes it through an arctangent squash. This caps the effect of spikes so they do not dominate the response.
• Normalizer. Three modes. Z score for familiar units, percent rank for a robust monotone map to a symmetric range, and MAD based Z for outlier resistance.
• Guide Line. EMA of the flux with a small lead term that counteracts lag without heavy overshoot.
Fusion rule
• Weighted sum of the three drivers with fixed weights visible in the code comments. Intensity has fifty percent weight. Efficiency thirty percent. Volatility twenty percent.
• The blend power input scales the driver mix. Zero means fixed spans. One means full driver control.
• Minimum and maximum gain clamps bound the adaptive gain. This protects stability in quiet or violent regimes.
Signal rule
• Long suggestion appears when flux and guide are both above zero. That sets polarity to plus one.
• Short suggestion appears when flux and guide are both below zero. That sets polarity to minus one.
• When polarity flips from plus to minus, the strategy closes any long and enters a short.
• When flux crosses above the guide, the strategy closes any short.
What you will see on the chart
• White polarity plot around the zero line
• A dotted reference line at zero named Zen
• Green background tint for positive polarity and red background tint for negative polarity
• Strategy long and short markers placed by the TradingView engine at entry and at close conditions
• No table in this version to keep the visual clean and portable
Inputs with guidance
Setup
• Price source. Default ohlc4. Stable for noisy symbols.
• Fast span. Typical range 6 to 24. Raising it slows the fast track and can reduce churn. Lowering it makes entries more reactive.
• Slow span. Typical range 20 to 60. Raising it lengthens the baseline horizon. Lowering it brings the slow track closer to price.
Logic
• Guide span. Typical range 4 to 12. A small guide smooths without eating turns.
• Blend power. Typical range 0.25 to 0.85. Raising it lets the drivers modulate gains more. Lowering it pushes behavior toward fixed EMA style smoothing.
• Vol window. Typical range 20 to 80. Larger values calm the volatility driver. Smaller values adapt faster in intraday work.
• Efficiency window. Typical range 10 to 60. Larger values focus on smoother trends. Smaller values react faster but accept more noise.
• Efficiency gamma. Typical range 0.8 to 2.0. Above one increases contrast between clean trends and chop. Below one flattens the curve.
• Min alpha multiplier. Typical range 0.30 to 0.80. Lower values increase smoothing when the mix is weak.
• Max alpha multiplier. Typical range 1.2 to 3.0. Higher values shorten smoothing when the mix is strong.
• Normalization window. Typical range 100 to 300. Larger values reduce drift in the baseline.
• Normalization mode. Z score, percent rank, or MAD Z. Use MAD Z for outlier heavy symbols.
• Clamp level. Typical range 2.0 to 4.0. Lower clamps reduce the influence of extreme runs.
Filters
• Efficiency filter is implicit in the gain map. Raising efficiency gamma and the efficiency window increases the preference for clean trends.
• Micro versus macro relation is handled by the fast and slow spans. Increase separation for swing, reduce for scalping.
• Location filter is not included in v1.0. If you need distance gates from a reference such as VWAP or a moving mean, add them before publication of a new version.
Alerts
• This version does not include alertcondition lines to keep the core minimal. If you prefer alerts, add names Long Polarity Up, Short Polarity Down, Exit Short on Flux Cross Up in a later version and select on bar close for conservative workflows.
Strategy has been currently adapted for the QQQ asset with 30/60min timeframe.
For other assets may require new optimization
Properties visible in this publication
• Initial capital 25000
• Base currency Default
• Default order size method percent of equity with value 5
• Pyramiding 1
• Commission 0.05 percent
• Slippage 10 ticks
• Process orders on close ON
• Bar magnifier ON
• Recalculate after order is filled OFF
• Calc on every tick OFF
Honest limitations and failure modes
• Past results do not guarantee future outcomes
• Economic releases, circuit breakers, and thin books can break the assumptions behind intensity and efficiency
• Gap heavy symbols may benefit from the MAD Z normalization
• Very quiet regimes can reduce signal contrast. Use longer windows or higher guide span to stabilize context
• Session time is the exchange time of the chart
• If both stop and target can be hit in one bar, tie handling would matter. This strategy has no fixed stops or targets. It uses polarity flips for exits. If you add stops later, declare the preference
Open source reuse and credits
• None beyond public domain building blocks and Pine built ins such as EMA, SMA, standard deviation, RMA, and percent rank
• Method and fusion are original in construction and disclosure
Legal
Education and research only. Not investment advice. You are responsible for your decisions. Test on historical data and in simulation before any live use. Use realistic costs.
Strategy add on block
Strategy notice
Orders are simulated by the TradingView engine on standard candles. No request.security() calls are used.
Entries and exits
• Entry logic. Enter long when both the normalized flux and its guide line are above zero. Enter short when both are below zero
• Exit logic. When polarity flips from plus to minus, close any long and open a short. When the flux crosses above the guide line, close any short
• Risk model. No initial stop or target in v1.0. The model is a regime flipper. You can add a stop or trail in later versions if needed
• Tie handling. Not applicable in this version because there are no fixed stops or targets
Position sizing
• Percent of equity in the Properties panel. Five percent is the default for examples. Risk per trade should not exceed five to ten percent of equity. One to two percent is a common choice
Properties used on the published chart
• Initial capital 25000
• Base currency Default
• Default order size percent of equity with value 5
• Pyramiding 1
• Commission 0.05 percent
• Slippage 10 ticks
• Process orders on close ON
• Bar magnifier ON
• Recalculate after order is filled OFF
• Calc on every tick OFF
Dataset and sample size
• Test window Jan 2, 2014 to Oct 16, 2025 on QQQ one hour
• Trade count in sample 324 on the example chart
Release notes template for future updates
Version 1.1.
• Add alertcondition lines for long, short, and exit short
• Add optional table with component readouts
• Add optional stop model with a distance unit expressed as ATR or a percent of price
Notes. Backward compatibility Yes. Inputs migrated Yes.

G. Santostasi Bitcoin Power Law StrategyG. Santostasi Bitcoin Power Law Strategy
Overview
The "G. Santostasi Bitcoin Power Law Strategy" is a TradingView strategy script built upon the foundational Bitcoin Power Law Theory by physicist Giovanni Santostasi.
Unlike the companion Monte Carlo indicator, this strategy focuses on generating actionable buy entry and exit signals for trading Bitcoin, leveraging the normalized "Daily Slopes" metric to detect deviations from the long-term power-law trend. It employs two moving windows to compute local means (mu) of the Daily Slopes—a short-term 3-day window for responsive signals and a longer 2-week (14-day) window for establishing baseline bands. By comparing the short-term mu against deviation bands derived from the longer window's parameters, the strategy identifies entry points during undervalued dips and exit points during overvalued peaks. This approach capitalizes on Bitcoin's scale-invariant behavior, where price follows a power law
P(t)= c t^n, with n~5.9.
since the Genesis Block, resulting in diminishing but predictable returns. Backtested over Bitcoin's full history, the strategy boasts a 77% winning rate and a profit factor of 3.2, making it a robust tool for trend-following with mean-reversion elements. It emphasizes Bitcoin's long-term stability while navigating short-term oscillations, treating cycles as temporary deviations from the core power-law "DNA.
"Core Concept: Daily Slopes
The strategy inherits the Daily Slopes metric from the power-law framework, which normalizes daily logarithmic returns to reveal a stable local slope that oscillates around the global value of ~5.9.Definition and Calculation:
Daily log returns: log(P2/P1)\, where P2 and P1 are consecutive closing prices.
Normalization: Divide by log((t+1)/t), where ( t ) is days since the Genesis Block, yielding:
Daily Slope=log(P2/P1)log((t+1)/t).
This produces a "local n" that remains stable over time, with no long-term drift observed in Bitcoin's 16+ years of data. The metric accounts for diminishing returns, showing constant relative volatility in recent years despite absolute price stabilization.
Distribution and Parameters:
Daily Slopes are fitted to a t-location scale distribution over moving windows, estimating:μ (mu): The location/mean, stable around 5.9 globally.
σ (sigma): Scale/volatility measure.
ν (nu): Degrees of freedom for tail heaviness.
For the strategy, focus is on mu and sigma from the windows, enabling deviation-based signals.
Strategy Logic: Dual Moving Window Mus and Deviation Bands
The strategy computes two mus via rolling fits to the t-distribution:
Short Window mu (3 days): A fast-moving average of Daily Slopes, sensitive to immediate price action for timely signals.
Long Window mu (2 weeks/14 days): A slower baseline, capturing medium-term trends and providing stability.
Deviation bands are derived from the long window's mu and sigma:
Upper Band: Long mu + Long sigma
Lower Band: Long mu - Long sigma
These bands represent 1-standard-deviation ranges around the longer-term mean, highlighting overbought and oversold conditions relative to the power-law trend. The short mu acts as a "signal line," crossing the bands to trigger trades.
Plotting:
Short mu: Responsive line for crossovers.
Long mu: Central baseline.
Bands: Upper (+σ) and lower (-σ) lines from the long window.
Additional elements: Raw Daily Slopes and strategy signals (arrows for entries/exits).
Entry and Exit Rules:
The strategy generates long-only signals (buy/sell) based on crossovers, assuming a single-position approach without leverage or shorting:
Buy Entry: Triggered when the short-window mu crosses above the lower band (long mu - long sigma). This detects potential local minima, signaling undervaluation and a reversion to the power-law mean.
Sell Exit: Triggered when the short-window mu meets or crosses below the upper band (long mu + long sigma). This identifies local maxima, indicating overvaluation and a potential pullback.
Trade Management:
No stop-loss or take-profit hardcoded; users can add via TradingView settings.
Positions close on exit signals, with re-entry on the next valid buy.
Filters for false signals: Optional confirmation from global slope (e.g., only trade if long mu > 5.0) to align with bullish regimes.
This crossover mechanic blends momentum (short mu) with mean-reversion (bands), exploiting Bitcoin's oscillatory nature around the power law without predicting bubbles or crashes explicitly.
Performance Metrics:
Backtested on BTCUSD daily data from the Genesis Block to present (assuming continuous updates):Winning Rate: 77% – A high hit rate due to the strategy's focus on statistically stable deviations.
Profit Factor: 3.2 – Gross profits are 3.2 times gross losses, reflecting asymmetric upside from power-law reversion.
Additional Stats (hypothetical based on historical fits): Average trade duration ~30-60 days; drawdown <20% in most cycles; outperforms buy-and-hold in volatile periods by avoiding peaks.
Caveats: Past performance is not indicative of future results. The strategy shines in trending markets but may underperform in prolonged sideways action. Transaction costs (e.g., fees, slippage) not included in base metrics.
Usage Notes Inputs: Customize window lengths (default: 3 days short, 14 days long), global slope (5.9), and signal thresholds. Enable alerts for entries/exits.
Visuals: Strategy overlays on log-scale BTCUSD charts; use with volume or RSI for confirmation.
Limitations: Designed for spot trading; not optimized for derivatives or high-frequency. Assumes power-law persistence—major regime shifts (e.g., adoption plateaus) could impact efficacy.
Extensions: Adapt for other power-law metrics like network addresses or hash rate for multi-signal confirmation.
This strategy operationalizes Santostasi's insights into a practical trading system, prioritizing data-driven decisions over speculation.

Hazel nut BB Strategy, volume base- lite versionHazel nut BB Strategy, volume base — lite version
Having knowledge and information in financial markets is only useful when a trader operates with a well-defined trading strategy. Trading strategies assist in capital management, profit-taking, and reducing potential losses.
This strategy is built upon the core principle of supply and demand dynamics. Alongside this foundation, one of the widely used technical tools — the Bollinger Bands — is employed to structure a framework for profit management and risk control.
In this strategy, the interaction of these tools is explained in detail. A key point to note is that for calculating buy and sell volumes, a lower timeframe function is used. When applied with a tick-level resolution, this provides the most precise measurement of buyer/seller flows. However, this comes with a limitation of reduced historical depth. Users should be aware of this trade-off: if precise tick-level data is required, shorter timeframes should be considered to extend historical coverage .
The strategy offers multiple configuration options. Nevertheless, it should be treated strictly as a supportive tool rather than a standalone trading system. Decisions must integrate personal analysis and other instruments. For example, in highly volatile assets with narrow ranges, it is recommended to adjust profit-taking and stop-loss percentages to smaller values.
◉ Volume Settings
• Buyer and seller volume (up/down volume) are requested from a lower timeframe, with an option to override the automatic resolution.
• A global lookback period is applied to calculate moving averages and cumulative sums of buy/sell/delta volumes.
• Ratios of buyers/sellers to total volume are derived both on the current bar and across the lookback window.
◉ Bollinger Band
• Bands are computed using configurable moving averages (SMA, EMA, RMA, WMA, VWMA).
• Inputs allow control of length, standard deviation multiplier, and offset.
• The basis, upper, and lower bands are plotted, with a shaded background between them.
◉ Progress & Proximity
• Relative position of the price to the Bollinger basis is expressed as percentages (qPlus/qMinus).
• “Near band” conditions are triggered when price progress toward the upper or lower band exceeds a user-defined threshold (%).
• A signed score (sScore) represents how far the close has moved above or below the basis relative to band width.
◉ Info Table
• Optional compact table summarizing:
• - Upper/lower band margins
• - Buyer/seller volumes with moving averages
• - Delta and cumulative delta
• - Buyer/seller ratios per bar and across the window
• - Money flow values (buy/sell/delta × price) for bar-level and summed periods
• The table is neutral-colored and resizable for different chart layouts.
◉ Zone Event Gate
• Tracks entry into and exit from “near band” zones.
• Arming logic: a side is armed when price enters a band proximity zone.
• Trigger logic: on exit, a trade event is generated if cumulative buyer or seller volume dominates over a configurable window.
◉ Trading Logic
• Orders are placed only on zone-exit events, conditional on volume dominance.
• Position sizing is defined as a fixed percentage of strategy equity.
• Long entries occur when leaving the lower zone with buyer dominance; short entries occur when leaving the upper zone with seller dominance.
◉ Exit Rules
• Open positions are managed by a strict priority sequence:
• 1. Stop-loss (% of entry price)
• 2. Take-profit (% of entry price)
• 3. Opposite-side event (zone exit with dominance in the other direction)
• Stop-loss and take-profit levels are configurable
◉ Notes
• This lite version is intended to demonstrate the interaction of Bollinger Bands and volume-based dominance logic.
• It provides a framework to observe how price reacts at band boundaries under varying buy/sell pressure, and how zone exits can be systematically converted into entry/exit signals.
When configuring this strategy, it is essential to carefully review the settings within the Strategy Tester. Ensure that the chosen parameters and historical data options are correctly aligned with the intended use. Accurate back testing depends on applying proper configurations for historical reference. The figure below illustrates sample result and configuration type.

QZ Trend (Crypto Edition) v1.1a: Donchian, EMA, ATR, Liquidity/FThe "QZ Trend (Crypto Edition)" is a rules-based trend-following breakout strategy for crypto spot or perpetual contracts, focusing on following trends, prioritizing risk control, seeking small losses and big wins, and trading only when advantageous.
Key mechanisms include:
- Market filters: Screen favorable conditions via ADX (trend strength), dollar volume (liquidity), funding fee windows, session/weekend restrictions, and spot-long-only settings.
- Signals & entries: Based on price position relative to EMA and EMA trends, combined with breaking Donchian channel extremes (with ATR ratio confirmation), plus single-position rules and post-exit cooldowns.
- Position sizing: Calculate positions by fixed risk percentage; initial stop-loss is ATR-based, complying with exchange min/max lot requirements.
- Exits & risk management: Include initial stop-loss, trailing stop (tightens only), break-even rule (stop moves to entry when target floating profit is hit), time-based exit, and post-exit cooldowns.
- Pyramiding: Add positions only when profitable with favorable momentum, requiring ATR-based spacing; add size is a fraction of the base position, with layers sharing stop logic but having unique order IDs.
Charts display EMA, Donchian channels, current stop lines, and highlight low ADX, avoidable funding windows, and low-liquidity periods.
Recommend starting with 4H or 1D timeframes, with typical parameters varying by cycle. Liquidity settings differ by token; perpetuals should enable funding window filters, while spot requires "long-only" and matching fees. The strategy performs well in trends with quick stop-losses but faces whipsaws in ranges (filters mitigate but don’t eliminate noise). Share your symbol and timeframe for tailored parameters.

Optimized ADX DI CCI Strategy### Key Features:
- Combines ADX, DI+/-, CCI, and RSI for signal generation.
- Supports customizable timeframes for indicators.
- Offers multiple exit conditions (Moving Average cross, ADX change, performance-based stop-loss).
- Tracks and displays trade statistics (e.g., win rate, capital growth, profit factor).
- Visualizes trades with labels and optional background coloring.
- Allows countertrading (opening an opposite trade after closing one).
1. **Indicator Calculation**:
- **ADX and DI+/-**: Calculated using the `ta.dmi` function with user-defined lengths for DI and ADX smoothing.
- **CCI**: Computed using the `ta.cci` function with a configurable source (default: `hlc3`) and length.
- **RSI (optional)**: Calculated using the `ta.rsi` function to filter overbought/oversold conditions.
- **Moving Averages**: Used for CCI signal smoothing and trade exits, with support for SMA, EMA, SMMA (RMA), WMA, and VWMA.
2. **Signal Generation**:
- **Buy Signal**: Triggered when DI+ > DI- (or DI+ crosses over DI-), CCI > MA (or CCI crosses over MA), and optional ADX/RSI filters are satisfied.
- **Sell Signal**: Triggered when DI+ < DI- (or DI- crosses over DI+), CCI < MA (or CCI crosses under MA), and optional ADX/RSI filters are satisfied.
3. **Trade Execution**:
- **Entry**: Long or short trades are opened using `strategy.entry` when signals are detected, provided trading is allowed (`allow_long`/`allow_short`) and equity is positive.
- **Exit**: Trades can be closed based on:
- Opposite signal (if no other exit conditions are used).
- MA cross (price crossing below/above the exit MA for long/short trades).
- ADX percentage change exceeding a threshold.
- Performance-based stop-loss (trade loss exceeding a percentage).
- **Countertrading**: If enabled, closing a trade triggers an opposite trade (e.g., closing a long opens a short).
4. **Visualization**:
- Labels are plotted at trade entries/exits (e.g., "BUY," "SELL," arrows).
- Optional background coloring highlights open trades (green for long, red for short).
- A statistics table displays real-time metrics (e.g., capital, win rates).
5. **Trade Tracking**:
- Tracks the number of long/short trades, wins, and overall performance.
- Monitors equity to prevent trading if it falls to zero.
### 2.3 Key Components
- **Indicator Calculations**: Uses `request.security` to fetch indicator data for the specified timeframe.
- **MA Function**: A custom `ma_func` handles different MA types for CCI and exit conditions.
- **Signal Logic**: Combines crossover/under checks with recent bar windows for flexibility.
- **Exit Conditions**: Multiple configurable exit strategies for risk management.
- **Statistics Table**: Updates dynamically with trade and capital metrics.
## 3. Configuration Options
The script provides extensive customization through input parameters, grouped for clarity in the TradingView settings panel. Below is a detailed breakdown of each setting and its impact.
### 3.1 Strategy Settings (Global)
- **Initial Capital**: Default `10000`. Sets the starting capital for backtesting.
- **Effect**: Determines the base equity for calculating position sizes and performance metrics.
- **Default Quantity Type**: `strategy.percent_of_equity` (50% of equity).
- **Effect**: Controls the size of each trade as a percentage of available equity.
- **Pyramiding**: Default `2`. Allows up to 2 simultaneous trades in the same direction.
- **Effect**: Enables multiple entries if conditions are met, increasing exposure.
- **Commission**: 0.2% per trade.
- **Effect**: Simulates trading fees, reducing net profit in backtesting.
- **Margin**: 100% for long and short trades.
- **Effect**: Assumes no leverage; adjust for margin trading simulations.
- **Calc on Every Tick**: `true`.
- **Effect**: Ensures real-time signal updates for precise execution.
### 3.2 Indicator Settings
- **Indicator Timeframe** (`indicator_timeframe`):
- **Options**: `""` (chart timeframe), `1`, `5`, `15`, `30`, `60`, `240`, `D`, `W`.
- **Default**: `""` (uses chart timeframe).
- **Effect**: Determines the timeframe for ADX, DI, CCI, and RSI calculations. A higher timeframe reduces noise but may delay signals.
### 3.3 ADX & DI Settings
- **DI Length** (`adx_di_len`):
- **Default**: `30`.
- **Range**: Minimum `1`.
- **Effect**: Sets the period for calculating DI+ and DI-. Longer periods smooth trends but reduce sensitivity.
- **ADX Smoothing Length** (`adx_smooth_len`):
- **Default**: `14`.
- **Range**: Minimum `1`.
- **Effect**: Smooths the ADX calculation. Longer periods produce smoother ADX values.
- **Use ADX Filter** (`use_adx_filter`):
- **Default**: `false`.
- **Effect**: If `true`, requires ADX to exceed the threshold for signals to be valid, filtering out weak trends.
- **ADX Threshold** (`adx_threshold`):
- **Default**: `25`.
- **Range**: Minimum `0`.
- **Effect**: Sets the minimum ADX value for valid signals when the filter is enabled. Higher values restrict trades to stronger trends.
### 3.4 CCI Settings
- **CCI Length** (`cci_length`):
- **Default**: `20`.
- **Range**: Minimum `1`.
- **Effect**: Sets the period for CCI calculation. Longer periods reduce noise but may lag.
- **CCI Source** (`cci_src`):
- **Default**: `hlc3` (average of high, low, close).
- **Effect**: Defines the price data for CCI. `hlc3` is standard, but users can choose other sources (e.g., `close`).
- **CCI MA Type** (`ma_type`):
- **Options**: `SMA`, `EMA`, `SMMA (RMA)`, `WMA`, `VWMA`.
- **Default**: `SMA`.
- **Effect**: Determines the moving average type for CCI signal smoothing. EMA is more responsive; VWMA weights by volume.
- **CCI MA Length** (`ma_length`):
- **Default**: `14`.
- **Range**: Minimum `1`.
- **Effect**: Sets the period for the CCI MA. Longer periods smooth the MA but may delay signals.
### 3.5 RSI Filter Settings
- **Use RSI Filter** (`use_rsi_filter`):
- **Default**: `false`.
- **Effect**: If `true`, applies RSI-based overbought/oversold filters to signals.
- **RSI Length** (`rsi_length`):
- **Default**: `14`.
- **Range**: Minimum `1`.
- **Effect**: Sets the period for RSI calculation. Longer periods reduce sensitivity.
- **RSI Lower Limit** (`rsi_lower_limit`):
- **Default**: `30`.
- **Range**: `0` to `100`.
- **Effect**: Defines the oversold threshold for buy signals. Lower values allow trades in more extreme conditions.
- **RSI Upper Limit** (`rsi_upper_limit`):
- **Default**: `70`.
- **Range**: `0` to `100`.
- **Effect**: Defines the overbought threshold for sell signals. Higher values allow trades in more extreme conditions.
### 3.6 Signal Settings
- **Cross Window** (`cross_window`):
- **Default**: `0`.
- **Range**: `0` to `5` bars.
- **Effect**: Specifies the lookback period for detecting DI+/- or CCI crosses. `0` requires crosses on the current bar; higher values allow recent crosses, increasing signal frequency.
- **Allow Long Trades** (`allow_long`):
- **Default**: `true`.
- **Effect**: Enables/disables new long trades. If `false`, only closing existing longs is allowed.
- **Allow Short Trades** (`allow_short`):
- **Default**: `true`.
- **Effect**: Enables/disables new short trades. If `false`, only closing existing shorts is allowed.
- **Require DI+/DI- Cross for Buy** (`buy_di_cross`):
- **Default**: `true`.
- **Effect**: If `true`, requires a DI+ crossover DI- for buy signals; if `false`, DI+ > DI- is sufficient.
- **Require CCI Cross for Buy** (`buy_cci_cross`):
- **Default**: `true`.
- **Effect**: If `true`, requires a CCI crossover MA for buy signals; if `false`, CCI > MA is sufficient.
- **Require DI+/DI- Cross for Sell** (`sell_di_cross`):
- **Default**: `true`.
- **Effect**: If `true`, requires a DI- crossover DI+ for sell signals; if `false`, DI+ < DI- is sufficient.
- **Require CCI Cross for Sell** (`sell_cci_cross`):
- **Default**: `true`.
- **Effect**: If `true`, requires a CCI crossunder MA for sell signals; if `false`, CCI < MA is sufficient.
- **Countertrade** (`countertrade`):
- **Default**: `true`.
- **Effect**: If `true`, closing a trade triggers an opposite trade (e.g., close long, open short) if allowed.
- **Color Background for Open Trades** (`color_background`):
- **Default**: `true`.
- **Effect**: If `true`, colors the chart background green for long trades and red for short trades.
### 3.7 Exit Settings
- **Use MA Cross for Exit** (`use_ma_exit`):
- **Default**: `true`.
- **Effect**: If `true`, closes trades when the price crosses the exit MA (below for long, above for short).
- **MA Length for Exit** (`ma_exit_length`):
- **Default**: `20`.
- **Range**: Minimum `1`.
- **Effect**: Sets the period for the exit MA. Longer periods delay exits.
- **MA Type for Exit** (`ma_exit_type`):
- **Options**: `SMA`, `EMA`, `SMMA (RMA)`, `WMA`, `VWMA`.
- **Default**: `SMA`.
- **Effect**: Determines the MA type for exit signals. EMA is more responsive; VWMA weights by volume.
- **Use ADX Change Stop-Loss** (`use_adx_stop`):
- **Default**: `false`.
- **Effect**: If `true`, closes trades when the ADX changes by a specified percentage.
- **ADX % Change for Stop-Loss** (`adx_change_percent`):
- **Default**: `5.0`.
- **Range**: Minimum `0.0`, step `0.1`.
- **Effect**: Specifies the percentage change in ADX (vs. previous bar) that triggers a stop-loss. Higher values reduce premature exits.
- **Use Performance Stop-Loss** (`use_perf_stop`):
- **Default**: `false`.
- **Effect**: If `true`, closes trades when the loss exceeds a percentage threshold.
- **Performance Stop-Loss (%)** (`perf_stop_percent`):
- **Default**: `-10.0`.
- **Range**: `-100.0` to `0.0`, step `0.1`.
- **Effect**: Specifies the loss percentage that triggers a stop-loss. More negative values allow larger losses before exiting.
## 4. Visual and Statistical Output
- **Labels**: Displayed at trade entries/exits with arrows (↑ for buy, ↓ for sell) and text ("BUY," "SELL"). A "No Equity" label appears if equity is zero.
- **Background Coloring**: Optionally colors the chart background (green for long, red for short) to indicate open trades.
- **Statistics Table**: Displayed at the top center of the chart, updated on timeframe changes or trade events. Includes:
- **Capital Metrics**: Initial capital, current capital, capital growth (%).
- **Trade Metrics**: Total trades, long/short trades, win rate, long/short win rates, profit factor.
- **Open Trade Status**: Indicates if a long, short, or no trade is open.
## 5. Alerts
- **Buy Signal Alert**: Triggered when `buy_signal` is true ("Cross Buy Signal").
- **Sell Signal Alert**: Triggered when `sell_signal` is true ("Cross Sell Signal").
- **Usage**: Users can set up TradingView alerts to receive notifications for trade signals.

ORB Strategy W/ Confluence This is an Opening Range Breakout (ORB) strategy designed for intraday trading on futures or indices (e.g., MNQ, MES, ES). It identifies the opening range (default 30-minute session from 9:30-10:00 ET) and enters long on a bullish breakout above the range high (ORH) or short below the range low (ORL), with optional daily bias filtering. Targets are set as multiples of the range width (default 50% per level), with partial profit-taking at each hit level. Stop-loss is dynamically set based on a factor of the range width (default 1.0x full range). Optional confluence filters (RSI >70 for long/<30 for short, price above/below 200 EMA, Williams Vix Fix above/below 0.3, or following previous day's close color) can be enabled for entry confirmation. Position sizing is fixed (default 10 contracts), with an option to double after a losing day. Entries are restricted to a user-defined session (default 8:00-17:00), and all positions close at a specified time (default 16:00 ET) to comply with prop firm rules.
Key Parameters to Test:
Instrument/Timeframe: Test on 5-min or 1-min charts for MNQ/MES/ES futures (e.g., tick value 0.5 for MNQ, 1.25 for MES).
Core Settings: OR timeframe=30m, Target %=50, SL Factor=1.0, TP % Remaining=20 (for partial closes). Enable/disable bias ("Daily Bias" for conservative entries).
Filters: Start with all off; test enabling RSI (len=14, level=50, offset=20), EMA (len=200), WVF (period=22, thresh=0.3), and Prev Day Trend individually/combined to see impact on win rate/false signals.
Risk/Sizing: Fixed contracts=10; test double sizing after loss. For risk-based sizing, adjust to use equity risk % (e.g., 1%) and tick value.
Time Rules: Entry session=0800-1700, Exit=16:00; test on NY session data.
Expected Behavior & Test Focus:
Entry Logic: Long signal on close crossover ORH (or ORH + target1 if bearish bias); short on crossunder ORL. Expect 1-2 trades per day, filtered by confluence to reduce whipsaws.
Exits: SL at ORL - factor*range for long (vice versa for short); partial TP at each target level (e.g., 20% of position at T1, reducing thereafter). Full close at 4 PM if open.
Backtest Metrics: Aim for >50% win rate, positive expectancy over 1-2 years (e.g., 2023-2025 NY session data). Monitor drawdown (<10%), profit factor (>1.5), and Sharpe ratio. Test sensitivity to volatility (e.g., high-vol days may hit more targets but risk larger SL). Visuals: OR box, dashed targets/SL lines, signals (▲/▼).
Edge Cases: Test on low-vol days (tight range, fewer breakouts); gaps; after news events. Ensure no over-entries (pyramiding=0) and daily reset works.
This setup emphasizes disciplined intraday breakouts with risk control—backtest on historical data to validate profitability before live use.

Adaptive ATR Guardian [自适应 ATR 守护者]自适应ATR守护者 | Adaptive ATR Guardian
——多品种智能交易防护策略 | Multi-Asset Intelligent Trading Protection Strategy
核心功能 | Core Features
1. 自动识别交易品种| Automatic Asset Detection
• 智能识别BTC/USD、XAU/USD等品种
• Auto-detects assets (e.g., BTC/USD, XAU/USD)
• 动态调整参数:ATR倍数、止盈止损比例
• Dynamic parameter tuning (ATR multipliers, TP/SL ratios)
2. 自适应ATR风控 | Adaptive ATR Risk Control
• 基于真实波动率(ATR)动态计算止盈止损
• TP/SL levels adjust with ATR volatility
• 参数自动优化:BTC(3xTP/1.5xSL) ,黄金(2xTP/1xSL)
• Auto-optimized: BTC (3xTP/1.5xSL), Gold (2xTP/1xSL)
3. 实时动态跟踪 | Real-Time Tracking
• 持仓期间止盈止损线实时更新
• Live TP/SL line updates during trades
• 可视化提示:绿色止盈线、红色止损线
• Visual cues: Green TP line, Red SL line
4. 趋势跟随逻辑 | Trend-Following Logic
• 双均线交叉(9MA & 21MA)触发信号
• Dual MA crossover (9MA & 21MA) for entries
• 金叉做多 / 死叉做空
• Long on Golden Cross, Short on Death Cross
5. 专业可视化界面 | Professional Visualization
• 图表标签显示关键参数
• On-chart label shows settings
• 自适应K线范围展示所有标记
• Auto-adjusts plot ranges for clarity

Keltner Channel Based Grid Strategy # KC Grid Strategy - Keltner Channel Based Grid Trading System
## Strategy Overview
KC Grid Strategy is an innovative grid trading system that combines the power of Keltner Channels with dynamic position sizing to create a mean-reversion trading approach. This strategy automatically adjusts position sizes based on price deviation from the Keltner Channel center line, implementing a systematic grid-based approach that capitalizes on market volatility and price oscillations.
## Core Principles
### Keltner Channel Foundation
The strategy builds upon the Keltner Channel indicator, which consists of:
- **Center Line**: Moving average (EMA or SMA) of the price
- **Upper Band**: Center line + (ATR/TR/Range × Multiplier)
- **Lower Band**: Center line - (ATR/TR/Range × Multiplier)
### Grid Trading Logic
The strategy implements a sophisticated grid system where:
1. **Position Direction**: Inversely correlated to price position within the channel
- When price is above center line → Short positions
- When price is below center line → Long positions
2. **Position Size**: Proportional to distance from center line
- Greater deviation = Larger position size
3. **Grid Activation**: Positions are adjusted only when the difference exceeds a predefined grid threshold
### Mathematical Foundation
The core calculation uses the KC Rate formula:
```
kcRate = (close - ma) / bandWidth
targetPosition = kcRate × maxAmount × (-1)
```
This creates a mean-reversion system where positions increase as price moves further from the mean, expecting eventual return to equilibrium.
## Parameter Guide
### Time Range Settings
- **Start Date**: Beginning of strategy execution period
- **End Date**: End of strategy execution period
### Core Parameters
1. **Number of Grids (NumGrid)**: Default 12
- Controls grid sensitivity and position adjustment frequency
- Higher values = More frequent but smaller adjustments
- Lower values = Less frequent but larger adjustments
2. **Length**: Default 10
- Period for moving average and volatility calculations
- Shorter periods = More responsive to recent price action
- Longer periods = Smoother, less noisy signals
3. **Grid Coefficient (kcRateMult)**: Default 1.33
- Multiplier for channel width calculation
- Higher values = Wider channels, less frequent trades
- Lower values = Narrower channels, more frequent trades
4. **Source**: Default Close
- Price source for calculations (Close, Open, High, Low, etc.)
- Close price typically provides most reliable signals
5. **Use Exponential MA**: Default True
- True = Uses EMA (more responsive to recent prices)
- False = Uses SMA (equal weight to all periods)
6. **Bands Style**: Default "Average True Range"
- **Average True Range**: Smoothed volatility measure (recommended)
- **True Range**: Current bar's volatility only
- **Range**: Simple high-low difference
## How to Use
### Setup Instructions
1. **Apply to Chart**: Add the strategy to your desired timeframe and instrument
2. **Configure Parameters**: Adjust settings based on market characteristics:
- Volatile markets: Increase Grid Coefficient, reduce Number of Grids
- Stable markets: Decrease Grid Coefficient, increase Number of Grids
3. **Set Time Range**: Define your backtesting or live trading period
4. **Monitor Performance**: Watch strategy performance metrics and adjust as needed
### Optimal Market Conditions
- **Range-bound markets**: Strategy performs best in sideways trending markets
- **High volatility**: Benefits from frequent price oscillations around the mean
- **Liquid instruments**: Ensures efficient order execution and minimal slippage
### Position Management
The strategy automatically:
- Calculates optimal position sizes based on account equity
- Adjusts positions incrementally as price moves through grid levels
- Maintains risk control through maximum position limits
- Executes trades only during specified time periods
## Risk Warnings
### ⚠️ Important Risk Considerations
1. **Trending Market Risk**:
- Strategy may underperform or generate losses in strong trending markets
- Mean-reversion assumption may fail during sustained directional moves
- Consider market regime analysis before deployment
2. **Leverage and Position Size Risk**:
- Strategy uses pyramiding (up to 20 positions)
- Large positions may accumulate during extended moves
- Monitor account equity and margin requirements closely
3. **Volatility Risk**:
- Sudden volatility spikes may trigger multiple rapid position adjustments
- Consider volatility filters during high-impact news events
- Backtest across different volatility regimes
4. **Execution Risk**:
- Strategy calculates on every tick (calc_on_every_tick = true)
- May generate frequent orders in volatile conditions
- Ensure adequate execution infrastructure and consider transaction costs
5. **Parameter Sensitivity**:
- Performance highly dependent on parameter optimization
- Over-optimization may lead to curve-fitting
- Regular parameter review and adjustment may be necessary
## Suitable Scenarios
### Ideal Market Conditions
- **Sideways/Range-bound markets**: Primary use case
- **Mean-reverting instruments**: Forex pairs, some commodities
- **Stable volatility environments**: Consistent ATR patterns
- **Liquid markets**: Major currency pairs, popular stocks/indices
## Important Notes
### Strategy Limitations
1. **No Stop Loss**: Strategy relies on mean reversion without traditional stop losses
2. **Capital Requirements**: Requires sufficient capital for grid-based position sizing
3. **Market Regime Dependency**: Performance varies significantly across different market conditions
## Disclaimer
This strategy is provided for educational and research purposes only. Past performance does not guarantee future results. Trading involves substantial risk of loss and is not suitable for all investors. Users should thoroughly test the strategy and understand its mechanics before risking real capital. The author assumes no responsibility for trading losses incurred through the use of this strategy.
---
# KC网格策略 - 基于肯特纳通道的网格交易系统
## 策略概述
KC网格策略是一个创新的网格交易系统,它将肯特纳通道的力量与动态仓位调整相结合,创建了一个均值回归交易方法。该策略根据价格偏离肯特纳通道中心线的程度自动调整仓位大小,实施系统化的网格方法,利用市场波动和价格振荡获利。
## 核心原理
### 肯特纳通道基础
该策略建立在肯特纳通道指标之上,包含:
- **中心线**: 价格的移动平均线(EMA或SMA)
- **上轨**: 中心线 + (ATR/TR/Range × 乘数)
- **下轨**: 中心线 - (ATR/TR/Range × 乘数)
### 网格交易逻辑
该策略实施复杂的网格系统:
1. **仓位方向**: 与价格在通道中的位置呈反向关系
- 当价格高于中心线时 → 空头仓位
- 当价格低于中心线时 → 多头仓位
2. **仓位大小**: 与距离中心线的距离成正比
- 偏离越大 = 仓位越大
3. **网格激活**: 只有当差异超过预定义的网格阈值时才调整仓位
### 数学基础
核心计算使用KC比率公式:
```
kcRate = (close - ma) / bandWidth
targetPosition = kcRate × maxAmount × (-1)
```
这创建了一个均值回归系统,当价格偏离均值越远时仓位越大,期望最终回归均衡。
## 参数说明
### 时间范围设置
- **开始日期**: 策略执行期间的开始时间
- **结束日期**: 策略执行期间的结束时间
### 核心参数
1. **网格数量 (NumGrid)**: 默认12
- 控制网格敏感度和仓位调整频率
- 较高值 = 更频繁但较小的调整
- 较低值 = 较少频繁但较大的调整
2. **长度**: 默认10
- 移动平均线和波动率计算的周期
- 较短周期 = 对近期价格行为更敏感
- 较长周期 = 更平滑,噪音更少的信号
3. **网格系数 (kcRateMult)**: 默认1.33
- 通道宽度计算的乘数
- 较高值 = 更宽的通道,较少频繁的交易
- 较低值 = 更窄的通道,更频繁的交易
4. **数据源**: 默认收盘价
- 计算的价格来源(收盘价、开盘价、最高价、最低价等)
- 收盘价通常提供最可靠的信号
5. **使用指数移动平均**: 默认True
- True = 使用EMA(对近期价格更敏感)
- False = 使用SMA(对所有周期等权重)
6. **通道样式**: 默认"平均真实范围"
- **平均真实范围**: 平滑的波动率测量(推荐)
- **真实范围**: 仅当前K线的波动率
- **范围**: 简单的高低价差
## 使用方法
### 设置说明
1. **应用到图表**: 将策略添加到您所需的时间框架和交易品种
2. **配置参数**: 根据市场特征调整设置:
- 波动市场:增加网格系数,减少网格数量
- 稳定市场:减少网格系数,增加网格数量
3. **设置时间范围**: 定义您的回测或实盘交易期间
4. **监控表现**: 观察策略表现指标并根据需要调整
### 最佳市场条件
- **区间震荡市场**: 策略在横盘趋势市场中表现最佳
- **高波动性**: 受益于围绕均值的频繁价格振荡
- **流动性强的品种**: 确保高效的订单执行和最小滑点
### 仓位管理
策略自动:
- 根据账户权益计算最优仓位大小
- 随着价格在网格水平移动逐步调整仓位
- 通过最大仓位限制维持风险控制
- 仅在指定时间段内执行交易
## 风险警示
### ⚠️ 重要风险考虑
1. **趋势市场风险**:
- 策略在强趋势市场中可能表现不佳或产生损失
- 在持续方向性移动期间均值回归假设可能失效
- 部署前考虑市场制度分析
2. **杠杆和仓位大小风险**:
- 策略使用金字塔加仓(最多20个仓位)
- 在延长移动期间可能积累大仓位
- 密切监控账户权益和保证金要求
3. **波动性风险**:
- 突然的波动性激增可能触发多次快速仓位调整
- 在高影响新闻事件期间考虑波动性过滤器
- 在不同波动性制度下进行回测
4. **执行风险**:
- 策略在每个tick上计算(calc_on_every_tick = true)
- 在波动条件下可能产生频繁订单
- 确保充足的执行基础设施并考虑交易成本
5. **参数敏感性**:
- 表现高度依赖于参数优化
- 过度优化可能导致曲线拟合
- 可能需要定期参数审查和调整
## 适用场景
### 理想市场条件
- **横盘/区间震荡市场**: 主要用例
- **均值回归品种**: 外汇对,某些商品
- **稳定波动性环境**: 一致的ATR模式
- **流动性市场**: 主要货币对,热门股票/指数
## 注意事项
### 策略限制
1. **无止损**: 策略依赖均值回归而无传统止损
2. **资金要求**: 需要充足资金进行基于网格的仓位调整
3. **市场制度依赖性**: 在不同市场条件下表现差异显著
## 免责声明
该策略仅供教育和研究目的。过往表现不保证未来结果。交易涉及重大损失风险,并非适合所有投资者。用户应在投入真实资金前彻底测试策略并理解其机制。作者对使用此策略产生的交易损失不承担任何责任。
---
**Strategy Version**: Pine Script v6
**Author**: Signal2Trade
**Last Updated**: 2025-8-9
**License**: Open Source (Mozilla Public License 2.0)

Buy The Dip - ENGThis script implements a grid trading strategy for long positions in the USDT market. The core idea is to place a series of buy limit orders at progressively lower prices below an initial entry point, aiming to lower the average entry price as the price drops. It then aims to exit the entire position when the price rises a certain percentage above the average entry price.
Here's a detailed breakdown:
1. Strategy Setup (`strategy` function):
`'거미줄 자동매매 250227'`: The name of the strategy.
`overlay = true`: Draws plots and labels directly on the main price chart.
`pyramiding = 15`: Allows up to 15 entries in the same direction (long). This is essential for grid trading, as it needs to open multiple buy orders.
`initial_capital = 600`: Sets the starting capital for backtesting to 600 USDT.
`currency = currency.USDT`: Specifies the account currency as USDT.
`margin_long/short = 0`: Doesn't define specific margin requirements (might imply spot trading logic or rely on exchange defaults if used live).
`calc_on_order_fills = false`: Strategy calculations happen on each bar's close, not just when orders fill.
2. Inputs (`input`):
Core Settings:
`lev`: Leverage (default 10x). Used to calculate position sizes.
`Investment Percentage %`: Percentage of total capital to allocate to the initial grid (default 80%).
`final entry Percentage %`: Percentage of the *remaining* capital (100 - `Investment Percentage %`) to use for the "semifinal" entry (default 50%). The rest goes to the "final" entry.
`Price Adjustment Length`: Lookback period (default 4 bars) to determine the initial `maxPrice`.
`price range`: The total percentage range downwards from `maxPrice` where the grid orders will be placed (default -10%, meaning 10% down).
`tp`: Take profit percentage above the average entry price (default 0.45%).
`semifinal entry price percent`: Percentage drop from `maxPrice` to trigger the "semifinal" larger entry (default -12%).
`final entry price percent`: Percentage drop from `maxPrice` to trigger the "final" larger entry (default -15%).
Rounding & Display:
`roundprice`, `round`: Decimal places for rounding price and quantity calculations.
`texts`, `label_style`: User interface preferences for text size and label appearance on the chart.
Time Filter:
`startTime`, `endTime`: Defines the date range for the backtest.
3. Calculations & Grid Setup:
`maxPrice`: The highest price point for the grid setup. Calculated as the lowest low of the previous `len` bars only if no trades are open. If trades are open, it uses the entry price of the very first order placed in the current sequence (`strategy.opentrades.entry_price(0)`).
`minPrice`: The lowest price point for the grid, calculated based on `maxPrice` and `range1`.
`totalCapital`: The amount of capital (considering leverage and `per1`) allocated for the main grid orders.
`coinRatios`: An array ` `. This defines the *relative* size ratio for each of the 11 grid orders. Later orders (at lower prices) will be progressively larger.
`totalRatio`: The sum of all ratios (66).
`positionSizes`: An array calculated based on `totalCapital` and `coinRatios`. It determines the actual quantity (size) for each of the 11 grid orders.
4. Order Placement Logic (`strategy.entry`):
Initial Grid Orders:
Runs only if within the specified time range and no position is currently open (`strategy.opentrades == 0`).
A loop places 11 limit buy orders (`Buy 1` to `Buy 11`).
Prices are calculated linearly between `maxPrice` and `minPrice`.
Order sizes are taken from the `positionSizes` array.
Semifinal & Final Entries:
Two additional, larger limit buy orders are placed simultaneously with the grid orders:
`semifinal entry`: At `maxPrice * (1 - semifinal / 100)`. Size is based on `per2`% of the capital *not* used by the main grid (`1 - per1`).
`final entry`: At `maxPrice * (1 - final / 100)`. Size is based on the remaining capital (`1 - per2`% of the unused portion).
5. Visualization (`line.new`, `label.new`, `plot`, `plotshape`, `plotchar`):
Grid Lines & Labels:
When a position is open (`strategy.opentrades > 0`), horizontal lines and labels are drawn for each of the 11 grid order prices and the "final" entry price.
Lines extend from the bar where the *first* entry occurred.
Labels show the price and planned size for each level.
Dynamic Coloring: If the price drops below a grid level, the corresponding line turns green, and the label color changes, visually indicating that the level has been reached or filled.
Plotted Lines:
`maxPrice` (initial high point for the grid).
`strategy.position_avg_price` (current average entry price of the open position, shown in red).
Target Profit Price (`strategy.position_avg_price * (1 + tp / 100)`, shown in green).
Markers:
A flag marks the `startTime`.
A rocket icon (`🚀`) appears below the bar where the `final entry` triggers.
A stop icon (`🛑`) appears below the bar where the `semifinal entry` triggers.
6. Exit Logic (`strategy.exit`, `strategy.entry` with `qty=0`):
Main Take Profit (`Full Exit`):
Uses `strategy.entry('Full Exit', strategy.short, qty = 0, limit = target2)`. This places a limit order to close the entire position (`qty=0`) at the calculated take profit level (`target2 = avgPrice * (1 + tp / 100)`). Note: Using `strategy.entry` with `strategy.short` and `qty=0` is a way to close a long position, though `strategy.exit` is often clearer. This exit seems intended to apply whenever any part of the grid position is open.
First Order Trailing Stop (`1st order Full Exit`):
Conditional: Only active if `trail` input is true AND the *last* order filled was "Buy 1" (meaning only the very first grid level was entered).
Uses `strategy.exit` with `trail_points` and `trail_offset` based on ATR values to implement a trailing stop loss/profit mechanism for this specific scenario.
This trailing stop order is cancelled (`strategy.cancel`) if any subsequent grid orders ("Buy 2", etc.) are filled.
Final/Semifinal Take Profit (`final Full Exit`):
Conditional: Only active if more than 11 entries have occurred (meaning either the "semifinal" or "final" entry must have triggered).
Uses `strategy.exit` to place a limit order to close the entire position at the take profit level (`target3 = avgPrice * (1 + tp / 100)`).
7. Information Display (Tables & UI Label):
`statsTable` (Top Right):
A comprehensive table displaying grouped information:
Market Info (Entry Point, Current Price)
Position Info (Avg Price, Target Price, Unrealized PNL $, Unrealized PNL %, Position Size, Position Value)
Strategy Performance (Realized PNL $, Realized PNL %, Initial/Total Balance, MDD, APY, Daily Profit %)
Trade Statistics (Trade Count, Wins/Losses, Win Rate, Cumulative Profit)
`buyAvgTable` (Bottom Left):
* Shows the *theoretical* entry price and average position price if trades were filled sequentially up to each `buy` level (buy1 to buy10). It uses hardcoded percentage drops (`buyper`, `avgper`) based on the initial `maxPrice` and `coinRatios`, not the dynamically changing actual average price.
`uiLabel` (Floating Label on Last Bar):
Updates only on the most recent bar (`barstate.islast`).
Provides real-time context when a position is open: Size, Avg Price, Current Price, Open PNL ($ and %), estimated % drop needed for the *next* theoretical buy (based on `ui_gridStep` input), % rise needed to hit TP, and estimated USDT profit at TP.
Shows "No Position" and basic balance/trade info otherwise.
In Summary:
This is a sophisticated long-only grid trading strategy. It aims to:
1. Define an entry range based on recent lows (`maxPrice`).
2. Place 11 scaled-in limit buy orders within a percentage range below `maxPrice`.
3. Place two additional, larger buy orders at deeper percentage drops (`semifinal`, `final`).
4. Calculate the average entry price as orders fill.
5. Exit the entire position for a small take profit (`tp`) above the average entry price.
6. Offer a conditional ATR trailing stop if only the first order fills.
7. Provide extensive visual feedback through lines, labels, icons, and detailed information tables/UI elements.
Keep in mind that grid strategies can perform well in ranging or slowly trending markets but can incur significant drawdowns if the price trends strongly against the position without sufficient retracements to hit the take profit. The leverage (`lev`) input significantly amplifies both potential profits and losses.

KST Strategy [Skyrexio]Overview
KST Strategy leverages Know Sure Thing (KST) indicator in conjunction with the Williams Alligator and Moving average to obtain the high probability setups. KST is used for for having the high probability to enter in the direction of a current trend when momentum is rising, Alligator is used as a short term trend filter, while Moving average approximates the long term trend and allows trades only in its direction. Also strategy has the additional optional filter on Choppiness Index which does not allow trades if market is choppy, above the user-specified threshold. Strategy has the user specified take profit and stop-loss numbers, but multiplied by Average True Range (ATR) value on the moment when trade is open. The strategy opens only long trades.
Unique Features
ATR based stop-loss and take profit. Instead of fixed take profit and stop-loss percentage strategy utilizes user chosen numbers multiplied by ATR for its calculation.
Configurable Trading Periods. Users can tailor the strategy to specific market windows, adapting to different market conditions.
Optional Choppiness Index filter. Strategy allows to choose if it will use the filter trades with Choppiness Index and set up its threshold.
Methodology
The strategy opens long trade when the following price met the conditions:
Close price is above the Alligator's jaw line
Close price is above the filtering Moving average
KST line of Know Sure Thing indicator shall cross over its signal line (details in justification of methodology)
If the Choppiness Index filter is enabled its value shall be less than user defined threshold
When the long trade is executed algorithm defines the stop-loss level as the low minus user defined number, multiplied by ATR at the trade open candle. Also it defines take profit with close price plus user defined number, multiplied by ATR at the trade open candle. While trade is in progress, if high price on any candle above the calculated take profit level or low price is below the calculated stop loss level, trade is closed.
Strategy settings
In the inputs window user can setup the following strategy settings:
ATR Stop Loss (by default = 1.5, number of ATRs to calculate stop-loss level)
ATR Take Profit (by default = 3.5, number of ATRs to calculate take profit level)
Filter MA Type (by default = Least Squares MA, type of moving average which is used for filter MA)
Filter MA Length (by default = 200, length for filter MA calculation)
Enable Choppiness Index Filter (by default = true, setting to choose the optional filtering using Choppiness index)
Choppiness Index Threshold (by default = 50, Choppiness Index threshold, its value shall be below it to allow trades execution)
Choppiness Index Length (by default = 14, length used in Choppiness index calculation)
KST ROC Length #1 (by default = 10, value used in KST indicator calculation, more information in Justification of Methodology)
KST ROC Length #2 (by default = 15, value used in KST indicator calculation, more information in Justification of Methodology)
KST ROC Length #3 (by default = 20, value used in KST indicator calculation, more information in Justification of Methodology)
KST ROC Length #4 (by default = 30, value used in KST indicator calculation, more information in Justification of Methodology)
KST SMA Length #1 (by default = 10, value used in KST indicator calculation, more information in Justification of Methodology)
KST SMA Length #2 (by default = 10, value used in KST indicator calculation, more information in Justification of Methodology)
KST SMA Length #3 (by default = 10, value used in KST indicator calculation, more information in Justification of Methodology)
KST SMA Length #4 (by default = 15, value used in KST indicator calculation, more information in Justification of Methodology)
KST Signal Line Length (by default = 10, value used in KST indicator calculation, more information in Justification of Methodology)
User can choose the optimal parameters during backtesting on certain price chart.
Justification of Methodology
Before understanding why this particular combination of indicator has been chosen let's briefly explain what is KST, Williams Alligator, Moving Average, ATR and Choppiness Index.
The KST (Know Sure Thing) is a momentum oscillator developed by Martin Pring. It combines multiple Rate of Change (ROC) values, smoothed over different timeframes, to identify trend direction and momentum strength. First of all, what is ROC? ROC (Rate of Change) is a momentum indicator that measures the percentage change in price between the current price and the price a set number of periods ago.
ROC = 100 * (Current Price - Price N Periods Ago) / Price N Periods Ago
In our case N is the KST ROC Length inputs from settings, here we will calculate 4 different ROCs to obtain KST value:
KST = ROC1_smooth × 1 + ROC2_smooth × 2 + ROC3_smooth × 3 + ROC4_smooth × 4
ROC1 = ROC(close, KST ROC Length #1), smoothed by KST SMA Length #1,
ROC2 = ROC(close, KST ROC Length #2), smoothed by KST SMA Length #2,
ROC3 = ROC(close, KST ROC Length #3), smoothed by KST SMA Length #3,
ROC4 = ROC(close, KST ROC Length #4), smoothed by KST SMA Length #4
Also for this indicator the signal line is calculated:
Signal = SMA(KST, KST Signal Line Length)
When the KST line rises, it indicates increasing momentum and suggests that an upward trend may be developing. Conversely, when the KST line declines, it reflects weakening momentum and a potential downward trend. A crossover of the KST line above its signal line is considered a buy signal, while a crossover below the signal line is viewed as a sell signal. If the KST stays above zero, it indicates overall bullish momentum; if it remains below zero, it points to bearish momentum. The KST indicator smooths momentum across multiple timeframes, helping to reduce noise and provide clearer signals for medium- to long-term trends.
Next, let’s discuss the short-term trend filter, which combines the Williams Alligator and Williams Fractals. Williams Alligator
Developed by Bill Williams, the Alligator is a technical indicator that identifies trends and potential market reversals. It consists of three smoothed moving averages:
Jaw (Blue Line): The slowest of the three, based on a 13-period smoothed moving average shifted 8 bars ahead.
Teeth (Red Line): The medium-speed line, derived from an 8-period smoothed moving average shifted 5 bars forward.
Lips (Green Line): The fastest line, calculated using a 5-period smoothed moving average shifted 3 bars forward.
When the lines diverge and align in order, the "Alligator" is "awake," signaling a strong trend. When the lines overlap or intertwine, the "Alligator" is "asleep," indicating a range-bound or sideways market. This indicator helps traders determine when to enter or avoid trades.
The next indicator is Moving Average. It has a lot of different types which can be chosen to filter trades and the Least Squares MA is used by default settings. Let's briefly explain what is it.
The Least Squares Moving Average (LSMA) — also known as Linear Regression Moving Average — is a trend-following indicator that uses the least squares method to fit a straight line to the price data over a given period, then plots the value of that line at the most recent point. It draws the best-fitting straight line through the past N prices (using linear regression), and then takes the endpoint of that line as the value of the moving average for that bar. The LSMA aims to reduce lag and highlight the current trend more accurately than traditional moving averages like SMA or EMA.
Key Features:
It reacts faster to price changes than most moving averages.
It is smoother and less noisy than short-term EMAs.
It can be used to identify trend direction, momentum, and potential reversal points.
ATR (Average True Range) is a volatility indicator that measures how much an asset typically moves during a given period. It was introduced by J. Welles Wilder and is widely used to assess market volatility, not direction.
To calculate it first of all we need to get True Range (TR), this is the greatest value among:
High - Low
abs(High - Previous Close)
abs(Low - Previous Close)
ATR = MA(TR, n) , where n is number of periods for moving average, in our case equals 14.
ATR shows how much an asset moves on average per candle/bar. A higher ATR means more volatility; a lower ATR means a calmer market.
The Choppiness Index is a technical indicator that quantifies whether the market is trending or choppy (sideways). It doesn't indicate trend direction — only the strength or weakness of a trend. Higher Choppiness Index usually approximates the sideways market, while its low value tells us that there is a high probability of a trend.
Choppiness Index = 100 × log10(ΣATR(n) / (MaxHigh(n) - MinLow(n))) / log10(n)
where:
ΣATR(n) = sum of the Average True Range over n periods
MaxHigh(n) = highest high over n periods
MinLow(n) = lowest low over n periods
log10 = base-10 logarithm
Now let's understand how these indicators work in conjunction and why they were chosen for this strategy. KST indicator approximates current momentum, when it is rising and KST line crosses over the signal line there is high probability that short term trend is reversing to the upside and strategy allows to take part in this potential move. Alligator's jaw (blue) line is used as an approximation of a short term trend, taking trades only above it we want to avoid trading against trend to increase probability that long trade is going to be winning.
Almost the same for Moving Average, but it approximates the long term trend, this is just the additional filter. If we trade in the direction of the long term trend we increase probability that higher risk to reward trade will hit the take profit. Choppiness index is the optional filter, but if it turned on it is used for approximating if now market is in sideways or in trend. On the range bounded market the potential moves are restricted. We want to decrease probability opening trades in such condition avoiding trades if this index is above threshold value.
When trade is open script sets the stop loss and take profit targets. ATR approximates the current volatility, so we can make a decision when to exit a trade based on current market condition, it can increase the probability that strategy will avoid the excessive stop loss hits, but anyway user can setup how many ATRs to use as a stop loss and take profit target. As was said in the Methodology stop loss level is obtained by subtracting number of ATRs from trade opening candle low, while take profit by adding to this candle's close.
Backtest Results
Operating window: Date range of backtests is 2023.01.01 - 2025.05.01. It is chosen to let the strategy to close all opened positions.
Commission and Slippage: Includes a standard Binance commission of 0.1% and accounts for possible slippage over 5 ticks.
Initial capital: 10000 USDT
Percent of capital used in every trade: 60%
Maximum Single Position Loss: -5.53%
Maximum Single Profit: +8.35%
Net Profit: +5175.20 USDT (+51.75%)
Total Trades: 120 (56.67% win rate)
Profit Factor: 1.747
Maximum Accumulated Loss: 1039.89 USDT (-9.1%)
Average Profit per Trade: 43.13 USDT (+0.6%)
Average Trade Duration: 27 hours
These results are obtained with realistic parameters representing trading conditions observed at major exchanges such as Binance and with realistic trading portfolio usage parameters.
How to Use
Add the script to favorites for easy access.
Apply to the desired timeframe and chart (optimal performance observed on 1h BTC/USDT).
Configure settings using the dropdown choice list in the built-in menu.
Set up alerts to automate strategy positions through web hook with the text: {{strategy.order.alert_message}}
Disclaimer:
Educational and informational tool reflecting Skyrexio commitment to informed trading. Past performance does not guarantee future results. Test strategies in a simulated environment before live implementation.

Supply/Demand Zones + Engulfment-based ExecutionSupply/Demand Zones + Engulfment-Based Execution
Strategy Overview
This strategy combines institutional trading concepts—supply/demand zones and engulfing candle patterns—to generate high-probability long and short trade setups. The system uses aggregated price action to identify potential reversal zones and confirms entries with engulfing candle patterns, ensuring trades are only taken when market structure shows commitment in the direction of the trade.
Core Concepts
• Supply & Demand Zones: These are automatically detected by analyzing aggregated bullish and bearish candle structures over user-defined intervals. Supply zones are formed after bearish continuation patterns; demand zones appear after bullish continuation patterns.
• Engulfing Entries: Once price enters a zone, the strategy waits for a bullish engulfing pattern (in a demand zone) or a bearish engulfing pattern (in a supply zone) before executing a trade. This adds confirmation and reduces false signals.
• Risk Management: Stop-loss is placed at the low (for long trades) or high (for short trades) of the engulfed candle. Take-profit can be calculated using a fixed R-multiple (risk-to-reward ratio) or a user-defined target price.
Key Features
Fully customizable aggregation factor for zone detection
Visual zone boxes, entry/SL/TP boxes, and engulfing pattern labels
Optional removal of mitigated zones for cleaner charting
Configurable trade mode (Long only, Short only, or Both)
Support for trading sessions and date filtering
Alerts for price entering supply or demand zones
How to Use
Select Aggregation Factor: Choose how many candles to group together for identifying key zones (e.g., 4x timeframe).
Enable Zones: Turn on supply and/or demand zones as needed.
Set Execution Parameters:
– Choose R-multiple (e.g., 2:1 risk-reward)
– Or use a fixed take-profit price
Define Trade Time Window:
– Set the date and time ranges to restrict execution
– Use Start Hour and End Hour to limit trades to specific sessions (e.g., London/New York)
Run on Desired Timeframe: Typically used on 15m–4H charts, depending on your strategy and the asset’s volatility.
Ideal For
• Traders using Smart Money Concepts (SMC)
• Those who value high-confluence entries
• Intraday to swing traders looking for structure-based automation
⚠️ Important Notes
• The strategy requires engulfing confirmation within the zone to enter a position.
• This script does not repaint and executes trades on a bar close basis.
• Backtest results may vary based on session filters and aggregation factor.
© Attribution
This strategy was developed by The_Forex_Steward and is licensed under the Mozilla Public License 2.0.
You are free to use, modify, and distribute it under the terms of that license.

Dumb Money ConceptUse in 1 minute timeframe
1. Strategy setup
Name & sizing: Trades 25% of your account on each signal, assumes 0.04% commission + 2‑tick slippage, starts with a notional 10 million.
Timing: Only makes decisions at each 1‑minute bar close, and processes orders at bar‑close.
2. Optional filters (both default to off)
Volatility filter : when on, requires that yesterday’s ATR (average true range) ≥ your threshold before even placing an entry.
Trend filter : when on, only allows a “long” if yesterday’s close was above its daily MA, or a “short” if below.
You can toggle each filter on/off and adjust ATR period, ATR threshold, and MA length through the inputs at the top.
3. Signal logic (“dumb money” wicks)
At today’s first minute, the script pulls yesterday’s open, high, low, close, ATR and MA—using only completed daily bars so nothing repaints.
It measures the size of yesterday’s upper wick (close→high) vs. lower wick (open→low).
If the upper wick was longer, that sets a long bias (“dumb money” got shaken out at the top). Otherwise it sets a short bias.
4. Calculate where to place orders
On that same first minute of day:
Entry: a limit order at half of yesterday’s range away from today’s open (below the open for longs, above for shorts).
Stop‑loss: one full‑range (×1.0) below today’s open for longs (and above for shorts).
Take‑profit: 1.236× yesterday’s range above today’s open for longs (and below for shorts).
5. Apply filters before sending entry
Before actually placing that limit order, it checks:
Volatility: if enabled, requires yesterday’s ATR ≥ your “Min Daily ATR.”
Trend: if enabled, requires yesterday’s close to lie on the same side of its daily MA as your signal.
If either filter fails, no order is sent.
6. Give the limit order up to 24 hours to fill
The code remembers the bar‑index when the order went live.
If 1440 one‑minute bars pass (≈24 h) without a fill, it automatically cancels the unfilled entry—so stale orders don’t hang around.
7. Once filled, TP/SL manage the trade
As soon as your limit order executes, two opposite orders are placed:
A take‑profit at the 1.236× range level
A stop‑loss at the –1.0× range level
One cancels the other when triggered.
8. No overnight risk
On the very first minute of the next daily bar, any position still open is force‑closed (“Time Exit”)
Dskyz (DAFE) Adaptive Regime - Quant Machine ProDskyz (DAFE) Adaptive Regime - Quant Machine Pro:
Buckle up for the Dskyz (DAFE) Adaptive Regime - Quant Machine Pro, is a strategy that’s your ultimate edge for conquering futures markets like ES, MES, NQ, and MNQ. This isn’t just another script—it’s a quant-grade powerhouse, crafted with precision to adapt to market regimes, deliver multi-factor signals, and protect your capital with futures-tuned risk management. With its shimmering DAFE visuals, dual dashboards, and glowing watermark, it turns your charts into a cyberpunk command center, making trading as thrilling as it is profitable.
Unlike generic scripts clogging up the space, the Adaptive Regime is a DAFE original, built from the ground up to tackle the chaos of futures trading. It identifies market regimes (Trending, Range, Volatile, Quiet) using ADX, Bollinger Bands, and HTF indicators, then fires trades based on a weighted scoring system that blends candlestick patterns, RSI, MACD, and more. Add in dynamic stops, trailing exits, and a 5% drawdown circuit breaker, and you’ve got a system that’s as safe as it is aggressive. Whether you’re a newbie or a prop desk pro, this strat’s your ticket to outsmarting the markets. Let’s break down every detail and see why it’s a must-have.
Why Traders Need This Strategy
Futures markets are a gauntlet—fast moves, volatility spikes (like the April 28, 2025 NQ 1k-point drop), and institutional traps that punish the unprepared. Meanwhile, platforms are flooded with low-effort scripts that recycle old ideas with zero innovation. The Adaptive Regime stands tall, offering:
Adaptive Intelligence: Detects market regimes (Trending, Range, Volatile, Quiet) to optimize signals, unlike one-size-fits-all scripts.
Multi-Factor Precision: Combines candlestick patterns, MA trends, RSI, MACD, volume, and HTF confirmation for high-probability trades.
Futures-Optimized Risk: Calculates position sizes based on $ risk (default: $300), with ATR or fixed stops/TPs tailored for ES/MES.
Bulletproof Safety: 5% daily drawdown circuit breaker and trailing stops keep your account intact, even in chaos.
DAFE Visual Mastery: Pulsing Bollinger Band fills, dynamic SL/TP lines, and dual dashboards (metrics + position) make signals crystal-clear and charts a work of art.
Original Craftsmanship: A DAFE creation, built with community passion, not a rehashed clone of generic code.
Traders need this because it’s a complete, adaptive system that blends quant smarts, user-friendly design, and DAFE flair. It’s your edge to trade with confidence, cut through market noise, and leave the copycats in the dust.
Strategy Components
1. Market Regime Detection
The strategy’s brain is its ability to classify market conditions into five regimes, ensuring signals match the environment.
How It Works:
Trending (Regime 1): ADX > 20, fast/slow EMA spread > 0.3x ATR, HTF RSI > 50 or MACD bullish (htf_trend_bull/bear).
Range (Regime 2): ADX < 25, price range < 3% of close, no HTF trend.
Volatile (Regime 3): BB width > 1.5x avg, ATR > 1.2x avg, HTF RSI overbought/oversold.
Quiet (Regime 4): BB width < 0.8x avg, ATR < 0.9x avg.
Other (Regime 5): Default for unclear conditions.
Indicators: ADX (14), BB width (20), ATR (14, 50-bar SMA), HTF RSI (14, daily default), HTF MACD (12,26,9).
Why It’s Brilliant:
Regime detection adapts signals to market context, boosting win rates in trending or volatile conditions.
HTF RSI/MACD add a big-picture filter, rare in basic scripts.
Visualized via gradient background (green for Trending, orange for Range, red for Volatile, gray for Quiet, navy for Other).
2. Multi-Factor Signal Scoring
Entries are driven by a weighted scoring system that combines candlestick patterns, trend, momentum, and volume for robust signals.
Candlestick Patterns:
Bullish: Engulfing (0.5), hammer (0.4 in Range, 0.2 else), morning star (0.2), piercing (0.2), double bottom (0.3 in Volatile, 0.15 else). Must be near support (low ≤ 1.01x 20-bar low) with volume spike (>1.5x 20-bar avg).
Bearish: Engulfing (0.5), shooting star (0.4 in Range, 0.2 else), evening star (0.2), dark cloud (0.2), double top (0.3 in Volatile, 0.15 else). Must be near resistance (high ≥ 0.99x 20-bar high) with volume spike.
Logic: Patterns are weighted higher in specific regimes (e.g., hammer in Range, double bottom in Volatile).
Additional Factors:
Trend: Fast EMA (20) > slow EMA (50) + 0.5x ATR (trend_bull, +0.2); opposite for trend_bear.
RSI: RSI (14) < 30 (rsi_bull, +0.15); > 70 (rsi_bear, +0.15).
MACD: MACD line > signal (12,26,9, macd_bull, +0.15); opposite for macd_bear.
Volume: ATR > 1.2x 50-bar avg (vol_expansion, +0.1).
HTF Confirmation: HTF RSI < 70 and MACD bullish (htf_bull_confirm, +0.2); RSI > 30 and MACD bearish (htf_bear_confirm, +0.2).
Scoring:
bull_score = sum of bullish factors; bear_score = sum of bearish. Entry requires score ≥ 1.0.
Example: Bullish engulfing (0.5) + trend_bull (0.2) + rsi_bull (0.15) + htf_bull_confirm (0.2) = 1.05, triggers long.
Why It’s Brilliant:
Multi-factor scoring ensures signals are confirmed by multiple market dynamics, reducing false positives.
Regime-specific weights make patterns more relevant (e.g., hammers shine in Range markets).
HTF confirmation aligns with the big picture, a quant edge over simplistic scripts.
3. Futures-Tuned Risk Management
The risk system is built for futures, calculating position sizes based on $ risk and offering flexible stops/TPs.
Position Sizing:
Logic: Risk per trade (default: $300) ÷ (stop distance in points * point value) = contracts, capped at max_contracts (default: 5). Point value = tick value (e.g., $12.5 for ES) * ticks per point (4) * contract multiplier (1 for ES, 0.1 for MES).
Example: $300 risk, 8-point stop, ES ($50/point) → 0.75 contracts, rounded to 1.
Impact: Precise sizing prevents over-leverage, critical for micro contracts like MES.
Stops and Take-Profits:
Fixed: Default stop = 8 points, TP = 16 points (2:1 reward/risk).
ATR-Based: Stop = 1.5x ATR (default), TP = 3x ATR, enabled via use_atr_for_stops.
Logic: Stops set at swing low/high ± stop distance; TPs at 2x stop distance from entry.
Impact: ATR stops adapt to volatility, while fixed stops suit stable markets.
Trailing Stops:
Logic: Activates at 50% of TP distance. Trails at close ± 1.5x ATR (atr_multiplier). Longs: max(trail_stop_long, close - ATR * 1.5); shorts: min(trail_stop_short, close + ATR * 1.5).
Impact: Locks in profits during trends, a game-changer in volatile sessions.
Circuit Breaker:
Logic: Pauses trading if daily drawdown > 5% (daily_drawdown = (max_equity - equity) / max_equity).
Impact: Protects capital during black swan events (e.g., April 27, 2025 ES slippage).
Why It’s Brilliant:
Futures-specific inputs (tick value, multiplier) make it plug-and-play for ES/MES.
Trailing stops and circuit breaker add pro-level safety, rare in off-the-shelf scripts.
Flexible stops (ATR or fixed) suit different trading styles.
4. Trade Entry and Exit Logic
Entries and exits are precise, driven by bull_score/bear_score and protected by drawdown checks.
Entry Conditions:
Long: bull_score ≥ 1.0, no position (position_size <= 0), drawdown < 5% (not pause_trading). Calculates contracts, sets stop at swing low - stop points, TP at 2x stop distance.
Short: bear_score ≥ 1.0, position_size >= 0, drawdown < 5%. Stop at swing high + stop points, TP at 2x stop distance.
Logic: Tracks entry_regime for PNL arrays. Closes opposite positions before entering.
Exit Conditions:
Stop-Loss/Take-Profit: Hits stop or TP (strategy.exit).
Trailing Stop: Activates at 50% TP, trails by ATR * 1.5.
Emergency Exit: Closes if price breaches stop (close < long_stop_price or close > short_stop_price).
Reset: Clears stop/TP prices when flat (position_size = 0).
Why It’s Brilliant:
Score-based entries ensure multi-factor confirmation, filtering out weak signals.
Trailing stops maximize profits in trends, unlike static exits in basic scripts.
Emergency exits add an extra safety layer, critical for futures volatility.
5. DAFE Visuals
The visuals are pure DAFE magic, blending function with cyberpunk flair to make signals intuitive and charts stunning.
Shimmering Bollinger Band Fill:
Display: BB basis (20, white), upper/lower (green/red, 45% transparent). Fill pulses (30–50 alpha) by regime, with glow (60–95 alpha) near bands (close ≥ 0.995x upper or ≤ 1.005x lower).
Purpose: Highlights volatility and key levels with a futuristic glow.
Visuals make complex regimes and signals instantly clear, even for newbies.
Pulsing effects and regime-specific colors add a DAFE signature, setting it apart from generic scripts.
BB glow emphasizes tradeable levels, enhancing decision-making.
Chart Background (Regime Heatmap):
Green — Trending Market: Strong, sustained price movement in one direction. The market is in a trend phase—momentum follows through.
Orange — Range-Bound: Market is consolidating or moving sideways, with no clear up/down trend. Great for mean reversion setups.
Red — Volatile Regime: High volatility, heightened risk, and larger/faster price swings—trade with caution.
Gray — Quiet/Low Volatility: Market is calm and inactive, with small moves—often poor conditions for most strategies.
Navy — Other/Neutral: Regime is uncertain or mixed; signals may be less reliable.
Bollinger Bands Glow (Dynamic Fill):
Neon Red Glow — Warning!: Price is near or breaking above the upper band; momentum is overstretched, watch for overbought conditions or reversals.
Bright Green Glow — Opportunity!: Price is near or breaking below the lower band; market could be oversold, prime for bounce or reversal.
Trend Green Fill — Trending Regime: Fills between bands with green when the market is trending, showing clear momentum.
Gold/Yellow Fill — Range Regime: Fills with gold/aqua in range conditions, showing the market is sideways/oscillating.
Magenta/Red Fill — Volatility Spike: Fills with vivid magenta/red during highly volatile regimes.
Blue Fill — Neutral/Quiet: A soft blue glow for other or uncertain market states.
Moving Averages:
Display: Blue fast EMA (20), red slow EMA (50), 2px.
Purpose: Shows trend direction, with trend_dir requiring ATR-scaled spread.
Dynamic SL/TP Lines:
Display: Pulsing colors (red SL, green TP for Trending; yellow/orange for Range, etc.), 3px, with pulse_alpha for shimmer.
Purpose: Tracks stops/TPs in real-time, color-coded by regime.
6. Dual Dashboards
Two dashboards deliver real-time insights, making the strat a quant command center.
Bottom-Left Metrics Dashboard (2x13):
Metrics: Mode (Active/Paused), trend (Bullish/Bearish/Neutral), ATR, ATR avg, volume spike (YES/NO), RSI (value + Oversold/Overbought/Neutral), HTF RSI, HTF trend, last signal (Buy/Sell/None), regime, bull score.
Display: Black (29% transparent), purple title, color-coded (green for bullish, red for bearish).
Purpose: Consolidates market context and signal strength.
Top-Right Position Dashboard (2x7):
Metrics: Regime, position side (Long/Short/None), position PNL ($), SL, TP, daily PNL ($).
Display: Black (29% transparent), purple title, color-coded (lime for Long, red for Short).
Purpose: Tracks live trades and profitability.
Why It’s Brilliant:
Dual dashboards cover market context and trade status, a rare feature.
Color-coding and concise metrics guide beginners (e.g., green “Buy” = go).
Real-time PNL and SL/TP visibility empower disciplined trading.
7. Performance Tracking
Logic: Arrays (regime_pnl_long/short, regime_win/loss_long/short) track PNL and win/loss by regime (1–5). Updated on trade close (barstate.isconfirmed).
Purpose: Prepares for future adaptive thresholds (e.g., adjust bull_score min based on regime performance).
Why It’s Brilliant: Lays the groundwork for self-optimizing logic, a quant edge over static scripts.
Key Features
Regime-Adaptive: Optimizes signals for Trending, Range, Volatile, Quiet markets.
Futures-Optimized: Precise sizing for ES/MES with tick-based risk inputs.
Multi-Factor Signals: Candlestick patterns, RSI, MACD, and HTF confirmation for robust entries.
Dynamic Exits: ATR/fixed stops, 2:1 TPs, and trailing stops maximize profits.
Safe and Smart: 5% drawdown breaker and emergency exits protect capital.
DAFE Visuals: Shimmering BB fill, pulsing SL/TP, and dual dashboards.
Backtest-Ready: Fixed qty and tick calc for accurate historical testing.
How to Use
Add to Chart: Load on a 5min ES/MES chart in TradingView.
Configure Inputs: Set instrument (ES/MES), tick value ($12.5/$1.25), multiplier (1/0.1), risk ($300 default). Enable ATR stops for volatility.
Monitor Dashboards: Bottom-left for regime/signals, top-right for position/PNL.
Backtest: Run in strategy tester to compare regimes.
Live Trade: Connect to Tradovate or similar. Watch for slippage (e.g., April 27, 2025 ES issues).
Replay Test: Try April 28, 2025 NQ drop to see regime shifts and stops.
Disclaimer
Trading futures involves significant risk of loss and is not suitable for all investors. Past performance does not guarantee future results. Backtest results may differ from live trading due to slippage, fees, or market conditions. Use this strategy at your own risk, and consult a financial advisor before trading. Dskyz (DAFE) Trading Systems is not responsible for any losses incurred.
Backtesting:
Frame: 2023-09-20 - 2025-04-29
Slippage: 3
Fee Typical Range (per side, per contract)
CME Exchange $1.14 – $1.20
Clearing $0.10 – $0.30
NFA Regulatory $0.02
Firm/Broker Commis. $0.25 – $0.80 (retail prop)
TOTAL $1.60 – $2.30 per side
Round Turn: (enter+exit) = $3.20 – $4.60 per contract
Final Notes
The Dskyz (DAFE) Adaptive Regime - Quant Machine Pro is more than a strategy—it’s a revolution. Crafted with DAFE’s signature precision, it rises above generic scripts with adaptive regimes, quant-grade signals, and visuals that make trading a thrill. Whether you’re scalping MES or swinging ES, this system empowers you to navigate markets with confidence and style. Join the DAFE crew, light up your charts, and let’s dominate the futures game!
(This publishing will most likely be taken down do to some miscellaneous rule about properly displaying charting symbols, or whatever. Once I've identified what part of the publishing they want to pick on, I'll adjust and repost.)
Use it with discipline. Use it with clarity. Trade smarter.
**I will continue to release incredible strategies and indicators until I turn this into a brand or until someone offers me a contract.
Created by Dskyz, powered by DAFE Trading Systems. Trade smart, trade bold.

Express Generator StrategyExpress Generator Strategy
Pine Script™ v6
The Express Generator Strategy is an algorithmic trading system that harnesses confluence from multiple technical indicators to optimize trade entries and dynamic risk management. Developed in Pine Script v6, it is designed to operate within a user-defined backtesting period—ensuring that trades are executed only during chosen historical windows for targeted analysis.
How It Works:
- Entry Conditions:
The strategy relies on a dual confirmation approach:- A moving average crossover system where a fast (default 9-period SMA) crossing above or below a slower (default 21-period SMA) average signals a potential trend reversal.
- MACD confirmation; trades are only initiated when the MACD line crosses its signal line in the direction of the moving average signal.
- An RSI filter refines these signals by preventing entries when the market might be overextended—ensuring that long entries only occur when the RSI is below an overbought level (default 70) and short entries when above an oversold level (default 30).
- Risk Management & Dynamic Position Sizing:
The strategy takes a calculated approach to risk by enabling the adjustment of position sizes using:- A pre-defined percentage of equity risk per trade (default 1%, adjustable between 0.5% to 3%).
- A stop-loss set in pips (default 100 pips, with customizable ranges), which is then adjusted by market volatility measured through the ATR.
- Trailing stops (default 50 pips) to help protect profits as the market moves favorably.
This combination of volatility-adjusted risk and equity-based position sizing aims to harmonize trade exposure with prevailing market conditions.
- Backtest Period Flexibility:
Users can define the start and end dates for backtesting (e.g., January 1, 2020 to December 31, 2025). This ensures that the strategy only opens trades within the intended analysis window. Moreover, if the strategy is still holding a position outside this period, it automatically closes all trades to prevent unwanted exposure.
- Visual Insights:
For clarity, the strategy plots the fast (blue) and slow (red) moving averages directly on the chart, allowing for visual confirmation of crossovers and trend shifts.
By integrating multiple technical indicators with robust risk management and adaptable position sizing, the Express Generator Strategy provides a comprehensive framework for capturing trending moves while prudently managing downside risk. It’s ideally suited for traders looking to combine systematic entries with a disciplined and dynamic risk approach.
