[-_-] Level Breakout, Auto Backtesting StrategyDescription:
A Long only strategy based on breakout from a certain level formed by High price. It has auto-backtesting capabilities (you set ranges for the three main parameters: Lookback, TP and SL; the strategy then goes through different combinations of those parameters and displays a table with results that you can sort by Percentage of profitable trades AND/OR Net profit AND/OR Number of trades). So you can, for example, sort only by Net profit to find combination of parameters that gives highest net profit, or sort by Net profit and Percentage profitable to find a combination of parameters that gives the best balance between profitability and profit. The auto-backtesting also takes into account the commission which is set in % in the inputs (make sure to set the same value in properties of the strategy so that auto-backtesting and real backtesting results match).
NOTE: auto-backtesting only find the best combinations and displays them in a table, you will then need to manually set the Lookback, TP and SL inputs for real backtesting to match.
Parameters:
- Lookback -> # of bars for filtering signals; recommended range from 2 to 5
- TP (%) -> take profit; recommended range from 5 to 10
- SL (%) -> stop loss; recommended range from 1 to 5
- Commission (%) -> commission per trade
- Min/Max Lookback -> lookback range for auto-backtesting
- Min/Max TP -> take profit range for auto-backtesting
- Min/Max SL -> stop loss range for auto-backtesting
- Percentage profitable -> sort by percentage of profitable trades
- Net profit -> sort by net profit
- Number of trades -> sort by number of trades
스크립트에서 "range"에 대해 찾기

Hanzo Strategy - Volume & Smart Money📊 HANZO STRATEGY - Complete Description
## 🎯 Strategy Overview
The **Hanzo Strategy** is an advanced institutional trading system that combines Volume Profile analysis, Smart Money Concepts, and Price Action patterns to identify high-probability trade setups. This strategy is specifically designed for trading Gold (XAUUSD), NAS100, and US30 on the 15-minute timeframe.
---
## 🧠 Core Trading Philosophy
The Hanzo Strategy operates on the principle that **institutional money leaves footprints** in the market through:
- Volume accumulation at key price levels
- Liquidity sweeps and stop hunts
- Order block formations
- Strategic wick rejections at support/resistance
By identifying these institutional behaviors and combining them with precise volume analysis, the strategy aims to trade **with** the smart money, not against it.
---
## 🔑 Key Components
### 1️⃣ **Fixed Range Volume Profile (FRVP)**
- **What it does:** Analyzes the last 2 days of price action and calculates where the most volume traded
- **Point of Control (POC):** The price level with the highest trading volume - acts as a magnet for price
- **How we use it:** Price tends to revert to POC. When price is far from POC and starts moving toward it, we prepare for entries
- **Visual:** Yellow cross line on the chart marking the POC
### 2️⃣ **Wick Cluster Detection**
- **What it does:** Automatically identifies price levels where multiple candle wicks have rejected (2-6+ wicks)
- **Why it matters:** Multiple rejections at the same level indicate strong institutional support/resistance
- **Upper wick clusters:** Resistance zones where price was rejected downward
- **Lower wick clusters:** Support zones where price was rejected upward
- **Visual:** Dashed lines (red for resistance, green for support)
### 3️⃣ **Session Volatility Boxes**
- **London Session (8:00-16:00 UTC+3):** Captures European market volatility range
- **New York Session (13:30-20:00 UTC+3):** Captures US market volatility range
- **How we use it:** These ranges often act as support/resistance for the rest of the day
- **Visual:** Blue box for London, Orange box for New York
### 4️⃣ **Smart Money Zones**
**Order Blocks:**
- Strong institutional areas where banks and hedge funds placed large orders
- **Bullish Order Block:** Area where smart money bought heavily before a strong upward move
- **Bearish Order Block:** Area where smart money sold heavily before a strong downward move
- **Visual:** Green/Red filled boxes with "Bull OB" or "Bear OB" labels
**Liquidity Sweeps:**
- Price breaks above recent high or below recent low, then quickly reverses
- This is a "stop hunt" - institutions triggering retail stops before moving in the real direction
- **Bullish Sweep:** Price dips below support, grabs stops, then reverses up
- **Bearish Sweep:** Price pops above resistance, grabs stops, then reverses down
- **Visual:** Triangle markers (green up = bullish, red down = bearish)
### 5️⃣ **Engulfing Pattern Recognition**
- **Bullish Engulfing:** Large green candle fully engulfs the previous red candle - shows strong buying pressure
- **Bearish Engulfing:** Large red candle fully engulfs the previous green candle - shows strong selling pressure
- **How we use it:** Confirmation signal when combined with other factors
- **Visual:** Small circles below/above candles
### 6️⃣ **Trend Bias Indicator**
- Dynamically calculates market bias based on price position relative to POC
- **Bullish:** Price > 0.2% above POC
- **Neutral:** Price within 0.2% of POC
- **Bearish:** Price > 0.2% below POC
- **Visual:** Label at top of chart showing current bias
---
## 📈 Entry Signal Logic
The strategy generates **LONG** and **SHORT** signals based on confluence of multiple factors:
### 🟢 LONG ENTRY CONDITIONS:
1. **POC Break:** Price crosses above POC from below + Trend Bias is Bullish
**OR**
2. **Support Bounce:** Price touches a lower wick cluster + Bullish Engulfing pattern forms
3. **Additional Filter:** Trend Bias must NOT be Bearish
### 🔴 SHORT ENTRY CONDITIONS:
1. **POC Break:** Price crosses below POC from above + Trend Bias is Bearish
**OR**
2. **Resistance Rejection:** Price touches an upper wick cluster + Bearish Engulfing pattern forms
3. **Additional Filter:** Trend Bias must NOT be Bullish
---
## 🎯 Risk Management
### Stop Loss:
- **Calculation:** 2 × ATR(14) from entry price
- **Logic:** Uses Average True Range to adapt to current market volatility
- **Example:** If ATR = 10 points, stop loss is 20 points away
### Take Profit:
- **Calculation:** 3 × ATR(14) from entry price
- **Risk:Reward Ratio:** 1:1.5 (risking 2 ATR to make 3 ATR)
- **Example:** If ATR = 10 points, take profit is 30 points away
### Position Sizing:
- **Default:** 2% of account equity per trade
- **Adjustable:** Can be modified in strategy settings
---
## ⚙️ Strategy Settings & Customization
### Volume Profile Settings:
- **Lookback Days:** How many days to analyze (default: 2)
- **Profile Rows:** Resolution of volume calculation (default: 24)
- **POC Distance Threshold:** Minimum distance from POC for "far from POC" status (default: 0.3%)
### Wick Cluster Settings:
- **Min Wicks for Cluster:** How many wicks needed to form a cluster (default: 3)
- **Lookback Bars:** How far back to search for wicks (default: 50)
- **Tolerance %:** How close wicks must be to cluster together (default: 0.15%)
### Session Settings:
- **London Session:** 08:00-16:00 (adjustable)
- **New York Session:** 13:30-20:00 (adjustable)
- **UTC Offset:** Timezone adjustment (default: +3)
### Smart Money Settings:
- **Order Block Lookback:** How far back to search for order blocks (default: 20)
- **Toggle On/Off:** Can enable/disable order blocks and liquidity sweeps independently
---
## 📊 Performance Metrics Display
The strategy includes a real-time **Information Table** (top-right corner) showing:
| Metric | Description |
|--------|-------------|
| **Trend Bias** | Current market direction (Bullish/Neutral/Bearish) |
| **POC Price** | Current Point of Control price level |
| **Distance from POC** | How far current price is from POC (%) |
| **ATR (14)** | Current volatility measurement |
| **High Wick Clusters** | Number of resistance clusters detected |
| **Low Wick Clusters** | Number of support clusters detected |
| **Current Signal** | Active signal (LONG/SHORT/None) |
---
## 🚨 Alert System
The strategy can send alerts for:
1. **LONG Signal Triggered** - When all conditions met for long entry
2. **SHORT Signal Triggered** - When all conditions met for short entry
3. **Price Touching Support Cluster** - Warning that price at key support
4. **Price Touching Resistance Cluster** - Warning that price at key resistance
**Alert Frequency:** Once per bar (prevents spam)
---
## 📅 Best Trading Timeframes & Instruments
### ✅ Recommended Timeframes:
- **Primary Entry:** 15-minute chart
- **Trend Confirmation:** 30-minute or 1-hour chart
- **Higher Timeframe Filter:** 4-hour for major trend direction
### ✅ Recommended Instruments:
1. **Gold (XAUUSD)** - High volatility, respects key levels well
2. **NAS100 (US Tech 100)** - Strong trends, good liquidity
3. **US30 (Dow Jones)** - Reliable institutional participation
4. **EUR/USD, GBP/USD** - Can work on major forex pairs with adjustments
### ⏰ Best Trading Sessions:
- **London Open (08:00-12:00 UTC+3)** - High volatility, clear directional moves
- **New York Open (13:30-17:00 UTC+3)** - Strongest moves, highest volume
- **Overlap (13:30-16:00 UTC+3)** - Best liquidity and movement
### ⚠️ Avoid Trading:
- Asian session (low volatility)
- Major news events (first 15 minutes after high-impact news)
- Sundays and holidays (low liquidity)
---
## 💡 Pro Trading Tips
### 1. **Multiple Timeframe Confirmation**
- Check 1-hour chart for overall trend before taking 15-minute signals
- Only take LONG signals if 1-hour is bullish
- Only take SHORT signals if 1-hour is bearish
### 2. **POC Strategy**
- Best entries occur when price returns to POC after being far away
- Wait for POC touch + confirmation pattern (engulfing, order block)
- POC acts as support in uptrends, resistance in downtrends
### 3. **Wick Cluster Strategy**
- Strongest signals occur when wick clusters align with POC
- Look for 4+ wicks at the same level for highest probability
- Recent clusters (formed in last 2 days) are stronger than old ones
### 4. **Order Block Strategy**
- Fresh order blocks (just formed) are more powerful
- Wait for price to return to order block zone before entering
- Best when order block + wick cluster occur at same level
### 5. **London/NY Box Strategy**
- If price breaks above session high → look for LONG pullback entries
- If price breaks below session low → look for SHORT pullback entries
- Price often returns to session mid-point before continuing
### 6. **Risk Management Rules**
- **Never risk more than 2% per trade**
- **Don't trade more than 3 positions simultaneously**
- **If 2 losses in a row, reduce size to 1% or stop for the day**
- **Move stop to breakeven after 1:1 profit reached**
### 7. **High-Probability Setups**
Look for **CONFLUENCE** - the more factors aligned, the better:
✅ **BEST LONG SETUP:**
- Price at lower wick cluster (support)
- Price at/near POC
- Bullish order block present
- Bullish engulfing pattern forms
- Trend Bias = Bullish
- 1-hour chart = uptrend
✅ **BEST SHORT SETUP:**
- Price at upper wick cluster (resistance)
- Price at/near POC
- Bearish order block present
- Bearish engulfing pattern forms
- Trend Bias = Bearish
- 1-hour chart = downtrend
---
## 📈 Performance Expectations
### Typical Win Rate:
- **Conservative Trading (high confluence only):** 55-65% win rate
- **Moderate Trading (good setups):** 45-55% win rate
- **Aggressive Trading (all signals):** 35-45% win rate
### Typical Risk:Reward:
- **Average R:R:** 1:1.5 (with 2 ATR stop and 3 ATR target)
- **Breakeven adjusted:** Often improves to 1:2+ when stop moved to BE
### Monthly Trade Frequency (15M chart):
- **Gold:** 60-100 signals per month
- **NAS100:** 50-80 signals per month
- **US30:** 40-70 signals per month
---
## 🎓 Strategy Philosophy Summary
The Hanzo Strategy is built on three core principles:
1. **Follow the Volume** - Trade where institutions are active
2. **Respect the Levels** - Key support/resistance zones matter
3. **Confirm with Price Action** - Wait for confirmation before entering
This is NOT a holy grail - it requires:
- ✅ Discipline to wait for proper setups
- ✅ Patience to let trades play out
- ✅ Risk management to protect capital
- ✅ Emotional control to handle losses
---
## 🛠️ How to Use This Strategy
### Step 1: Initial Setup
1. Add strategy to 15-minute chart
2. Check that all components are visible (POC, clusters, boxes, etc.)
3. Adjust colors if needed for your chart theme
### Step 2: Daily Routine
1. **Pre-Market (before 8:00 AM):**
- Check POC location
- Note wick clusters from previous days
- Mark London/NY session boxes from yesterday
2. **London Session (8:00-16:00):**
- Watch for POC interactions
- Monitor for order blocks forming
- Wait for confluence setups
3. **NY Session (13:30-20:00):**
- Highest activity period
- Best signal quality
- More aggressive entries allowed
### Step 3: Trade Execution
1. Wait for signal label (LONG or SHORT) to appear
2. Check confluence factors (minimum 3)
3. Enter immediately or on next candle
4. Set stop loss at 2 × ATR from entry
5. Set take profit at 3 × ATR from entry
6. Move stop to breakeven at +1.5 ATR profit
### Step 4: Trade Management
- **Don't move stop closer** (let trade breathe)
- **Can trail stop** after 2:1 profit reached
- **Can take partial profits** at 1.5:1 and let rest run
- **Journal every trade** for future improvement
---
## ⚠️ Important Disclaimers
1. **Past performance does not guarantee future results**
2. **This strategy involves risk** - only trade with money you can afford to lose
3. **Backtest thoroughly** on your specific instruments before live trading
4. **Start small** - test with minimum position sizes first
5. **Market conditions change** - what works today may not work tomorrow
6. **Use proper risk management** - this is the #1 key to long-term success
---
## 🎯 Quick Reference Checklist
Before taking any trade, ask yourself:
- ✅ Is there a clear LONG or SHORT signal?
- ✅ Are we in London or NY session?
- ✅ Is price at/near POC or wick cluster?
- ✅ Is trend bias aligned with my direction?
- ✅ Is there an order block or engulfing pattern?
- ✅ Is my risk:reward at least 1:1.5?
- ✅ Am I risking no more than 2% of my account?
**If 5+ are YES → Take the trade!**
**If 3 or fewer YES → Skip and wait for better setup!**
---
## 🚀 Final Words
The Hanzo Strategy is a professional-grade trading system that combines institutional analysis with precise technical execution. Success comes not from taking every signal, but from taking only the **highest probability setups** with proper risk management.
**Trade smart. Trade safe. Trade like an institution.**
📊 **Good luck and profitable trading!** 📊

Hash Supertrend [Hash Capital Research]Hash Supertrend Strategy by Hash Capital Research
Overview
Hash Supertrend is a professional-grade trend-following strategy that combines the proven Supertrend indicator with institutional visual design and flexible time filtering.
The strategy uses ATR-based volatility bands to identify trend direction and executes position reversals when the trend flips.This implementation features a distinctive fluorescent color system with customizable glow effects, making trend changes immediately visible while maintaining the clean, professional aesthetic expected in quantitative trading environments.
Entry Signals:
Long Entry: Price crosses above the Supertrend line (trend flips bullish)
Short Entry: Price crosses below the Supertrend line (trend flips bearish)
Controls the lookback period for volatility calculation
Lower values (7-10): More sensitive to price changes, generates more signals
Higher values (12-14): Smoother response, fewer signals but potentially delayed entries
Recommended range: 7-14 depending on market volatility
Factor (Default: 3.0)
Restricts trading to specific hours
Useful for avoiding low-liquidity sessions, overnight gaps, or known choppy periods
When disabled, strategy trades 24/7
Start Hour (Default: 9) & Start Minute (Default: 30)
Define when the trading session begins
Uses exchange timezone in 24-hour format
Example: 9:30 = 9:30 AM
End Hour (Default: 16) & End Minute (Default: 0)
Controls the vibrancy of the fluorescent color system
1-3: Subtle, muted colors
4-6: Balanced, moderate saturation
7-10: Bright, highly saturated fluorescent appearance
Affects both the Supertrend line and trend zones
Glow Effect (Default: On)
Adds luminous halo around the Supertrend line
Creates a multi-layered visual with depth
Particularly effective during strong trends
Glow Intensity (Default: 5.0)
Displays tiny fluorescent dots at entry points
Green dot below bar: Long entry
Red dot above bar: Short entry
Provides clear visual confirmation of executed trades
Show Trend Zone (Default: On)
Strong trending markets (2020-style bull runs, sustained bear markets)
Markets with clear directional bias
Instruments with consistent volatility patterns
Timeframes: 15m to Daily (optimal on 1H-4H)
Challenging Conditions:
Choppy, range-bound markets
Low volatility consolidation periods
Highly news-driven instruments with frequent gaps
Very low timeframes (1m-5m) prone to noise
Recommended AssetsCryptocurrency:

ATH대비 지정하락률에 도착 시 매수 - 장기홀딩 선물 전략(ATH Drawdown Re-Buy Long Only)본 스크립트는 과거 하락 데이터를 이용하여, 정해진 하락 %가 발생하는 경우 자기 자본의 정해진 %만큼을 진입하게 설계되어진 스트레티지입니다.
레버리지를 사용할 수 있으며 기본적으로 셋팅해둔 값이 내장되어있습니다.(자유롭게 바꿔서 쓰시면 됩니다.) 추가적으로 2번의 진입 외에도 다른 진입 기준, 진입 %를 설정하실 수 있으며 - ChatGPT에게 요청하면 수정해줄 것입니다.
실제 사용용도로는 KillSwitch 기능을 꺼주세요. 바 돋보기 기능을 켜주세요.
ATH Drawdown Re-Buy Long Only 전략 설명
1. 전략 개요
ATH Drawdown Re-Buy Long Only 전략은 자산의 역대 최고가(ATH, All-Time High)를 기준으로 한 하락폭(드로우다운)을 활용하여,
특정 구간마다 단계적으로 롱 포지션을 구축하는 자동 재매수(Long Only) 전략입니다.
본 전략은 다음과 같은 목적을 가지고 설계되었습니다.
급격한 조정 구간에서 체계적인 분할 매수 및 레버리지 활용
ATH를 기준으로 한 명확한 진입 규칙 제공
실시간으로
평단가
레버리지
청산가 추정
계좌 MDD
수익률
등을 시각적으로 제공하여 리스크와 포지션 상태를 직관적으로 확인할 수 있도록 지원
※ 본 전략은 교육·연구·백테스트 용도로 제공되며,
어떠한 형태의 투자 권유 또는 수익을 보장하지 않습니다.
2. 전략의 핵심 개념
2-1. ATH(역대 최고가) 기준 드로우다운
전략은 차트 상에서 항상 가장 높은 고가(High)를 ATH로 기록합니다.
새로운 고점이 형성될 때마다 ATH를 갱신하고, 해당 ATH를 기준으로 다음을 계산합니다.
현재 바의 저가(Low)가 ATH에서 몇 % 하락했는지
현재 바의 종가(Close)가 ATH에서 몇 % 하락했는지
그리고 사전에 설정한 두 개의 드로우다운 구간에서 매수를 수행합니다.
1차 진입 구간: ATH 대비 X% 하락 시
2차 진입 구간: ATH 대비 Y% 하락 시
각 구간은 ATH가 새로 갱신될 때마다 한 번씩만 작동하며,
새로운 ATH가 생성되면 다시 “1차 / 2차 진입 가능 상태”로 초기화됩니다.
2-2. 첫 포지션 100% / 300% 특수 규칙
이 전략의 중요한 특징은 **“첫 포지션 진입 시의 예외 규칙”**입니다.
전략이 현재 어떠한 포지션도 들고 있지 않은 상태에서
최초로 롱 포지션을 진입하는 시점(첫 포지션)에 대해:
기본적으로는 **자산의 100%**를 기준으로 포지션을 구축하지만,
만약 그 순간의 가격이 ATH 대비 설정값 이상(예: 약 –72.5% 이상 하락한 상황) 이라면
→ 자산의 300% 규모로 첫 포지션을 진입하도록 설계되어 있습니다.
이 규칙은 다음과 같이 동작합니다.
첫 진입이 1차 드로우다운 구간에서 발생하든,
첫 진입이 2차 드로우다운 구간에서 발생하든,
현재 하락폭이 설정된 기준 이상(예: –72.5% 이상) 이라면
→ “이 정도 하락이면 첫 진입부터 더 공격적으로 들어간다”는 의미로 300% 규모로 진입
그 이하의 하락폭이라면
→ 첫 진입은 100% 규모로 제한
즉, 전략은 다음 두 가지 모드로 동작합니다.
일반적인 상황의 첫 진입: 자산의 100%
심각한 드로우다운 구간에서의 첫 진입: 자산의 300%
이 특수 규칙은 깊은 하락에서는 공격적으로, 평소에는 상대적으로 보수적으로 진입하도록 설계된 것입니다.
3. 전략 동작 구조
3-1. 매수 조건
차트 상 High 기준으로 ATH를 추적합니다.
각 바마다 해당 ATH에서의 하락률을 계산합니다.
사용자가 설정한 두 개의 드로우다운 구간(예시):
1차 구간: 예를 들어 ATH – 50%
2차 구간: 예를 들어 ATH – 72.5%
각 구간에 대해 다음과 같은 조건을 확인합니다.
“이번 ATH 구간에서 아직 해당 구간 매수를 한 적이 없는 상태”이고,
현재 바의 저가(Low)가 해당 구간 가격 이하를 찍는 순간
→ 해당 바에서 매수 조건 충족으로 간주
실제 주문은:
해당 구간 가격에 맞춰 롱 포지션 진입(리밋/시장가 기반 시뮬레이션) 으로 처리됩니다.
3-2. ATH 갱신과 진입 기회 리셋
차트 상에서 새로운 고점(High)이 기존 ATH를 넘어서는 순간,
ATH가 갱신되고,
1차 / 2차 진입 여부를 나타내는 내부 플래그가 초기화됩니다.
이를 통해, 시장이 새로운 고점을 돌파해 나갈 때마다,
해당 구간에서 다시 한 번씩 1차·2차 드로우다운 진입 기회를 갖게 됩니다.
4. 포지션 사이징 및 레버리지
4-1. 계좌 자산(Equity) 기준 포지션 크기 결정
전략은 현재 계좌 자산을 다음과 같이 정의하여 사용합니다.
현재 자산 = 초기 자본 + 실현 손익 + 미실현 손익
각 진입 구간에서의 포지션 가치는 다음과 같이 결정됩니다.
1차 진입 구간:
“자산의 몇 %를 사용할지”를 설정값으로 입력
설정된 퍼센트를 계좌 자산에 곱한 뒤,
다시 전략 내 레버리지 배수(Leverage) 를 곱하여 실제 포지션 가치를 계산
2차 진입 구간:
동일한 방식으로, 독립된 퍼센트 설정값을 사용
즉, 포지션 가치는 다음과 같이 계산됩니다.
포지션 가치 = 현재 자산 × (해당 구간 설정 % / 100) × 레버리지 배수
그리고 이를 해당 구간의 진입 가격으로 나누어 실제 수량(토큰 단위) 를 산출합니다.
4-2. 첫 포지션의 예외 처리 (100% / 300%)
첫 포지션에 대해서는 위의 일반적인 퍼센트 설정 대신,
다음과 같은 고정 비율이 사용됩니다.
기본: 자산의 100% 규모로 첫 포지션 진입
단, 진입 시점의 ATH 대비 하락률이 설정값 이상(예: –72.5% 이상) 일 경우
→ 자산의 300% 규모로 첫 포지션 진입
이때 역시 다음 공식을 사용합니다.
포지션 가치 = 현재 자산 × (100% 또는 300%) × 레버리지
그리고 이를 가격으로 나누어 실제 진입 수량을 계산합니다.
이 규칙은:
첫 진입이 1차 구간이든 2차 구간이든 동일하게 적용되며,
“충분히 깊은 하락 구간에서는 첫 진입부터 더 크게,
평소에는 비교적 보수적으로” 라는 운용 철학을 반영합니다.
4-3. 실레버리지(Real Leverage)의 추적
전략은 각 바 단위로 다음을 추적합니다.
바가 시작할 때의 기존 포지션 크기
해당 바에서 새로 진입한 수량
이를 바탕으로, 진입이 발생한 시점에 다음을 계산합니다.
실제 레버리지 = (포지션 가치 / 현재 자산)
그리고 차트 상에 예를 들어:
Lev 2.53x 와 같은 형식의 레이블로 표시합니다.
이를 통해, 매수 시점마다 실제 계좌 레버리지가 어느 정도였는지를 직관적으로 확인할 수 있습니다.
5. 시각화 및 모니터링 요소
5-1. 차트 상 시각 요소
전략은 차트 위에 다음과 같은 정보를 직접 표시합니다.
ATH 라인
High 기준으로 계산된 역대 최고가를 주황색 선으로 표시
평단가(평균 진입가) 라인
현재 보유 포지션이 있을 때,
해당 포지션의 평균 진입가를 노란색 선으로 표시
추정 청산가(고정형 청산가) 라인
포지션 수량이 변화하는 시점을 감지하여,
당시의 평단가와 실제 레버리지를 이용해 근사적인 청산가를 계산
이를 빨간색 선으로 차트에 고정 표시
포지션이 없거나 레버리지가 1배 이하인 경우에는 청산가 라인을 제거
매수 마커 및 레이블
1차/2차 매수 조건이 충족될 때마다 해당 지점에 매수 마커를 표시
"Buy XX% @ 가격", "Lev XXx" 형태의 라벨로
진입 비율과 당시 레버리지를 함께 시각화
레이블의 위치는 설정에서 선택 가능:
바 아래 (Below Bar)
바 위 (Above Bar)
실제 가격 위치 (At Price)
5-2. 우측 상단 정보 테이블
차트 우측 상단에는 현재 계좌·포지션 상태를 요약한 정보 테이블이 표시됩니다.
대표적으로 다음 항목들이 포함됩니다.
Pos Qty (Token)
현재 보유 중인 포지션 수량(토큰 기준, 절대값 기준)
Pos Value (USDT)
현재 포지션의 시장 가치 (수량 × 현재 가격)
Leverage (Now)
현재 실레버리지 (포지션 가치 / 현재 자산)
DD from ATH (%)
현재 가격 기준, 최근 ATH에서의 하락률(%)
Avg Entry
현재 포지션의 평균 진입 가격
PnL (%)
현재 포지션 기준 미실현 손익률(%)
Max DD (Equity %)
전략 전체 기간 동안 기록된 계좌 기준 최대 손실(MDD, Max Drawdown)
Last Entry Price
가장 최근에 포지션을 추가로 진입한 직후의 평균 진입 가격
Last Entry Lev
위 “Last Entry Price” 시점에서의 실레버리지
Liq Price (Fixed)
위에서 설명한 고정형 추정 청산가
Return from Start (%)
전략 시작 시점(초기 자본) 대비 현재 계좌 자산의 총 수익률(%)
이 테이블을 통해 사용자는:
현재 계좌와 포지션의 상태
리스크 수준
누적 성과
를 직관적으로 파악할 수 있습니다.
6. 시간 필터 및 라벨 옵션
6-1. 전략 동작 기간 설정
전략은 옵션으로 특정 기간에만 전략을 동작시키는 시간 필터를 제공합니다.
“Use Date Range” 옵션을 활성화하면:
시작 시각과 종료 시각을 지정하여
해당 구간에 한해서만 매매가 발생하도록 제한
옵션을 비활성화하면:
전략은 전체 차트 구간에서 자유롭게 동작
6-2. 진입 라벨 위치 설정
사용자는 매수/레버리지 라벨의 위치를 선택할 수 있습니다.
바 아래 (Below Bar)
바 위 (Above Bar)
실제 가격 위치 (At Price)
이를 통해 개인 취향 및 차트 가독성에 맞추어
시각화 방식을 유연하게 조정할 수 있습니다.
7. 활용 대상 및 사용 예시
본 전략은 다음과 같은 목적에 적합합니다.
현물 또는 선물 롱 포지션 기준 장기·스윙 관점 추매 전략 백테스트
“고점 대비 하락률”을 기준으로 한 규칙 기반 운용 아이디어 검증
레버리지 사용 시
계좌 레버리지·청산가·MDD를 동시에 모니터링하고자 하는 경우
특정 자산에 대해
“새로운 고점이 형성될 때마다
일정한 규칙으로 깊은 조정 구간에서만 분할 진입하고자 할 때”
실거래에 그대로 적용하기보다는,
전략 아이디어 검증 및 리스크 프로파일 분석,
자신의 성향에 맞는 파라미터 탐색 용도로 사용하는 것을 권장합니다.
8. 한계 및 유의사항
백테스트 결과는 미래 성과를 보장하지 않습니다.
과거 데이터에 기반한 시뮬레이션일 뿐이며,
실제 시장에서는
유동성
슬리피지
수수료 체계
강제청산 규칙
등 다양한 변수가 존재합니다.
청산가는 단순화된 공식에 따른 추정치입니다.
거래소별 실제 청산 규칙, 유지 증거금, 수수료, 펀딩비 등은
본 전략의 계산과 다를 수 있으며,
청산가 추정 라인은 참고용 지표일 뿐입니다.
레버리지 및 진입 비율 설정에 따라 손실 폭이 매우 커질 수 있습니다.
특히 **“첫 포지션 300% 진입”**과 같이 매우 공격적인 설정은
시장 급락 시 계좌 손실과 청산 리스크를 크게 증가시킬 수 있으므로
신중한 검토가 필요합니다.
실거래 연동 시에는 별도의 리스크 관리가 필수입니다.
개별 손절 기준
포지션 상한선
전체 포트폴리오 내 비중 관리 등
본 전략 외부에서 추가적인 안전장치가 필요합니다.
9. 결론
ATH Drawdown Re-Buy Long Only 전략은 단순한 “저가 매수”를 넘어서,
ATH 기준으로 드로우다운을 구조적으로 활용하고,
첫 포지션에 대한 **특수 규칙(100% / 300%)**을 적용하며,
레버리지·청산가·MDD·수익률을 통합적으로 시각화함으로써,
하락 구간에서의 규칙 기반 롱 포지션 구축과
리스크 모니터링을 동시에 지원하는 전략입니다.
사용자는 본 전략을 통해:
자신의 시장 관점과 리스크 허용 범위에 맞는
드로우다운 구간
진입 비율
레버리지 설정
다양한 시나리오에 대한 백테스트와 분석
을 수행할 수 있습니다.
다시 한 번 강조하지만,
본 전략은 연구·학습·백테스트를 위한 도구이며,
실제 투자 판단과 책임은 전적으로 사용자 본인에게 있습니다.
/ENG Version.
This script is designed to use historical drawdown data and automatically enter positions when a predefined percentage drop from the all-time high occurs, using a predefined percentage of your account equity.
You can use leverage, and default parameter values are provided out of the box (you can freely change them to suit your style).
In addition to the two main entry levels, you can add more entry conditions and custom entry percentages – just ask ChatGPT to modify the script.
For actual/live usage, please turn OFF the KillSwitch function and turn ON the Bar Magnifier feature.
ATH Drawdown Re-Buy Long Only Strategy
1. Strategy Overview
The ATH Drawdown Re-Buy Long Only strategy is an automatic re-buy (Long Only) system that builds long positions step-by-step at specific drawdown levels, based on the asset’s all-time high (ATH) and its subsequent drawdown.
This strategy is designed with the following goals:
Systematic scaled buying and leverage usage during sharp correction periods
Clear, rule-based entry logic using drawdowns from ATH
Real-time visualization of:
Average entry price
Leverage
Estimated liquidation price
Account MDD (Max Drawdown)
Return / performance
This allows traders to intuitively monitor both risk and position status.
※ This strategy is provided for educational, research, and backtesting purposes only.
It does not constitute investment advice and does not guarantee any profits.
2. Core Concepts
2-1. Drawdown from ATH (All-Time High)
On the chart, the strategy always tracks the highest high as the ATH.
Whenever a new high is made, ATH is updated, and based on that ATH the following are calculated:
How many percent the current bar’s Low is below the ATH
How many percent the current bar’s Close is below the ATH
Using these, the strategy executes buys at two predefined drawdown zones:
1st entry zone: When price drops X% from ATH
2nd entry zone: When price drops Y% from ATH
Each zone is allowed to trigger only once per ATH cycle.
When a new ATH is created, the “1st / 2nd entry possible” flags are reset, and new opportunities open up for that ATH leg.
2-2. Special Rule for the First Position (100% / 300%)
A key feature of this strategy is the special rule for the very first position.
When the strategy currently holds no position and is about to open the first long position:
Under normal conditions, it builds the position using 100% of account equity.
However, if at that moment the price has dropped by at least a predefined threshold from ATH (e.g. around –72.5% or more),
→ the strategy will open the first position using 300% of account equity.
This rule works as follows:
Whether the first entry happens at the 1st drawdown zone or at the 2nd drawdown zone,
If the current drawdown from ATH is at or below the threshold (e.g. –72.5% or worse),
→ the strategy interprets this as “a sufficiently deep crash” and opens the initial position with 300% of equity.
If the drawdown is less severe than the threshold,
→ the first entry is capped at 100% of equity.
So the strategy has two modes for the first entry:
Normal market conditions: 100% of equity
Deep drawdown conditions: 300% of equity
This special rule is intended to be aggressive in extremely deep crashes while staying more conservative in normal corrections.
3. Strategy Logic & Execution
3-1. Entry Conditions
The strategy tracks the ATH using the High price.
For each bar, it calculates the drawdown from ATH.
The user defines two drawdown zones, for example:
1st zone: ATH – 50%
2nd zone: ATH – 72.5%
For each zone, the strategy checks:
If no buy has been executed yet for that zone in the current ATH leg, and
If the current bar’s Low touches or falls below that zone’s price level,
→ That bar is considered to have triggered a buy condition.
Order simulation:
The strategy simulates entering a long position at that zone’s price level
(using a limit/market-like approximation for backtesting).
3-2. ATH Reset & Entry Opportunity Reset
When a new High goes above the previous ATH:
The ATH is updated to this new high.
Internal flags that track whether the 1st and 2nd entries have been used are reset.
This means:
Each time the market makes a new ATH,
The strategy once again has a fresh opportunity to execute 1st and 2nd drawdown entries for that new ATH leg.
4. Position Sizing & Leverage
4-1. Position Size Based on Account Equity
The strategy defines current equity as:
Current Equity = Initial Capital + Realized PnL + Unrealized PnL
For each entry zone, the position value is calculated as follows:
The user inputs:
“What % of equity to use at this zone”
The strategy:
Multiplies current equity by that percentage
Then multiplies by the strategy’s leverage factor
Thus:
Position Value = Current Equity × (Zone % / 100) × Leverage
Finally, this position value is divided by the entry price to determine the actual position size in tokens.
4-2. Exception for the First Position (100% / 300%)
For the very first position (when there is no open position),
the strategy does not use the zone % parameters. Instead, it uses fixed ratios:
Default: Enter the first position with 100% of equity.
If the drawdown from ATH at that moment is greater than or equal to a predefined threshold (e.g. –72.5% or more)
→ Enter the first position with 300% of equity.
The position value is computed as:
Position Value = Current Equity × (100% or 300%) × Leverage
Then it is divided by the entry price to obtain the token quantity.
This rule:
Applies regardless of whether the first entry occurs at the 1st zone or 2nd zone.
Embeds the philosophy:
“In very deep crashes, go much larger on the first entry; otherwise, stay more conservative.”
4-3. Tracking Real Leverage
On each bar, the strategy tracks:
The existing position size at the start of the bar
The newly added size (if any) on that bar
When a new entry occurs, it calculates the real leverage at that moment:
Real Leverage = (Position Value / Current Equity)
This is then displayed on the chart as a label, for example:
Lev 2.53x
This makes it easy to see the actual leverage level at each entry point.
5. Visualization & Monitoring
5-1. On-Chart Visual Elements
The strategy plots the following directly on the chart:
ATH Line
The all-time high (based on High) is plotted as an orange line.
Average Entry Price Line
When a position is open, the average entry price of that position is plotted as a yellow line.
Estimated Liquidation Price (Fixed) Line
The strategy detects when the position size changes.
At each size change, it uses the current average entry price and real leverage to compute an approximate liquidation price.
This “fixed liquidation price” is then plotted as a red line on the chart.
If there is no position, or if leverage is 1x or lower, the liquidation line is removed.
Entry Markers & Labels
When 1st/2nd entry conditions are met, the strategy:
Marks the entry point on the chart.
Displays labels such as "Buy XX% @ Price" and "Lev XXx",
showing both entry percentage and real leverage at that time.
The label placement is configurable:
Below Bar
Above Bar
At Price
5-2. Information Table (Top-Right Panel)
In the top-right corner of the chart, the strategy displays a summary table of the current account and position status. It typically includes:
Pos Qty (Token)
Absolute size of the current position (in tokens)
Pos Value (USDT)
Market value of the current position (qty × current price)
Leverage (Now)
Current real leverage (position value / current equity)
DD from ATH (%)
Current drawdown (%) from the latest ATH, based on current price
Avg Entry
Average entry price of the current position
PnL (%)
Unrealized profit/loss (%) of the current position
Max DD (Equity %)
The maximum equity drawdown (MDD) recorded over the entire backtest period
Last Entry Price
Average entry price immediately after the most recent add-on entry
Last Entry Lev
Real leverage at the time of the most recent entry
Liq Price (Fixed)
The fixed estimated liquidation price described above
Return from Start (%)
Total return (%) of equity compared to the initial capital
Through this table, users can quickly grasp:
Current account and position status
Current risk level
Cumulative performance
6. Time Filters & Label Options
6-1. Strategy Date Range Filter
The strategy provides an option to restrict trading to a specific time range.
When “Use Date Range” is enabled:
You can specify start and end timestamps.
The strategy will only execute trades within that range.
When this option is disabled:
The strategy operates over the entire chart history.
6-2. Entry Label Placement
Users can customize where entry/leverage labels are drawn:
Below Bar (Below Bar)
Above Bar (Above Bar)
At the actual price level (At Price)
This allows you to adjust visualization according to personal preference and chart readability.
7. Use Cases & Applications
This strategy is suitable for the following purposes:
Long-term / swing-style re-buy strategies for spot or futures long positions
Testing rule-based strategies that rely on “drawdown from ATH” as a main signal
Monitoring account leverage, liquidation price, and MDD when using leverage
Handling situations where, for a given asset:
“Every time a new ATH is formed,
you want to wait for deep corrections and enter only at specific drawdown zones”
It is generally recommended to use this strategy not as a direct plug-and-play live system, but as a tool for:
Strategy idea validation
Risk profile analysis
Parameter exploration to match your personal risk tolerance and style
8. Limitations & Warnings
Backtest results do not guarantee future performance.
They are based on historical data only.
In live markets, additional factors exist:
Liquidity
Slippage
Fee structures
Exchange-specific liquidation rules
Funding fees, etc.
The liquidation price is only an approximate estimate, derived from a simplified formula.
Actual liquidation rules, maintenance margin requirements, fees, and other details differ by exchange.
The liquidation line should be treated as a reference indicator, not an exact guarantee.
Depending on the configured leverage and entry percentages, losses can be very large.
In particular, extremely aggressive settings such as “first position 300% of equity” can greatly increase the risk of large account drawdowns and liquidation during sharp market crashes.
Use such settings with extreme caution.
For live trading, additional risk management is essential:
Your own stop-loss rules
Maximum position size limits
Portfolio-level exposure controls
And other external safety mechanisms beyond this strategy
9. Conclusion
The ATH Drawdown Re-Buy Long Only strategy goes beyond simple “buy the dip” logic. It:
Systematically utilizes drawdowns from ATH as a structural signal
Applies a special first-position rule (100% / 300%)
Integrates visualization of leverage, liquidation price, MDD, and returns
All of this supports rule-based long position building in drawdown phases and comprehensive risk monitoring.
With this strategy, users can:
Explore different:
Drawdown zones
Entry percentages
Leverage levels
Run various backtests and scenario analyses
Better understand the risk/return profile that fits their own market view and risk tolerance
Once again, this strategy is intended for research, learning, and backtesting only.
All real trading decisions and their consequences are solely the responsibility of the user.

ORBSMMAATRVOLREENTRY2Contracts📈 Opening Range Fibonacci Breakout (TradingView Strategy)
Overview:
The Opening Range Fibonacci Breakout strategy is designed to capture high-probability intraday moves by combining the power of the 15-minute opening range, trend confirmation via SMMA, and volume-based momentum filtering.
At the start of each trading session, the script automatically plots the Opening Range Box based on the first 15 minutes of price action — highlighting key intraday support and resistance levels.
How It Works:
Opening Range Setup
The first 15 minutes of the session define the range high and low.
A visual box marks this zone on the chart for easy reference.
Signal Generation
A Smoothed Moving Average (SMMA) with a user-defined period determines overall trend bias.
Candle volume is analyzed to confirm momentum strength.
Long Signal: Price breaks above the opening range high, SMMA trending up, and volume supports the move.
Short Signal: Price breaks below the opening range low, SMMA trending down, and volume supports the move.
Take Profit & Targets
Fibonacci extension levels are automatically plotted from the opening range.
These dynamic levels serve as structured Take Profit (TP) zones for partial or full exits.
Features:
✅ 15-Minute Opening Range Box
✅ Adjustable SMMA period
✅ Volume-based confirmation filter
✅ Automatic Fibonacci profit targets
✅ Visual Long/Short alerts & signals
Ideal For:
Scalpers and intraday traders who rely on early-session momentum, breakout confirmation, and precision exit targets.
Backtested for MNQ/NQ futures trading

Adaptive Trend 1m ### Overview
The "Adaptive Trend Impulse Parallel SL/TP 1m Realistic" strategy is a sophisticated trading system designed specifically for high-volatility markets like cryptocurrencies on 1-minute timeframes. It combines trend-following with momentum filters and adaptive parameters to dynamically adjust to market conditions, ensuring more reliable entries and risk management. This strategy uses SuperTrend for primary trend detection, enhanced by MACD, RSI, Bollinger Bands, and optional volume spikes. It incorporates parallel stop-loss (SL) and multiple take-profit (TP) levels based on ATR, with options for breakeven and trailing stops after the first TP. Optimized for realistic backtesting on short timeframes, it avoids over-optimization by adapting indicators to market speed and efficiency.
### Principles of Operation
The strategy operates on the principle of adaptive impulse trading, where entry signals are generated only when multiple conditions align to confirm a strong trend reversal or continuation:
1. **Trend Detection (SuperTrend)**: The core signal comes from an adaptive SuperTrend indicator. It calculates upper and lower bands using ATR (Average True Range) with dynamic periods and multipliers. A buy signal occurs when the price crosses above the lower band (from a downtrend), and a sell signal when it crosses below the upper band (from an uptrend). Adaptation is based on Rate of Change (ROC) to measure market speed, shortening periods in fast markets for quicker responses.
2. **Momentum and Trend Filters**:
- **MACD**: Uses adaptive fast and slow lengths. In "Trend Filter" mode (default when "Use MACD Cross" is false), it checks if the MACD line is above/below the signal for long/short. In cross mode, it requires a crossover/crossunder.
- **RSI**: Adaptive period RSI must be above 50 for longs and below 50 for shorts, confirming overbought/oversold conditions dynamically.
- **Bollinger Bands (BB)**: Depending on the mode ("Midline" by default), it requires the price to be above/below the BB midline for longs/shorts, or a breakout in "Breakout" mode. Deviation adapts to market efficiency.
- **Volume Spike Filter** (optional): Entries require volume to exceed an adaptive multiple of its SMA, signaling strong impulse.
3. **Volatility Filter**: Entries are only allowed if current ATR percentage exceeds a historical minimum (adaptive), preventing trades in low-volatility ranges.
4. **Risk Management (Parallel SL/TP)**:
- **Stop-Loss**: Set at an adaptive ATR multiple below/above entry for long/short.
- **Take-Profits**: Three levels at adaptive ATR multiples, with partial position closures (e.g., 51% at TP1, 25% at TP2, remainder at TP3).
- **Post-TP1 Features**: Optional breakeven moves SL to entry after TP1. Trailing SL uses BB midline as a dynamic trail.
- All levels are calculated per trade using the ATR at entry, making them "realistic" for 1m charts by widening SL and tightening initial TPs.
The strategy enters long on buy signals with all filters met, and short on sell signals. It uses pyramid margin (100% long/short) for full position sizing.
Adaptation is driven by:
- **Market Speed (normSpeed)**: Based on ROC, tightens multipliers in volatile periods.
- **Efficiency Ratio (ER)**: Measures trend strength, adjusting periods for trending vs. ranging markets.
This ensures the strategy "adapts" without manual tweaks, reducing false signals in varying conditions.
### Main Advantages
- **Adaptability**: Unlike static strategies, parameters dynamically adjust to market volatility and trend strength, improving performance across ranging and trending phases without over-optimization.
- **Realistic Risk Management for 1m**: Wider SL and tiered TPs prevent premature stops in noisy short-term charts, while partial profits lock in gains early. Breakeven/trailing options protect profits in extended moves.
- **Multi-Filter Confirmation**: Combines trend, momentum, and volume for high-probability entries, reducing whipsaws. The volatility filter avoids flat markets.
- **Debug Visualization**: Built-in plots for signals, levels, and component checks (when "Show Debug" is enabled) help users verify logic on charts.
- **Efficiency**: Low computational load, suitable for real-time trading on TradingView with alerts.
Backtesting shows robust results on volatile assets, with a focus on sustainable risk (e.g., SL at 3x ATR avoids excessive drawdowns).
### Uniqueness
What sets this strategy apart is its **fully adaptive framework** integrating multiple indicators with real-time market metrics (ROC for speed, ER for efficiency). Most trend strategies use fixed parameters, leading to poor adaptation; here, every key input (periods, multipliers, deviations) scales dynamically within bounds, creating a "self-tuning" system. The "parallel SL/TP with 1m realism" adds custom handling for micro-timeframes: tightened initial TPs for quick wins and adaptive min-ATR filter to skip low-vol bars. Unlike generic mashups, it justifies the combination—SuperTrend for trend, MACD/RSI/BB for impulse confirmation, volume for conviction—working synergistically to capture "trend impulses" while filtering noise. The post-TP1 breakeven/trailing tied to BB adds a unique profit-locking mechanism not common in open-source scripts.
### Recommended Settings
These settings are optimized and recommended for trading ASTER/USDT on Bybit, with 1-minute chart, x10 leverage, and cross margin mode. They provide a balanced risk-reward for this volatile pair:
- **Base Inputs**:
- Base ATR Period: 10
- Base SuperTrend ATR Multiplier: 2.5
- Base MACD Fast: 8
- Base MACD Slow: 17
- Base MACD Signal: 6
- Base RSI Period: 9
- Base Bollinger Period: 12
- Bollinger Deviation: 1.8
- Base Volume SMA Period: 19
- Base Volume Spike Multiplier: 1.8
- Adaptation Window: 54
- ROC Length: 10
- **TP/SL Settings**:
- Use Stop Loss: True
- Base SL Multiplier (ATR): 3
- Use Take Profits: True
- Base TP1 Multiplier (ATR): 5.5
- Base TP2 Multiplier (ATR): 10.5
- Base TP3 Multiplier (ATR): 19
- TP1 % Position: 51
- TP2 % Position: 25
- Breakeven after TP1: False
- Trailing SL after TP1: False
- Base Min ATR Filter: 0.001
- Use Volume Spike Filter: True
- BB Condition: Midline
- Use MACD Cross (false=Trend Filter): True
- Show Debug: True
For backtesting, use initial capital of 30 USD, base currency USDT, order size 100 USDT, pyramiding 1, commission 0.1%, slippage 0 ticks, long/short margin 0%.
Always backtest on your platform and use risk management—risk no more than 1-2% per trade. This is not financial advice; trade at your own risk.

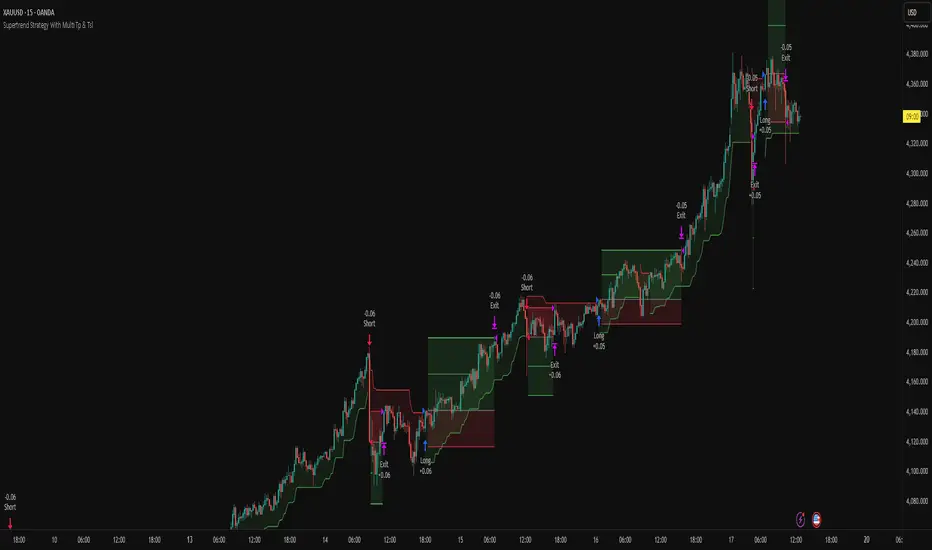
Supertrend Strategy With Multi Tp & TslHello Traders,
This strategy is based on the popular Supertrend indicator, which many traders use as a simple trend-following tool. The core entry logic is straightforward:
Buy (Long) when the price closes above the Supertrend line.
Sell (Short) when the price closes below the Supertrend line.
However, trading success isn’t only about entries — proper risk management makes all the difference. That’s why this strategy includes four stop-loss methods, two take-profit types, and a trailing stop-loss system. You can customize all of these settings to create your own personalized version.
🛑 Stop-Loss Methods
Tick – Uses the instrument’s smallest price increment. Ideal for tick-based markets such as Futures or Forex.
Percent – Defines the stop-loss as a percentage of entry price. Commonly used in Crypto trading.
ATR – Uses the Average True Range value to determine stop-loss distance. Perfect for adapting to changing market volatility.
Supertrend – The stop-loss level is set at the Supertrend line value at the time of entry.
🔁 Trailing Stop-Loss & Reverse Signals
Trailing SL: If enabled, the chosen stop-loss method will trail the price dynamically from the moment the position opens.
Close with Reverse Signals: When activated, the current position closes and reverses on an opposite signal. If disabled, the strategy waits until the current position is closed before opening a new one.
🎯 Take-Profit Options
Tick – Set a fixed take-profit level based on tick distance.
Percent – Set take-profit based on a percentage change from entry.
Ratio – Sets take-profit based on the entry-to-stop-loss distance × ratio value.
Each take-profit method allows you to define the percentage of position to close at that level.
⚖️ Breakeven Option
When Breakeven is enabled, after the first take-profit is triggered, the stop-loss automatically moves to the entry level, protecting your capital.
⚙️ Additional Settings
Position Type: Choose between Long only, Short only, or Both directions.
Session Filter: Trade only during specific time ranges. Activate this option and set your desired session hours (make sure to select your correct timezone).
📈 Visuals
The strategy plots entry, stop-loss, and take-profit levels directly on the chart, allowing you to clearly visualize your trades and manage them effectively.
Feel free to ask any questions or suggest improvements — this strategy is built for flexibility and experimentation!
Trend-Following & Breakout — Index Quant Strategy (NASDAQ)📈 Trend-Following & Breakout — Index Quant Strategy (NASDAQ & S&P 500)
Type: Invite-only strategy
Markets: NASDAQ 100 (NAS100 / US100 / NQ), S&P 500 (US500 / SPX), and other major equity indices.
🧠 Concept: Continuous trend model combining EWMAC (trend-following) and Donchian (breakout) signals, scaled by forecast strength and portfolio risk.
⚙️ Execution: Rebalances only on decision-bar closes, using hysteresis and a no-trade band to reduce churn.
📊 Default bias: Long-only — aligned with equity index drift.
🧩 How it works
• EWMAC Trend: Difference between fast and slow EMAs, normalized by an EWMA of absolute returns.
• Donchian Breakout: Distance beyond a 200-bar channel (Strict mode) or relative z-score position within it.
• Forecast combination: Weighted sum of trend and breakout points, clamped to ± capPoints.
• Hysteresis: Prevents quick sign flips near zero forecast.
• Risk scaling: Maps forecast strength to position size using equity × risk budget × ATR-based stop distance.
• Rebalance: Executes only if the required quantity change exceeds the Δqty threshold; can optionally block increases on Sundays (for CFDs).
⚙️ Default parameters
Deployed on NQ / US100 / NAS100 on Daily Timeframe
• Decision timeframe = 360 min (other options from 1 min to 1 week).
• Trend (EWMAC): Fast = 64, Slow = 256, Vol Norm = 32, Weight = 0.8.
• Breakout (Donchian): Length = 200, Mode = Strict, Weight = 0.2.
• Forecast scaling: ptsPerSigma = 1.0, capPoints = 10.
• Risk % per rebalance = 4 % of equity.
• ATR stop: ATR(14) × 1.0.
• No-trade band (Δqty) = 4 units.
• Hysteresis = 2 forecast points.
• Bias = Long-only (Neutral / Long-bias 50 % optional).
• Skip Sunday increases = false (default).
📋 Backtest properties (documented)
• Initial capital = 100 000 USD.
• Commission = 0.20 % per trade.
• Pyramiding = 10.
• Calc on every tick = false.
• Point value = 1 (for NAS100 CFD).
• No financing or slippage modeled.
• If using CFDs, account for overnight funding.
• On futures (NQ / ES), carry is implicit.
📊 Typical behaviour
• Many small scratches, a few large winners.
• Performs best during multi-week / multi-month trends.
• Underperforms in tight or volatile ranges.
• Average hold ≈ 30 – 90 days in historical tests.
💡 Risk and performance guide (illustrative)
Sharpe ≈ 1.25
Sortino ≈ 1.10 – 1.30
Max drawdown ≈ –18 % to –25 %
Annual volatility ≈ 24 – 28 %
CAGR ≈ 50 – 60 % (at 4 % risk)
Edge ratio ≈ 5 (MFE / MAE)
Historical backtests only — past performance does not guarantee future results.
🌍 Intended markets and timeframes
Optimized for NASDAQ 100 and S&P 500; also effective on similar indices (DAX, Dow Jones, FTSE).
Best on Daily or higher timeframes.
Aligns with long-term index drift — suitable for long-bias systematic trend portfolios.
⚠️ Limitations
• Backtests exclude CFD funding costs.
• Trend models will have losing streaks in range-bound markets.
• Designed for experienced traders seeking systematic exposure.
🔑 Requesting access
Send a private TradingView message to with the text:
“Request access to Trend-Following & Breakout — Index Quant Strategy.”
Access is granted only on explicit request.
For further information, see my TradingView Signature.
🆕 Release notes (v1.0)
• Initial release (360 min TF): EWMAC 64/256 + Donchian 200 Strict.
• Risk 4 %, ATR × 1.0, Long-only bias, hysteresis 2 pts, Δqty ≥ 4.
• Developed for NASDAQ 100 and S&P 500 indices.
• Implements continuous risk-scaled positioning and no-trade band logic.
🧾 Originality statement
This strategy is original work built entirely from TradingView built-ins (EMA, ATR, Highest, Lowest).
It does not reuse open-source invite-only code.
Any future reuse of open scripts will be done with explicit permission and credit.

Grand Master's Candlestick Dominance (ATR Enhanced)### Grand Master's Candlestick Dominance (ATR Enhanced)
**Overview**
Unleash the ancient wisdom of Japanese candlestick charting with a modern twist! This comprehensive Pine Script v5 strategy and indicator scans for over 75 classic and advanced candlestick patterns (bullish, bearish, and neutral), assigning dynamic strength scores (1-10) to each for precise signal filtering. Enhanced with Average True Range (ATR) for volatility-aware body size validation, it dominates the markets by combining timeless pattern recognition with robust confirmation layers. Whether used as a backtestable strategy or visual indicator, it empowers traders to spot high-probability reversals, continuations, and indecision setups with surgical accuracy.
Inspired by Steve Nison's *Japanese Candlestick Charting Techniques*, this tool elevates pattern analysis beyond basics—think Hammers, Engulfing patterns, Morning Stars, and rare gems like Abandoned Baby or Concealing Baby Swallow—all consolidated into intelligent arrays for real-time averaging and prioritization.
**Key Features**
- **Extensive Pattern Library**:
- **Bullish (25+ patterns)**: Hammer (8.0), Bullish Engulfing (10.0), Morning Star (7.0), Three White Soldiers (9.0), Dragonfly Doji (8.0), and more (e.g., Rising Three, Unique Three River Bottom).
- **Bearish (25+ patterns)**: Hanging Man (8.0), Bearish Engulfing (10.0), Evening Star (7.0), Three Black Crows (9.0), Gravestone Doji (8.0), and exotics like Upside Gap Two Crows or Stalled Pattern.
- **Neutral/Indecision (34+ patterns)**: Doji variants (Long-Legged, Four Price), Spinning Tops, Harami Crosses, and multi-bar setups like Upside Tasuki Gap or Advancing Block.
Each pattern includes duration tracking (1-5 bars) and ATR-adjusted body/shadow criteria for relevance in volatile conditions.
- **Smart Confirmation Filters** (All Toggleable):
- **Trend Alignment**: 20-period SMA (customizable) ensures entries align with the prevailing trend; optional higher timeframe (e.g., Daily) MA crossover for multi-timeframe confluence.
- **Support/Resistance (S/R)**: Pivot-based levels with 0.01% tolerance to confirm bounces or breaks.
- **Volume Surge**: 20-period volume MA with 1.5x spike multiplier to validate momentum.
- **ATR Body Sizing**: Filters small bodies (<0.3x ATR) and long bodies (>0.8x ATR) for context-aware pattern reliability.
- **Follow-Through**: Ensures post-pattern confirmation via bullish/bearish closes or closes beyond prior bars.
Minimum average strength (default 7.0) and individual pattern thresholds (5.0) prevent weak signals.
- **Entry & Exit Logic**:
- **Long Entry**: Bullish average strength ≥7.0 (outweighing bearish), uptrend, volume spike, near support, follow-through, and HTF alignment.
- **Short Entry**: Mirror for bearish dominance in downtrends near resistance.
- **Exits**: Bearish/neutral shift, or fixed TP (5%) / SL (2%)—pyramiding disabled, 10% equity sizing.
- Backtest range: Jan 1, 2020 – Dec 31, 2025 (editable). Initial capital: $10,000.
- **Interactive Dashboard** (Top-Right Panel):
Real-time insights including:
- Market phase (e.g., "Bullish Phase (Avg Str: 8.2)"), active pattern (e.g., "BULLISH: Bullish Engulfing (Str: 10.0, Bars: 2)"), and trend status.
- Strength breakdowns (Bull/Bear/Neutral counts & averages).
- Filter status (e.g., "Volume: ✔ Spike", "ATR: Enabled (L:0.8, S:0.3)").
- Backtest stats: Total trades, win rate, streak, and last entry/exit details (price & timestamp).
Toggle mode: Strategy (live trades) or Indicator (signals only).
- **Advanced Alerts** (15+ Toggleable Types):
Set up via TradingView's "Any alert() function call" for bar-close triggers:
- Entry/Exit signals with strength & pattern details.
- Strong patterns (≥2 bullish/bearish), neutral indecision, volume spikes.
- S/R breakouts, HTF reversals, high-confidence singles (≥8.0 strength).
- Conflicting signals, MA crossovers, ATR volatility bursts, multi-bar completions.
Example: "STRONG BULLISH PATTERN detected! Strength: 9.5 | Top Pattern: Three White Soldiers | Trend: Up".
**Customization & Usage Tips**
- **Inputs Groups**: Strategy toggles, confirmations, exits, backtest dates, and 15+ alert switches—all intuitively grouped.
- **Optimization**: Tune min strengths for aggressive (lower) or conservative (higher) trading; enable/disable filters to suit your style (e.g., disable S/R for scalping).
- **Best For**: Forex, stocks, crypto on 1H–Daily charts. Test on historical data to refine TP/SL.
- **Limitations**: No external data installs; relies on built-in TA functions. Patterns are probabilistic—combine with your risk management.
Master the candles like a grandmaster. Deploy on TradingView, backtest relentlessly, and let dominance begin! Questions? Drop a comment.
*Version: 1.0 | Updated: September 2025 | Credits: Built on Pine Script v5 with nods to Nison's timeless techniques.*

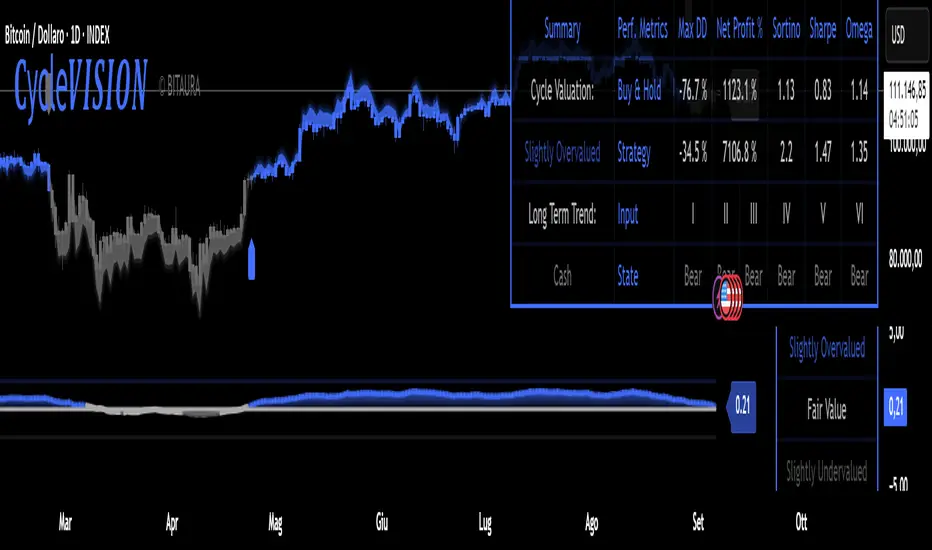
CycleVISION [BitAura]𝐂ycle𝑽𝑰𝑺𝑰𝑶𝑵
This Pine Script® indicator combines a long-term trend-following strategy with a cycle valuation Z-score analysis to generate a Trend Probability Indicator (TPI). The TPI aggregates signals from multiple trend and on-chain metrics to identify optimal entry and exit points for a single asset, with USD as a cash position. The system also calculates a comprehensive Z-score based on performance and valuation metrics to assess market cycles, aiming to enhance risk-adjusted returns for long-term investors.
Logic and Core Concepts
The 𝐂ycle𝑽𝑰𝑺𝑰𝑶𝑵 System uses two primary components to guide investing decisions:
1. Trend Probability Indicator (TPI)
Mechanism : Aggregates five proprietary, universal, trend signals and three on-chain metrics into a composite TPI score, normalized between -1 and 1.
Thresholds : Enters a long position when the TPI score exceeds a user-defined long threshold (default: 0.0) and exits to cash when it falls below a short threshold (default: -0.5).
Execution : Trades are executed only on confirmed bars within a user-specified backtest date range, ensuring robust signal reliability.
2. Cycle Valuation Z-Score
Mechanism : Computes an average Z-score from six metrics: Sharpe Ratio, Sortino Ratio, Omega Ratio, Weekly RSI, Crosby Ratio, and Price Z-Score, using a 1200-bar lookback period.
Purpose : Identifies overvalued or undervalued market conditions to complement TPI signals, with thresholds at ±1.8 for extreme valuations.
Visualization : Displays the average Z-score and individual components, with gradient-based bar coloring to reflect valuation strength.
Features
Dynamic Trend Signals : Combines trend and on-chain data into a single TPI score for clear long/cash decisions.
Comprehensive Valuation : Calculates Z-scores for multiple performance and price metrics to assess market cycles.
Customizable Inputs : Allows users to adjust TPI thresholds, backtest date ranges, and valuation metrics visibility.
Visual Outputs :
Valuation Table : Displays TPI score, Z-scores, and performance metrics (Sharpe, Sortino, Omega, Max Drawdown, Net Profit) in a configurable table (Lite, Medium, Full).
Equity Curve : Plots the system’s equity curve compared to buy-and-hold performance.
Price and TPI Plot : Overlays TPI-adjusted price bands with glow effects and filled gaps for trend visualization on the price chart.
Valuation Coloring : Applies backgrounds based on Z-score ranges (e.g., strong buy above 1.8, strong sell below -1.8).
Configurable Alerts : Notifies users of TPI signal changes (Long to Cash or Cash to Long) with detailed messages.
Color Presets : Offers five color themes (e.g., Arctic Blast, Fire vs. Ice) or custom color options for long/short signals.
Pine Script v6 : Leverages matrices, tables, and gradient coloring for enhanced usability.
How to Use
Add to Chart : Apply the indicator to any chart (the chart’s ticker is used for calculations, e.g., INDEX:BTCUSD ).
Configure Settings : Adjust TPI thresholds, backtest start date (default: 01 Feb 2018), and valuation metrics visibility in the Inputs menu.
Select Color Theme : Choose a preset color mode (e.g., Arctic Blast) or enable custom colors in the Colors group.
Monitor Outputs : Check the Valuation Table for TPI and Z-score data, and view the Price and TPI Plot for trend signals.
Analyze Performance : Enable the equity curve and performance metrics in the Backtesting Options group to compare results.
Set Alerts : Right-click a plot, select "Add alert," and choose "Trend Change: Long to Cash" or "Trend Change: Cash to Long" for notifications.
The system is optimized for daily timeframe and tested across various assets to ensure robustness.
Notes
The script is closed-source.
Use a standard price series (not Heikin Ashi or other non-standard types) for accurate results.
The script avoids lookahead bias by using barmerge.lookahead_off in request.security() calls.
A minimum 1200-bar lookback is mandatory for Z-score calculations to avoid errors, with warnings displayed if insufficient price history is available.
The BitAura watermark can be toggled in the Table Settings group.
Disclaimer : This script is for educational and analytical purposes only and does not constitute financial advice. Trading involves significant risk, and past performance is not indicative of future results. Always conduct your own research and apply proper risk management.
The Barking Rat LiteMomentum & FVG Reversion Strategy
The Barking Rat Lite is a disciplined, short-term mean-reversion strategy that combines RSI momentum filtering, EMA bands, and Fair Value Gap (FVG) detection to identify short-term reversal points. Designed for practical use on volatile markets, it focuses on precise entries and ATR-based take profit management to balance opportunity and risk.
Core Concept
This strategy seeks potential reversals when short-term price action shows exhaustion outside an EMA band, confirmed by momentum and FVG signals:
EMA Bands:
Parameters used: A 20-period EMA (fast) and 100-period EMA (slow).
Why chosen:
- The 20 EMA is sensitive to short-term moves and reflects immediate momentum.
- The 100 EMA provides a slower, structural anchor.
When price trades outside both bands, it often signals overextension relative to both short-term and medium-term trends.
Application in strategy:
- Long entries are only considered when price dips below both EMAs, identifying potential undervaluation.
- Short entries are only considered when price rises above both EMAs, identifying potential overvaluation.
This dual-band filter avoids counter-trend signals that would occur if only a single EMA was used, making entries more selective..
Fair Value Gap Detection (FVG):
Parameters used: The script checks for dislocations using a 12-bar lookback (i.e. comparing current highs/lows with values 12 candles back).
Why chosen:
- A 12-bar displacement highlights significant inefficiencies in price structure while filtering out micro-gaps that appear every few bars in high-volatility markets.
- By aligning FVG signals with candle direction (bullish = close > open, bearish = close < open), the strategy avoids random gaps and instead targets ones that suggest exhaustion.
Application in strategy:
- Bullish FVGs form when earlier lows sit above current highs, hinting at downward over-extension.
- Bearish FVGs form when earlier highs sit below current lows, hinting at upward over-extension.
This gives the strategy a structural filter beyond simple oscillators, ensuring signals have price-dislocation context.
RSI Momentum Filter:
Parameters used: 14-period RSI with thresholds of 80 (overbought) and 20 (oversold).
Why chosen:
- RSI(14) is a widely recognized momentum measure that balances responsiveness with stability.
- The thresholds are intentionally extreme (80/20 vs. the more common 70/30), so the strategy only engages at genuine exhaustion points rather than frequent minor corrections.
Application in strategy:
- Longs trigger when RSI < 20, suggesting oversold exhaustion.
- Shorts trigger when RSI > 80, suggesting overbought exhaustion.
This ensures entries are not just technically valid but also backed by momentum extremes, raising conviction.
ATR-Based Take Profit:
Parameters used: 14-period ATR, with a default multiplier of 4.
Why chosen:
- ATR(14) reflects the prevailing volatility environment without reacting too much to outliers.
- A multiplier of 4 is a pragmatic compromise: wide enough to let trades breathe in volatile conditions, but tight enough to enforce disciplined exits before mean reversion fades.
Application in strategy:
- At entry, a fixed target is set = Entry Price ± (ATR × 4).
- This target scales automatically with volatility: narrower in calm periods, wider in explosive markets.
By avoiding discretionary exits, the system maintains rule-based discipline.
Visual Signals on Chart
Blue “▲” below candle: Potential long entry
Orange/Yellow “▼” above candle: Potential short entry
Green “✔️”: Trade closed at ATR take profit
Blue (20 EMA) & Orange (100 EMA) lines: Dynamic channel reference
⚙️Strategy report properties
Position size: 25% equity per trade
Initial capital: 10,000.00 USDT
Pyramiding: 10 entries per direction
Slippage: 2 ticks
Commission: 0.055% per side
Backtest timeframe: 1-minute
Backtest instrument: HYPEUSDT
Backtesting range: Jul 28, 2025 — Aug 17, 2025
Note on Sample Size:
You’ll notice the report displays fewer than the ideal 100 trades in the strategy report above. This is intentional. The goal of the script is to isolate high-quality, short-term reversal opportunities while filtering out low-conviction setups. This means that the Barking Rat Lite strategy is very selective, filtering out over 90% of market noise. The brief timeframe shown in the strategy report here illustrates its filtering logic over a short window — not its full capabilities. As a result, even on lower timeframes like the 1-minute chart, signals are deliberately sparse — each one must pass all criteria before triggering.
For a larger dataset:
Once the strategy is applied to your chart, users are encouraged to expand the lookback range or apply the strategy to other volatile pairs to view a full sample.
💡Why 25% Equity Per Trade?
While it's always best to size positions based on personal risk tolerance, we defaulted to 25% equity per trade in the backtesting data — and here’s why:
Backtests using this sizing show manageable drawdowns even under volatile periods.
The strategy generates a sizeable number of trades, reducing reliance on a single outcome.
Combined with conservative filters, the 25% setting offers a balance between aggression and control.
Users are strongly encouraged to customize this to suit their risk profile.
What makes Barking Rat Lite valuable
Combines multiple layers of confirmation: EMA bands + FVG + RSI
Adaptive to volatility: ATR-based exits scale with market conditions
Clear, actionable visuals: Easy to monitor and manage trades

The Barking Rat ReversionsMean Reversion with Multi-Layered Precision
The Barking Rat Reversions is a short-term mean reversion strategy tailored for high-volatility markets. It combines several well-established technical tools in a configuration to identify overextended price movements likely to revert toward equilibrium. The goal is to isolate high-quality, short-term reversal opportunities while filtering out low-conviction setups.
At its core, our strategy triggers off Fair Value Gaps (FVGs) that occur a considerable distance away from a dynamically defined equilibrium band. It then validates these gaps by checking proximity to recent support and resistance drawn from swing extremes.
Additional confirmation comes from momentum filters and wick-rejection patterns, ensuring each entry aligns with both price structure and stretched momentum. Exits use volatility-adjusted profit targets. Keeping the approach disciplined and adaptive.
🧠Core Logic: Selectivity & Structure
This strategy is intentionally very selective. We have designed it to filter out roughly 95% of all market noise, highlighting only setups that pass multiple validation layers outlined below.
Fair Value Gaps (FVGs) as the Primary Trigger
FVGs identify imbalance zones where price historically retraces. These inefficient zones often become magnets for reversion as the market seeks to rebalance.
Dynamic Equilibrium Band + S/R
Defines a fair value zone with a long-term moving average and combines it with shorter-term swing pivots to establish support/resistance. Only FVGs that occur outside the band and near recent pivots are considered, ensuring reversals are sufficiently distanced and not taken too close to the mean.
Proximity to Support/Resistance
Setup validity depends on location. The strategy filters for FVGs near well-defined structural levels — areas where price has previously turned (i.e., recent swing highs or lows). This increases the likelihood that reversals are occurring at legitimate zones of confluence.
Wick-Rejection Confirmation
Confirms potential exhaustion through characteristic candle wick patterns beyond the equilibrium region. This acts as another filter to improve signal accuracy.
Sequential Filtered Signals
Custom logic ensures that a new signal in any direction must improve upon the previous one, preventing repetitive or suboptimal entries.
Multi-Step Confirmation
All validation layers must coincide on the same bar before a signal triggers, dramatically reducing false positives.
📈Chart Visuals: Designed for Clarity
To ensure transparency and easy interpretation, the script overlays intuitive visuals:
Green “▲” below a candle: Indicates a potential long entry
Red “▼” above a candle: Indicates a potential short entry
Green “✔️”: Marks exit from a trade when ATR target is met
Background shading (green/red): Indicates trade direction while active
Support/Resistance lines: Auto-plotted from recent swing levels
🔔Alerts: Stay Notified Without Watching
The strategy supports real-time alerts on candle close, ensuring that signals are only triggered once fully confirmed.
You must manually set up alerts within your TradingView account. Once configured, you’ll be able to set up one alert per instrument. This one alert covers all relevant signals and exits — ideal for hands-free monitoring.
⚙️Strategy report properties
Position size: 25% equity per trade
Initial capital: 10,000.00 USDT
Pyramiding: 10 entries per direction
Slippage: 2 ticks
Commission: 0.055% per side
Backtest timeframe: 1-minute
Backtest instrument: HYPEUSDT
Backtesting range: Jul 21, 2025 — Aug 7, 2025
Note on Sample Size:
You’ll notice the report displays fewer than the ideal 100 trades in the strategy report above. This is intentional. The goal of the script is to isolate high-quality, short-term reversal opportunities while filtering out low-conviction setups. This means that the Barking Rat Reversions strategy is ultra-selective, filtering out over 95% of market noise by enforcing multiple validation layers. The brief timeframe shown in the strategy report here illustrates its filtering logic over a short window — not its full capabilities. As a result, even on lower timeframes like the 1-minute chart, signals are deliberately sparse — each one must pass all criteria before triggering.
We conducted a broader backtest covering the period from December 5, 2024 to July 31, 2025, during which the strategy identified 968 high-probability setups on the same instrument and timeframe as the strategy report.
For a larger dataset:
Once the strategy is applied to your chart, users are encouraged to expand the lookback range or apply the strategy to other volatile pairs to view a full sample.
💡Why 25% Equity Per Trade?
While it's always best to size positions based on personal risk tolerance, we defaulted to 25% equity per trade in the backtesting data — and here’s why:
Backtests using this sizing show manageable drawdowns even under volatile periods
The strategy generates a sizeable number of trades, reducing reliance on a single outcome
Combined with conservative filters, the 25% setting offers a balance between aggression and control
Users are strongly encouraged to customize this to suit their risk profile.
🔍What Makes This Strategy Unique?
Multi-factor confirmation using FVGs, EMA deviation, RSI, wick rejection, and S/R
Clean, Intuitive Chart Experience
Real-time alerts triggered only on confirmation
Variables monitor prior reversal points, guaranteeing each new signal offers an improved entry
Tracks active positions and resets filters upon exit.

HSI1! First 30m Candle Strategy (15m Chart)## HSI1! First 30-Minute Candle Breakout Strategy (15m Chart) — Description
### Overview
This strategy is designed for trading **Hang Seng Index (HSI) Futures** on a 15-minute chart. It uses the price range established during the first 30 minutes of the Hong Kong main session (09:15–09:44:59) to define key breakout levels for a systematic trade entry each day.
### How the Strategy Works
#### 1. Reference Candle Period
- **Aggregation Window:** The strategy monitors the first two 15-minute bars of the session (09:15:00–09:44:59 HKT).
- **Range Capture:** It records the highest and lowest prices (the "reference high/low") during this window.
#### 2. Trade Setup
- After the 09:45 bar completes, the reference range is locked in.
- Throughout the rest of the trading day (within session hours), the strategy looks for breakouts beyond the reference range.
#### 3. Entry Rules
- **Long Entry (Buy):**
- Triggered if price rises to or above the reference high.
- Only entered if the user's settings permit "Buy Only" or "Both".
- **Short Entry (Sell):**
- Triggered if price falls to or below the reference low.
- Only entered if the user's settings permit "Sell Only" or "Both".
- **Single trade per day:**
- Once any trade executes, no additional trades are opened until the next session.
#### 4. Exit Rules
- **Take Profit (TP):**
- Target profit is set to a distance equal to the initial range added above the long entry (or subtracted below the short entry).
- Example: For a 100-point range, a long trade targets entry + 100 points.
- **Stop Loss (SL):**
- Longs are stopped out if price falls back to the session's reference low; shorts are stopped out if price rallies to the reference high.
#### 5. Session Control
- Active only within the regular day session (09:15–12:00 and 13:00–16:00 HKT).
- Trade tracking resets each new trading day.
#### 6. Trade Direction Manual Setting
- A user input allows restriction to "Buy Only", "Sell Only" or "Both" directions, providing discretion over daily bias.
### Example Workflow
| Step | Action |
|---------------------------|-------------------------------------------------------------------------|
| 09:15–09:44 | Aggregate first two 15m candles; record daily high/low |
| After 09:45 | Wait for a breakout (price crossing either the high or the low) |
| Long trade triggered | Enter at the reference high, target is "high + range", SL is at the low |
| Short trade triggered | Enter at the reference low, target is "low - range", SL at the high |
| Trade management | No more trades for the day, regardless of further breakouts |
| End of session (if open) | Trades may be closed per further logic or left to strategy to handle |
### Key Features and Benefits
- **Discipline:** Only one trade per day, minimizing overtrading.
- **Clarity:** Transparent entry/exit rules; no discretionary execution.
- **Flexibility:** User can bias system to buy-only, sell-only, or allow both, depending on trend or personal view.
- **Simple Risk Control:** Pre-defined stop loss and profit target for every trade.
- **Works best in:** Trending, breakout-prone markets with a history of impulsive moves early in the session.
This strategy is ideal for systematic traders looking to capture the Hang Seng's early session momentum, with robust rule-based management and minimal intervention.

S4_IBS_Mean_Rev_3candleExitOverview:
This is a rules-based, mean reversion strategy designed to trade pullbacks using the Internal Bar Strength (IBS) indicator. The system looks for oversold conditions based on IBS, then enters long trades , holding for a maximum of 3 bars or until the trade becomes profitable.
The strategy includes:
✅ Strict entry rules based on IBS
✅ Hardcoded exit conditions for risk management
✅ A clean visual table summarizing key performance metrics
How It Works:
1. Internal Bar Strength (IBS) Setup:
The IBS is calculated using the previous bar’s price range:
IBS = (Previous Close - Previous Low) / (Previous High - Previous Low)
IBS values closer to 0 indicate price is near the bottom of the previous range, suggesting oversold conditions.
2. Entry Conditions:
IBS must be ≤ 0.25, signaling an oversold setup.
Trade entries are only allowed within a user-defined backtest window (default: 2024).
Only one trade at a time is permitted (long-only strategy).
3. Exit Conditions:
If the price closes higher than the entry price, the trade exits with a profit.
If the trade has been open for 3 bars without showing profit, the trade is forcefully exited.
All trades are closed automatically at the end of the backtest window if still open.
Additional Features:
📊 A real-time performance metrics table is displayed on the chart, showing:
- Total trades
- % of profitable trades
- Total P&L
- Profit Factor
- Max Drawdown
- Best/Worst trade performance
📈 Visual markers indicate trade entries (green triangle) and exits (red triangle) for easy chart interpretation.
Who Is This For?
This strategy is designed for:
✅ Traders exploring systematic mean reversion approaches
✅ Those who prefer strict, rules-based setups with no subjective decision-making
✅ Traders who want built-in performance tracking directly on the chart
Note: This strategy is provided for educational and research purposes. It is a backtested model and past performance does not guarantee future results. Users should paper trade and validate performance before considering real capital.

MÈGAS ALGO : MÈGAS Engine [STRATEGY]Overview
The MÈGAS Engine is an advanced algorithmic trading system that integrates a range of technical analysis tools to pinpoint high-probability opportunities in the market.
Key Features
Core Signal Generation:
-Structure Break Detection: Advanced breakout identification with adjustable
sensitivity controls
-Dual-Direction Analysis: Separate bullish and bearish signal parameters with customizable delta
thresholds and depth settings
-Dynamic Parameter Management: OverfitShield technology with pulsewave parameter cycling
to reduce overfitting risks
Filtering Alghoritm:
-Volatility Filter: Rogers-Satchell volatility estimation with RSI-based normalization to avoid
trading in unfavorable market conditions
-Volume Confirmation: Cumulative volume analysis ensuring adequate liquidity support for trade
entries
OverfitShield Method:
OverfitShield is a built-in function within the trading strategy designed to reduce overfitting bias by introducing parameter variability during execution. When the "variable" mode is activated, instead of relying on fixed values for key strategy parameters the system dynamically selects values from customizable ranges.
This approach mimics real-world market uncertainty and ensures that the strategy does not become overly dependent on a single optimal value found during backtesting — making it more robust across different market conditions and time periods.
Position Management
-Customizable Exit Set-up
The exit logic can be customized to 'CONTINUE', 'TAKE PROFIT', or 'TRAILING PROFIT' to suit
your trading approach and maximize performance.
-CONTINUE Mode:
This mode does not use predefined take profit levels. Instead, it remains in the market as long as the trend persists. By avoiding fixed exit points, this approach is often the most effective in backtesting, as it allows positions to run in favorable trends for longer periods.
-TAKE PROFIT Mode:
This mode allows you to set multiple grid-like take profit levels at different price points, effectively creating a multi-tier exit strategy. You can specify the number of profit levels you want, along with the percentage step between each level. This structured approach can be beneficial for capturing incremental profits in a trending market while allowing for more flexibility in trade management.
-TRAILING PROFIT Mode:
Similar to the Take Profit mode, this option allows you to set the trailing stop levels. The trailing stop moves with the market, ensuring that you lock in profits as the price continues to move in your favor. Once a profit level is hit, the trailing stop "follows" the price movement, adjusting dynamically to safeguard profits as the trade progresses.
3. Customizable Insight Alerts
Traders can configure personalized alert messages for every strategy action, including entries, exits, and profit targets. These alerts are fully compatible with TradingView's webhook system.
Advantages
Customization: Fully customizable exit set-up and alerts allow traders to tailor the strategy to their personal trading objectives.
How It Works — Step by Step
Step 1: Apply the Strategy
Open the chart for your selected symbol and timeframe. Add the MÈGAS Engine to the chart.
Step 2:Backtesting and Optimization
Run a full backtest and optimize the strategy parameters across the chosen trading pairs to:
Identify robust settings that perform consistently well
Avoid overfitting through validation techniques
Select the most profitable and stable configuration for live or forward testing.
Step 3: Review Results and Alerts
Check the backtest results on the chart and confirm that the custom alert messages are displaying as expected. This helps verify that everything is functioning correctly before moving forward.
Step 4: Configure Portfolio Management
Set up the exit logic based on your specific requirements. Tailor the exit strategy to match your trading approach, whether you prefer predefined take profit levels, trailing stops, or a trend-following method. This flexibility ensures the exit logic aligns with your overall strategy for optimal performance.
Open the strategy settings window. In the dedicated portfolio management section, choose your preferred capital allocation method based on your trading style and risk preferences. Once set, save the configuration as the default.
Step 5: Set Up Alerts
Click "Add Alert" on the strategy
-In the message field, use: {{strategy.order.comment}}
Under the Notifications tab:
-Enable Webhook URL
-Enter your external webhook address
-Click 'Create' to activate alerts for your strategy
Please Note:
The results and visualizations presented are derived from optimized backtesting iterations using historical and paid real-time market data sourced via TradingView. While these results are intended to demonstrate potential performance, they do not guarantee future outcomes or accuracy. Past performance is not indicative of future results, and all trading involves risk.
We strongly recommend that users review and adjust the Properties within the script settings to align with their specific account configurations and preferred trading platforms. This ensures that the strategy outputs are reflective of real-world conditions and enhances the reliability of the results obtained. Use this tool responsibly and at your own risk.

Volatility Pulse with Dynamic ExitVolatility Pulse with Dynamic Exit
Overview
This strategy, Volatility Pulse with Dynamic Exit, is designed to capture impulsive price moves following volatility expansions, while ensuring risk is managed dynamically. It avoids trades during low-volatility periods and uses momentum confirmation to enter positions. Additionally, it features a time-based forced exit system to limit overexposure.
How It Works
A position is opened when the current ATR (Average True Range) significantly exceeds its 20-period average, signaling a volatility expansion.
To confirm the move is directional and not random noise, the strategy checks for momentum: the close must be above/below the close of 20 bars ago.
Low volatility zones are filtered out to avoid chop and poor trade entries.
Upon entry, a dynamic stop-loss is set at 1x ATR, while take-profit is set at 2x ATR, offering a 2:1 reward-to-risk ratio.
If the position remains open for more than 42 bars, it is forcefully closed, even if targets are not hit. This prevents long-lasting, stagnant trades.
Key Features
✅ Volatility-based breakout detection
✅ Momentum confirmation filter
✅ Dynamic stop-loss and take-profit based on real-time ATR
✅ Time-based forced exit (42 bars max holding)
✅ Low-volatility environment filter
✅ Realistic settings with 0.05% commission and slippage included
Parameters Explanation
ATR Length (14): Captures recent volatility over ~2 weeks (14 candles).
Momentum Lookback (20): Ensures meaningful price move confirmation.
Volatility Expansion Threshold (0.5x): Strategy activates only when ATR is at least 50% above its average.
Minimum ATR Filter (1.0x): Avoids entries in tight, compressed market ranges.
Max Holding (42 bars): Trades are closed after 42 bars if no exit signal is triggered.
Risk-Reward (2.0x): Aiming for 2x ATR as profit for every 1x ATR risk.
Originality Note
While volatility and momentum have been used separately in many strategies, this script combines both with a time-based dynamic exit system. This exit rule, combined with an ATR-based filter to exclude low-activity periods, gives the system a practical edge in real-world use. It avoids classic rehashes and integrates real trading constraints for better applicability.
Disclaimer
This is a research-focused trading strategy meant for backtesting and educational purposes. Always use proper risk management and perform due diligence before applying to real funds.

SuperTrade ST1 StrategyOverview
The SuperTrade ST1 Strategy is a long-only trend-following strategy that combines a Supertrend indicator with a 200-period EMA filter to isolate high-probability bullish trade setups. It is designed to operate in trending markets, using volatility-based exits with a strict 1:4 Risk-to-Reward (R:R) ratio, meaning that each trade targets a profit 4× the size of its predefined risk.
This strategy is ideal for traders looking to align with medium- to long-term trends, while maintaining disciplined risk control and minimal trade frequency.
How It Works
This strategy leverages three key components:
Supertrend Indicator
A trend-following indicator based on Average True Range (ATR).
Identifies bullish/bearish trend direction by plotting a trailing stop line that moves with price volatility.
200-period Exponential Moving Average (EMA) Filter
Trades are only taken when the price is above the EMA, ensuring participation only during confirmed uptrends.
Helps filter out counter-trend entries during market pullbacks or ranges.
ATR-Based Stop Loss and Take Profit
Each trade uses the ATR to calculate volatility-adjusted exit levels.
Stop Loss: 1× ATR below entry.
Take Profit: 4× ATR above entry (1:4 R:R).
This asymmetry ensures that even with a lower win rate, the strategy can remain profitable.
Entry Conditions
A long trade is triggered when:
Supertrend flips from bearish to bullish (trend reversal).
Price closes above the Supertrend line.
Price is above the 200 EMA (bullish market bias).
Exit Logic
Once a long position is entered:
Stop loss is set 1 ATR below entry.
Take profit is set 4 ATR above entry.
The strategy automatically exits the position on either target.
Backtest Settings
This strategy is configured for realistic backtesting, including:
$10,000 account size
2% equity risk per trade
0.1% commission
1 tick slippage
These settings aim to simulate real-world conditions and avoid overly optimistic results.
How to Use
Apply the script to any timeframe, though higher timeframes (1H, 4H, Daily) often yield more reliable signals.
Works best in clearly trending markets (especially in crypto, stocks, indices).
Can be paired with alerts for live trading or analysis.
Important Notes
This version is long-only by design. No short positions are executed.
Ideal for swing traders or position traders seeking asymmetric returns.
Users can modify the ATR period, Supertrend factor, or EMA filter length based on asset behavior.

Qullamaggie [Modified] | FractalystWhat's the purpose of this strategy?
The strategy aims to identify high-probability breakout setups in trending markets, inspired by Kristjan "Qullamaggie" Kullamägi’s approach.
It focuses on capturing explosive price moves after periods of consolidation, using technical criteria like moving averages, breakouts, trailing stop-loss and momentum confirmation.
Ideal for swing traders seeking to ride strong trends while managing risk.
----
How does the strategy work?
The strategy follows a systematic process to capture high-momentum breakouts:
Pre-Breakout Criteria:
Prior Price Surge: Identifies stocks that have rallied 30-100%+ in recent month(s), signaling strong underlying momentum (per Qullamaggie’s volatility expansion principles).
Consolidation Phase: Looks for a tightening price range (e.g., flag, pennant, or tight base), indicating a potential "coiling" before continuation.
Trend Confirmation: Uses moving averages (e.g., 20/50/200 EMA) to ensure the stock is trading above key averages on the daily chart, confirming an uptrend.
Price Break: Enters when price clears the consolidation high with conviction.
Risk Management:
Initial Stop Loss: Placed below the consolidation low or a recent swing point to limit downside.
Break-Even Adjustment: Moves stop loss to breakeven once the trade reaches 1.5x risk-to-reward (RR), securing a "free trade" while letting winners run.
Trailing Stop (Unique Edge):
Market Structure Trailing: Instead of trailing via moving averages, the stop is dynamically adjusted using structural invalidation level. This adapts to price action, allowing the trade to stay open during volatile retracements while locking in gains as new structure forms.
Why This Matters: Most strategies use rigid trailing stops (e.g., below the 10EMA), which often exit prematurely in choppy markets. By trailing based on structure, this strategy avoids "noise" and captures larger trends, directly boosting overall returns.
----
What markets or timeframes is this suited for?
This is a long-only strategy designed for trending markets, and it performs best in:
Markets: Stocks (especially high-growth, liquid equities), cryptocurrencies (major pairs with strong volatility), commodities (e.g., oil, gold), and futures (index/commodity futures).
Timeframes: Primarily daily charts for swing trades (1-30 day holds), though weekly charts can help confirm broader trends.
Key Advantage: The TradingView script allows instant backtesting with adjustable parameters
You can:
- Test historical performance across multiple markets to identify which assets align best with the strategy.
- Optimize settings (e.g., trailing stop sensitivity, moving averages etc.) to match a market’s volatility profile.
Build a diversified portfolio by filtering for markets that show consistent profitability in backtests.
For example, you might discover cryptos require tighter trailing stops due to volatility, while stocks thrive with wider structural stops. The script automates this analysis, letting you to trade confidently.
----
What indicators or tools does the strategy use?
The strategy combines customizable technical tools with strict anti-lookahead safeguards:
Core Indicators:
Moving Averages: Adjustable periods (e.g., 20/50/200 EMA or SMA) and timeframes (daily/weekly) to confirm trend alignment. Users can test combinations (e.g., 10EMA vs. 20EMA) to optimize for specific markets.
Breakout Parameters:
Consolidation Length: Adjustable window to define the "tightness" of the pre-breakout pattern.
Entry Models: Flexible entry logics (Breakouts and fractals)
Anti-Lookahead Design:
All calculations (e.g., moving averages, consolidation ranges, volume averages) use only closed/confirmed data available at the time of the signal.
----
How do I manage risk with this strategy?
The strategy prioritizes customizable risk controls to align with your trading style and account size:
User-Defined Risk Inputs:
Risk Per Trade: Set a % of Equity (e.g., 1-2%) to determine position size. The strategy auto-calculates shares/contracts to match your selected risk per trade.
Flexibility: Choose between fixed risk or equity-based scaling.
The script adjusts position sizing dynamically based on your selection.
Pyramiding Feature:
Customizable Entries: Adjust the number of pyramiding trades allowed (e.g., 1-3 additional positions) in the strategy settings. Each new entry is triggered only if the prior trade hits its 1.5x RR target and the trend remains intact.
Risk-Scaled Additions: New positions use profits from prior trades, compounding gains without increasing initial risk.
Risk-Free Trade Mechanic:
Once a trade reaches 1.5x RR, the stop loss is moved to breakeven, eliminating downside risk.
The strategy then opens a new position (if pyramiding is enabled) using a portion of the locked-in profit. This "snowballs" winners while keeping total capital exposure stable.
Impact on Net Profit & Drawdown:
Net Profit Boost: Pyramiding lets you ride multi-leg trends aggressively. For example, a 100% runner could generate 2-3x more profit vs. a single-entry approach.
Controlled Drawdowns: Since new positions are funded by profits (not initial capital), max drawdown stays anchored to your original risk per trade (e.g., 1-2% of account). Even if later entries fail, the breakeven stop on prior trades protects overall equity.
Why This Works: Most strategies either over-leverage (increasing drawdowns) or exit too early. By recycling profits into new positions only after securing risk-free capital, this approach mimics hedge fund "scaling in" tactics while staying retail-trader friendly.
----
How does the strategy identify market structure for its trailing stoploss?
The strategy identifies market structure by utilizing an efficient logic with for loops to pinpoint the first swing candle that features a pivot of 2. This marks the beginning of the break of structure, where the market's previous trend or pattern is considered invalidated or changed.
----
What are the underlying calculations?
The underlying calculations involve:
Identifying Swing Points: The strategy looks for swing highs (marked with blue Xs) and swing lows (marked with red Xs). A swing high is identified when a candle's high is higher than the highs of the candles before and after it. Conversely, a swing low is when a candle's low is lower than the lows of the candles before and after it.
Break of Structure (BOS):
Bullish BOS: This occurs when the price breaks above the swing high level of the previous structure, indicating a potential shift to a bullish trend.
Bearish BOS: This happens when the price breaks below the swing low level of the previous structure, signaling a potential shift to a bearish trend.
Structural Liquidity and Invalidation:
Structural Liquidity: After a break of structure, liquidity levels are updated to the first swing high in a bullish BOS or the first swing low in a bearish BOS.
Structural Invalidation: If the price moves back to the level of the first swing low before the bullish BOS or the first swing high before the bearish BOS, it invalidates the break of structure, suggesting a potential reversal or continuation of the previous trend.
This method provides users with a technical approach to filter market regimes, offering an advantage by minimizing the risk of overfitting to historical data, which is often a concern with traditional indicators like moving averages.
By focusing on identifying pivotal swing points and the subsequent breaks of structure, the strategy maintains a balance between sensitivity to market changes and robustness against historical data anomalies, ensuring a more adaptable and potentially more reliable market analysis tool.
----
What entry criteria are used in this script?
The script uses two entry models for trading decisions: BreakOut and Fractal.
Underlying Calculations:
Breakout: The script records the most recent swing high by storing it in a variable. When the price closes above this recorded level, and all other predefined conditions are satisfied, the script triggers a breakout entry. This approach is considered conservative because it waits for the price to confirm a breakout above the previous high before entering a trade. As shown in the image, as soon as the price closes above the new candle (first tick), the long entry gets taken. The stop-loss is initially set and then moved to break-even once the price moves in favor of the trade.
Fractal: This method involves identifying a swing low with a period of 2, which means it looks for a low point where the price is lower than the two candles before and after it. Once this pattern is detected, the script executes the trade. This is an aggressive approach since it doesn't wait for further price confirmation. In the image, this is represented by the 'Fractal 2' label where the script identifies and acts on the swing low pattern.
----
What type of stop-loss identification method are used in this strategy?
This strategy employs two types of stop-loss methods: Initial Stop-loss and Trailing Stop-Loss.
Underlying Calculations:
Initial Stop-loss:
ATR Based: The strategy uses the Average True Range (ATR) to set an initial stop-loss, which helps in accounting for market volatility without predicting price direction.
Calculation:
- First, the True Range (TR) is calculated for each period, which is the greatest of:
- Current Period High - Current Period Low
- Absolute Value of Current Period High - Previous Period Close
- Absolute Value of Current Period Low - Previous Period Close
- The ATR is then the moving average of these TR values over a specified period, typically 14 periods by default. This ATR value can be used to set the stop-loss at a distance from the entry price that reflects the current market volatility.
Swing Low Based:
For this method, the stop-loss is set based on the most recent swing low identified in the market structure analysis. This approach uses the lowest point of the recent price action as a reference for setting the stop-loss.
Trailing Stop-Loss:
The strategy uses structural liquidity and structural invalidation levels across multiple timeframes to adjust the stop-loss once the trade is profitable. This method involves:
Detecting Structural Liquidity: After a break of structure, the liquidity levels are updated to the first swing high in a bullish scenario or the first swing low in a bearish scenario. These levels serve as potential areas where the price might find support or resistance, allowing the stop-loss to trail the price movement.
Detecting Structural Invalidation: If the price returns to the level of the first swing low before a bullish break of structure or the first swing high before a bearish break of structure, it suggests the trend might be reversing or invalidating, prompting the adjustment of the stop-loss to lock in profits or minimize losses.
By using these methods, the strategy dynamically adjusts the initial stop-loss based on market volatility, helping to protect against adverse price movements while allowing for enough room for trades to develop. The ATR-based stop-loss adapts to the current market conditions by considering the volatility, ensuring that the stop-loss is not too tight during volatile periods, which could lead to premature exits, nor too loose during calm markets, which might result in larger losses. Similarly, the swing low based stop-loss provides a logical exit point if the market structure changes unfavorably.
Each market behaves differently across various timeframes, and it is essential to test different parameters and optimizations to find out which trailing stop-loss method gives you the desired results and performance. This involves backtesting the strategy with different settings for the ATR period, the distance from the swing low, and how the trailing stop-loss reacts to structural liquidity and invalidation levels.
Through this process, you can tailor the strategy to perform optimally in different market environments, ensuring that the stop-loss mechanism supports the trade's longevity while safeguarding against significant drawdowns.
----
What type of break-even method is used in this strategy? What are the underlying calculations?
Moves the initial stop-loss to the entry price when the price reaches a certain RR ratio.
Calculation:
Break-even level = Entry Price + (Initial Risk * RR Ratio)
----
What tables are available in this script?
- Summary: Provides a general overview, displaying key performance parameters such as Net Profit, Profit Factor, Max Drawdown, Average Trade, Closed Trades and more.
Total Commission: Displays the cumulative commissions incurred from all trades executed within the selected backtesting window. This value is derived by summing the commission fees for each trade on your chart.
Average Commission: Represents the average commission per trade, calculated by dividing the Total Commission by the total number of closed trades. This metric is crucial for assessing the impact of trading costs on overall profitability.
Avg Trade: The sum of money gained or lost by the average trade generated by a strategy. Calculated by dividing the Net Profit by the overall number of closed trades. An important value since it must be large enough to cover the commission and slippage costs of trading the strategy and still bring a profit.
MaxDD: Displays the largest drawdown of losses, i.e., the maximum possible loss that the strategy could have incurred among all of the trades it has made. This value is calculated separately for every bar that the strategy spends with an open position.
Profit Factor: The amount of money a trading strategy made for every unit of money it lost (in the selected currency). This value is calculated by dividing gross profits by gross losses.
Avg RR: This is calculated by dividing the average winning trade by the average losing trade. This field is not a very meaningful value by itself because it does not take into account the ratio of the number of winning vs losing trades, and strategies can have different approaches to profitability. A strategy may trade at every possibility in order to capture many small profits, yet have an average losing trade greater than the average winning trade. The higher this value is, the better, but it should be considered together with the percentage of winning trades and the net profit.
Winrate: The percentage of winning trades generated by a strategy. Calculated by dividing the number of winning trades by the total number of closed trades generated by a strategy. Percent profitable is not a very reliable measure by itself. A strategy could have many small winning trades, making the percent profitable high with a small average winning trade, or a few big winning trades accounting for a low percent profitable and a big average winning trade. Most mean-reversion successful strategies have a percent profitability of 40-80% but are profitable due to risk management control.
BE Trades: Number of break-even trades, excluding commission/slippage.
Losing Trades: The total number of losing trades generated by the strategy.
Winning Trades: The total number of winning trades generated by the strategy.
Total Trades: Total number of taken traders visible your charts.
Net Profit: The overall profit or loss (in the selected currency) achieved by the trading strategy in the test period. The value is the sum of all values from the Profit column (on the List of Trades tab), taking into account the sign.
- Monthly: Displays performance data on a month-by-month basis, allowing users to analyze performance trends over each month and year.
- Weekly: Displays performance data on a week-by-week basis, helping users to understand weekly performance variations.
- UI Table: A user-friendly table that allows users to view and save the selected strategy parameters from user inputs. This table enables easy access to key settings and configurations, providing a straightforward solution for saving strategy parameters by simply taking a screenshot with Alt + S or ⌥ + S.
User-input styles and customizations:
Please note that all background colors in the style are disabled by default to enhance visualization.
How to Use This Strategy to Create a Profitable Edge and Systems?
Choose Your Strategy mode:
- Decide whether you are creating an investing strategy or a trading strategy.
Select a Market:
- Choose a one-sided market such as stocks, indices, or cryptocurrencies.
Historical Data:
- Ensure the historical data covers at least 10 years of price action for robust backtesting.
Timeframe Selection:
- Choose the timeframe you are comfortable trading with. It is strongly recommended to use a timeframe above 15 minutes to minimize the impact of commissions/slippage on your profits.
Set Commission and Slippage:
- Properly set the commission and slippage in the strategy properties according to your broker/prop firm specifications.
Parameter Optimization:
- Use trial and error to test different parameters until you find the performance results you are looking for in the summary table or, preferably, through deep backtesting using the strategy tester.
Trade Count:
- Ensure the number of trades is 200 or more; the higher, the better for statistical significance.
Positive Average Trade:
- Make sure the average trade is above zero.
(An important value since it must be large enough to cover the commission and slippage costs of trading the strategy and still bring a profit.)
Performance Metrics:
- Look for a high profit factor, and net profit with minimum drawdown.
- Ideally, aim for a drawdown under 20-30%, depending on your risk tolerance.
Refinement and Optimization:
- Try out different markets and timeframes.
- Continue working on refining your edge using the available filters and components to further optimize your strategy.
What Makes This Strategy Unique?
This strategy combines flexibility, smart risk management, and momentum focus in a way that’s rare and practical:
1. Adapts to Any Market Rhythm
Works on daily, weekly, or intraday charts without code changes.
Uses two entry types: classic breakouts (like trending stocks) or fractal patterns (to avoid false starts).
2. Smarter Stop-Loss System
No rigid rules: Stops adjust based on price structure (e.g., new “higher lows”), not fixed percentages.
Avoids whipsaws: Tightens stops only when the trend strengthens, not in choppy markets.
3. Safe Profit-Boosting Pyramiding
Adds new positions only after prior trades are risk-free (stops moved above breakeven).
Scales up using locked-in profits, not new capital, to grow gains safely.
4. Built-In Momentum Check
Tracks 1/3/6-month price growth to spotlight stocks with strong, lasting momentum.
Terms and Conditions | Disclaimer
Our charting tools are provided for informational and educational purposes only and should not be construed as financial, investment, or trading advice. They are not intended to forecast market movements or offer specific recommendations. Users should understand that past performance does not guarantee future results and should not base financial decisions solely on historical data.
Built-in components, features, and functionalities of our charting tools are the intellectual property of @Fractalyst Unauthorized use, reproduction, or distribution of these proprietary elements is prohibited.
- By continuing to use our charting tools, the user acknowledges and accepts the Terms and Conditions outlined in this legal disclaimer and agrees to respect our intellectual property rights and comply with all applicable laws and regulations.

Bollinger Bands by Abu ElyasBollinger Bands with Adjustable Stop Loss (Long-Only)
This strategy uses a Bollinger Band breakout approach to enter long positions and incorporates an adjustable stop loss for risk management.
Below is an overview of the logic, parameters, and usage instructions.
1. Bollinger Bands Logic
Basis (Middle Band): A moving average (type selectable by the user) of the chosen source, typically the closing price.
Upper Band: The basis plus a specified number of standard deviations (user-defined multiplier).
Lower Band: The basis minus the same number of standard deviations.
2. Entry Triggers
The strategy enters a long position when the close price rises above the upper Bollinger Band , suggesting a potential bullish breakout.
This logic is only applied within a user-specified date range (adjustable in the strategy’s inputs).
3. Exit Triggers
1. Bollinger Band Exit:
If the close price drops below the lower Bollinger Band , the strategy closes the position, indicating a loss of bullish momentum.
2. Stop Loss Exit:
A default 8% stop loss is set, which automatically exits the trade if the close falls 8% below the entry price.
This stop-loss percentage is adjustable from the strategy’s settings, allowing users to tailor risk based on their preferences.
3. Date Range:
If the current bar is outside of the specified start/end dates, the strategy will also exit any open positions.
4. Position Sizing & Other Settings
1- Position Size:
By default, the script uses 100% of account equity for each trade.
2- Commissions & Slippage:
Commission is set to 0%, and slippage is set to 3 ticks.
3- Timeframe Handling:
You can select a custom timeframe or leave it blank to use the chart’s timeframe.
5. Customization
1. Bollinger Bands Parameters:
Length of the moving average, type of moving average (SMA, EMA, etc.), and the standard deviation multiplier can be adjusted.
2. Stop Loss (%)
The default stop loss of 8% can be changed in the script’s input settings to any percentage you prefer.
3. Date Filter:
Modify the start/end dates to control the historical period over which the strategy executes trades.
6. Notes & Best Practices
1- No Short Trades:
This is a long‐only strategy. It will either be in a long position or flat (no open position).
2- Risk Management:
An 8% stop loss may or may not align with your personal risk tolerance. Always adjust according to market conditions and your own trading style.
3- Market Gaps & Volatility:
In highly volatile markets, slippage or gaps can cause the actual exit price to be worse than the intended stop-loss level.
4- Test Thoroughly:
Backtest on different timeframes and market conditions. No single strategy works in all scenarios.
7. Disclaimer
Educational Use Only: This script is for informational and illustrative purposes and should not be considered financial advice.
No Guarantee of Profit: Past performance does not guarantee future results. Trading involves substantial risk, and it is possible to lose more than your initial investment.
Consult a Professional: Always consult a qualified financial advisor before making investment decisions.
Use this script as a foundation and personalize it based on your trading style, tolerance for drawdowns, and market conditions.

CBC Strategy with Trend Confirmation & Separate Stop LossCBC Flip Strategy with Trend Confirmation and ATR-Based Targets
This strategy is based on the CBC Flip concept taught by MapleStax and inspired by the original CBC Flip indicator by AsiaRoo. It focuses on identifying potential reversals or trend continuation points using a combination of candlestick patterns (CBC Flips), trend filters, and a time-based entry window. This approach helps traders avoid false signals and increase trade accuracy.
What is a CBC Flip?
The CBC Flip is a candlestick-based pattern that identifies moments when the market is likely to change direction or strengthen its trend. It checks for a shift in price behavior between consecutive candles, signaling a bullish (upward) or bearish (downward) move.
However, not all flips are created equal! This strategy differentiates between Strong Flips and All Flips, allowing traders to choose between a more conservative or aggressive approach.
Strong Flips vs. All Flips
Strong Flips
A Strong Flip is a high-probability setup that occurs only after liquidity is swept from the previous candle’s high or low.
What is a liquidity sweep? This happens when the price briefly moves beyond the high or low of the previous candle, triggering stop-losses and trapping traders in the wrong direction. These sweeps often create fuel for the next move, making them powerful reversal signals.
Examples:
Long Setup: The price dips below the previous candle’s low (sweeping liquidity) and then closes higher, signaling a potential bullish move.
Short Setup: The price moves above the previous candle’s high and then closes lower, signaling a potential bearish move.
Why Use Strong Flips?
They provide fewer signals, but the accuracy is generally higher.
Ideal for trending markets where liquidity sweeps often mark key turning points.
All Flips
All Flips are less selective, offering both Strong Flips and additional signals without requiring a liquidity sweep.
This approach gives traders more frequent opportunities but comes with a higher risk of false signals, especially in sideways markets.
Examples:
Long Setup: A CBC flip occurs without sweeping the previous low, but the trend direction is confirmed (slow EMA is still above VWAP).
Short Setup: A CBC flip occurs without sweeping the previous high, but the trend is still bearish (slow EMA below VWAP).
Why Use All Flips?
Provides more frequent entries for active or aggressive traders.
Works well in trending markets but requires caution during consolidation periods.
How This Strategy Works
The strategy combines CBC Flips with multiple filters to ensure better trade quality:
Trend Confirmation: The slow EMA (20-period) must be positioned relative to the VWAP to confirm the overall trend direction.
Long Trades: Slow EMA must be above VWAP (upward trend).
Short Trades: Slow EMA must be below VWAP (downward trend).
Time-Based Filter: Traders can specify trading hours to limit entries to a particular time window, helping avoid low-volume or high-volatility periods.
Profit Target and Stop-Loss:
Profit Target: Defined as a multiple of the 14-period ATR (Average True Range). For example, if the ATR is 10 points and the profit target multiplier is set to 1.5, the strategy aims for a 15-point profit.
Stop-Loss: Uses a dynamic, candle-based stop-loss:
Long Trades: The trade closes if the market closes below the low of two candles ago.
Short Trades: The trade closes if the market closes above the high of two candles ago.
This approach adapts to recent price behavior and protects against unexpected reversals.
Customizable Settings
Strong Flips vs. All Flips: Choose between a more selective or aggressive entry style.
Profit Target Multiplier: Adjust the ATR multiplier to control the distance for profit targets.
Entry Time Range: Define specific trading hours for the strategy.
Indicators and Visuals
Fast EMA (10-Period) – Black Line
Slow EMA (20-Period) – Red Line
VWAP (Volume-Weighted Average Price) – Orange Line
Visual Labels:
▵ (Triangle Up) – Marks long entries (buy signals).
▿ (Triangle Down) – Marks short entries (sell signals).
Credits
CBC Flip Concept: Inspired by MapleStax, who teaches this concept.
Original Indicator: Developed by AsiaRoo, this strategy builds on the CBC Flip framework with additional features for improved trade management.
Risks and Disclaimer
This strategy is for educational purposes only and does not constitute financial advice.
Trading involves significant risk and may result in the loss of capital. Past performance does not guarantee future results. Use this strategy in a simulated environment before applying it to live trading.

XAU-USD - OANDA - Updated Jan 2025 - by PB ver 5Script Title: XAU-USD - OANDA - Updated Jan 2025 - by PB ver 5
Description:
This strategy is designed for trading XAU/USD (Gold) on the OANDA platform, optimized with a session-based filter and Renko bar indicators for enhanced price action analysis. The script utilizes trailing stop loss functionality to manage risk effectively and allows flexibility for both long and short trades.
Key Features:
Date Filter: This strategy includes a time filter to backtest the performance from January 1st, 2025 to December 31st, 2025. Users can enable or disable the filter based on their preference.
Session Filter: Customizable session inputs allow the user to define the active trading session using a time range (default is 09:20-15:16) and the days of the week (default is all days, 1-7). The strategy will only enter trades during the active session, ensuring more controlled and focused trading.
Renko Bar Strategy: This strategy uses Renko charts, a popular price action tool, to detect buy and sell signals based on the crossover of Renko close and open prices. Users can adjust the Renko block size and the Renko value used for detecting price action shifts.
Trailing Stops: The script applies a trailing stop loss mechanism for both long and short trades. The trailing stop is dynamically updated to follow the market as prices move in favor of the trade. It uses a 5000-point trailing stop (adjustable by the user).
Flexible Trade Settings: Users can enable or disable long and short positions through simple toggle switches. The strategy allows for full control over trade entry and exit.
How It Works:
Long Trades: A long position is entered when the Renko close crosses above the Renko open. The position will be exited using a trailing stop, which follows the price in the market.
Short Trades: A short position is entered when the Renko close crosses below the Renko open. The position will also exit using a trailing stop.
The strategy will automatically close positions if the session ends or if the user manually exits the trades.
Customization Options:
Backtest Date Range: Set the start and end dates to backtest the strategy over a specific time period.
Session and Days: Adjust the session time and which days of the week the strategy is active.
Renko Block Size: Customize the Renko block size for finer control over price action signals.
Trailing Stop Distance: Adjust the trailing stop loss to your preferred risk levels.
Limitations and Considerations:
Renko Charting: Renko charts may not suit every trading style, as they are based on price movement rather than time. This strategy is designed for traders who prefer this style of charting.
Backtest Results: Always review the strategy's backtest results with realistic parameters. The strategy uses historical data, and past performance is not indicative of future results. Be aware of slippage and commission costs in real-world trading scenarios.
Manual Intervention: Users should monitor active trades and intervene manually if required.
Ideal Usage:
This strategy is suited for traders looking to use price action-based strategies with Renko charts for XAU/USD on the OANDA platform.
Ideal for those who want to automate their entry and exit points with trailing stop mechanisms while having control over the session time and backtesting period.
Disclaimer:
Past performance does not guarantee future results. Always use caution when using trading strategies and adjust parameters based on market conditions. The strategy is provided for educational purposes and should be tested on paper before live trading.
Outside Bar Strategy % (Alessio)Outside Bar Strategy %
This strategy is based on identifying Outside Bars, which occur when the current bar's high is higher than the previous bar's high and its low is lower than the previous bar's low. The strategy enters trades in the direction of the Outside Bar, offering a powerful way to capture price moves following a strong price expansion.
Key Features:
Long and Short Entries: The strategy enters a Long trade when the Outside Bar closes bullish (current close > open), and a Short trade when the Outside Bar closes bearish (current close < open).
Customizable Entry Levels: The entry point is calculated based on a customizable percentage of the Outside Bar's range, allowing flexibility for traders to fine-tune their entries at 50% or 70% of the bar's range.
Stop Loss (SL) and Take Profit (TP):
Stop Loss (SL) is automatically placed at the Outside Bar's low for Long trades and at its high for Short trades.
Take Profit (TP) is calculated as a percentage of the Outside Bar's range, with customizable settings for take-profit levels.
Visual Indicators:
Entry, Stop Loss, and Take Profit levels are plotted as lines on the chart, with customizable colors and widths for easy identification.
Labels are placed on the chart to indicate whether the trade is Long or Short, positioned above or below the Outside Bar's candlestick.
Alerts: Users can enable alerts to receive notifications when a trade is triggered, including details such as entry points and stop loss levels.
Strategy Parameters:
Entry Percentage: Set the entry level as a percentage of the Outside Bar's range (e.g., 50%, 70%).
Take Profit Percentage: Customize the Take Profit level as a percentage of the Outside Bar's range.
Customizable Colors and Line Widths: Adjust the colors and thickness of the entry, stop loss, and take profit lines to fit your preferences.
Alerts: Enable alerts to be notified when a trade is executed or when the entry level is reached.
This strategy is ideal for traders who want to capitalize on significant price moves after a breakout, with clear risk management through Stop Loss and Take Profit levels. The customizable features make it suitable for various market conditions and trading styles.

DAILY Supertrend + EMA Crossover with RSI FilterThis strategy is a technical trading approach that combines multiple indicators—Supertrend, Exponential Moving Averages (EMAs), and the Relative Strength Index (RSI)—to identify and manage trades.
Core Components:
1. Exponential Moving Averages (EMAs):
Two EMAs, one with a shorter period (fast) and one with a longer period (slow), are calculated. The idea is to spot when the faster EMA crosses above or below the slower EMA. A fast EMA crossing above the slow EMA often suggests upward momentum, while crossing below suggests downward momentum.
2. Supertrend Indicator:
The Supertrend uses Average True Range (ATR) to establish dynamic support and resistance lines. These lines shift above or below price depending on the prevailing trend. When price is above the Supertrend line, the trend is considered bullish; when below, it’s considered bearish. This helps ensure that the strategy trades only in the direction of the overall trend rather than against it.
3. RSI Filter:
The RSI measures momentum. It helps avoid buying into markets that are already overbought or selling into markets that are oversold. For example, when going long (buying), the strategy only proceeds if the RSI is not too high, and when going short (selling), it only proceeds if the RSI is not too low. This filter is meant to improve the quality of the trades by reducing the chance of entering right before a reversal.
4. Time Filters:
The strategy only triggers entries during user-specified date and time ranges. This is useful if one wants to limit trading activity to certain trading sessions or periods with higher market liquidity.
5. Risk Management via ATR-based Stops and Targets:
Both stop loss and take profit levels are set as multiples of the ATR. ATR measures volatility, so when volatility is higher, both stops and profit targets adjust to give the trade more breathing room. Conversely, when volatility is low, stops and targets tighten. This dynamic approach helps maintain consistent risk management regardless of market conditions.
Overall Logic Flow:
- First, the market conditions are analyzed through EMAs, Supertrend, and RSI.
- When a buy (long) condition is met—meaning the fast EMA crosses above the slow EMA, the trend is bullish according to Supertrend, and RSI is below the specified “overbought” threshold—the strategy initiates or adds to a long position.
- Similarly, when a sell (short) condition is met—meaning the fast EMA crosses below the slow EMA, the trend is bearish, and RSI is above the specified “oversold” threshold—it initiates or adds to a short position.
- Each position is protected by an automatically calculated stop loss and a take profit level based on ATR multiples.
Intended Result:
By blending trend detection, momentum filtering, and volatility-adjusted risk management, the strategy aims to capture moves in the primary trend direction while avoiding entries at excessively stretched prices. Allowing multiple entries can potentially amplify gains in strong trends but also increases exposure, which traders should consider in their risk management approach.
In essence, this strategy tries to ride established trends as indicated by the Supertrend and EMAs, filter out poor-quality entries using RSI, and dynamically manage trade risk through ATR-based stops and targets.
