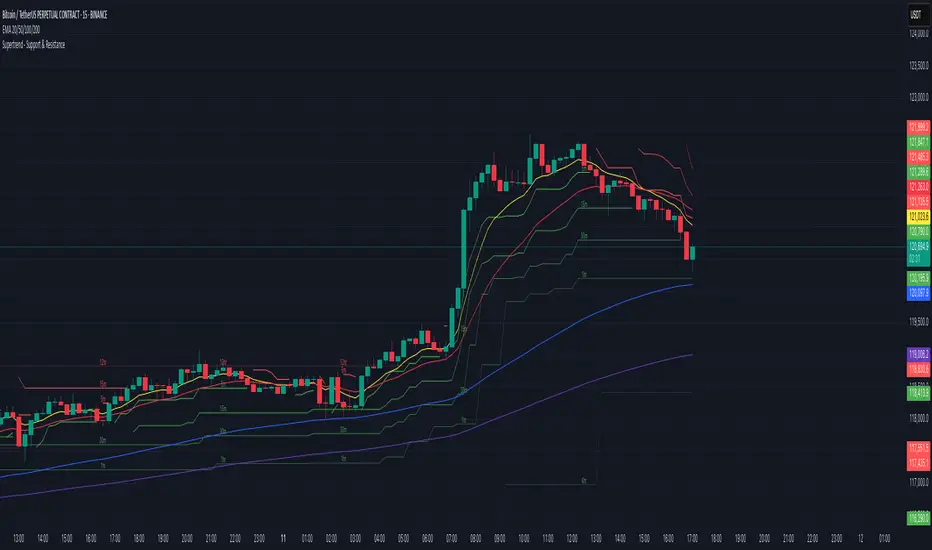
Supertrend - Support & ResistanceSupertrend – Multi-Timeframe Support & Resistance
This script overlays multiple Supertrend bands from higher timeframes on a single chart and treats them as dynamic support and resistance. The goal is simple: see the bigger picture without leaving your current timeframe.
What it does
• Calculates Supertrend using the same ATR Length and Factor across 5m, 15m, 30m, 1h, 4h, 8h, 12h, and 1D.
• Pulls each timeframe via request.security(..., lookahead_off) so values only update on candle close. No look-ahead, no “teleporting” lines.
• Plots each timeframe’s Supertrend as an on-chart band with increasing transparency the higher you go, so you can visually separate short-term vs higher-timeframe structure.
• Colors indicate direction:
• Green = bearish band above price (acting as resistance)
• Red = bullish band below price (acting as support)
• Drops compact labels (5m, 15m, 30m, etc.) every 20 bars right on the corresponding Supertrend level, so you can quickly identify which line belongs to which timeframe.
Why this helps
Supertrend is great for trend definition and trailing stops. But one timeframe alone can whipsaw you. By stacking multiple timeframes:
• Confluence stands out. When several higher-TF bands cluster, price often reacts.
• You see where intraday pullbacks are likely to pause (lower TF bands) and where trend reversals are more meaningful (higher TF bands).
• It’s easier to align entries with the dominant trend while still timing them on your working timeframe.
How it works (quick refresher)
Supertrend uses ATR to offset a median price with a multiplier (Factor). When price crosses the band, direction flips and the trailing line switches sides. This script exposes:
• ATR Length (default 10): sensitivity of the ATR. Smaller = tighter band, more flips. Larger = smoother, fewer flips.
• Factor (default 3.0): multiplier applied to ATR. Larger = wider band, more conservative.
The same settings are used for all timeframes for clean, apples-to-apples comparisons.
How to use it
• Trend alignment: Prefer longs when most higher-TF lines are below price (red support). Prefer shorts when most are above price (green resistance).
• Pullback entries: In an uptrend, look for pullbacks into a lower-TF red band that lines up near a higher-TF red band. That overlap is your “zone.”
• Breakout confirmation: A strong break and close beyond a higher-TF band carries more weight than a lower-TF poke.
• Stops and targets: Use the nearest opposing band as a logic point. For example, in a long, if price loses the lower-TF red band and the next higher-TF band is close overhead, trim or tighten.
Signals you can read at a glance
• Stacking: Multiple red bands beneath price = strong bullish structure. Multiple green bands above price = strong bearish structure.
• Compression: Bands from different TFs squeezing together often precede expansion.
• Flip zones: When a higher-TF band flips side, treat that level as newly minted support/resistance.
Design choices in the code
• lookahead_off on all request.security calls avoids repainting from future data.
• Increasing transparency as the timeframe rises makes lower-TF context visible without drowning the chart.
• Labels every 20 bars keep the chart readable while still giving you frequent anchors.
Good to know (limits and tips)
• This is an overlay of closed-bar Supertrend values from higher TFs. Intrabar moves can still exceed a band before close; final signal prints at candle close of that timeframe.
• Using the same ATR/factor across TFs makes confluence easier to judge. If you need independent tuning per TF, you can clone the security calls and add separate inputs.
• On very low timeframes with many symbols, multiple request.security calls can be heavy. If performance drops, hide one or two higher TFs or increase the label spacing.
Risk note
This is a context tool, not an auto-trader. Combine it with structure (HH/HL vs LH/LL), volume, and your execution rules. Always test on your market and timeframe before committing real capital.
스크립트에서 "pullback"에 대해 찾기
Rate of Change HistogramExplanation of Modifications
Converting ROC to Histogram:
Original ROC: The ROC is calculated as roc = 100 * (source - source ) / source , plotted as a line oscillating around zero.
Modification: Instead of plotting roc as a line, it’s now plotted as a histogram using style=plot.style_columns. This makes the ROC values visually resemble the MACD histogram, with bars extending above or below the zero line based on momentum.
Applying MACD’s Four-Color Scheme:
Logic: The histogram’s color is determined by:
Above Zero (roc >= 0): Bright green (#26A69A) if ROC is rising (roc > roc ), light green (#B2DFDB) if falling (roc < roc ).
Below Zero (roc < 0): Bright red (#FF5252) if ROC is falling (roc < roc ), light red (#FFCDD2) if rising (roc > roc ).
Implementation: Used the exact color logic and hex codes from the MACD code, applied to the ROC histogram. This highlights momentum ebbs (falling ROC, fading waves) and flows (rising ROC, strengthening waves).
Removing Signal Line:
Unlike the previous attempt, no signal line is added. The histogram is purely the ROC value, ensuring it directly reflects price change momentum without additional smoothing, making it faster and more responsive to pulse waves, as you indicated ROC performs better than other oscillators.
Alert Conditions:
Added alerts to match the MACD’s logic, triggering when the ROC histogram crosses the zero line:
Rising to Falling: When roc >= 0 and roc < 0, signaling a potential wave peak (e.g., end of Wave 3 or C).
Falling to Rising: When roc <= 0 and roc > 0, indicating a potential wave bottom (e.g., start of Wave 1 or rebound).
These alerts help identify transitions in 3-4 wave pulse patterns.
Plotting:
Histogram: Plotted as columns (plot.style_columns) with the four-color scheme, directly representing ROC momentum.
Zero Line: Kept the gray zero line (#787B86) for reference, consistent with the MACD.
Removed ROC Line/Signal Line: Since you want the ROC to act as the histogram itself, no additional lines are plotted.
Inputs:
Retained the original length (default 9) and source (default close) inputs for consistency.
Removed signal-related inputs (e.g., signal_length, sma_signal) as they’re not needed for a pure ROC histogram.
How This ROC Histogram Works for Wave Pulses
Wave Alignment:
Above Zero (Bullish Momentum): Positive ROC bars indicate flows (e.g., impulse Waves 1, 3, or rebounds in Wave B/C). Bright green bars show accelerating momentum (strong pulses), while light green bars suggest fading momentum (potential wave tops).
Below Zero (Bearish Momentum): Negative ROC bars indicate ebbs (e.g., corrective Waves 2, 4, A, or C). Bright red bars show increasing bearish momentum (strong pullbacks), while light red bars suggest slowing declines (potential wave bottoms).
3-4 Wave Pulses:
In a 3-wave A-B-C correction: Wave A (down) shows bright red bars (falling ROC), Wave B (up) shows bright/light green bars (rising ROC), and Wave C (down) shifts back to red bars.
In a 4-wave consolidation: Alternating green/red bars highlight the rhythmic ebbs and flows as momentum oscillates.
Timing:
Zero-line crossovers mark wave transitions (e.g., from Wave 2 to Wave 3).
Color changes (e.g., bright to light green) signal momentum shifts within waves, helping identify pulse peaks/troughs.
Advantages Over MACD:
The ROC histogram is more responsive than the MACD histogram because ROC directly measures price change percentage, while MACD relies on moving average differences, which introduce lag. This makes the ROC histogram better for capturing rapid 3-4 wave pulses, as you noted.
Example Usage
For a stock with 3-4 wave pulses on a 5-minute chart:
Wave 1 (Flow): ROC rises above zero, histogram turns bright green (rising momentum), indicating a strong bullish pulse.
Wave 2 (Ebb): ROC falls below zero, histogram shifts to bright red (falling momentum), signaling a corrective pullback.
Wave 3 (Flow): ROC crosses back above zero, histogram becomes bright green again, confirming a powerful pulse.
Wave 4 (Ebb): ROC dips slightly, histogram turns light green (falling momentum above zero) or light red (rising momentum below zero), indicating consolidation.
Alerts trigger on zero-line crosses (e.g., from Wave 2 to Wave 3), helping time trades.
Settings Recommendations
Default (length=9): Works well for most time frames, balancing sensitivity and smoothness.
Intraday Pulses: Use length=5 or length=7 for faster signals on 5-minute or 15-minute charts.
Daily Charts: Try length=12 or length=14 for broader wave cycles.
Testing: Apply to a stock with clear wave patterns (e.g., tech stocks like AAPL or TSLA) and adjust length to match the pulse frequency you observe.
Notes
Confirmation: Pair the ROC histogram with price action (e.g., Fibonacci retracements, support/resistance) to validate wave counts, as momentum oscillators can be noisy in choppy markets.
Divergences: Watch for divergences (e.g., price makes a higher high, but ROC histogram bars are lower) to spot wave reversals, especially at Wave 3 or C ends.
Comparison to MACD: The ROC histogram is faster and more direct, making it ideal for short-term pulse waves, but it may be more volatile, so use with technical levels for precision.

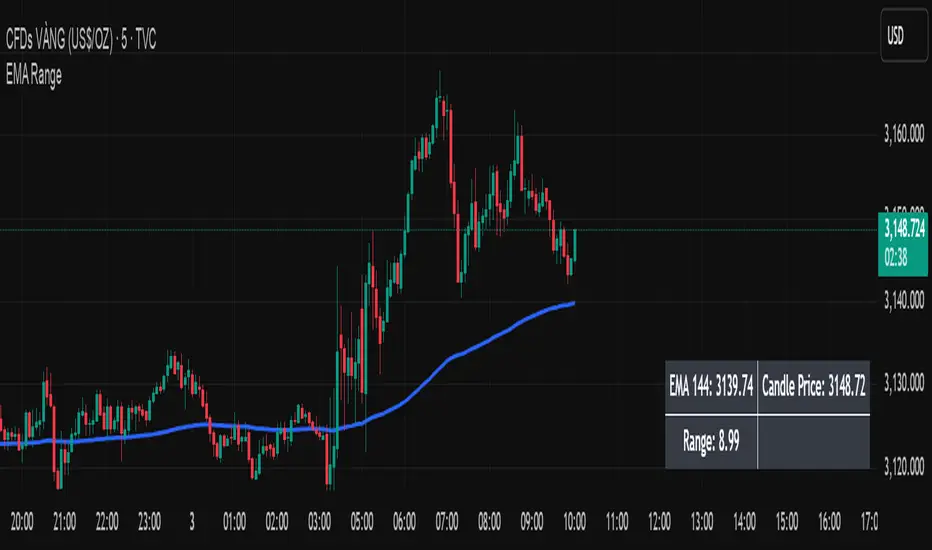
EMA Price Range by tuanduongEMA Price Range Indicator – Dynamic Range Analysis with Custom EMA (tuanduong2511)
Overview
The EMA Price Range Indicator is designed to help traders visualize the distance between price action and a key Exponential Moving Average (EMA). This indicator dynamically calculates the range from each candle to a user-defined EMA and displays it in a real-time table. By understanding the relationship between price and the EMA, traders can better gauge potential support, resistance, and overextension in the market.
Key Features
✅ Customizable EMA – Allows users to choose the EMA period that best suits their strategy (default: 144).
✅ Real-Time Range Calculation – Computes the absolute difference between the EMA and the price (using the high or low, depending on whether the candle is above or below the EMA).
✅ Minimalist UI – The EMA is plotted directly on the chart, while a small table in the bottom-right corner provides numerical insights, reducing chart clutter.
✅ Versatile Use Cases – Suitable for trend-following traders (identifying pullbacks to EMA) and mean-reversion traders (spotting extended price movements).
How It Works
User-Defined EMA:
The script calculates an Exponential Moving Average (EMA) based on the selected period.
EMA adapts dynamically, giving more weight to recent price movements.
Range Calculation:
If the price is above the EMA, the range is measured from the high point of the candle to the EMA.
If the price is below the EMA, the range is measured from the low point of the candle to the EMA.
This approach ensures that we’re measuring the most relevant distance for price interaction.
Live Table Display:
The current EMA value and the distance (range) from the price are displayed in a small table in the bottom-right corner of the chart.
How to Use It
📌 Trend Traders: Use the indicator to track pullbacks to key EMAs (e.g., EMA 50, 144, or 200). When the price is far from the EMA, it may indicate an overextended trend or potential retracement zone.
📌 Mean Reversion Traders: Look for extreme deviations between price and the EMA. Large distances can signal potential price snapbacks to the mean.
📌 Scalping & Day Trading: Short-term traders can use it with fast EMAs (e.g., EMA 21 or 34) to measure quick price movements relative to short-term momentum.
Why This Indicator?
Unlike traditional EMA indicators, which only plot a moving average, this script provides quantifiable price distance to the EMA, helping traders make data-driven decisions. It allows traders to answer:
✅ Is the price stretched too far from the EMA?
✅ Should I wait for a pullback before entering?
✅ Is the trend strong, or is the price losing momentum?
By integrating EMA-based range analysis, traders gain a clearer understanding of market conditions and can improve their entry, exit, and risk management strategies.
BTCUSD with adjustable sl,tpThis strategy is designed for swing traders who want to enter long positions on pullbacks after a short-term trend shift, while also allowing immediate short entries when conditions favor downside movement. It combines SMA crossovers, a fixed-percentage retracement entry, and adjustable risk management parameters for optimal trade execution.
Key Features:
✅ Trend Confirmation with SMA Crossover
The 10-period SMA crossing above the 25-period SMA signals a bullish trend shift.
The 10-period SMA crossing below the 25-period SMA signals a bearish trend shift.
Short trades are only taken if the price is below the 150 EMA, ensuring alignment with the broader trend.
📉 Long Pullback Entry Using Fixed Percentage Retracement
Instead of entering immediately on the SMA crossover, the strategy waits for a retracement before going long.
The pullback entry is defined as a percentage retracement from the recent high, allowing for an optimized entry price.
The retracement percentage is fully adjustable in the settings (default: 1%).
A dynamic support level is plotted on the chart to visualize the pullback entry zone.
📊 Short Entry Rules
If the SMA(10) crosses below the SMA(25) and price is below the 150 EMA, a short trade is immediately entered.
Risk Management & Exit Strategy:
🚀 Take Profit (TP) – Fully customizable profit target in points. (Default: 1000 points)
🛑 Stop Loss (SL) – Adjustable stop loss level in points. (Default: 250 points)
🔄 Break-Even (BE) – When price moves in favor by a set number of points, the stop loss is moved to break-even.
📌 Extra Exit Condition for Longs:
If the SMA(10) crosses below SMA(25) while the price is still below the EMA150, the strategy force-exits the long position to avoid reversals.
How to Use This Strategy:
Enable the strategy on your TradingView chart (recommended for stocks, forex, or indices).
Customize the settings – Adjust TP, SL, BE, and pullback percentage for your risk tolerance.
Observe the plotted retracement levels – When the price touches and bounces off the level, a long trade is triggered.
Let the strategy manage the trade – Break-even protection and take-profit logic will automatically execute.
Ideal Market Conditions:
✅ Trending Markets – The strategy works best when price follows strong trends.
✅ Stocks, Indices, or Forex – Can be applied across multiple asset classes.
✅ Medium-Term Holding Period – Suitable for swing trades lasting days to weeks.

Triple Differential Moving Average BraidThe Triple Differential Moving Average Braid weaves together three distinct layers of moving averages—short-term, medium-term, and long-term—providing a structured view of market trends across multiple time horizons. It is an integrated construct optimized exclusively for the 1D timeframe. For multi-timeframe analysis and/or trading the lower 1h and 15m charts, it pairs well the Granular Daily Moving Average Ribbon ... adjust the visibility settings accordingly.
Unlike traditional moving average indicators that use a single moving average crossover, this braid-style system incorporates both SMAs and EMAs. The dual-layer approach offers stability and responsiveness, allowing traders to detect trend shifts with greater confidence.
Users can, of course, specify their own color scheme. The indicator consists of three layered moving average pairs. These are named per their default colors:
1. Silver Thread – Tracks immediate price momentum.
2. Royal Guard – Captures market structure and developing trends.
3. Golden Section – Defines major market cycles and overall trend direction.
Each layer is color-coded and dynamically shaded based on whether the faster-moving average is above or below its slower counterpart, providing a visual representation of market strength and trend alignment.
🧵 Silver Thread
The Silver Thread is the fastest-moving layer, comprising the 21D SMA and a 21D EMA. The choice of 21 is intentional, as it corresponds to approximately one full month of trading days in a 5-day-per-week market and is also a Fibonacci number, reinforcing its use in technical analysis.
· The 21D SMA smooths out recent price action, offering a baseline for short-term structure.
· The 21D EMA reacts more quickly to price changes, highlighting shifts in momentum.
· When the SMA is above the EMA, price action remains stable.
· When the SMA falls below the EMA, short-term momentum weakens.
The Silver Thread is a leading indicator within the system, often flipping direction before the medium- and long-term layers follow suit. If the Silver Thread shifts bearish while the Royal Guard remains bullish, this can signal a temporary pullback rather than a full trend reversal.
👑 Royal Guard
The Royal Guard provides a broader perspective on market momentum by using a 50D EMA and a 200D EMA. EMAs prioritize recent price data, making this layer faster-reacting than the Golden Section while still offering a level of stability.
· When the 50D EMA is above the 200D EMA, the market is in a confirmed uptrend.
· When the 50D EMA crosses below the 200D EMA, momentum has shifted bearish.
This layer confirms medium-term trend structure and reacts more quickly to price changes than traditional SMAs, making it especially useful for trend-following traders who need faster confirmation than the Golden Section provides.
If the Silver Thread flips bearish while the Royal Guard remains bullish, traders may be seeing a momentary dip in an otherwise intact uptrend. Conversely, if both the Silver Thread and Royal Guard shift bearish, this suggests a deeper pullback or possible trend reversal.
📜 Golden Section
The Golden Section is the slowest and most stable layer of the system, utilizing a 50D SMA and a 200D SMA—a classic combination used by long-term traders and institutions.
· When the 50D SMA is above the 200D SMA the market is in a strong, sustained uptrend.
· When the 50D SMA falls below the 200D SMA the market is structurally bearish.
Because SMAs give equal weight to past price data, this layer moves slowly and deliberately, ensuring that false breakouts or temporary swings do not distort the bigger picture.
Traders can use the Golden Section to confirm major market trends—when all three layers are bullish, the market is strongly trending upward. If the Golden Section remains bullish while the Royal Guard turns bearish, this may indicate a medium-term correction within a larger uptrend rather than a full reversal.
🎯 Swing Trade Setups
Swing traders can benefit from the multi-layered approach of this indicator by aligning their trades with the overall market structure while capturing short-term momentum shifts.
· Bullish: Look for Silver Thread and Royal Guard alignment before entering. If the Silver Thread flips bullish first, anticipate a momentum shift. If the Royal Guard follows, this confirms a strong medium-term move.
· Bearish: If the Silver Thread turns bearish first, it may signal an upcoming reversal. Waiting for the Royal Guard to follow adds confirmation.
· Confirmation: If the Golden Section remains bullish, a pullback may be an opportunity to enter a trend continuation trade rather than exit prematurely.
🚨 Momentum Shifts
· If the Silver Thread flips bearish but the Royal Guard remains bullish, traders may opt to buy the dip rather than exit their positions.
· If both the Silver Thread and Royal Guard turn bearish, traders should exercise caution, as this suggests a more significant correction.
· When all three layers align in the same direction the market is in a strong trending phase, making swing trades higher probability.
⚠️ Risk Management
· A narrowing of the shaded areas suggests trend exhaustion—consider tightening stop losses.
· When the Golden Section remains bullish, but the other two layers weaken, potential support zones to enter or re-enter positions.
· If all three layers flip bearish, this may indicate a larger trend reversal, prompting an exit from long positions and/or consideration of short setups.
The Triple Differential Moving Average Braid is layered, structured tool for trend analysis, offering insights across multiple timeframes without requiring traders to manually compare different moving averages. It provides a powerful and intuitive way to read the market. Swing traders, trend-followers, and position traders alike can use it to align their trades with dominant market trends, time pullbacks, and anticipate momentum shifts.
By understanding how these three moving average layers interact, traders gain a deeper, more holistic perspective of market structure—one that adapts to both momentum-driven opportunities and longer-term trend positioning.

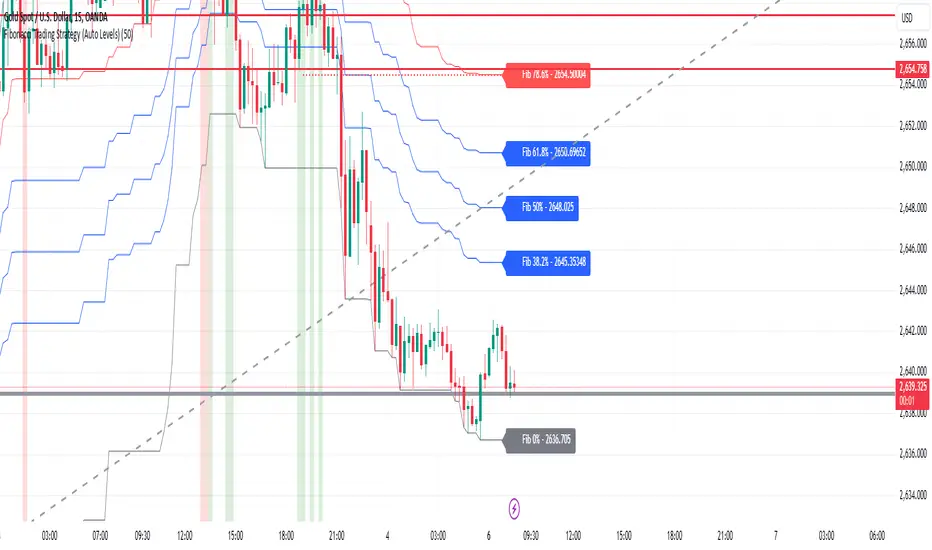
Fibonacci Trading Strategy (Auto Levels)How It Works
Swing Highs and Lows Detection:
The script identifies the highest high and lowest low over a specified lookback period (default: 50 candles). These points are used as the basis for Fibonacci calculations.
Fibonacci Levels:
Fibonacci retracement levels: 0%, 38.2%, 50%, 61.8%, 78.6%, and 100%.
Fibonacci extension levels: 127.2%, 161.8%, 200%, 261.8%, and 361.8%.
Each level is plotted on the chart with a specific color and labeled with the corresponding price.
Entry Zones:
Pullback Area: Between the 50% and 61.8% retracement levels. This area is highlighted in green, indicating a potential entry for conservative traders.
Full Margin Area: Between the 61.8% and 78.6% retracement levels. This area is highlighted in red, suggesting a higher-risk entry for aggressive traders.
Stop Loss (SL):
The Stop Loss is placed at the 78.6% Fibonacci retracement level. A dotted red line is drawn at this level to provide a visual reference for risk management.
Entry labels include the Stop Loss price for clarity.
Take Profit (TP) Levels:
Multiple take-profit targets are identified using Fibonacci extension levels (127.2%, 161.8%, 200%, 261.8%, and 361.8%).
Each level is labeled with the price and target percentage.
Visual Aids:
The script dynamically labels each Fibonacci level with its corresponding price.
Entry points (Pullback and Full Margin) are marked with clear labels, including the recommended Stop Loss.
Background highlights help distinguish the Pullback and Full Margin areas.
Strategy Highlights
Risk Management:
Incorporates a well-defined Stop Loss at the 78.6% level to limit downside risk.
Multiple take-profit levels help traders scale out of positions gradually.
Automation:
Automatically recalculates levels when new swing highs or lows are detected, ensuring accuracy in dynamic markets.
Customizability:
Users can adjust the lookback period to suit different timeframes or trading styles.
Clarity:
Clean visuals and detailed labels ensure the strategy is easy to interpret and apply.
When to Use
The strategy is suitable for trend-following traders looking to enter during pullbacks in an established trend.
It works best in trending markets where Fibonacci levels often act as strong support or resistance.
Example Scenario
Bullish Setup:
Price retraces to the 50%-61.8% area (Pullback Area) after a swing high.
A buy order is placed in this zone, with the Stop Loss at the 78.6% level.
Profit targets are set at the 127.2%, 161.8%, and higher Fibonacci extensions.
Bearish Setup:
In a downtrend, price retraces upward to the 50%-61.8% zone.
A sell order is placed, with the Stop Loss at the 78.6% level and take-profit levels below.
Granville Entry GuideThis indicator is designed to identify trade entry points using patterns 2 and 3 of the Granville's Law. It is compatible with version 6.
Determining Entry Points
・ Long Entry : When the medium-term moving average is rising, if the stock price falls close to or below the moving average and then begins to rise, with that bar being a bullish candle, it is determined as an entry point. At this time, a red circle will be displayed above the bar.
・ Short Entry : When the medium-term moving average is falling, if the stock price rises close to or above the moving average and then begins to fall, with that bar being a bearish candle, it is determined as an entry point. At this time, a blue circle will be displayed below the bar.
Trend Filter
Entry points will only be displayed if the following trend conditions are met:
・In an uptrend, the order of moving averages should be: short-term moving average, medium-term moving average, and long-term moving average from top to bottom. In a downtrend, the order should be: long-term moving average, medium-term moving average, and short-term moving average from top to bottom. The order of the short-term moving average is flexible.
・The medium-term and long-term moving averages should be inclined in the direction of the trend. The inclination of the short-term moving average is flexible.
Adjusting Parameters
・ Stock Selection : You can choose whether to use the stock price from candlesticks or the short-term moving average for determining entry points. Selecting candlesticks allows for quicker determination but increases noise, while selecting the short-term moving average slows down determination but reduces noise. The default value is the short-term moving average.
・ Determining Pullbacks or Retracements : This is determined by the number of bars on either side of the lowest point of the pullback. Increasing the number of bars reduces noise but may result in missed opportunities. The default values are 3 bars on the left and 1 bar on the right.
・ Use of Trend Filter : You can choose whether to use the trend filter. The default setting is to use it.
・ Conditions for Moving Average Inclination : You can choose whether to include the trend direction inclination in the trend filter conditions. The default setting is to include it.
・ Bar Background Color : The trend filter is displayed with the bar's background color, but it can also be set to not display.
このインジケーターは、グランビルの法則のパターン2とパターン3を利用して、トレードのエントリーポイントを見つけるためのものです。version6に対応しています。
エントリーポイントの判定方法
ロングエントリー :中期移動平均線が上昇しているとき、株価が移動平均線の近くまで落ちるか、割り込んだ後に上昇を始め、そのバーが陽線である場合にエントリーポイントと判定します。このとき、赤い丸がバーの上に表示されます。
ショートエントリー :中期移動平均線が下落しているとき、株価が移動平均線の近くまで上昇するか、上抜けた後に下落を始め、そのバーが陰線である場合にエントリーポイントと判定します。このとき、青い丸がバーの下に表示されます。
トレンドフィルター
エントリーポイントは、次のトレンド条件を満たす場合のみ表示されます。
・上昇トレンドの場合、移動平均線が上から中期移動平均線、長期移動平均線の順になっている。下降トレンドの場合、移動平均線が上から長期移動平均線、中期移動平均線の順になっている。なお短期移動平均線の順番は任意です。
・中期移動平均線と長期移動平均線がトレンド方向に傾いている。なお短期移動平均線の傾きは任意です。
パラメーターの調整方法
・ 株価の選択 : エントリーポイントの判定に使用する株価を、ローソク足か短期移動平均線から選べます。ローソク足を選ぶと判定が早くなりますがノイズが増え、短期移動平均線を選ぶと判定が遅くなりますがノイズが減ります。初期値は短期移動平均線です。
・ 押しや戻りの判定 : 押しの最下点の左右のバーの数で判定します。バーの数を増やすとノイズが減りますが、機会を逃すこともあります。初期値は左が3、右が1です。
・ トレンドフィルターの使用 : トレンドフィルターを使うかどうかを選べます。初期値は使用する設定です。
・ 移動平均線の傾きの条件 : トレンドフィルターのうち、トレンド方向の傾きを条件に入れるかどうかを選べます。初期値は条件に入れる設定です。
バーの背景色: トレンドフィルターはバーの背景色で表示されますが、非表示に設定することもできます。

DCA Strategy with Mean Reversion and Bollinger BandDCA Strategy with Mean Reversion and Bollinger Band
The Dollar-Cost Averaging (DCA) Strategy with Mean Reversion and Bollinger Bands is a sophisticated trading strategy that combines the principles of DCA, mean reversion, and technical analysis using Bollinger Bands. This strategy aims to capitalize on market corrections by systematically entering positions during periods of price pullbacks and reversion to the mean.
Key Concepts and Principles
1. Dollar-Cost Averaging (DCA)
DCA is an investment strategy that involves regularly purchasing a fixed dollar amount of an asset, regardless of its price. The idea behind DCA is that by spreading out investments over time, the impact of market volatility is reduced, and investors can avoid making large investments at inopportune times. The strategy reduces the risk of buying all at once during a market high and can smooth out the cost of purchasing assets over time.
In the context of this strategy, the Investment Amount (USD) is set by the user and represents the amount of capital to be invested in each buy order. The strategy executes buy orders whenever the price crosses below the lower Bollinger Band, which suggests a potential market correction or pullback. This is an effective way to average the entry price and avoid the emotional pitfalls of trying to time the market perfectly.
2. Mean Reversion
Mean reversion is a concept that suggests prices will tend to return to their historical average or mean over time. In this strategy, mean reversion is implemented using the Bollinger Bands, which are based on a moving average and standard deviation. The lower band is considered a potential buy signal when the price crosses below it, indicating that the asset has become oversold or underpriced relative to its historical average. This triggers the DCA buy order.
Mean reversion strategies are popular because they exploit the natural tendency of prices to revert to their mean after experiencing extreme deviations, such as during market corrections or panic selling.
3. Bollinger Bands
Bollinger Bands are a technical analysis tool that consists of three lines:
Middle Band: The moving average, usually a 200-period Exponential Moving Average (EMA) in this strategy. This serves as the "mean" or baseline.
Upper Band: The middle band plus a certain number of standard deviations (multiplier). The upper band is used to identify overbought conditions.
Lower Band: The middle band minus a certain number of standard deviations (multiplier). The lower band is used to identify oversold conditions.
In this strategy, the Bollinger Bands are used to identify potential entry points for DCA trades. When the price crosses below the lower band, this is seen as a potential opportunity for mean reversion, suggesting that the asset may be oversold and could reverse back toward the middle band (the EMA). Conversely, when the price crosses above the upper band, it indicates overbought conditions and signals potential market exhaustion.
4. Time-Based Entry and Exit
The strategy has specific entry and exit points defined by time parameters:
Open Date: The date when the strategy begins opening positions.
Close Date: The date when all positions are closed.
This time-bound approach ensures that the strategy is active only during a specified window, which can be useful for testing specific market conditions or focusing on a particular time frame.
5. Position Sizing
Position sizing is determined by the Investment Amount (USD), which is the fixed amount to be invested in each buy order. The quantity of the asset to be purchased is calculated by dividing the investment amount by the current price of the asset (investment_amount / close). This ensures that the amount invested remains constant despite fluctuations in the asset's price.
6. Closing All Positions
The strategy includes an exit rule that closes all positions once the specified close date is reached. This allows for controlled exits and limits the exposure to market fluctuations beyond the strategy's timeframe.
7. Background Color Based on Price Relative to Bollinger Bands
The script uses the background color of the chart to provide visual feedback about the price's relationship with the Bollinger Bands:
Red background indicates the price is above the upper band, signaling overbought conditions.
Green background indicates the price is below the lower band, signaling oversold conditions.
This provides an easy-to-interpret visual cue for traders to assess the current market environment.
Postscript: Configuring Initial Capital for Backtesting
To ensure the backtest results align with the actual investment scenario, users must adjust the Initial Capital in the TradingView strategy properties. This is done by calculating the Initial Capital as the product of the Total Closed Trades and the Investment Amount (USD). For instance:
If the user is investing 100 USD per trade and has 10 closed trades, the Initial Capital should be set to 1,000 USD.
Similarly, if the user is investing 200 USD per trade and has 24 closed trades, the Initial Capital should be set to 4,800 USD.
This adjustment ensures that the backtesting results reflect the actual capital deployed in the strategy and provides an accurate representation of potential gains and losses.
Conclusion
The DCA strategy with Mean Reversion and Bollinger Bands is a systematic approach to investing that leverages the power of regular investments and technical analysis to reduce market timing risks. By combining DCA with the insights offered by Bollinger Bands and mean reversion, this strategy offers a structured way to navigate volatile markets while targeting favorable entry points. The clear entry and exit rules, coupled with time-based constraints, make it a robust and disciplined approach to long-term investing.

Kalman PredictorThe **Kalman Predictor** indicator is a powerful tool designed for traders looking to enhance their market analysis by smoothing price data and projecting future price movements. This script implements a Kalman filter, a statistical method for noise reduction, to dynamically estimate price trends and velocity. Combined with ATR-based confidence bands, it provides actionable insights into potential price movement, while offering clear trend and momentum visualization.
---
#### **Key Features**:
1. **Kalman Filter Smoothing**:
- Dynamically estimates the current price state and velocity to filter out market noise.
- Projects three future price levels (`Next Bar`, `Next +2`, `Next +3`) based on velocity.
2. **Dynamic Confidence Bands**:
- Confidence bands are calculated using ATR (Average True Range) to reflect market volatility.
- Visualizes potential price deviation from projected levels.
3. **Trend Visualization**:
- Color-coded prediction dots:
- **Green**: Indicates an upward trend (positive velocity).
- **Red**: Indicates a downward trend (negative velocity).
- Dynamically updated label displaying the current trend and velocity value.
4. **User Customization**:
- Inputs to adjust the process and measurement noise for the Kalman filter (`q` and `r`).
- Configurable ATR multiplier for confidence bands.
- Toggleable trend label with adjustable positioning.
---
#### **How It Works**:
1. **Kalman Filter Core**:
- The Kalman filter continuously updates the estimated price state and velocity based on real-time price changes.
- Projections are based on the current price trend (velocity) and extend into the future (Next Bar, +2, +3).
2. **Confidence Bands**:
- Calculated using ATR to provide a dynamic range around the projected future prices.
- Indicates potential volatility and helps traders assess risk-reward scenarios.
3. **Trend Label**:
- Updates dynamically on the last bar to show:
- Current trend direction (Up/Down).
- Velocity value, providing insight into the expected magnitude of the price movement.
---
#### **How to Use**:
- **Trend Analysis**:
- Observe the direction and spacing of the prediction dots relative to current candles.
- Larger spacing indicates a potential strong move, while clustering suggests consolidation.
- **Risk Management**:
- Use the confidence bands to gauge potential price volatility and set stop-loss or take-profit levels accordingly.
- **Pullback Detection**:
- Look for flattening or clustering of dots during trends as a signal of potential pullbacks or reversals.
---
#### **Customizable Inputs**:
- **Kalman Filter Parameters**:
- `lookback`: Adjusts the smoothing window.
- `q`: Process noise (higher values make the filter more reactive to changes).
- `r`: Measurement noise (controls sensitivity to price deviations).
- **Confidence Bands**:
- `band_multiplier`: Multiplies ATR to define the range of confidence bands.
- **Visualization**:
- `show_label`: Option to toggle the trend label.
- `label_offset`: Adjusts the label’s distance from the price for better visibility.
---
#### **Examples of Use**:
- **Scalping**: Use on lower timeframes (e.g., 1-minute, 5-minute) to detect short-term price trends and reversals.
- **Swing Trading**: Identify pullbacks or continuations on higher timeframes (e.g., 4-hour, daily) by observing the prediction dots and confidence bands.
- **Risk Assessment**: Confidence bands help visualize potential price volatility, aiding in the placement of stops and targets.
---
#### **Notes for Traders**:
- The **Kalman Predictor** does not predict the future with certainty but provides a statistically informed estimate of price movement.
- Confidence bands are based on historical volatility and should be used as guidelines, not guarantees.
- Always combine this tool with other analysis techniques for optimal results.
---
This script is open-source, and the Kalman filter logic has been implemented uniquely to integrate noise reduction with dynamic confidence band visualization. If you find this indicator useful, feel free to share your feedback and experiences!
---
#### **Credits**:
This script was developed leveraging the statistical principles of Kalman filtering and is entirely original. It incorporates ATR for dynamic confidence band calculations to enhance trader usability and market adaptability.

TASC 2024.07 Gaps and Extreme Closes█ OVERVIEW
This script, inspired by Perry Kaufman's article "Trading Opening Gaps and Extreme Closes in Stocks" from the TASC's July 2024 edition of Traders' Tips , provides analytical insights into stock price behaviors following significant price moves. The information about the frequency, pullbacks, and closing patterns of these extreme price movements can aid in developing more effective trading strategies by understanding what to expect during volatile market conditions.
█ CONCEPTS
Perry Kaufman's article investigates the behavior of stock prices following substantial opening gaps and extreme closing moves to identify patterns and expectations that traders can utilize to make informed decisions. The motivation behind the article is to offer traders a more scientific approach to understanding price movements during volatile market conditions, particularly during earnings season or significant economic events. Kaufman's analysis reveals that stock prices have a history of exhibiting certain behaviors after substantial price gaps and extreme closes. This script follows Perry Kaufman's study and helps provide insight into how prices often behave after significant price changes. This analysis can help traders establish price movement expectations and potential strategies for trading such occurrences.
█ CALCULATIONS
Input Parameters:
This script offers users the choice to analyze "Opening Gaps" or "Extreme Closes" for price movements of different predefined magnitudes in a specified direction ("Upward" or "Downward").
Outputs:
Based on the specified inputs, the script performs the following calculations for the active ticker displayed on the chart:
Frequency of Extreme Price Movements : Quantifies the occurrences of directional price movements within predefined percentage ranges.
Average Pullbacks : Computes the average retracement (pullback) from analyzed price movements within each percentage range.
Average Closes : Analyzes the typical closing behavior relative to the directional price movements within each range.
The script organizes the results from these calculations within the table on a separate chart pane, providing users with helpful insights into how a stock historically behaved following significant price movements.

BlackPika Supertrend Public v2Hello Reader!
What is Supertrend indicator ?
The Supertrend Indicator is a popular technical analysis tool designed to assist traders in identifying market trends.
The indicator combines the average true range (ATR) with a multiplier to calculate its value. This value is then added to or subtracted from the asset’s closing price to plot the supertrend line.
The Supertrend Indicator can help identify trends, manage risk, and confirm market tendencies.
The indicator is limited by its lagging nature, is not very flexible, and can send up false signals.
The Supertrend Indicator has become a staple for traders in stocks, currencies, and commodities for its ability to identify and follow market trends.
About this script:
This script is based on the SuperTrend. There are some extra things added to make it able to use more efficiently. They are listed below:
1. Pullback signals: These signals indicate a pull back after a trend reversal and are the most optimum places where you can add to your existing position. They also come with Alerts !
2. Trailing Stop Loss and Take Profit: These further help to reduce the draw-down and can help you to trail profits with more granularity thus securing gains. This are using RSI levels. RSI levels above 70 will indicate a partial take profit when long and RSI levels below 25 will indicate a take profit level when short.
How to use ?
----------------
Personally I use it on major pairs on cryptocurrencies like BTCUSD . Usually after the trend flips, there will be pullbacks, You can enter a part of the position when trend reversal is confirmed. (LONG signal)
Then add more when you get a pullback (PB_LONG signal).
To make life simpler, alerts are added for pullback signals as well. These can help acheive good entry price. Entering at pullback signals limits your losses to a great extent, as the trend will flip on the bar close if it goes against you.
You can trade manually or you can automate. All the signals have been provided with Alerts. some signals have been grouped, to reduce the number of the alerts if you wish to.
I wish you all the luck and please comment and Like if you have any doubts.

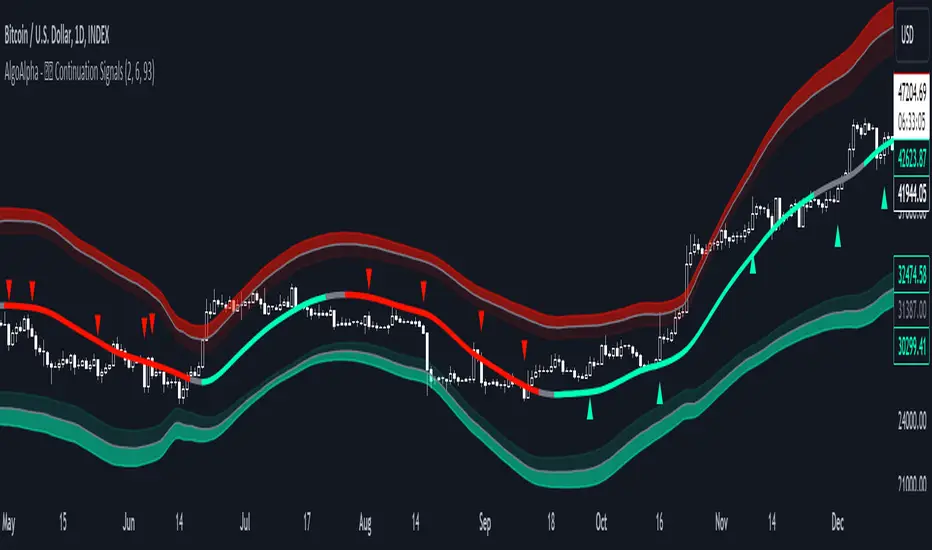
Trend Continuation Signals [AlgoAlpha]Introducing the Trend Continuation Signals by AlgoAlpha 🌟🚀
Elevate your trading game with this multipurpose indicator, designed to pinpoint trend continuation opportunities as well as highlight volatility and oversold/overbought conditions. Whether you're a trading novice or a seasoned market veteran, this tool offers intuitive visual cues to boost your decision-making and enhance your market analysis. Let's explore the key features, how to use it effectively, and delve into the operational mechanics that make this tool a game-changer in your trading arsenal:
Key Features:
🔥 Advanced Trend Detection : Leverages the Hull Moving Average (HMA) for superior trend tracking as compared to other MAs, offering unique insights into market momentum.
🌈 Volatility Bands : Implements adjustable bands around the trend line, which evolve with market conditions to highlight potential trading opportunities.
⚡ Trend Continuation Signals : Identifies bullish and bearish continuation signals, equipping you with actionable signals to exploit the prevailing market trend.
🎨 Intuitive Color Coding : Employs a vibrant color scheme to distinguish between uptrends, downtrends, and neutral phases, facilitating easy interpretation of the indicator's insights.
🛠 How to Use "Trend Continuation Signals ":
🔍 Setting Up : Incorporate the indicator onto your chart and customize the indicator to suite your preferences.
👀 Reading the Signals : Pay attention to the color-coded trend lines and volatility bands. Green indicates an uptrend, red signifies a downtrend, and gray denotes a neutral market condition.
📈 Identifying Entry Points : Look for bullish (▲) and bearish (▼) continuation icons below or above the price bars as signals for potential entry points for long or short positions, respectively.
🔄 Confirmation : Validate your trades with further analysis or other indicators. The Trend Continuation Signals are most effective when complemented by other technical analysis tools or fundamental insights.
📉 Risk Management : Implement stop-loss orders in line with your risk appetite and adjust them based on the volatility bands provided by the indicator to safeguard your investments.
How It Operates:
The essence of the indicator is captured through the hull moving averages for both the primary and secondary lines, set at periods of 93 and 50, respectively, to reflect market trends and pullbacks that trigger the continuation signals every time price recovers from a detected pullback.
Volatility is quantified through the standard deviation of the midline, magnified by a factor, establishing the upper and lower trend band boundaries.
Further volatility bands are plotted around the main volatility band, providing a granular view of market volatility and potential breakout or breakdown zones.
Market trend direction is determined by comparing the HMA line's current position to its previous value, enhanced by the secondary line to identify continuation patterns.
Embrace the power of the Trend Continuation Signals to enhance your trading strategy! It is important to note that all indicators are best used in confluence with other forms of analysis, happy trading! 📊💥
Strategy Myth-Busting #13 - MultiEMA+BXTrender - [SP/MYN]#13 on the Myth-Busting bench, we are automating the "I Found The Highest Win Rate 15 Minute Scalping Trading Strategy Ever" strategy from "TradeIQ" who claims to have backtested this manually and achieved 410% profit over 100 trades within 6 months on Natural Gas with 79 Wins / 21 Losses with an astounding 3.96% Max Drawdown.
It was quite challenging emulating the same subjective EMA pullback logic along with the dependent sequencing of events necessary to enter a trade and we might improve on this to make it better in the future. Super kudos to @spdoinkal who helped with this strategy. If you have ideas on how this could be improved on, would love to hear about them.
As is, we were unable to substantiate similar results to what was manually backtested by TradeIQ, we do however see potential here. Given some optimizations and improvements to the the entry logic accommodating for a wider more variable margin after pullbacks reestablish above/below the fast EMA we think the performance of this strategy could certainly be improved upon. So not sure if we have totally myth busted this completely at this point in time.
This strategy uses a combination of 2 open-source public indicators:
3 EMA's (Trading View Internal)
B-Xtrender by Puppytherapy
Three separate (21), (89) and (200) EMA's are used as a means to confirm and keep entry out of ranged markets. When the 3 EMA's are all clumped up together with no distance it's indicative of a flat or ranged market. This is then used in conjunction with B-XTrender as a means to detect the trend direction. B-XTrender which is a trend following indicator originally published in the IFTA Journal by Bharat Jhunjhunwala. It uses both a short and long term lengths along with a compound EMA used as a means to smooth and sample trend direction.
Trading Rules
15 min candles but other lower time-frames
Stop Loss on previous swing high/low
No Take Profit, Exit on new red/green circles from BX-Trender
Long
EMA Green (21) on top, White (89)in middle and red (200) on bottom and there is distance between EMA's need to be spaced, otherwise in a ranged market
Price action must pull back into 89 EMA (White line) either close or touching it.
Once pullback occurs wait for BX Trender to issue a new green circle and BX Trend line must be green and above 0
Price action must also pull up back above the (Green Line) EMA 21
Short
EMA Red (200) on top, White (89) in middle and Green (21) on bottom and there is distance between EMA's need to be spaced, otherwise in a ranged market
Price action must pull back into 89 EMA (White line) either close or touching it.
Once pullback occurs wait for BX Trender to issue a new red circle and BX Trend line must be red and below 0
Price action must also pull up back below the (green Line) EMA 21
If you know of or have a strategy you want to see myth-busted or just have an idea for one, please feel free to message me.

Mean-Reversion Swing Trading Strategy v1A port of the TradeStation EasyLanguage code for a mean-revision strategy described at
traders.com
"In “Mean-Reversion Swing Trading,” which appeared in the December 2016 issue of STOCKS & COMMODITIES, author Ken Calhoun
describes a trading methodology where the trader attempts to enter an existing trend after there has been a pullback.
He suggests looking for 50% pullbacks in strong trends and waiting for price to move back in the direction of the trend
before entering the trade."
See Also:
- 9 Mistakes Quants Make that Cause Backtests to Lie (blog.quantopian.com)
- When Backtests Meet Reality (financial-hacker.com)
- Why MT4 backtesting does not work (www.stevehopwoodforex.com)

Elite MTF EMA ReclaimThis indicator is a trend-continuation tool, not a scalper.
Its purpose is to help you enter clean pullback trades in strong trends while blocking chop and low-quality setups.
It works by:
Requiring Daily + 1H trend alignment
Enforcing EMA structure (5/10/20/50) on the execution timeframe
Confirming momentum expansion using EMA slope + curvature
Blocking trades when conditions are choppy (low ATR, weak ADX, tight EMAs, recent EMA crosses)
Triggering entries only after a Pullback → Reclaim → (optional) Retest
How to use it:
Trade on the 6-minute chart (Forex works best based on default setting) but is adaptable to any market by changing settings
Wait for LONG / SHORT triangles only when no CHOP or HTF block is shown
Enter on the signal, place stops beyond EMA 50 or structure, target 2R–4R+
Expect fewer but higher-quality trades
What it’s not:
Not a breakout or range-trading indicator
Not meant to fire many signals
Not for choppy or low-volatility markets
Bottom line:
It helps you trade with higher-timeframe momentum, enter after pullbacks, and avoid bad market conditions.

VWAP + RVOL (Merged):
📊 VWAP + RVOL (Merged)
VWAP + RVOL (Merged) is a professional intraday trading indicator that combines:
Session VWAP to define institutional direction and fair value
True Intraday Relative Volume (RVOL) to measure real-time volume strength compared to the same minute over previous days
The script is specifically designed for U.S. equities and performs best in:
Premarket momentum
Opening Range Breakout (ORB)
VWAP pullbacks
Scalping & day trading
🔍 What does this indicator provide?
1️⃣ True Intraday RVOL
Calculates minute-accurate relative volume, comparing current volume to the same minute across a user-defined number of prior days
Correctly handles sessions crossing midnight (after-hours & premarket)
Displays RVOL in a separate pane for clean, noise-free analysis
Default RVOL reference levels:
0.5 → Weak volume
1.0 → Normal volume
1.5 → Strong volume
2.0 → Unusual / institutional activity
2️⃣ Session VWAP
True session-based VWAP
Identifies institutional fair value
Acts as a primary directional filter:
Above VWAP → Bullish bias
Below VWAP → Bearish bias
✅ Practical Trading Use
Long Setup:
Price above VWAP
RVOL ≥ 1.5
Light pullback or VWAP retest
Confirmation candle with increasing volume
Avoid trades when:
Price below VWAP
RVOL < 1.0
⚙️ Settings
RVOL Lookback Days – Number of days used for RVOL comparison (default: 5)
RVOL Reference Lines – Toggle RVOL levels on/off
VWAP Source – Price source for VWAP calculation
Hide VWAP on 1D+ – Optional VWAP hiding on higher timeframes
📌 Important Notes
Designed for intraday timeframes only (≥ 1 minute and < 1 day)
Requires volume data from the data provider
Not intended for daily or higher timeframes
🎯 Who is this indicator for?
Momentum traders
Day traders & scalpers
ORB and VWAP pullback strategies
Traders seeking volume confirmation before entry
⚠️ Disclaimer
This indicator is a decision-support tool, not a trading recommendation.
Always apply proper risk management.

Price Action High 2 + Risk/Reward VisualizerIntroduction: Price Action High 2 (Bull Flag) Setup
This script identifies the High 2 (H2) setup, a staple price action pattern popularized by Al Brooks. The High 2 is a high-probability continuation pattern designed to catch the resumption of a bull trend after a two-legged pullback (a "complex" bull flag).
In a strong uptrend, the first attempt to end a pullback often fails (High 1). The High 2 represents the second, and usually more reliable, attempt by bulls to take control, often forming a "double bottom" structure within the flag.
How the Logic Works
The indicator follows a strict state-machine logic to ensure the pattern is valid:
Trend Confirmation: The script filters for an established uptrend where price is above a rising EMA (adjustable in settings).
Pullback Identification: It looks for a sequence of bars making lower highs.
High 1 (H1): The first bar in the correction that breaks above the high of the prior bar.
The Second Leg: The script then waits for the price to again fail to break a high, confirming a second leg of the pullback.
High 2 (H2): The signal is triggered when a bar breaks the high of the previous bar for the second time.
Key Features
Signal Bar Quality Filter: Not all High 2s are equal. This script includes a filter ensuring the signal bar closes in the upper portion of its range (bullish conviction) to avoid "weak" breakouts.
Automated Risk/Reward Visualizer: Upon a signal, the script automatically projects a Stop Loss (at the signal bar low) and a Take Profit level based on a customizable R:R ratio.
Clean Visuals: Labeled "H2" markers and dashed trend lines keep the chart uncluttered.
How to Trade It
Entry: Place a buy-stop order 1 tick above the High 2 signal bar.
Stop Loss: Traditionally placed below the low of the signal bar or the most recent swing low.
Target: Common targets include a 1:2 Risk/Reward ratio or the previous major swing high.
Settings Guide
EMA Length: Adjust this to match your timeframe (e.g., 20 for intraday, 50 for daily).
Min Close %: Set this to 50% or higher to ensure you only take trades where the bulls finished the bar strong.
Risk:Reward Ratio: Customize your profit targets to align with your personal trading plan.

CAHOLD / CBLOHDCAHOLD (Close Above Highest Low Day) and CBLOHD (Close Below Lowest High Day)
The logic is based on identifying pullbacks followed by strength in the direction of the trend, making it useful as a trend-continuation entry signal rather than a reversal tool.
⸻
How CAHOLD Works (Bullish)
1. A sequence of red candles forms (a pullback).
2. The first green candle appears.
3. The script identifies the highest high of the prior red-candle sequence (HOLD).
4. A CAHOLD signal triggers when a green candle closes above that HOLD level.
5. A small green arrow is plotted below the candle.
⸻
How CBLOHD Works (Bearish)
1. A sequence of green candles forms (a bounce).
2. The first red candle appears.
3. The script identifies the lowest low of the prior green-candle sequence (LOHD).
4. A CBLOHD signal triggers when a red candle closes below that LOHD level.
5. A small red arrow is plotted above the candle.
⸻
Optional Filters
• EMA / SMA Trend Filter
Only shows CAHOLDs in uptrends and CBLOHDs in downtrends.
• Minimum Pullback Depth
Requires a minimum number of red/green candles before a signal can trigger.
• ATR Breakout Filter
Requires price to break the level by a volatility-adjusted amount.

Ichimoku + VWAP + OBV + ATR Full System (NQ Daytrade)Extended Indicator Description
Ichimoku + VWAP + OBV + ATR Full System is a rule-based intraday trading indicator designed specifically for NQ day trading, focusing on trend alignment, participation confirmation, and volatility-aware execution.
This indicator does not rely on a single signal or crossover. Instead, it integrates multiple market dimensions into one structured framework to help traders identify high-probability trend continuation scenarios while avoiding low-quality, range-bound conditions.
System Philosophy
The core idea of this system is simple:
trade only when trend, price location, volume, and volatility are aligned.
Each component plays a specific role and is not meant to be used in isolation. The indicator works best when all conditions reinforce the same directional bias.
Component Breakdown
Ichimoku Cloud
Used to define the primary market structure and directional bias. The system favors trades only when price action aligns clearly above or below the cloud, helping filter out indecisive or transitional phases.
VWAP
Acts as a session-based equilibrium reference. Price position and distance relative to VWAP are used to confirm whether the market is trending with intent rather than reverting to the mean.
OBV (On-Balance Volume)
Provides participation and flow confirmation. OBV helps validate whether price movement is supported by volume, reducing the likelihood of false breakouts or weak trend signals.
ATR (Average True Range)
Used as a volatility filter and risk-awareness tool. ATR conditions help the system avoid low-volatility environments and support more realistic expectations for intraday movement.
Trade Logic Overview
The system is designed around trend-following pullbacks, not prediction or counter-trend trading.
When trend structure is established and confirmed by VWAP positioning and OBV behavior, pullback zones within the trend become areas of interest. ATR conditions ensure that trades are taken only when sufficient movement potential exists.
Rather than generating frequent signals, the system prioritizes selectivity and clarity, making it suitable for disciplined day traders who value context over quantity.
Intended Use
This indicator is built for:
NQ intraday and day trading
Trend continuation and pullback strategies
Traders who prefer structured, confirmation-based systems
Lower to mid intraday timeframes such as 3-minute, 5-minute, and 15-minute charts
Important Notes
This is not an automated trading system and does not provide guaranteed results. The indicator is designed as a decision-support tool to assist with market context, directional bias, and trade timing. Risk management, execution, and position sizing remain the responsibility of the user.
롱/숏 삼각형 시그널
동그라미 청산 시그널
VWAP 밴드 기반 방향성
OBV 보조지표
이름 (Name)
BTC Scalping Signal – VWAP + OBV
짧은 설명 (Short Description)
VWAP 밴드와 OBV를 기반으로 방향성, 진입·청산 시그널을 제공하는 스캘핑 지표입니다.
긴 설명 (Long Description)
이 지표는 BTC 단기 스캘핑을 위해 설계된 것으로, 특히 15분봉 환경에 최적화되어 있습니다.
VWAP 밴드의 위치와 추세 판별 로직을 기반으로 롱·숏 진입 신호를 제공합니다.
OBV 모멘텀을 보조 필터로 사용하여 돌파 및 되돌림 가능성을 판단합니다.
시장 변동성이 축소되거나 평균회귀 신호가 감지될 때 청산 시그널을 표시합니다.
삼각형(진입), 원형(청산) 등 직관적 시각 요소를 통해 빠른 의사결정을 지원합니다.

VV Moving Average Convergence Divergence # VMACDv3 - Volume-Weighted MACD with A/D Divergence Detection
## Overview
**VMACDv3** (Volume-Weighted Moving Average Convergence Divergence Version 3) is a momentum indicator that applies volume-weighting to traditional MACD calculations on price, while using the Accumulation/Distribution (A/D) line for divergence detection. This hybrid approach combines volume-weighted price momentum with volume distribution analysis for comprehensive market insight.
## Key Features
- **Volume-Weighted Price MACD**: Traditional MACD calculation on price but weighted by volume for earlier signals
- **A/D Divergence Detection**: Identifies when A/D trend diverges from MACD momentum
- **Volume Strength Filtering**: Distinguishes high-volume confirmations from low-volume noise
- **Color-Coded Histogram**: 4-color system showing momentum direction and volume strength
- **Real-Time Alerts**: Background colors and alert conditions for bullish/bearish divergences
## Difference from ACCDv3
| Aspect | VMACDv3 | ACCDv3 |
|--------|---------|---------|
| **MACD Input** | **Price (Close)** | **A/D Line** |
| **Volume Weighting** | Applied to price | Applied to A/D line |
| **Primary Signal** | Volume-weighted price momentum | Volume distribution momentum |
| **Use Case** | Price momentum with volume confirmation | Volume flow and accumulation/distribution |
| **Sensitivity** | More responsive to price changes | More responsive to volume patterns |
| **Best For** | Trend following, breakouts | Volume analysis, smart money tracking |
**Key Insight**: VMACDv3 shows *where price is going* with volume weight, while ACCDv3 shows *where volume is accumulating/distributing*.
## Components
### 1. Volume-Weighted MACD on Price
Unlike standard MACD that uses simple price EMAs, VMACDv3 weights each price by its corresponding volume:
```
Fast Line = EMA(Price × Volume, 12) / EMA(Volume, 12)
Slow Line = EMA(Price × Volume, 26) / EMA(Volume, 26)
MACD = Fast Line - Slow Line
```
**Benefits of Volume Weighting**:
- High-volume price movements have greater impact
- Filters out low-volume noise and false moves
- Provides earlier trend change signals
- Better reflects institutional activity
### 2. Accumulation/Distribution (A/D) Line
Used for divergence detection, measuring buying/selling pressure:
```
A/D = Σ ((2 × Close - Low - High) / (High - Low)) × Volume
```
- **Rising A/D**: Accumulation (buying pressure)
- **Falling A/D**: Distribution (selling pressure)
- **Doji Handling**: When High = Low, contribution is zero
### 3. Signal Lines
- **MACD Line** (Blue, #2962FF): The fast-slow difference showing momentum
- **Signal Line** (Orange, #FF6D00): EMA or SMA smoothing of MACD
- **Zero Line**: Reference for bullish (above) vs bearish (below) bias
### 4. Histogram Color System
The histogram uses 4 distinct colors based on **direction** and **volume strength**:
| Condition | Color | Meaning |
|-----------|-------|---------|
| Rising + High Volume | **Dark Green** (#1B5E20) | Strong bullish momentum with volume confirmation |
| Rising + Low Volume | **Light Teal** (#26A69A) | Bullish momentum but weak volume (less reliable) |
| Falling + High Volume | **Dark Red** (#B71C1C) | Strong bearish momentum with volume confirmation |
| Falling + Low Volume | **Light Pink** (#FFCDD2) | Bearish momentum but weak volume (less reliable) |
Additional shading:
- **Light Cyan** (#B2DFDB): Positive but not rising (momentum stalling)
- **Bright Red** (#FF5252): Negative and accelerating down
### 5. Divergence Detection
VMACDv3 compares A/D trend against volume-weighted price MACD:
#### Bullish Divergence (Green Background)
- **Condition**: A/D is trending up BUT MACD is negative and trending down
- **Interpretation**: Volume is accumulating while price momentum appears weak
- **Signal**: Smart money accumulation, potential bullish reversal
- **Action**: Look for long entries, especially at support levels
#### Bearish Divergence (Red Background)
- **Condition**: A/D is trending down BUT MACD is positive and trending up
- **Interpretation**: Volume is distributing while price momentum appears strong
- **Signal**: Smart money distribution, potential bearish reversal
- **Action**: Consider exits, avoid new longs, watch for breakdown
## Parameters
| Parameter | Default | Range | Description |
|-----------|---------|-------|-------------|
| **Source** | Close | OHLC/HLC3/etc | Price source for MACD calculation |
| **Fast Length** | 12 | 1-50 | Period for fast EMA (shorter = more sensitive) |
| **Slow Length** | 26 | 1-100 | Period for slow EMA (longer = smoother) |
| **Signal Smoothing** | 9 | 1-50 | Period for signal line (MACD smoothing) |
| **Signal Line MA Type** | EMA | SMA/EMA | Moving average type for signal calculation |
| **Volume MA Length** | 20 | 5-100 | Period for volume average (strength filter) |
## Usage Guide
### Reading the Indicator
1. **MACD Lines (Blue & Orange)**
- **Blue Line (MACD)**: Volume-weighted price momentum
- **Orange Line (Signal)**: Smoothed trend of MACD
- **Crossovers**: Blue crosses above orange = bullish, below = bearish
- **Distance**: Wider gap = stronger momentum
- **Zero Line Position**: Above = bullish bias, below = bearish bias
2. **Histogram Colors**
- **Dark Green (#1B5E20)**: Strong bullish move with high volume - **most reliable buy signal**
- **Light Teal (#26A69A)**: Bullish but low volume - wait for confirmation
- **Dark Red (#B71C1C)**: Strong bearish move with high volume - **most reliable sell signal**
- **Light Pink (#FFCDD2)**: Bearish but low volume - may be temporary dip
3. **Background Divergence Alerts**
- **Green Background**: A/D accumulating while price weak - potential bottom
- **Red Background**: A/D distributing while price strong - potential top
- Most powerful at key support/resistance levels
### Trading Strategies
#### Strategy 1: Volume-Confirmed Trend Following
1. Wait for MACD to cross above zero line
2. Look for **dark green** histogram bars (high volume confirmation)
3. Enter long on second consecutive dark green bar
4. Hold while histogram remains green
5. Exit when histogram turns light green or red appears
6. Set stop below recent swing low
**Example**:
```
Price: 26,400 → 26,450 (rising)
MACD: -50 → +20 (crosses zero)
Histogram: Light teal → Dark green → Dark green
Volume: 50k → 75k → 90k (increasing)
```
#### Strategy 2: Divergence Reversal Trading
1. Identify divergence background (green = bullish, red = bearish)
2. Confirm with price structure (support/resistance, chart patterns)
3. Wait for MACD to cross signal line in divergence direction
4. Enter on first **dark colored** histogram bar after divergence
5. Set stop beyond divergence area
6. Target previous swing high/low
**Example - Bullish Divergence**:
```
Price: Making lower lows (26,350 → 26,300 → 26,250)
A/D: Rising (accumulation)
MACD: Below zero but starting to curve up
Background: Green shading appears
Entry: MACD crosses signal line + dark green bar
Stop: Below 26,230
Target: 26,450 (previous high)
```
#### Strategy 3: Momentum Scalping
1. Trade only in direction of MACD zero line (above = long, below = short)
2. Enter on dark colored bars only
3. Exit on first light colored bar or opposite color
4. Quick in and out (1-5 minute holds)
5. Tight stops (0.2-0.5% depending on instrument)
#### Strategy 4: Histogram Pattern Trading
**V-Bottom Reversal (Bullish)**:
- Red histogram bars start rising (becoming less negative)
- Forms "V" shape at the bottom
- Transitions to light red → light teal → **dark green**
- Entry: First dark green bar
- Signal: Momentum reversal with volume
**Λ-Top Reversal (Bearish)**:
- Green histogram bars start falling (becoming less positive)
- Forms inverted "V" at the top
- Transitions to light green → light pink → **dark red**
- Entry: First dark red bar
- Signal: Momentum exhaustion with volume
### Multi-Timeframe Analysis
**Recommended Approach**:
1. **Higher Timeframe (15m/1h)**: Identify overall trend direction
2. **Trading Timeframe (5m)**: Time entries using VMACDv3 signals
3. **Lower Timeframe (1m)**: Fine-tune entry prices
**Example Setup**:
```
15-minute: MACD above zero (bullish bias)
5-minute: Dark green histogram appears after pullback
1-minute: Enter on break of recent high with volume
```
### Volume Strength Interpretation
The volume filter compares current volume to 20-period average:
- **Volume > Average**: Dark colors (green/red) - high confidence signals
- **Volume < Average**: Light colors (teal/pink) - lower confidence signals
**Trading Rules**:
- ✓ **Aggressive**: Take all dark colored signals
- ✓ **Conservative**: Only take dark colors that follow 2+ light colors of same type
- ✗ **Avoid**: Trading light colored signals during high volatility
- ✗ **Avoid**: Ignoring volume context during news events
## Technical Details
### Volume-Weighted Calculation
```pine
// Volume-weighted fast EMA
fast_ma = ta.ema(src * volume, fast_length) / ta.ema(volume, fast_length)
// Volume-weighted slow EMA
slow_ma = ta.ema(src * volume, slow_length) / ta.ema(volume, slow_length)
// MACD is the difference
macd = fast_ma - slow_ma
// Signal line smoothing
signal = ta.ema(macd, signal_length) // or ta.sma() if SMA selected
// Histogram
hist = macd - signal
```
### Divergence Detection Logic
```pine
// A/D trending up if above its 5-period SMA
ad_trend = ad > ta.sma(ad, 5)
// MACD trending up if above zero
macd_trend = macd > 0
// Divergence when trends oppose each other
divergence = ad_trend != macd_trend
// Specific conditions for alerts
bullish_divergence = ad_trend and not macd_trend and macd < 0
bearish_divergence = not ad_trend and macd_trend and macd > 0
```
### Histogram Coloring Logic
```pine
hist_color = (hist >= 0
? (hist < hist
? (vol_strength ? #1B5E20 : #26A69A) // Rising: dark/light green
: #B2DFDB) // Positive but falling: cyan
: (hist < hist
? (vol_strength ? #B71C1C : #FFCDD2) // Rising (less negative): dark/light red
: #FF5252)) // Falling more: bright red
```
## Alerts
Built-in alert conditions for divergence detection:
### Bullish Divergence Alert
- **Trigger**: A/D trending up, MACD negative and trending down
- **Message**: "Bullish Divergence: A/D trending up but MACD trending down"
- **Use Case**: Potential reversal or continuation after pullback
- **Action**: Look for long entry setups
### Bearish Divergence Alert
- **Trigger**: A/D trending down, MACD positive and trending up
- **Message**: "Bearish Divergence: A/D trending down but MACD trending up"
- **Use Case**: Potential top or trend reversal
- **Action**: Consider exits or short entries
### Setting Up Alerts
1. Click "Create Alert" in TradingView
2. Condition: Select "VMACDv3"
3. Choose alert type: "Bullish Divergence" or "Bearish Divergence"
4. Configure: Email, SMS, webhook, or popup
5. Set frequency: "Once Per Bar Close" recommended
## Comparison Tables
### VMACDv3 vs Standard MACD
| Feature | Standard MACD | VMACDv3 |
|---------|---------------|---------|
| **Price Weighting** | Equal weight all bars | Volume-weighted |
| **Sensitivity** | Fixed | Adaptive to volume |
| **False Signals** | More during low volume | Fewer (volume filter) |
| **Divergence** | Price vs MACD | A/D vs MACD |
| **Volume Analysis** | None | Built-in |
| **Color System** | 2 colors | 4+ colors |
| **Best For** | Simple trend following | Volume-confirmed trading |
### VMACDv3 vs ACCDv3
| Aspect | VMACDv3 | ACCDv3 |
|--------|---------|--------|
| **Focus** | Price momentum | Volume distribution |
| **Reactivity** | Faster to price moves | Faster to volume shifts |
| **Best Markets** | Trending, breakouts | Accumulation/distribution phases |
| **Signal Type** | Where price + volume going | Where smart money positioning |
| **Divergence Meaning** | Volume vs price disagreement | A/D vs momentum disagreement |
| **Use Together?** | ✓ Yes, complementary | ✓ Yes, different perspectives |
## Example Trading Scenarios
### Scenario 1: Strong Bullish Breakout
```
Time: 9:30 AM (market open)
Price: Breaks above 26,400 resistance
MACD: Crosses above zero line
Histogram: Dark green bars (#1B5E20)
Volume: 2x average (150k vs 75k avg)
A/D: Rising (no divergence)
Action: Enter long at 26,405
Stop: 26,380 (below breakout)
Target 1: 26,450 (risk:reward 1:2)
Target 2: 26,500 (risk:reward 1:4)
Result: High probability setup with volume confirmation
```
### Scenario 2: False Breakout (Avoided)
```
Time: 2:30 PM (slow period)
Price: Breaks above 26,400 resistance
MACD: Slightly positive
Histogram: Light teal bars (#26A69A)
Volume: 0.5x average (40k vs 75k avg)
A/D: Flat/declining
Action: Avoid trade
Reason: Low volume, no conviction, potential false breakout
Outcome: Price reverses back below 26,400 within 10 minutes
Saved: Avoided losing trade due to volume filter
```
### Scenario 3: Bullish Divergence Bottom
```
Time: 11:00 AM
Price: Making lower lows (26,350 → 26,300 → 26,280)
MACD: Below zero but curving upward
Histogram: Red bars getting shorter (V-bottom forming)
Background: Green shading (divergence alert)
A/D: Rising despite price falling
Volume: Increasing on down bars
Setup:
1. Divergence appears at 26,280 (green background)
2. Wait for MACD to cross signal line
3. First dark green bar appears at 26,290
4. Enter long: 26,295 (next bar open)
5. Stop: 26,265 (below divergence low)
6. Target: 26,350 (previous swing high)
Result: +55 points (30 point risk, 1.8:1 reward)
Key: Divergence + volume confirmation = high probability reversal
```
### Scenario 4: Bearish Divergence Top
```
Time: 1:45 PM
Price: Making higher highs (26,500 → 26,520 → 26,540)
MACD: Positive but flattening
Histogram: Green bars getting shorter (Λ-top forming)
Background: Red shading (bearish divergence)
A/D: Declining despite rising price
Volume: Decreasing on up bars
Setup:
1. Bearish divergence at 26,540 (red background)
2. MACD crosses below signal line
3. First dark red bar appears at 26,535
4. Enter short: 26,530
5. Stop: 26,555 (above divergence high)
6. Target: 26,475 (support level)
Result: +55 points (25 point risk, 2.2:1 reward)
Key: Distribution while price rising = smart money exiting
```
### Scenario 5: V-Bottom Reversal
```
Downtrend in progress
MACD: Deep below zero (-150)
Histogram: Series of dark red bars
Pattern Development:
Bar 1: Dark red, hist = -80, falling
Bar 2: Dark red, hist = -95, falling
Bar 3: Dark red, hist = -100, falling (extreme)
Bar 4: Light pink, hist = -98, rising!
Bar 5: Light pink, hist = -90, rising
Bar 6: Light teal, hist = -75, rising (crosses to positive momentum)
Bar 7: Dark green, hist = -55, rising + volume
Action: Enter long on Bar 7
Reason: V-bottom confirmed with volume
Stop: Below Bar 3 low
Target: Zero line on histogram (mean reversion)
```
## Best Practices
### Entry Rules
✓ **Wait for dark colors**: High-volume confirmation is key
✓ **Confirm divergences**: Use with price support/resistance
✓ **Trade with zero line**: Long above, short below for best odds
✓ **Multiple timeframes**: Align 1m, 5m, 15m signals
✓ **Watch for patterns**: V-bottoms and Λ-tops are reliable
### Exit Rules
✓ **Partial profits**: Take 50% at first target
✓ **Trail stops**: Use histogram color changes
✓ **Respect signals**: Exit on opposite dark color
✓ **Time stops**: Close positions before major news
✓ **End of day**: Square up before close
### Avoid
✗ **Don't chase light colors**: Low volume = low confidence
✗ **Don't ignore divergence**: Early warning system
✗ **Don't overtrade**: Wait for clear setups
✗ **Don't fight the trend**: Zero line dictates bias
✗ **Don't skip stops**: Always use risk management
## Risk Management
### Position Sizing
- **Dark green/red signals**: 1-2% account risk
- **Light signals**: 0.5% account risk or skip
- **Divergence plays**: 1% account risk (higher uncertainty)
- **Multiple confirmations**: Up to 2% account risk
### Stop Loss Placement
- **Trend trades**: Below/above recent swing (20-30 points typical)
- **Breakout trades**: Below/above breakout level (15-25 points)
- **Divergence trades**: Beyond divergence extreme (25-40 points)
- **Scalp trades**: Tight stops at 10-15 points
### Profit Targets
- **Minimum**: 1.5:1 reward to risk ratio
- **Scalps**: 15-25 points (quick in/out)
- **Swing**: 50-100 points (hold through pullbacks)
- **Runners**: Trail with histogram color changes
## Timeframe Recommendations
| Timeframe | Trading Style | Typical Hold | Advantages | Challenges |
|-----------|---------------|--------------|------------|------------|
| **1-minute** | Scalping | 1-5 minutes | Fast profits, many setups | Noisy, high false signals |
| **5-minute** | Intraday | 15-60 minutes | Balance of speed/clarity | Still requires quick decisions |
| **15-minute** | Swing | 1-4 hours | Clearer trends, less noise | Fewer opportunities |
| **1-hour** | Position | 4-24 hours | Strong signals, less monitoring | Wider stops required |
**Recommendation**: Start with 5-minute for best balance of signal quality and opportunity frequency.
## Combining with Other Indicators
### VMACDv3 + ACCDv3
- **Use**: Confirm volume flow with price momentum
- **Signal**: Both showing dark green = highest conviction long
- **Divergence**: VMACDv3 bullish + ACCDv3 bearish = examine price action
### VMACDv3 + RSI
- **Use**: Overbought/oversold with momentum confirmation
- **Signal**: RSI < 30 + dark green VMACD = strong reversal
- **Caution**: RSI > 70 + light green VMACD = potential false breakout
### VMACDv3 + Elder Impulse
- **Use**: Bar coloring + histogram confirmation
- **Signal**: Green Elder bars + dark green VMACD = aligned momentum
- **Exit**: Blue Elder bars + light colors = momentum stalling
## Limitations
- **Requires volume data**: Will not work on instruments without volume feed
- **Lagging indicator**: MACD inherently follows price (2-3 bar delay)
- **Consolidation noise**: Generates false signals in tight ranges
- **Gap handling**: Large gaps can distort volume-weighted values
- **Not standalone**: Should combine with price action and support/resistance
## Troubleshooting
**Problem**: Too many light colored signals
**Solution**: Increase Volume MA Length to 30-40 for stricter filtering
**Problem**: Missing entries due to waiting for dark colors
**Solution**: Lower Volume MA Length to 10-15 for more signals (accept lower quality)
**Problem**: Divergences not appearing
**Solution**: Verify volume data available; check if A/D line is calculating
**Problem**: Histogram colors not changing
**Solution**: Ensure real-time data feed; refresh indicator
## Version History
- **v3**: Removed traditional MACD, using volume-weighted MACD on price with A/D divergence
- **v2**: Added A/D divergence detection, volume strength filtering, enhanced histogram colors
- **v1**: Basic volume-weighted MACD on price
## Related Indicators
**Companion Tools**:
- **ACCDv3**: Volume-weighted MACD on A/D line (distribution focus)
- **RSIv2**: RSI with A/D divergence detection
- **DMI**: Directional Movement Index with A/D divergence
- **Elder Impulse**: Bar coloring system using volume-weighted MACD
**Use Together**: VMACDv3 (momentum) + ACCDv3 (distribution) + Elder Impulse (bar colors) = complete volume-based trading system
---
*This indicator is for educational purposes. Past performance does not guarantee future results. Always practice proper risk management and never risk more than you can afford to lose.*

Market Regime & Bias Assistant [Prototype v1.1]
Market Regime & Bias Assistant
### **Overview**
The **Market Regime & Bias Assistant** is an all-in-one trend filtration and trading system designed to keep traders on the right side of the market. Instead of relying on a single moving average, this indicator combines **ADX (Trend Strength)**, **Multi-Timeframe EMAs**, **RSI**, and **Volume Spread Analysis (VSA)** concepts to generate a quantitative "Confidence Score" for the current market bias.
It automatically adapts its settings based on your timeframe (Intraday vs. Swing) and provides clear visual cues via background shading, candle coloring, and a data panel.
---
### **Key Features**
* **Auto-Adaptive Modes:** Automatically switches between "Intraday" and "Swing" settings based on your timeframe.
* *Intraday:* Uses faster EMAs (Aggressive 9/30 or Conservative 20/50) and VWAP.
* *Swing:* Uses standard 20/50 EMAs with 200/800 long-term context moving averages.
* **Market Regime Detection:** Identifies if the market is in a **Trend (Bull/Bear)** or a **Range (Neutral)** using a combination of ADX thresholds and EMA alignment.
* **Confidence Scoring (0-100):** A proprietary algorithm that scores the quality of the trend based on RSI alignment, Volume confirmation, and Long-term EMA context.
* **Vector Volume Candles:** Color-coded candles to highlight institutional activity (High Volume) vs. Climactic Volume (Exhaustion).
* **Pullback Signals:** "L" and "S" markers indicating high-probability entries after a pullback into the EMA value zone.
* **Data Dashboard:** A bottom-right panel displaying the current Mode, Regime, Bias, and quantitative Confidence Score.
---
### **How to Read the Visuals**
#### **1. Background Colors (The Regime)**
* **Green Background:** Confirmed **Bullish Trend**. Only look for Longs.
* **Red Background:** Confirmed **Bearish Trend**. Only look for Shorts.
* **Gray Background:** **Neutral / Range**. The market is chopping or consolidating. Stand aside or trade strictly mean-reversion.
#### **2. Candle Colors (Vector Volume)**
* **Green/Red Borders:** Normal volume.
* **Blue / Fuchsia:** **High Volume (1.2x Average)**. Indicates institutional interest or a breakout.
* **Lime / Bright Red:** **Climactic Volume (1.8x Average)**. Indicates potential exhaustion or a stopping volume event.
#### **3. The EMAs**
* **Fast/Slow Lines:** Show the immediate trend direction.
* **Gray/White Lines:** The 200 and 800 EMAs. These act as major support/resistance levels and define the "Big Picture" bias.
* **Lime Line (Intraday Only):** The VWAP (Volume Weighted Average Price).
---
### **How to Use This Indicator**
**Step 1: Check the Regime**
Look at the background color and the Dashboard panel. Is the Trend Strength "Strong" or "Very Strong"?
* *Rule:* Do not take trend-following trades if the Regime is "Range/Neutral."
**Step 2: Check the Confidence**
The dashboard calculates a score from 0 to 100.
* **High Confidence (>67):** All systems go. Alignment of RSI, Volume, and Trend.
* **Medium Confidence (34-66):** Caution warranted. Usually implies divergence in RSI or low volume.
* **Low Confidence (<34):** The trend is weak or failing.
**Step 3: Wait for the Setup (The Arrows)**
The indicator looks for pullbacks into the "Value Zone" (the space between the Fast and Slow EMA).
* **Triangle Up (L):** Appears when price pulls back into the zone during a Bull trend, then bounces out with volume confirmation.
* **Triangle Down (S):** Appears when price rallies into the zone during a Bear trend, then rejects lower.
---
### **Settings & Customization**
* **Mode:** Default is "Auto," but you can force "Intraday" or "Swing" manually.
* **Intraday Style:** Choose between "Aggressive" (9 EMA / 30 EMA) for scalping or "Conservative" (20 EMA / 50 EMA) for day trading.
* **ADX Threshold:** Adjusts how strict the trend filter is (Default: 20).
* **Visual Toggles:** Turn off/on the Panel, Background shading, or Vector candles to clean up your chart.
### **Alerts**
This script comes with built-in alert conditions for:
1. **Bullish Regime Start**
2. **Bearish Regime Start**
3. **High-Confidence Setup Detected**

ATR Based TMA Bands [NeuraAlgo]ATR-Based TMA Bands
ATR-Based TMA Bands is a volatility-adaptive channel system built around a smoothed Triangular Moving Average (TMA).
It identifies trend direction, momentum shifts, and reversal opportunities using a combination of TMA structure and ATR-driven channel expansion.
Perfect for traders who want a clean, intelligent, and adaptive market framework.
Made by NeuraAlgo.
🔷 How It Works
1. 🔹 TMA Midline (Core Trend)
The indicator builds a smooth and stable midline using:
📐 Triangular Moving Average
🔄 Additional EMA smoothing
This creates a low-noise trend curve that reacts cleanly to real momentum changes.
2. 📈 Volatility-Adjusted Bands
The channels are built from:
📊 Standard Deviation × Expansion Multiplier
📏 Three ATR-based outer layers
These bands:
Expand in high volatility
Contract in stable markets
Reveal pullbacks, breakout zones, and exhaustion points
3. 🔁 Trend Tilt Algorithm
Slope is measured using an ATR-normalized tilt formula:
atrBase = ta.atr(smoothLen)
tilt = (midline - midline ) / (0.1 * atrBase)
This classifies the trend into:
Bullish
Bearish
Neutral
The bar colors and midline adjust automatically to match market direction.
4. 🔄 Reversal Detection (Turn Signals)
The indicator flags directional flips:
Turn Up → bearish → bullish shift
Turn Down → bullish → bearish shift
These are early reversal alerts ideal for swing traders.
5. 🎯 Flip Buy / Flip Sell Signals
Deep volatility extensions create high-probability re-entry zones:
Flip Buy → price rebounds from oversold ATR zone
Flip Sell → price rejects from overbought ATR zone
Great for:
Mean-reversion entries
Trend re-tests
Pullback trades
Exhaustion signals
📌 How to Use This Indicator
✔ Trend Trading
Follow trend using tilt-colored candles
Use midline as dynamic trend filter
Use channels for breakout/pullback entries
✔ Reversal Trading
Watch for Turn Up / Turn Down labels
Flip signals show where the market is over-stretched
✔ Risk Management
ATR channels automatically adjust to volatility
Helps with smarter SL/TP placement
⭐ Best For
Trend traders
Swing traders
Reversal hunters
Volatility lovers
Anyone wanting a smart, clean technical framework
💡 Core Features
TMA-smoothed trend detection
Multi-layer ATR expansion channels
Intelligent trend tilt algorithm
Turn Up / Turn Down reversal markers
Flip Buy / Flip Sell exhaustion signals
Adaptive bar coloring
Clean and professional visual design

SuperTrend Zone Rejection [STRZ] CONCEPT -
This indicator identifies trend-continuation setups by combining the Super Trend with dynamic Average True Range (ATR) value zones. It highlights specific price action behaviour's—specifically wick rejections and momentum closes—that occur during pullbacks into the trend baseline.
HOW IT WORKS -
The script operates on three logic gates:
>> Trend Filter: Uses a standard Super Trend (Factor 3, Period 10 default) to define market direction.
>> Dynamic Zones: Projects a volatility-based zone (default 2.0x ATR) above or below the Super Trend line to define a valid pullback area.
>> Signal Detection: Identifies specific candle geometries occurring within these zones.
>> Rejection: Candles with significant wicks testing the zone support/resistance.
>> Momentum: Candles that open within the zone and close in the upper/lower quartile of their range.
FEATURES -
>> Dynamic Channel: Visualizes the active buy/sell zone using a continuous, non-repainting box.
>> Volatile Filtering: Filters out low-volatility candles (doji's/noise) based on minimum ATR size.
>> Visuals: Color-coded trend visualization with distinct signal markers for qualified entries.
SETTINGS -
>> Super Trend: Adjustable Factor and ATR Period.
>> Zone Multiplier: Controls the width of the pullback zone relative to ATR.
>> Visuals: Customizable colours for zones and signals to fit light/dark themes.
