XAU/USD Scalping Bot [Jake-Style 1500+] FINALDescription:
This advanced scalping bot is engineered for XAU/USD using Jake-style visual overlays with predictive trade triggers, early entry signals, and multi-layer confirmation tools.
Key Features:
• EMA Cloud System with color-coded directional bias (5/13/21/55/144/377)
• PSAR Flip-Only Dots to highlight trend reversal moments without chart clutter
• Bollinger Band Zones to visualize volatility channels
• Predictive Entry Flags for early buy/sell signals before momentum candles (≥2 pip move)
• TRUE Candle Logic for confirmed trend-following entries
• Multi-Level TP/SL Lines with real-time alerts:
• TP1 / TP2 / TP3 with precise trigger logic
• Stop Loss hit detection
• Red Flag Warnings for exit caution during reversal zones (overbought TDI / failed breakouts)
Optimized For:
• 1m / 3m / 5m / 15m / 30m timeframes
• Scalping & intraday trading with high-precision entries
• Traders who prefer visual confirmation before committing to entries
Created by: @Livingstonedan
Powered by: ChatGPT x Jake-style automation logic
스크립트에서 "psar"에 대해 찾기

Parabolic RSI [ChartPrime]The Parabolic RSI indicator applies the Parabolic SAR directly to the Relative Strength Index (RSI) . This combination helps traders identify trend shifts and potential reversal points within the RSI framework. The indicator provides both regular and strong signals based on whether the Parabolic SAR crosses above or below key RSI thresholds.
⯁ KEY FEATURES
Parabolic SAR Applied to RSI – Tracks momentum shifts within the RSI indicator.
Dynamic SAR Dots – Plots SAR levels directly on the RSI for visual clarity.
Threshold-Based Signal Filtering – Uses upper (70) and lower (30) RSI levels to determine strong signals.
Simple and Strong Signal System :
Big Diamonds (Strong Signals) – Appear when Parabolic SAR crosses above 70 or below 30 RSI, indicating potential reversals.
Small Diamonds (Regular Signals) – Appear when Parabolic SAR flips inside the RSI range, signaling weaker trend shifts.
Chart Overlay Signals – Highlights strong RSI-based trend shifts directly on the price chart.
Fully Customizable – Modify RSI length, SAR parameters, colors, and signal displays.
⯁ HOW TO USE
Look for strong signals (big diamonds) when SAR flips above 70 RSI (overbought) or below 30 RSI (oversold) for potential reversals.
Use regular signals (small diamonds) for minor trend shifts within the RSI range.
Combine with price action and other indicators to confirm entry and exit points.
Adjust the SAR acceleration factors to fine-tune sensitivity based on market conditions.
⯁ CONCLUSION
The Parabolic RSI indicator merges trend-following and momentum-based analysis by applying the Parabolic SAR to RSI. This allows traders to detect trend shifts inside the RSI space with an intuitive diamond-based signal system . Whether used alone or as part of a broader trading strategy, this indicator provides a clear and structured approach to identifying momentum reversals and potential trading opportunities.

Xmaster Formula Indicator [TradingFinder] No Repaint Strategies🔵 Introduction
The Xmaster Formula Indicator is a powerful tool for forex trading, combining multiple technical indicators to provide insights into market trends, support and resistance levels, and price reversals. Developed in the early 2010s, it is widely valued for generating reliable buy and sell signals.
Key components include Exponential Moving Averages (EMA) for identifying trends and price momentum, and MACD (Moving Average Convergence Divergence) for analyzing trend strength and direction.
The Stochastic Oscillator and RSI (Relative Strength Index) enhance accuracy by signaling potential price reversals. Additionally, the Parabolic SAR assists in identifying trend reversals and managing risk.
By integrating these tools, the Xmaster Formula Indicator provides a comprehensive view of market conditions, empowering traders to make informed decisions.
🔵 How to Use
The Xmaster Formula Indicator offers two distinct methods for generating signals: Standard Mode and Advance Mode. Each method caters to different trading styles and strategies.
Standard Mode :
In Standard Mode, the indicator uses normalized moving average data to generate buy and sell signals. The difference between the short-term (10-period) and long-term (38-period) EMAs is calculated and normalized to a 0-100 scale.
Buy Signal : When the normalized value crosses above 55, accompanied by the trend line turning green, a buy signal is generated.
Sell Signal : When the normalized value crosses below 45, and the trend line turns red, a sell signal is issued.
This mode is simple, making it ideal for traders looking for straightforward signals without the need for additional confirmations.
Advance Mode :
Advance Mode combines multiple technical indicators to provide more detailed and robust signals.
This method analyzes trends by incorporating :
🟣 MACD
Buy Signal : When the MACD histogram bars are positive.
Sell Signal : When the MACD histogram bars are negative.
🟣 RSI
Buy Signal : When RSI is below 30, indicating oversold conditions.
Sell Signal : When RSI is above 70, suggesting overbought conditions.
🟣 Stochastic Oscillator
Buy Signal : When Stochastic is below 20.
Sell Signal : When Stochastic is above 80.
🟣 Parabolic SAR
Buy Signal : When SAR is below the price.
Sell Signal : When SAR is above the price.
A signal is generated in Advance Mode only when all these indicators align :
Buy Signal : All conditions point to a bullish trend.
Sell Signal : All conditions indicate a bearish trend.
This mode is more comprehensive and suitable for traders who prefer deeper analysis and stronger confirmations before executing trades.
🔵 Settings
Method :
Choose between "Standard" and "Advance" modes to determine how signals are generated. In Standard Mode, signals are based on normalized moving average data, while in Advance Mode, signals rely on the combination of MACD, RSI, Stochastic Oscillator, and Parabolic SAR.
Moving Average Settings :
Short Length : The period for the short-term EMA (default is 10).
Mid Length : The period for the medium-term EMA (default is 20).
Long Length : The period for the long-term EMA (default is 38).
MACD Settings :
Fast Length : The period for the fast EMA in the MACD calculation (default is 12).
Slow Length : The period for the slow EMA in the MACD calculation (default is 26).
Signal Line : The signal line period for MACD (default is 9).
Stochastic Settings :
Length : The period for the Stochastic Oscillator (default is 14).
RSI Settings :
Length : The period for the Relative Strength Index (default is 14).
🔵 Conclusion
The Xmaster Formula Indicator is a versatile and reliable tool for forex traders, offering both simplicity and advanced analysis through its Standard and Advance modes. In Standard Mode, traders benefit from straightforward signals based on normalized moving average data, making it ideal for quick decision-making.
Advance Mode, on the other hand, provides a more detailed analysis by combining multiple indicators like MACD, RSI, Stochastic Oscillator, and Parabolic SAR, delivering stronger confirmations for critical market decisions.
While the Xmaster Formula Indicator offers valuable insights and reliable signals, it is important to use it alongside proper risk management and other analytical methods. By leveraging its capabilities effectively, traders can enhance their trading strategies and achieve better outcomes in the dynamic forex market.

Trend Trader-Remastered StrategyOfficial Strategy for Trend Trader - Remastered
Indicator: Trend Trader-Remastered (TTR)
Overview:
The Trend Trader-Remastered is a refined and highly sophisticated implementation of the Parabolic SAR designed to create strategic buy and sell entry signals, alongside precision take profit and re-entry signals based on marked Bill Williams (BW) fractals. Built with a deep emphasis on clarity and accuracy, this indicator ensures that only relevant and meaningful signals are generated, eliminating any unnecessary entries or exits.
Please check the indicator details and updates via the link above.
Important Disclosure:
My primary objective is to provide realistic strategies and a code base for the TradingView Community. Therefore, the default settings of the strategy version of the indicator have been set to reflect realistic world trading scenarios and best practices.
Key Features:
Strategy execution date&time range.
Take Profit Reduction Rate: The percentage of progressive reduction on active position size for take profit signals.
Example:
TP Reduce: 10%
Entry Position Size: 100
TP1: 100 - 10 = 90
TP2: 90 - 9 = 81
Re-Entry When Rate: The percentage of position size on initial entry of the signal to determine re-entry.
Example:
RE When: 50%
Entry Position Size: 100
Re-Entry Condition: Active Position Size < 50
Re-Entry Fill Rate: The percentage of position size on initial entry of the signal to be completed.
Example:
RE Fill: 75%
Entry Position Size: 100
Active Position Size: 50
Re-Entry Order Size: 25
Final Active Position Size:75
Important: Even RE When condition is met, the active position size required to drop below RE Fill rate to trigger re-entry order.
Key Points:
'Process Orders on Close' is enabled as Take Profit and Re-Entry signals must be executed on candle close.
'Calculate on Every Tick' is enabled as entry signals are required to be executed within candle time.
'Initial Capital' has been set to 10,000 USD.
'Default Quantity Type' has been set to 'Percent of Equity'.
'Default Quantity' has been set to 10% as the best practice of investing 10% of the assets.
'Currency' has been set to USD.
'Commission Type' has been set to 'Commission Percent'
'Commission Value' has been set to 0.05% to reflect the most realistic results with a common taker fee value.

Trend Trader-RemasteredThe script was originally coded in 2018 with Pine Script version 3, and it was in invite only status. It has been updated and optimised for Pine Script v5 and made completely open source.
Overview
The Trend Trader-Remastered is a refined and highly sophisticated implementation of the Parabolic SAR designed to create strategic buy and sell entry signals, alongside precision take profit and re-entry signals based on marked Bill Williams (BW) fractals. Built with a deep emphasis on clarity and accuracy, this indicator ensures that only relevant and meaningful signals are generated, eliminating any unnecessary entries or exits.
Key Features
1) Parabolic SAR-Based Entry Signals:
This indicator leverages an advanced implementation of the Parabolic SAR to create clear buy and sell position entry signals.
The Parabolic SAR detects potential trend shifts, helping traders make timely entries in trending markets.
These entries are strategically aligned to maximise trend-following opportunities and minimise whipsaw trades, providing an effective approach for trend traders.
2) Take Profit and Re-Entry Signals with BW Fractals:
The indicator goes beyond simple entry and exit signals by integrating BW Fractal-based take profit and re-entry signals.
Relevant Signal Generation: The indicator maintains strict criteria for signal relevance, ensuring that a re-entry signal is only generated if there has been a preceding take profit signal in the respective position. This prevents any misleading or premature re-entry signals.
Progressive Take Profit Signals: The script generates multiple take profit signals sequentially in alignment with prior take profit levels. For instance, in a buy position initiated at a price of 100, the first take profit might occur at 110. Any subsequent take profit signals will then occur at prices greater than 110, ensuring they are "in favour" of the original position's trajectory and previous take profits.
3) Consistent Trend-Following Structure:
This design allows the Trend Trader-Remastered to continue signaling take profit opportunities as the trend advances. The indicator only generates take profit signals in alignment with previous ones, supporting a systematic and profit-maximising strategy.
This structure helps traders maintain positions effectively, securing incremental profits as the trend progresses.
4) Customisability and Usability:
Adjustable Parameters: Users can configure key settings, including sensitivity to the Parabolic SAR and fractal identification. This allows flexibility to fine-tune the indicator according to different market conditions or trading styles.
User-Friendly Alerts: The indicator provides clear visual signals on the chart, along with optional alerts to notify traders of new buy, sell, take profit, or re-entry opportunities in real-time.

The Magic LineThis script is based on the simple 2 or 3 candle entry model taught by Armando "The Professor".
This strategy will work best on the 1hr timeframe or higher and you can also add a MA on your chart to identify direction of trend and trade with the trend. For example, if price is above the 50 SMA, you can opt to only look for 'buy' signals. If price is below the 50 SMA, you can opt to only look for 'sell' signals.
The default setting is to wait for 3 consecutive candles of either bullish or bearish sentiment before printing a buy or sell signal. This can be changed to any number you would like but typically 3 works best, as long as you're using the 1hr timeframe or higher.
Ex: If there are 3 green (bullish) candles print in a row, a 'sell' signal will print, and the entry line will be one tick below the open of the previous green candle. You can use that line as your entry.
For your stop loss, you can try to use the most recent swing high (for sells) or swing low (for buys). You can also use nearby support/resistance levels, or even the PSAR as another way to determine your stop loss.
If there are more than 3 consecutive candles with the same sentiment, signals will continue to print until the streak ends at which point the counter will restart, and the idea is to take the most recent signal as your entry. Limit/Stop entries work best as you can just let price come down to the signal line that is drawn.
Comment below if you have any questions! Good luck!

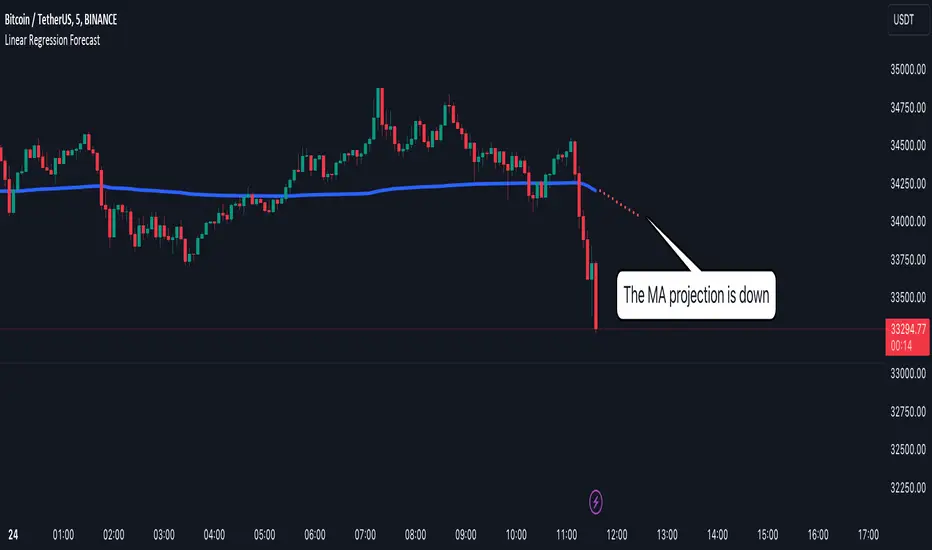
Linear Regression Forecast Tool [Daveatt]Hello traders,
Navigating through the financial markets requires a blend of analysis, insight, and a touch of foresight.
My Linear Regression Forecast Tool is here to add that touch of foresight to your analysis toolkit on TradingView!
Linear Regression is the heart of this tool, a statistical method that explores the relationship between a dependent variable and one (or more) independent variable(s).
In simpler terms, it finds a straight line that best fits a set of data points.
This "line of best fit" then becomes a visual representation of the relationship in the data, providing a basis for making predictions.
Here's what the Linear Regression Forecast Tool brings to your trading table:
Multiple Indicator Choices: Select from various market indicators like Simple Moving Averages, Bollinger Bands, or the Volume Weighted Average Price as the basis for your linear regression analysis.
Customizable Forecast Periods: Define how many periods ahead you want to forecast, adjusting to your analysis needs, whether that's looking 5, 7, or 10 periods into the future.
On-Chart Forecast Points: The tool plots the forecasted points on your chart, providing a straightforward visual representation of potential future values based on past data.
In this script:
1. We first calculate the indicator using the specified period.
2. We then use the ta.linreg function to calculate a linear regression curve fitted to the indicator over the last Period bars.
3. We calculate the slope of the linear regression curve using the last two points on the curve.
We use this slope to extrapolate the linear regression curve to forecast the next X points of the indicator.
4/ Finally, we use the plot function to plot the original indicator and the forecasted points on the chart, using the offset parameter to shift the forecasted points to the right (into the future).
This method assumes that the trend represented by the linear regression curve will continue, which may not always be the case, especially in volatile or changing market conditions.
Examples:
Works with a moving average
Works with a Bollinger band
The code can be adapted to work with any other indicator (imagine RSI, MACD, other Moving Average Type, PSAR, Supertrend, etc...)
Conclusion
The Linear Regression Forecast Tool doesn't promise to tell the future but provides a structured way to visualize possible future price trends based on historical data. I
Remember, no tool can predict market conditions with certainty.
It's always advisable to corroborate findings with other analysis methods and stay updated with market news and events.
Happy trading!
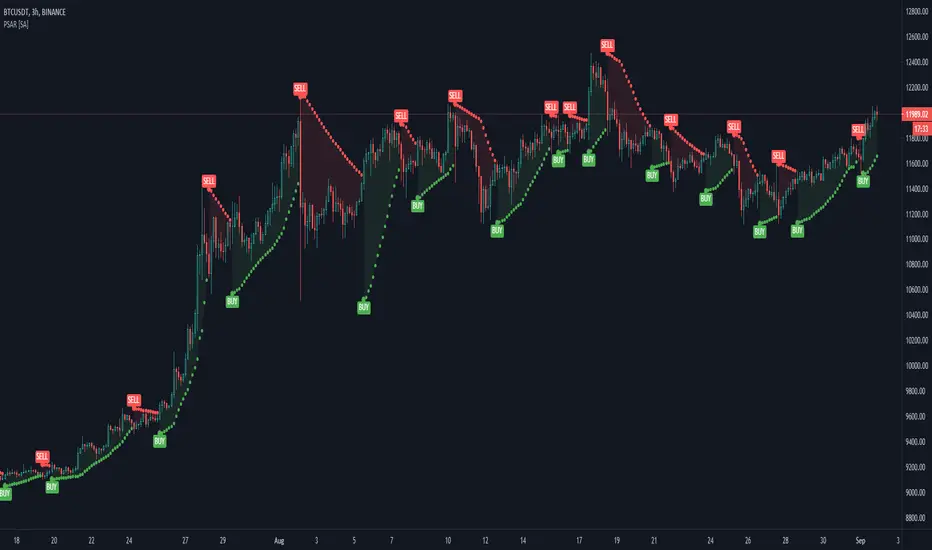
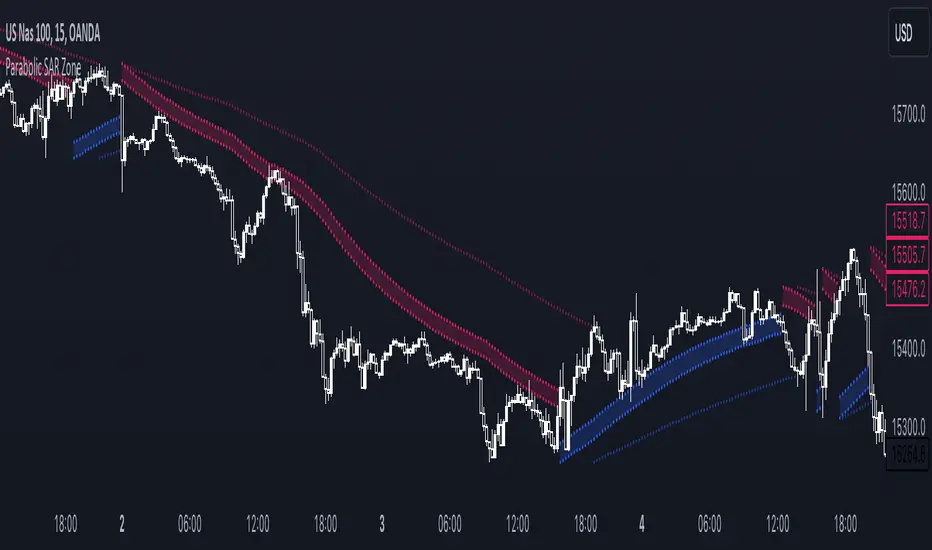
Parabolic SAR ZoneThe Parabolic SAR Zone indicator is a tool designed to help traders identify the best zone to enter in a position revisiting the usage of the standard Parabolic SAR indicator.
In the settings you can choose all the parameters of the standard indicator, and in addition to that you can also change the multiplier for the zone width.
This indicator provides two different Parabolic SAR indicators, the first one has the settings that you chose and displays the zone, meanwhile, the second one has half the parameters you have chosen and can be used to determine the long-term trend direction.
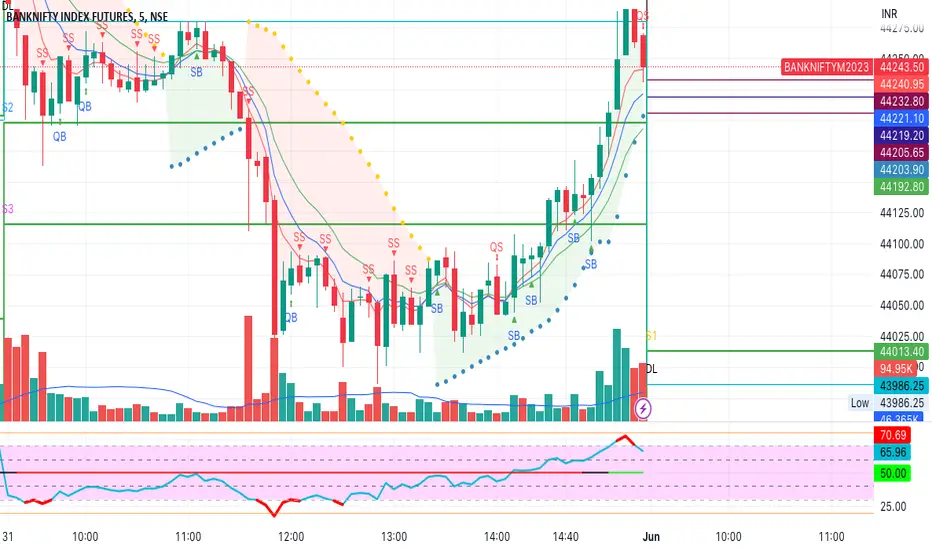
Buy Sell using 5-8-13 EMA, RSI, PSAR IndicatorThis indicator generates Scalping and Strong Buy/Sell Signals.
Quick Scalp signals are generated using 5 EMA and RSI.
Strong Buy/Sell Signals are generated using combination of 5-8-13 EMA and Parabolic SAR.
Signals generated:
QB: Quick Buy
QS: Quick Sell
SB: Strong Buy
SS: Strong Sell
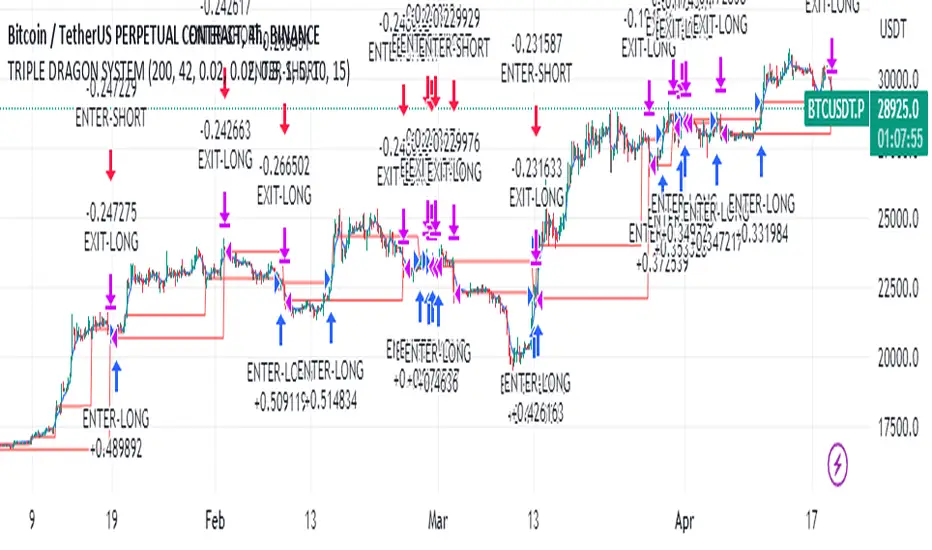
Educational Strategy : TRIPLE DRAG-ON SYSTEM V.1The Triple Dragon System is a technical trading strategy that uses a combination of three different indicators to identify potential buy and sell signals in the market. The three indicators used in this strategy are the Extended Price Volume Trend (EPVT), the Donchian Channels, and the Parabolic SAR. Each of these indicators provides different types of information about the market, and by combining them, we can create a more comprehensive trading system.
The EPVT is used to identify potential trend changes and measure the strength of a trend. The Donchian Channels are used to identify the direction of the trend, while the Parabolic SAR is used to provide additional confirmation of trend changes and help determine potential entry and exit points.
In this strategy, we first use the EPVT and Donchian Channels to identify the direction of the trend. When the EPVT is above its baseline and the price is above the upper Donchian Channel, it suggests an uptrend. Conversely, when the EPVT is below its baseline and the price is below the lower Donchian Channel, it suggests a downtrend.
Once we have identified the trend direction, we use the Parabolic SAR to help determine potential entry and exit points. When the Parabolic SAR is below the price and flips to above the price, it suggests a potential buy signal. Conversely, when the Parabolic SAR is above the price and flips to below the price, it suggests a potential sell signal.
To further refine our trading signals, we use multiple timeframes to confirm the trend direction and ensure that we are not entering the market during a period of high volatility. We also use multiple take-profit levels to lock in profits and manage risk.
Overall, the Triple Dragon System is a comprehensive technical trading strategy that combines multiple indicators to provide clear entry and exit signals. By using a combination of trend-following and momentum indicators, we can identify potential trading opportunities while minimizing risk. Please note that this strategy is for educational purposes only and should not be taken as financial advice.
SumIndTarget:
The SumInd indicator combines Heiking Ashi, Sar Parabolic, Koncord, RSI, DMI, MACD and Bollinger Bands to give buy or sell signals or trends. This are called base indicators.
The goal is to have a clear and quick buy or sell suggestion and to avoid evaluating all or some of the named indicators, especially if they give contradictory signals among them. This speed and simplicity helps the trader to see several tickers in less time. It is intended for all markets and time periods where the above-mentioned indicators can be used.
How it works:
SumInd already has the importance or "weight" of each indicator named above configured, but they can be modified. You can set 0% for no use, or any other value based on the weight you want to give it, between 1% and 200% where 100% is the normal use, and increases or decreases based on importance.
Each base indicator can give signals to buy, sell or just "wait and see".
Each base indicator is checked for a buy signal, in which case its weight is added to the positive or green line, and if there is a sell signal, its weight is subtracted from the sell or red line. in case of indeterminacy or 'wait and see', nothing is added to any signal.
The yellow or total line is the sum of the buy or green signal plus the sell or red signal.
If the yellow or total line rises above the buy level, the background changes to green and an up arrow appears at the bottom of the chart indicating the buy suggestion, because most of the indicators you are interested in gave a buy signal.
If the yellow line or total falls below the sell level, the background changes to red and a downward arrow appears in the upper area of the chart indicating the sell suggestion, because most of the indicators you are interested in gave a sell signal.
The Buy and Sell level can be changed according to the security of the suggestion you need.
Areas without arrows or marks are considered "wait and see" areas, the previous trend in principle continues. They can be marked with the default background if desired from the SumInd settings.
Details and criterials:
Each of the following indicators can be turned on or off and assigned different weights of importances, by whether or not it shares the following criteria:
Heikin Ashi candles: add or subtract half an assigned weight if there is a buy or sell candle and the other half weight if there are two consecutive candles with the same signal.
RSI: Adds or subtracts the assigned weight if the ema is below or above the signal.
Parabolic Sar: Adds half a weight in transition to buy or sell and another half weight if there are two consecutive signals of the same trend.
Koncord: Add or subtract the weight if the current trend (mountain) grows or decreases respectively from the 4th previous time signal, and also the value (red line) is less than 35 or exceeds 65 respectively.
DMI: Adds or subtracts a quarter of the weight assigned by the DMI signal multiplied by the value of DMI, if the positive or negative signal exceeds the other negative or positive signal by 15% respectively.
Bollinger Bands: Add or subtract the weight if the previous third signal touches or falls out of the zone and keeps growing or decreasing respectively.
MACd: Add or subtract one third of the weight if the last 3 time signals are rising or falling, Add or subtract another third if the fast signal is above or below the slow signal, and Add or subtract the last third of the weight if it is rising with the negative fast signal, or falling with the positive fast signal.

Consolidated IndicatorI have attempted to combine all the parameters to decide on the entry and exit points for stocks. The indicator combines
1) EMAs
2)PSAR
3)ATR
The script also attempts to show the risk-reward
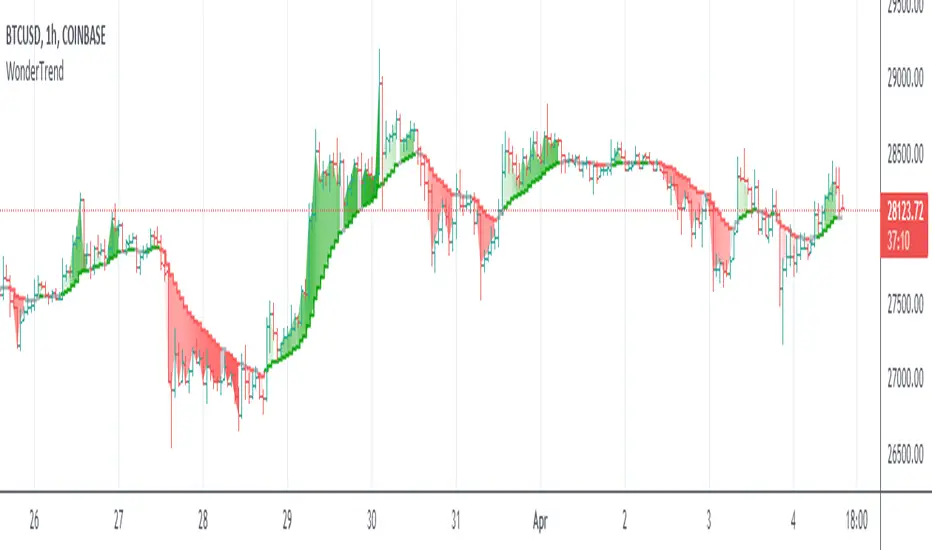
WonderTrend IndicatorDetermining trends and reversals are the keys to trading, yet very difficult. Parabolic SAR is hard to trade during choppy price action. SuperTrend is a bit late in determining changes of trend and not great and exit signals.
So WonderTrend is a bit of both, a more stubborn PSAR, also a faster SuperTrend. The green is up, red is down, and yellow is caution helps traders read the chart patterns to enter and exit.
Enjoy!
Parabolic SAR Oscillator [LuxAlgo]This indicator is a detrended price series using the Parabolic Stop and Reverse (SAR) trailing stop, resulting in a bounded oscillator in the range (-100, 100). The SAR output is also normalized to obtain a noiseless oscillator which can complement the detrended price.
Settings
Start: Initial value of the convergence factor used when a new trend is detected by the SAR
Increment: Increment value of the convergence factor
Maximum: Maximum value of the convergence factor
Usage
The price is detrended by subtracting the closing price to the SAR, this result is then normalized.
An up-trending market is indicated once the normalized SAR reaches -100, while a value of 100 indicates a down-trending market. One can anticipate trends when the normalized SAR crosses above/under 0.
The converging nature of the SAR trailing stop allows for the trader to obtain a very apparent leading oscillator.

Parabolic SAR with the ADX overlayThe following indicator and chart pattern is based on a twist from Welles Wilder's parabolic stop and reverse . This is a trend following system which is essentially a dynamic trailing stop loss for longs and shorts. The system is often criticized for it's poor performance in choppy rangebound markets so people often combine it with other signals that attempt to identify a "trend" the ADX is a popular indicator with three indicators, the DI+ "Positive Directional Indicator" the DI- "Negative Directional Indicator" and then a combination of the two, the ADX "Average Directional Indicator". Generally speaking, if the DI+ is above the DI- and the ADX is greater than 25 then we are in a positive trending market. If the DI+ is less than the DI- and the ADX is greater than 25 then we are in a negative trending market. If the ADX is less than 25 then there is no trend in place and we are in a range bound "choppy market".
So, I created this chart to show when the ADX is > 25 (or you can enter your own number) and the DI+ is > DI- then the background will be green. Vice versa, when the ADX is >25 and the DI+ is < DI- then we are in a negative trending market and the background color will be red. If the ADX is < 25 (or whatever you choose) then we are in a choppy 'range-bound" market.
Regarding the ParSAR. Pay attention to the "+" marks. they indicate whether we are bullish or bearish. When we cross through a + then we revert to the opposite. "Stop And Reverse". They are a simple calculation of a starting percentage, an incremental increase in that percentage, and a max percentage increase. If you want your system to trade less, decrease the "maximum" If you want it to trade more, increase the maximum.
Tinker around with these and you might find a healthy strategy you can trade on.
If you add Take Profit Targets and Stop Loss Targets, this is an even more productive strategy. Try it out on BINANCE:ETHUSDT with a 2hr time horizon and 0.02, 0.023, 0.2.

[Mad]Trend BarcolorsTrend colors based on PSA and selectable Ma's.
classic PSAR trend mixed with 2 selectable MA's switching between Bullish Neutral Baerish
the switching logic is in colorlogic()
usage: colorswitch maybe one entry.
if you want to trade with a trend example: green yellow, green << entry (long)
if you want to trade against a trend example: green yellow red (entry short)
This is not an indicator that works on its own, it is a helper in a decision, never a single instrument is possible.
have fun

SAR+RSI+EMAs SignalsNOTE:
Indicator based strategies may expire and begin to work again. There are various ways to check the expiration of these strategies but I suggest equity curve trading (EC trading) as the best one.
Please check every single indicator based strategy to see if it’s still profitable or it has been expired to avoid losses.
Principles:
I personally believe every profitable indicator-based setup need 3 factors. Actually I analyze indicator-based set up in this way!
1- Trend detector: a tool that detect the “trend”.
2- Oscillators (Discount finder): a tool that detects “discounts” in the direction of the trend.
3- Stimulus: A tool that indicates the Initiation of a movement.
There may be profitable strategies that do not use all three, because other factors are strong enough to lead us to profit, but they are rare and sometimes they hide the other forgotten factor in the main two ones.
Elements:
(Since most of traders here, are familiar with these famous indicators I will not take your time to write about their uses and formula)
SAR: As a Trend detector, regarding position of close and SAR
EMA 7 and EMA 21: As trend detectors, regarding position of EMA 7 as fast “moving average” and EMA 21 as slow one. Also we need another confirmation for trend regarding EMA 7 and closing price of the signal candle.
RSI: In this strategy RSI is used both as a discount finder and a stimulus.
For RSI being over/under 50, regarding the trend, a possible discount may have been occurred. Imagine these conditions: close>EMA7, EMA7>EMA21, close>SAR and simultaneously RSI being under 50 is really a sign of powerful uptrend which it’s RSI decreasing might be a sign of corrective move, which will be following a bullish impulsive move.
The other use of RSI is to stimulate a buy signal by “crossing” over 50 or 30 (50 as balanced point of momentum and 30 as a sign of ending an oversold) or stimulate a sell signal by “crossing” under 50 or 70 (50 as balanced point of momentum and 70 as a sign of ending an overbought).
Entry point: you can use one of the followings.
1- Open of the next candle
2- EMA 7
3- Open of the signal candle
(Totally optional but “open of the next candle” is suggested by me.)
SL: Use one of the followings.
1- SAR or some pips (regarding ATR Or your experience of this trading instrument’s fluctuations in this time frame) below the SAR
2- Fixed amount (regarding ATR Or your experience of this trading instrument’s fluctuations in this time frame)
3- Use EMA21 as dynamic SL (if a candle far enough from the initiative candle close over (for sell) below ( for buy)
Again number 1 is suggested by me.
TP: Use one of the followings.
1- Use static levels or zones of support and resistance as TP.
2- Use dynamic levels for instance band of BB or moving averages (Moving the SL is possible).
3- Use fixed R to R
And I believe static zones of support and resistance work better.
Examples:
I indicate a buy signal on the chart!
Using local level as TP worked just good.
Using EMA was better in this case.
And using a riskier level or a fixed R to R is obvious in the chart!
Since in the range markets, this strategy may not work well and at the same time, TP to SL might be too small to be worth the risk, I prefer to use levels to filter range market conditions!
I convert all those circumstances to a simple buy and sell signs on the chart!
EMA21 and SAR are still visible because it is possible that traders use them for their TP and SL.
This is how it look without EMA21 and SAR!
Another screenshot of this strategy!
I also add a check box to filter signals by another trend detector. MATD created by me to help traders detect trend!
As it’s visible, some profitable signals filtered too, but using a longer-term trend detector as an additional one, alongside the double EMAs is very useful for this strategy.
The other box “use high&low instead of close for fast EMA” makes the “EMA7 and close” trend detector an easygoing one!
Almost everything is editable here!
*** I did not invent this strategy, you can find it for free on net ***
I'll change it to a "strategy" instead of an indicator if reader like to!

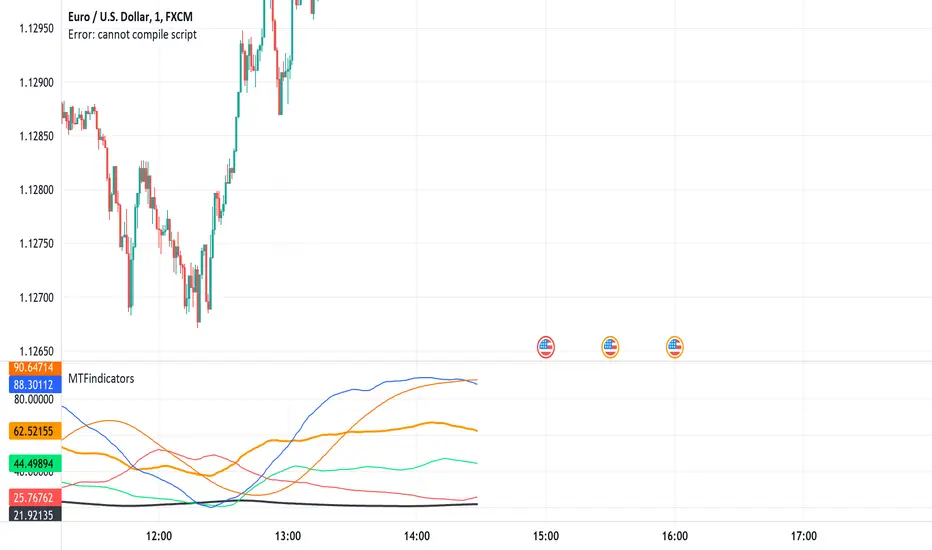
MTFindicatorsQuite recently TradingView added the possibility to create and use Libraries in PineScript. With this feature PineScript became higher quality of coding language overnight. Libraries enable splitting your code into multiple files, providing easier access to code reusability.
I was working on a script which included 3000 lines of code, which was recompiling 1:30 min, and recalculating over 1 minute as well. So I split it into 2 parts: main part + library containing "main logic", which I reuse in variety of scripts, but don't change too often. Result? Now recompilation of my main script takes 10 and recalculation 8 seconds!!!. I instantly fell in love with libraries.
Having said that, and being dedicated hater of security() calls, I have decided to publish a library of MTF indicators created with my own approach: "dig into formula". I have explained reasons for such approach in desription to this script:
So this library script will be a set of indicators reaching to higher timeframes. Just include one line at the beginning of the script you are creating:
import Peter_O/MTFindicators/1 as LIB
and then somewhere is the code add this line:
rsimtf=LIB.rsi_mtf(close,5,14)
All of a sudden you have access to rsimtf from 5x higher timeframe without any hassle :)
I start with RSI MTF, next ones will be ADX, Stochastic and some more. I will update this library with them here as well. Feel free to request particular indicators in comments. Maybe PSAR? Maybe Bollinger Bands?
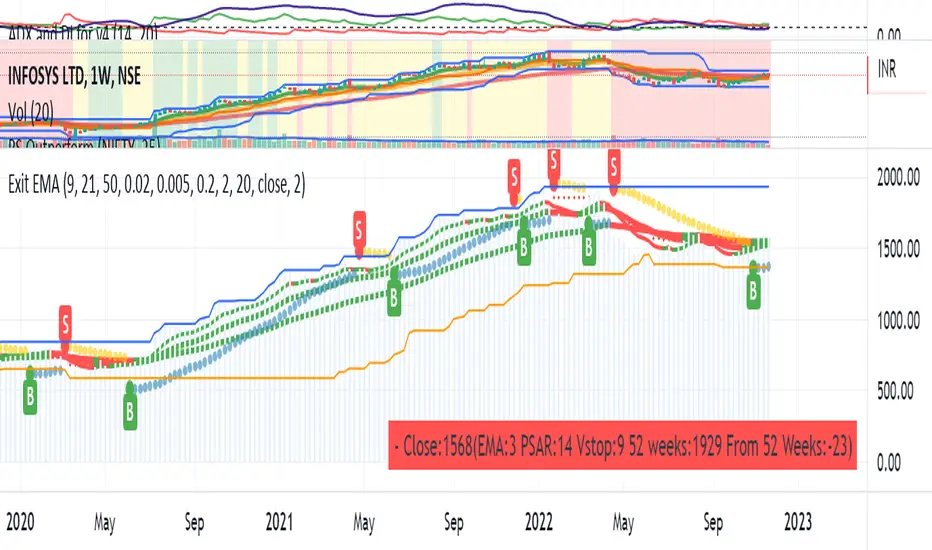
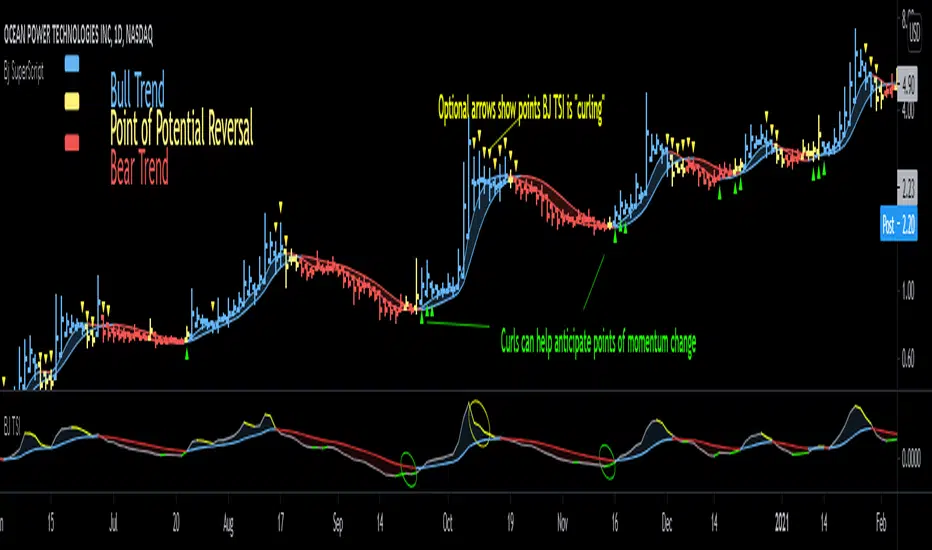
Bjorgum SuperScript
Bjorgum Reversal
Bj Reversal uses Tilson moving averages to identify trend changes
Bars change to yellow as bar close crosses the Tilson moving averages. Blue or red is confirmed as the two Tilson averages themselves cross.
Reversal is great for pinpointing trend change often giving the absolute best entry or exit
Its sensitive nature can mean more false signals on some assets
Be sure to use other indicators from the Bjorgum Collection to confirm signals, or use another strategy that fits the asset or time frame being viewed
Bjorgum HEMA Strategy
Hema uses HA smoothed EMAs to identify trend direction
Default EMA lengths are 5,9, and 21 period
Bar Color will change Malibu or Ruby on a cross of BOTH 5 and 9 EMA
The lengths are customizable to whatever lengths the user desires
Rolando Santos True Relative Movement (TRM)
This underrated momentum strategy conceptualized by Rolando Santos uses 2 indicators to give a 3 color scheme
A leading indicator (RSI) is combined with a lagging indicator (TSI) to produce bar colors based on the condition of each indicator
Both indicators in positive territory produce blue bars
Both indicators in negative bias produce yellow bars
If signals are mixed (one up one down) bars become grey
Speed Selection
The Bjorgum speed selector optimizes the strategy based on the users desires or trading style at the touch of a button
Fast setting is better for swing trades - more timely signals, more whipsaw
Slow setting is better for longer holds or more volatile assets - slower signals, smooths out whipsaw
RSI Bar Color
RSI color changes bar color based on user defined RSI values
Buy/ sell signals are typically given on a cross of the 50 level
Speed selector (fast/Slow) automatically changes lengths between Bj RSI (5 period) and a standard RSI (14 period)
Additional capabilities can be mixed and matched from strategies in the "Strategy Override" section
Add-ons include:
Tilson - The moving average system from Bjorgum Reversal can be toggled to couple with another bar color strategy by clicking this button
PSAR - Parabolic Stop and Reverse indicator can help with trend direction, volatility, and stop losses
HEMA - The 3 moving average system from the HEMA strategy can be coupled with any of the other strategies by clicking "Show HEMA"
Bj Arrows - These arrows plot at the bar level to draw attention to when the BJ TSI is "curling" (See profile for Bjorgum TSI and download today)
-Optional "Plotbar Overlay" plots bars with Heikin-Ashi Inputs when toggled
-This allows for the benefits of price smoothing without sacrificing moving average and indicator performance as real close value is still used
-This can also help on short time frames and improve results with crypto! The user must "mute" the main series candles when in use to avoid candle overlap.
-Optional price line as muting main bars will disable the TradingView default price line. The horizontal plot will track the real closing price while in HA mode!
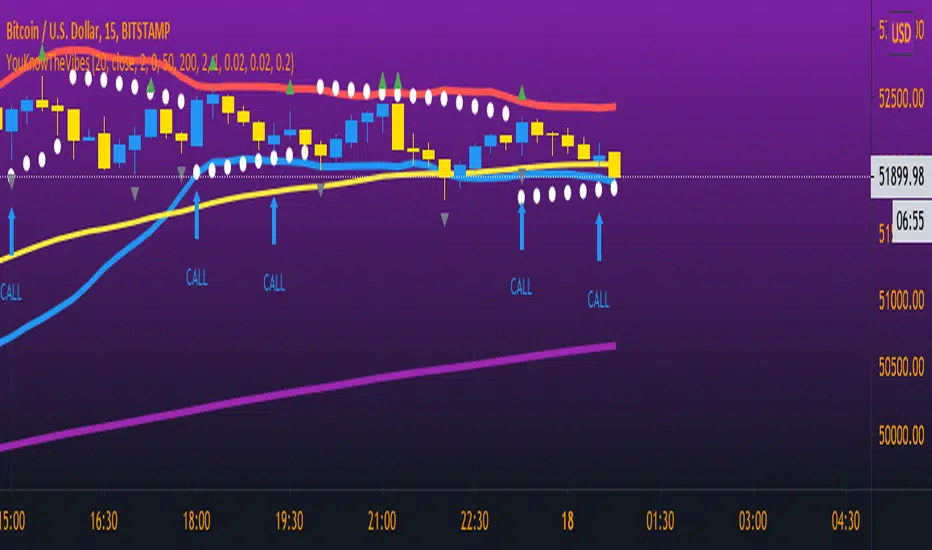
YouKnowTheVibesThis is mainly used for trading binary options but can be used for regular forex trading as well. If price is above BOTH EMAs and PSAR then you're looking for BUY opportunities. If price is below then you're looking for sell opportunities. Wait for price to break the most recent fractal high/low and retest; wait for a confirmation candle then enter a call/put and the expiry time is THREE candles.
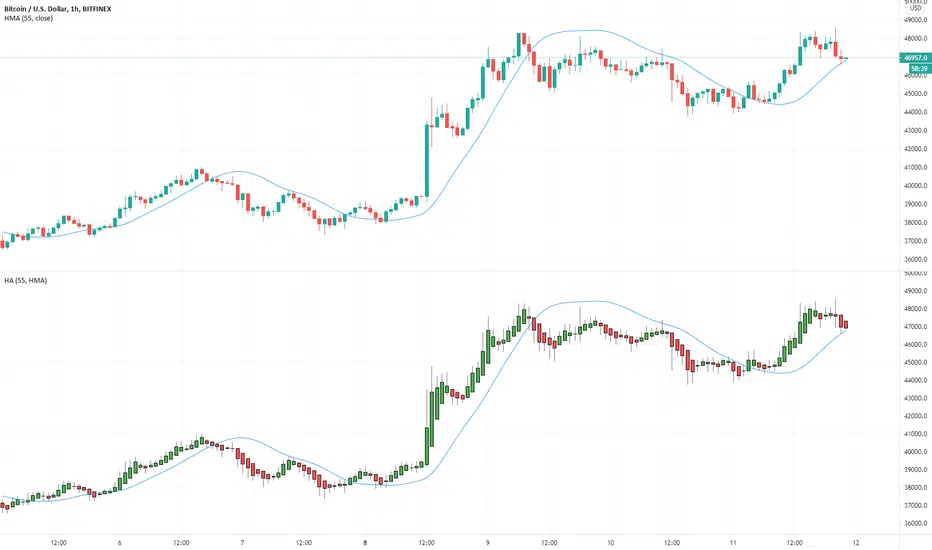
Multiple Moving Averages for Heikin Ashi I want to give credits to @QuantNomad, i got the heikin ashi part of the script from this open script /0iKy7lyG-QuantNomad-Heikin-Ashi-PSAR-Strategy/;
and to the other guy that provided a 17 type of moving average script open source but i forgot his name, if someone remember please tell me.
My idea was to see how the different types of moving averages behaves in a Heinkin Ashi chart, you can change to more than 15 types of Moving Average and use it the way you want it.
For the source of the moving averages i used a simple moving average of 1 period using the high of the heikin ashi candle, low of it and divided by 2 as the source of the different types of moving averages.
Different types of Moving Averages
Moving Average Types
SMA ---> Simple
WMA ---> Weighted
VWMA ---> Volume Weighted
EMA ---> Exponential
DEMA ---> Double EMA
ALMA ---> Arnaud Legoux
HMA ---> Hull MA
SMMA ---> Smoothed
LSMA ---> Least Squares
KAMA ---> Kaufman Adaptive
TEMA ---> Triple EMA
ZLEMA ---> Zero Lag
FRAMA ---> Fractal Adaptive
VIDYA ---> Variable Index Dynamic Average
JMA ---> Jurik Moving Average
T3 ---> Tillson
TRIMA ---> Triangular
The type of moving average you select will appear in a separated chart with Heikin Ashi candles, like in the image above.
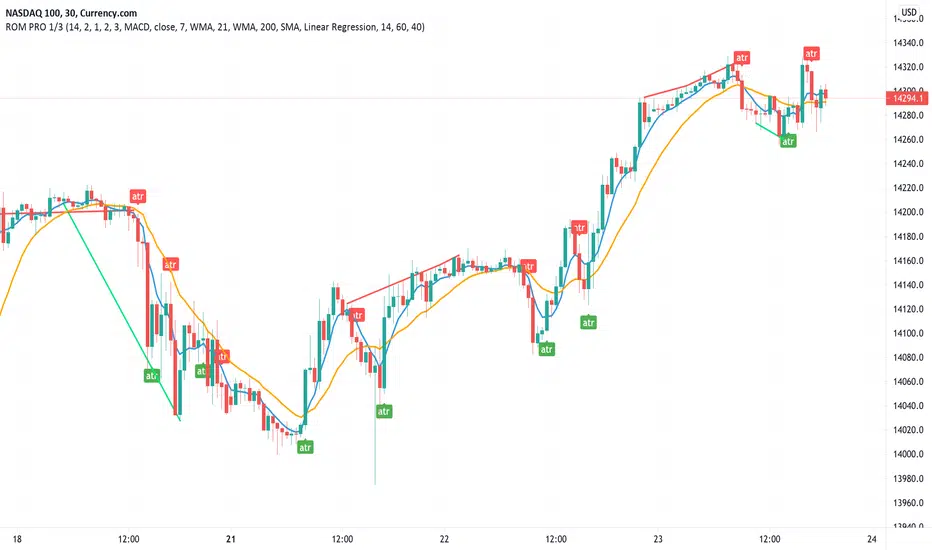
Rain On Me PRO 1/3This is the part 1 of Rain On Me PRO. It follow my two other indicators "Rain On Me" and "Rain On Me V2". This version is called "PRO" because it is less "user-friendly" than the two previous versions. But it is more faster, and cleaner than ever!
This indicator is separated into 3 parts. You can find all parts into my profile in the « Scripts » section. Once the 3 parts together, the indicator is complete..
Here are the features for this part (no-repaint on this one):
-ATR with alerts (Buy and Sell signals).
-VPT with alerts (Buy and Sell signals).
-PSAR with alerts (Buy and Sell signals).
-SuperTrend with alerts (Buy and Sell signals).
-Doji with alert (A yellow arrow show you when a good Doji signal appear).
-Divergences on chart (Red is bearish or green is bullish) with multiple type of divergence (MACD, OBV, RSI or CCI) with alerts.
-Market Range Bar Filter Color. (You have to configure the TimeZone of the market in UTC and then it will show you blank bar where the volatility is low).
-3 Moving Averages with cross alert for MA1 and MA2.
Everything is fully customizable in settings.
To place an alert, always choose the "Once per bar" option.
Many functions are still to come. So don't hesitate to report bugs, suggestions and follow me to always be kept informed of the next updates to come!
//ALWAYS DELETE INDICATOR AND ALERTS AND RESET THEM AFTER AN UPDATE!
Thank again everyone for your support!
Good trade everyone! And remember, money management is the most important!