Hourly Market Movement Pattern Indicator# Hourly Market Movement Pattern Indicator
This versatile technical analysis tool identifies the most active hours for trading by analyzing historical price movements. While it can be viewed on any timeframe chart, the indicator specifically tracks and displays which hours of the day historically show the strongest upward or downward price movements, helping traders optimize their trading schedule around these recurring hourly patterns.
## Core Features
- Tracks the best performing hours for both upward and downward movements
- Viewable on any timeframe chart while maintaining hourly analysis
- Clear visual display through a color-coded table overlay
- Real-time updates with new market data
- Works with all trading instruments (stocks, crypto, forex, futures, etc.)
## Timeframe Applications
### Chart Viewing Options
- Can be viewed on any timeframe chart (1min to Monthly)
- Maintains hourly pattern analysis regardless of chart timeframe
- Helps correlate hourly patterns with your preferred trading timeframe
- Allows detailed visualization of hourly patterns within your analysis period
### Intraday Trading
- Identify the most profitable hours for trading
- Plan trading sessions around historically strong hours
- Optimize entry and exit timing based on hourly patterns
- Structure day trading schedules around peak movement hours
### Swing Trading
- Use hourly statistics to optimize entry/exit timing
- Plan trade executions during historically strong hours
- Time position entries based on hourly success rates
- Enhance swing trading decisions with hourly pattern data
## Practical Applications
### Pattern Recognition
- Track recurring hourly market movements
- Identify institutional trading hour patterns
- Detect regular market cycle hours
- Recognize changes in hourly market behavior
### Risk Management
- Adjust position sizing based on historical hourly patterns
- Plan entries during statistically favorable hours
- Time stop loss adjustments around known volatile hours
- Scale positions according to hourly success rates
### Trade Planning
- Schedule trading sessions during optimal hours
- Plan trade executions around strong movement periods
- Structure trading day around peak hours
- Time position adjustments to favorable hours
## Setup Options
- Timeframe: View on any chart timeframe while tracking hourly patterns
- Visual Display: Non-intrusive table overlay
- Color Coding: Green for upward movements, Red for downward movements
- Hour Display: 24-hour format for global market compatibility
## Trading Strategy Integration
The indicator enhances trading approaches through:
- Optimal hour identification for trade execution
- Historical hourly pattern analysis
- Day trading session optimization
- Position timing based on hourly statistics
## Notes
This indicator proves particularly valuable for:
- Traders seeking to optimize their daily trading schedule
- Day traders focusing on peak market hours
- Swing traders optimizing entry/exit timing
- Traders adapting strategies to specific market hours
- International traders tracking hour-specific patterns across sessions
The tool's hourly pattern analysis provides crucial timing information regardless of your preferred chart timeframe or trading style, helping optimize trade execution around the most statistically favorable hours of the day.
스크립트에서 "profitable"에 대해 찾기

MTF Fractal Bias Confluence DetectorMTF Fractal Bias Confluence Detector
This indicator, the MTF Fractal Bias Confluence Detector, is based on the idea that the market exhibits fractal behaviour. The origin of the idea traces back to 1963, when Benoit Mandelbrot analyzed the fluctuations in cotton prices over a time series starting in 1900, discovering that price changes exhibited scale-invariant patterns. This means that the curve representing daily price changes mirrored the shape of monthly price changes, highlighting the fractal nature of market behaviour. When applied to swing points across multiple timeframes (MTF), this concept suggests that swing points demonstrate similar patterns regardless of the timeframe being analyzed. These self-similar fractal structures provide traders with insights into market reversals and trends, making them a powerful tool for multi-timeframe analysis.
A Swing Point is made up of three main parts: a move away from the last Break level; forming a peak (pivot point) with a Fakeout of the peak (explained through an example later); and a subsequent move away from it. These swing points recur across all timeframes as part of cyclical momentum patterns, meaning each swing point gives rise to a new cycle of market movement. Due to the fractal nature of the market, larger cycles encompass multiple smaller ones.
The theory behind the Fractal Bias Confluence Detector utilizes the idea that the market movements are fractal in nature and illustrates how such swing points can be identified across MTFs. To do so, we examine the Peak Fakeouts within these cycles, as they form. It is not possible to know in advance how long each of these moves will last, but a Swing Point will often occur with a Peak Fakeout. Therefore, the most critical element is to identify the Peak Fakeout.
The snapshot below captures a Peak Fakeout, as discussed earlier.
Similarly, the following snapshot shows various possible breakdowns of Higher Time Frame (HTF) cycles into smaller Lower Time Frame (LTF) movements. The chart contains a white table(not part of the indicator and shown for illustration purposes only).
To further illustrate. Consider the combination of Time Frames (TF) from the 2nd row (from the above snapshot). Cycle TF (1M), Setup TF (1W), Momentum TF (1D) etc.
Price movements in the 1M TF highlight the direction in which HTF traders are pushing the market. Often, when markets have broken out of a level, they tend to form a peak and can then pull back towards the prior breakout level. Once the pullback is beyond the last breakout level, in the opposite direction, we may say the peak formation is created, and directional bias has changed. This is also called Peak Fakeout. Due to the fractal nature of the market, Swing Points on the HTF will often constitute multiple Swing Points on the LTF, though they are not always in sync. However, after such peak formation, there is a high probability that the price might move away from the peak for at least 1 candle (in the cycle TF). This theory illustrates that once a new cycle is in play, we can then look at 1W (Setup TF) to look for possible in-sync movements, at least within that 1 candle of the HTF. Repeating the same for further lower TFs, we may arrive at a confluence of Fractal Bias and see how the movements in LTF are driven by the HTF momentum.
Another example within the chart:
Note: The above examples are just for illustration purposes, and other permutations and combinations of movements across multiple TFs are also possible.
This indicator aims to help users identify such fractal-bias-confluences, so that they can leverage the fractal nature of the market to get a holistic view. To do so, the indicator displays how the market has moved across multiple time frames, with respect to different historical levels.
Features:
1. The bias summary table
The following snapshot depicts the bias summary table at the bottom right of the chart.
1.1. Workings: The table will display, for various TFs, in the first four (starting from "current" to Prev ) rows, one of the following.
"F/H" , " Acronym for the failed break of the previous high",
"F/L" , " Acronym for the failed break of the previous low",
"B/H" , " Acronym for the break of the previous high",
"B/L" , " Acronym for the break of the previous low",
"IN" , " Acronym for an inside candle (never broke high or low of perv candle)",
"OT" , " Acronym for an outside candle (broke both high and low of previous candle and closing price is in between previous high and low)".
Note: these acronyms are customizable according to the user's choice of terminology in any language, as shown in the snapshot below.
1.1.1 In the above snapshot, the 1st row, called "Current", shows how the current candle is evolving with respect to the previous one. The "previous" row shows how the previous candle closed with respect to the pre-previous one. The next two rows represent the bias of the pre-previous and pre-pre-previous in a similar manner. By default, the bias is updated in real-time, even for the already closed historical candles. For example, if the previous 4H candle closed as a B/H and the current price then comes below the pre-previous 4H candle high, then the bias of the previous candle will get updated to F/H. This informs the user that the break above the pre-previous high has failed. However, the user has the option to turn this off. The information in these four rows shows the user how the market is moving currently and how it evolved before reaching the current price levels.
Note: The calculation done by the indicator is to keep track of how the price is moving with respect to the last candle levels in real-time. This means if the price first goes above the previous high and then goes below the previous low, the indicator is equipped to display what happened in the most recent time. The snapshot below shows the option to turn on/off such updates in the bias summary table.
Note: While the bias summary table is turned on, the user also has the option to turn off Prev and Prev rows, as shown in the snapshot below.
1.1.2 The 2nd to last row, called CL/CS(Consecutive Long/Short), shows whether consecutive (2+) breaks of high/low happened or not in one direction without taking out the previous candle's range in the opposite direction. When conditions are met, it will show the number of times the price has been pushed in one direction (in the above manner), followed by "L" for long and "S" for short, for each TF, for example, "4L". It gets updated in real-time for each push in the same direction. Furthermore, a good analogy of "4L" on an HTF is 4 consecutive Break of Structure (BOS) (in the same direction) on LTF, without a Change of Character (CHoCH). Another example would be Stacey Burke's 3 consecutive rises that can be mapped in the indicator, if the conditions are met for "3L" for a given TF.
1.1.3 The last row, FRC/FGC, stands for the first red/green candle. It shows whether the last candle of a TF has closed as green (i.e., close>open) after posting two red candles (i.e., close

ADX-DMIThis script manually calculates the Directional Movement Index (DMI) and the Average Directional Index (ADX) using Wilder’s smoothing technique. The DMI indicators are used to assess the strength and direction of a market trend. It includes three main lines: ADX (yellow), DI+ (green), and DI− (red). Traders use these indicators to determine whether a trend is strong and in which direction it is moving.
The process begins by defining the length parameter, which determines how many periods are considered in the calculation. It then calculates the True Range (TR), which is the greatest of three values: the difference between the current high and low, the difference between the current high and the previous close, and the difference between the current low and the previous close. This TR is used to compute the Average True Range (ATR), which smooths out price fluctuations to get a clearer picture of the market’s volatility. Next, the script calculates the +DM (positive directional movement) and -DM (negative directional movement) based on the changes in the highs and lows from one period to the next.
Finally, the script computes the DI+ and DI− values by dividing the smoothed +DM and -DM by the ATR and multiplying by 100 to express them as percentages. The DX value is calculated as the absolute difference between DI+ and DI−, normalized by the sum of both values. The ADX is then derived by smoothing the DX value over the specified length. The three indicators — ADX, DI+, and DI− — are plotted in the lower chart panel, providing traders with visual cues about the trend’s direction (DI+ and DI−) and strength (ADX).
Important Notice:
The use of technical indicators like this one does not guarantee profitable results. This indicator should not be used as a standalone analysis tool. It is essential to combine it with other forms of analysis, such as fundamental analysis, risk management strategies, and awareness of current market conditions. Always conduct thorough research.
Note: The effectiveness of any technical indicator can vary based on market conditions and individual trading styles. It's crucial to test indicators thoroughly using historical data before applying them in live trading scenarios.
Disclaimer:
Trading financial instruments involves substantial risk and may not be suitable for all investors. Past performance is not indicative of future results. This indicator is provided for informational and educational purposes only and should not be considered investment advice. Always conduct your own research before making any trading decisions.
Uptrick: Fisher Eclipse1. Name and Purpose
Uptrick: Fisher Eclipse is a Pine version 6 extension of the basic Fisher Transform indicator that focuses on highlighting potential turning points in price data. Its purpose is to allow traders to spot shifts in momentum, detect divergence, and adapt signals to different market environments. By combining a core Fisher Transform with additional signal processing, divergence detection, and customizable aggressiveness settings, this script aims to help users see when a price move might be losing momentum or gaining strength.
2. Overview
This script uses a Fisher Transform calculation on the average of each bar’s high and low (hl2). The Fisher Transform is designed to amplify price extremes by mapping data into a different scale, making potential reversals more visible than they might be with standard oscillators. Uptrick: Fisher Eclipse takes this concept further by integrating a signal line, divergence detection, bar coloring for momentum intensity, and optional thresholds to reduce unwanted noise.
3. Why Use the Fisher Transform
The Fisher Transform is known for converting relatively smoothed price data into a more pronounced scale. This transformation highlights where markets may be overextended. In many cases, standard oscillators move gently, and traders can miss subtle hints that a reversal might be approaching. The Fisher Transform’s mathematical approach tightens the range of values and sharpens the highs and lows. This behavior can allow traders to see clearer peaks and troughs in momentum. Because it is often quite responsive, it can help anticipate areas where price might change direction, especially when compared to simpler moving averages or traditional oscillators. The result is a more evident signal of possible overbought or oversold conditions.
4. How This Extension Improves on the Basic Fisher Transform
Uptrick: Fisher Eclipse adds multiple features to the classic Fisher framework in order to address different trading styles and market behaviors:
a) Divergence Detection
The script can detect bullish or bearish divergences between price and the oscillator over a chosen lookback period, helping traders anticipate shifts in market direction.
b) Bar Coloring
When momentum exceeds a certain threshold (default 3), bars can be colored to highlight surges of buying or selling pressure. This quick visual reference can assist in spotting periods of heightened activity. After a bar color like this, usually, there is a quick correction as seen in the image below.
c) Signal Aggressiveness Levels
Users can choose between conservative, moderate, or aggressive signal thresholds. This allows them to tune how quickly the indicator flags potential entries or exits. Aggressive settings might suit scalpers who need rapid signals, while conservative settings may benefit swing traders preferring fewer, more robust indications.
d) Minimum Movement Filter
A configurable filter can be set to ensure that the Fisher line and its signal have a sufficient gap before triggering a buy or sell signal. This step is useful for traders seeking to minimize signals during choppy or sideways markets. This can be used to eliminate noise as well.
By combining all these elements into one package, the indicator attempts to offer a comprehensive toolkit for those who appreciate the Fisher Transform’s clarity but also desire more versatility.
5. Core Components
a) Fisher Transform
The script calculates a Fisher value using normalized price over a configurable length, highlighting potential peaks and troughs.
b) Signal Line
The Fisher line is smoothed using a short Simple Moving Average. Crossovers and crossunders are one of the key ways this indicator attempts to confirm momentum shifts.
c) Divergence Logic
The script looks back over a set number of bars to compare current highs and lows of both price and the Fisher oscillator. When price and the oscillator move in opposing directions, a divergence may occur, suggesting a possible upcoming reversal or weakening trend.
d) Thresholds for Overbought and Oversold
Horizontal lines are drawn at user-chosen overbought and oversold levels. These lines help traders see when momentum readings reach particular extremes, which can be especially relevant when combined with crossovers in that region.
e) Intensity Filter and Bar Coloring
If the magnitude of the change in the Fisher Transform meets or exceeds a specified threshold, bars are recolored. This provides a visual cue for significant momentum changes.
6. User Inputs
a) length
Defines how many bars the script looks back to compute the highest high and lowest low for the Fisher Transform. A smaller length reacts more quickly but can be noisier, while a larger length smooths out the indicator at the cost of responsiveness.
b) signal aggressiveness
Adjusts the buy and sell thresholds for conservative, moderate, and aggressive trading styles. This can be key in matching the indicator to personal risk preferences or varying market conditions. Conservative will give you less signals and aggressive will give you more signals.
c) minimum movement filter
Specifies how far apart the Fisher line and its signal line must be before generating a valid crossover signal.
d) divergence lookback
Controls how many bars are examined when determining if price and the oscillator are diverging. A larger setting might generate fewer signals, while a smaller one can provide more frequent alerts.
e) intensity threshold
Determines how large a change in the Fisher value must be for the indicator to recolor bars. Strong momentum surges become more noticeable.
f) overbought level and oversold level
Lets users define where they consider market conditions to be stretched on the upside or downside.
7. Calculation Process
a) Price Input
The script uses the midpoint of each bar’s high and low, sometimes referred to as hl2.
hl2 = (high + low) / 2
b) Range Normalization
Determine the maximum (maxHigh) and minimum (minLow) values over a user-defined lookback period (length).
Scale the hl2 value so it roughly fits between -1 and +1:
value = 2 * ((hl2 - minLow) / (maxHigh - minLow) - 0.5)
This step highlights the bar’s current position relative to its recent highs and lows.
c) Fisher Calculation
Convert the normalized value into the Fisher Transform:
fisher = 0.5 * ln( (1 + value) / (1 - value) ) + 0.5 * fisher_previous
fisher_previous is simply the Fisher value from the previous bar. Averaging half of the new transform with half of the old value smooths the result slightly and can prevent erratic jumps.
ln is the natural logarithm function, which compresses or expands values so that market turns often become more obvious.
d) Signal Smoothing
Once the Fisher value is computed, a short Simple Moving Average (SMA) is applied to produce a signal line. In code form, this often looks like:
signal = sma(fisher, 3)
Crossovers of the fisher line versus the signal line can be used to hint at changes in momentum:
• A crossover occurs when fisher moves from below to above the signal.
• A crossunder occurs when fisher moves from above to below the signal.
e) Threshold Checking
Users typically define oversold and overbought levels (often -1 and +1).
Depending on aggressiveness settings (conservative, moderate, aggressive), these thresholds are slightly shifted to filter out or include more signals.
For example, an oversold threshold of -1 might be used in a moderate setting, whereas -1.5 could be used in a conservative setting to require a deeper dip before triggering.
f) Divergence Checks
The script looks back a specified number of bars (divergenceLookback). For both price and the fisher line, it identifies:
• priceHigh = the highest hl2 within the lookback
• priceLow = the lowest hl2 within the lookback
• fisherHigh = the highest fisher value within the lookback
• fisherLow = the lowest fisher value within the lookback
If price forms a lower low while fisher forms a higher low, it can signal a bullish divergence. Conversely, if price forms a higher high while fisher forms a lower high, a bearish divergence might be indicated.
g) Bar Coloring
The script monitors the absolute change in Fisher values from one bar to the next (sometimes called fisherChange):
fisherChange = abs(fisher - fisher )
If fisherChange exceeds a user-defined intensityThreshold, bars are recolored to highlight a surge of momentum. Aqua might indicate a strong bullish surge, while purple might indicate a strong bearish surge.
This color-coding provides a quick visual cue for traders looking to spot large momentum swings without constantly monitoring indicator values.
8. Signal Generation and Filtering
Buy and sell signals occur when the Fisher line crosses the signal line in regions defined as oversold or overbought. The optional minimum movement filter prevents triggering if Fisher and its signal line are too close, reducing the chance of small, inconsequential price fluctuations creating frequent signals. Divergences that appear in oversold or overbought regions can serve as additional evidence that momentum might soon shift.
9. Visualization on the Chart
Uptrick: Fisher Eclipse plots two lines: the Fisher line in one color and the signal line in a contrasting shade. The chart displays horizontal dashed lines where the overbought and oversold levels lie. When the Fisher Transform experiences a sharp jump or drop above the intensity threshold, the corresponding price bars may change color, signaling that momentum has undergone a noticeable shift. If the indicator detects bullish or bearish divergence, dotted lines are drawn on the oscillator portion to connect the relevant points.
10. Market Adaptability
Because of the different aggressiveness levels and the optional minimum movement filter, Uptrick: Fisher Eclipse can be tailored to multiple trading styles. For instance, a short-term scalper might select a smaller length and more aggressive thresholds, while a swing trader might choose a longer length for smoother readings, along with conservative thresholds to ensure fewer but potentially stronger signals. During strongly trending markets, users might rely more on divergences or large intensity changes, whereas in a range-bound market, oversold or overbought conditions may be more frequent.
11. Risk Management Considerations
Indicators alone do not ensure favorable outcomes, and relying solely on any one signal can be risky. Using a stop-loss or other protections is often suggested, especially in fast-moving or unpredictable markets. Divergence can appear before a market reversal actually starts. Similarly, a Fisher Transform can remain in an overbought or oversold region for extended periods, especially if the trend is strong. Cautious interpretation and confirmation with additional methods or chart analysis can help refine entry and exit decisions.
12. Combining with Other Tools
Traders can potentially strengthen signals from Uptrick: Fisher Eclipse by checking them against other methods. If a moving average cross or a price pattern aligns with a Fisher crossover, the combined evidence might provide more certainty. Volume analysis may confirm whether a shift in market direction has participation from a broad set of traders. Support and resistance zones could reinforce overbought or oversold signals, particularly if price reaches a historical boundary at the same time the oscillator indicates a possible reversal.
13. Parameter Customization and Examples
Some short-term traders run a 15-minute chart, with a shorter length setting, aggressively tight oversold and overbought thresholds, and a smaller divergence lookback. This approach produces more frequent signals, which may appeal to those who enjoy fast-paced trading. More conservative traders might apply the indicator to a daily chart, using a larger length, moderate threshold levels, and a bigger divergence lookback to focus on broader market swings. Results can differ, so it may be helpful to conduct thorough historical testing to see which combination of parameters aligns best with specific goals.
14. Realistic Expectations
While the Fisher Transform can reveal potential turning points, no mathematical tool can predict future price behavior with full certainty. Markets can behave erratically, and a period of strong trending may see the oscillator pinned in an extreme zone without a significant reversal. Divergence signals sometimes appear well before an actual trend change occurs. Recognizing these limitations helps traders manage risk and avoids overreliance on any one aspect of the script’s output.
15. Theoretical Background
The Fisher Transform uses a logarithmic formula to map a normalized input, typically ranging between -1 and +1, into a scale that can fluctuate around values like -3 to +3. Because the transformation exaggerates higher and lower readings, it becomes easier to spot when the market might have stretched too far, too fast. Uptrick: Fisher Eclipse builds on that foundation by adding a series of practical tools that help confirm or refine those signals.
16. Originality and Uniqueness
Uptrick: Fisher Eclipse is not simply a duplicate of the basic Fisher Transform. It enhances the original design in several ways, including built-in divergence detection, bar-color triggers for momentum surges, thresholds for overbought and oversold levels, and customizable signal aggressiveness. By unifying these concepts, the script seeks to reduce noise and highlight meaningful shifts in market direction. It also places greater emphasis on helping traders adapt the indicator to their specific style—whether that involves frequent intraday signals or fewer, more robust alerts over longer timeframes.
17. Summary
Uptrick: Fisher Eclipse is an expanded take on the original Fisher Transform oscillator, including divergence detection, bar coloring based on momentum strength, and flexible signal thresholds. By adjusting parameters like length, aggressiveness, and intensity thresholds, traders can configure the script for day-trading, swing trading, or position trading. The indicator endeavors to highlight where price might be shifting direction, but it should still be combined with robust risk management and other analytical methods. Doing so can lead to a more comprehensive view of market conditions.
18. Disclaimer
No indicator or script can guarantee profitable outcomes in trading. Past performance does not necessarily suggest future results. Uptrick: Fisher Eclipse is provided for educational and informational purposes. Users should apply their own judgment and may want to confirm signals with other tools and methods. Deciding to open or close a position remains a personal choice based on each individual’s circumstances and risk tolerance.

MMXM ICT [TradingFinder] Market Maker Model PO3 CHoCH/CSID + FVG🔵 Introduction
The MMXM Smart Money Reversal leverages key metrics such as SMT Divergence, Liquidity Sweep, HTF PD Array, Market Structure Shift (MSS) or (ChoCh), CISD, and Fair Value Gap (FVG) to identify critical turning points in the market. Designed for traders aiming to analyze the behavior of major market participants, this setup pinpoints strategic areas for making informed trading decisions.
The document introduces the MMXM model, a trading strategy that identifies market maker activity to predict price movements. The model operates across five distinct stages: original consolidation, price run, smart money reversal, accumulation/distribution, and completion. This systematic approach allows traders to differentiate between buyside and sellside curves, offering a structured framework for interpreting price action.
Market makers play a pivotal role in facilitating these movements by bridging liquidity gaps. They continuously quote bid (buy) and ask (sell) prices for assets, ensuring smooth trading conditions.
By maintaining liquidity, market makers prevent scenarios where buyers are left without sellers and vice versa, making their activity a cornerstone of the MMXM strategy.
SMT Divergence serves as the first signal of a potential trend reversal, arising from discrepancies between the movements of related assets or indices. This divergence is detected when two or more highly correlated assets or indices move in opposite directions, signaling a likely shift in market trends.
Liquidity Sweep occurs when the market targets liquidity in specific zones through false price movements. This process allows major market participants to execute their orders efficiently by collecting the necessary liquidity to enter or exit positions.
The HTF PD Array refers to premium and discount zones on higher timeframes. These zones highlight price levels where the market is in a premium (ideal for selling) or discount (ideal for buying). These areas are identified based on higher timeframe market behavior and guide traders toward lucrative opportunities.
Market Structure Shift (MSS), also referred to as ChoCh, indicates a change in market structure, often marked by breaking key support or resistance levels. This shift confirms the directional movement of the market, signaling the start of a new trend.
CISD (Change in State of Delivery) reflects a transition in price delivery mechanisms. Typically occurring after MSS, CISD confirms the continuation of price movement in the new direction.
Fair Value Gap (FVG) represents zones where price imbalance exists between buyers and sellers. These gaps often act as price targets for filling, offering traders opportunities for entry or exit.
By combining all these metrics, the Smart Money Reversal provides a comprehensive tool for analyzing market behavior and identifying key trading opportunities. It enables traders to anticipate the actions of major players and align their strategies accordingly.
MMBM :
MMSM :
🔵 How to Use
The Smart Money Reversal operates in two primary states: MMBM (Market Maker Buy Model) and MMSM (Market Maker Sell Model). Each state highlights critical structural changes in market trends, focusing on liquidity behavior and price reactions at key levels to offer precise and effective trading opportunities.
The MMXM model expands on this by identifying five distinct stages of market behavior: original consolidation, price run, smart money reversal, accumulation/distribution, and completion. These stages provide traders with a detailed roadmap for interpreting price action and anticipating market maker activity.
🟣 Market Maker Buy Model
In the MMBM state, the market transitions from a bearish trend to a bullish trend. Initially, SMT Divergence between related assets or indices reveals weaknesses in the bearish trend. Subsequently, a Liquidity Sweep collects liquidity from lower levels through false breakouts.
After this, the price reacts to discount zones identified in the HTF PD Array, where major market participants often execute buy orders. The market confirms the bullish trend with a Market Structure Shift (MSS) and a change in price delivery state (CISD). During this phase, an FVG emerges as a key trading opportunity. Traders can open long positions upon a pullback to this FVG zone, capitalizing on the bullish continuation.
🟣 Market Maker Sell Model
In the MMSM state, the market shifts from a bullish trend to a bearish trend. Here, SMT Divergence highlights weaknesses in the bullish trend. A Liquidity Sweep then gathers liquidity from higher levels.
The price reacts to premium zones identified in the HTF PD Array, where major sellers enter the market and reverse the price direction. A Market Structure Shift (MSS) and a change in delivery state (CISD) confirm the bearish trend. The FVG then acts as a target for the price. Traders can initiate short positions upon a pullback to this FVG zone, profiting from the bearish continuation.
Market makers actively bridge liquidity gaps throughout these stages, quoting continuous bid and ask prices for assets. This ensures that trades are executed seamlessly, even during periods of low market participation, and supports the structured progression of the MMXM model.
The price’s reaction to FVG zones in both states provides traders with opportunities to reduce risk and enhance precision. These pullbacks to FVG zones not only represent optimal entry points but also create avenues for maximizing returns with minimal risk.
🔵 Settings
Higher TimeFrame PD Array : Selects the timeframe for identifying premium/discount arrays on higher timeframes.
PD Array Period : Specifies the number of candles for identifying key swing points.
ATR Coefficient Threshold : Defines the threshold for acceptable volatility based on ATR.
Max Swing Back Method : Choose between analyzing all swings ("All") or a fixed number ("Custom").
Max Swing Back : Sets the maximum number of candles to consider for swing analysis (if "Custom" is selected).
Second Symbol for SMT : Specifies the second asset or index for detecting SMT divergence.
SMT Fractal Periods : Sets the number of candles required to identify SMT fractals.
FVG Validity Period : Defines the validity duration for FVG zones.
MSS Validity Period : Sets the validity duration for MSS zones.
FVG Filter : Activates filtering for FVG zones based on width.
FVG Filter Type : Selects the filtering level from "Very Aggressive" to "Very Defensive."
Mitigation Level FVG : Determines the level within the FVG zone (proximal, 50%, or distal) that price reacts to.
Demand FVG : Enables the display of demand FVG zones.
Supply FVG : Enables the display of supply FVG zones.
Zone Colors : Allows customization of colors for demand and supply FVG zones.
Bottom Line & Label : Enables or disables the SMT divergence line and label from the bottom.
Top Line & Label : Enables or disables the SMT divergence line and label from the top.
Show All HTF Levels : Displays all premium/discount levels on higher timeframes.
High/Low Levels : Activates the display of high/low levels.
Color Options : Customizes the colors for high/low lines and labels.
Show All MSS Levels : Enables display of all MSS zones.
High/Low MSS Levels : Activates the display of high/low MSS levels.
Color Options : Customizes the colors for MSS lines and labels.
🔵 Conclusion
The Smart Money Reversal model represents one of the most advanced tools for technical analysis, enabling traders to identify critical market turning points. By leveraging metrics such as SMT Divergence, Liquidity Sweep, HTF PD Array, MSS, CISD, and FVG, traders can predict future price movements with precision.
The price’s interaction with key zones such as PD Array and FVG, combined with pullbacks to imbalance areas, offers exceptional opportunities with favorable risk-to-reward ratios. This approach empowers traders to analyze the behavior of major market participants and adopt professional strategies for entry and exit.
By employing this analytical framework, traders can reduce errors, make more informed decisions, and capitalize on profitable opportunities. The Smart Money Reversal focuses on liquidity behavior and structural changes, making it an indispensable tool for financial market success.

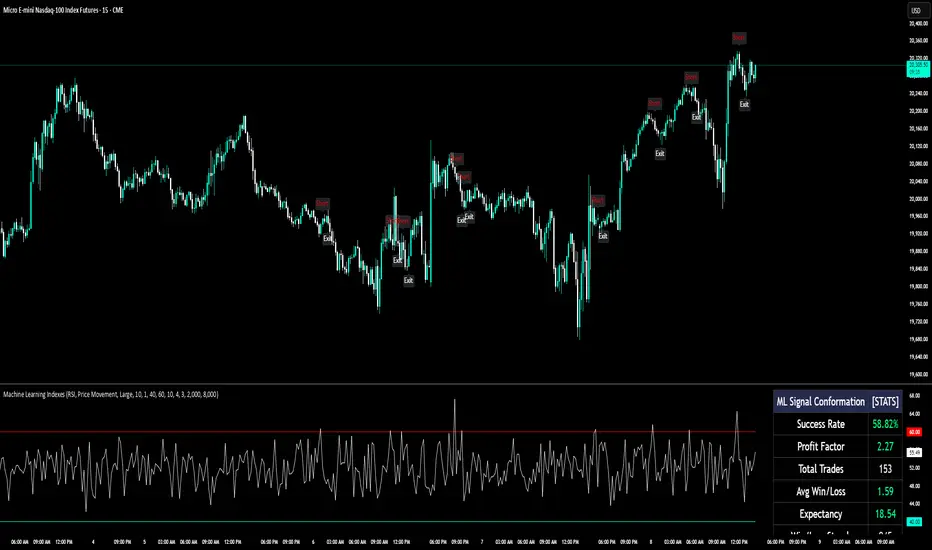
Machine Learning IndexesMachine Learning Indexes Script Description
The Machine Learning Indexes script is an advanced Pine Script™ indicator that applies machine learning techniques to analyze various market data types. It enables traders to generate adaptive long and short signals using highly customizable settings for signal detection and analysis.
Key Features:
Signal Mode: Allows the user to choose between generating signals for "Longs" (buy opportunities) or "Shorts" (sell opportunities).
Index Type: Supports multiple index types including RSI, CCI, MFI, Stochastic, and Momentum. All indexes are normalized between 0-100 for uniformity.
Data Set Selection: Provides options for analyzing Price, Volume, Volatility, or Momentum-based data sets. This enables traders to adapt the script to their preferred market analysis methodology.
Absolute vs. Directional Changes: Includes a toggle to calculate absolute changes for values or maintain directional sensitivity for trend-based analysis.
Dynamic Index Calculation: Automatically calculates and compares multiple index lengths to determine the best fit for current market conditions, adding precision to signal generation.
Input Parameters:
Signal Settings:
Signal Mode: Selects between "Longs" or "Shorts" to define the signal direction.
Index Type: Chooses the type of market index for calculations. Options include RSI, CCI, MFI, Stochastic, and Momentum.
Data Set Type: Determines the basis of the analysis, such as Price, Volume, Volatility, or Momentum-based data.
Absolute Change: Toggles whether absolute or directional changes are considered for calculations.
Index Settings:
Min Index Length: Sets the base index length used for calculations.
Index Length Variety: Adjusts the increment steps for variations in index length.
Lower/Upper Bands: Define thresholds for the selected index, indicating overbought and oversold levels.
Signal Parameters:
Target Signal Size: Number of bars used to identify pivot points.
Backtest Trade Size: Defines the number of bars over which signal performance is measured.
Sample Size: Number of data points used to calculate signal metrics.
Signal Strength Needed: Sets the minimum confidence required for a signal to be considered valid.
Require Low Variety: Option to prioritize signals with lower variability in results.
How It Works:
The script dynamically calculates multiple index variations and compares their accuracy to detect optimal parameters for generating signals.
Signal validation considers the chosen mode (longs/shorts), data set, index type, and signal parameters.
Adaptive moving averages (ADMA) and Band Signals (BS) are plotted to visualize the interaction between market trends and thresholds.
Long and short signals are displayed with clear up (L) and down (S) labels for easy interpretation.
Performance Metrics:
Success Rate: Percentage of valid signals that led to profitable outcomes.
Profit Factor: Ratio of gains from successful trades to losses from unsuccessful trades.
Disclaimer:
This indicator is for informational purposes only and does not guarantee future performance. It is designed to support traders in making informed decisions but should be used alongside other analysis methods and risk management strategies.
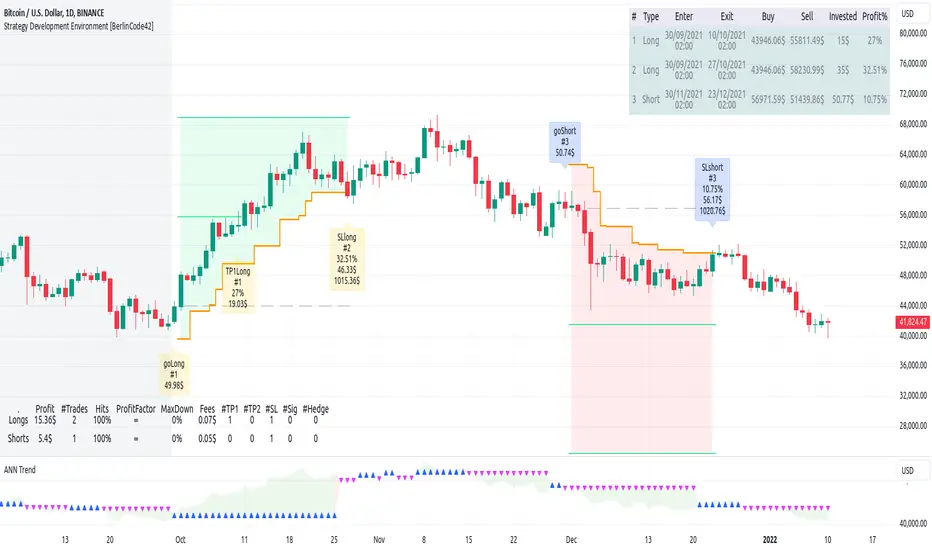
Strategy Development Environment [BerlinCode42]Happy Trade,
Intro
What is New
Algebraic/Boolean Equation
Instruction Set for The Algebraic/Boolean Equation
Example
Usage
Settings Menu
Declaration for Tradingview House Rules on Script Publishing
Disclaimer
Conclusion
1. Intro
This is a rich equipped fork of my previous "Backtest any Indicator v5". And serves as the fitting backtester and trade strategy creation tool for my upcoming ANN Indicators (artificial neural network).
As the previous version this script has no trade signal generating code. The trade signals comes in by the five user settable input slots where the user plug-in external indicators. The final trade siganls go long etc are defined by a algebraic/boolean equation typed in as text in 4 terminals as shown in Image 0 . With this algebraic/boolean equations input the user can setup any trade logic as complex and fast and easy as never seen before here on TradingView.
Image 0
2. What is new
Input algebraic/boolean equations in text-form for go long, go short, exit long & exit short
Five input slots for external indicator signals
Equation tester
User settable signal delay for enter and exit trades
User selectable alternating trades filter
User settable exit long = enter short
Intrabar or trade only on bar closing
Time filter with duration input
User settable UTC Adjustment
Long and short trades possible
Two Take Profits with quantity setting
Trailing Stop
Webhook connection
3. Algebraic/Boolean Equation
This is where the magic happens. Unlike other backtesters that rely on drop-down menus to define trade signal equations—thus limiting the number of input signals and the complexity of logic—this script uses a string interpreter to solve equations. With this, you can develop your trade logic equations and add signals or conditions simply by writing them down in algebraic/boolean form.
The instruction set for this interpreter includes not only external input signals but also several internal values. These include BarTime, BarIndex, Open, High, Low, Close, True Range, Minimal Tick, Volume, and a signal that indicates whether there is an open trade (long, short, or none). You can also reference the values of past bars for all these inputs and, of course, use constant values in your equations. There is a sad limitation: Only one past bar value per equation is practicable. If you use more, errors can occur. It seems to be caused by the pipe line architecture of the parallel computing. In any attempt to solve this issue an older function call result was hand over.
The implemented functions cover a wide range of algebraic and boolean operations. A boolean "true" is represented by all values greater than zero, while "false" is represented by zero or values less than zero.
4. Instruction set for the Algebraic/Boolean Equation
There are functions that accept either two input values or one input value. The general form is (XandY) or (notX), where X and Y can be any input slot, predefined value, constant, or another sub-equation. Functions are always written in lowercase, while input slots and predefined values use uppercase letters.
Each sub-equation must be enclosed in parentheses, e.g., (A+B). Without proper use of parentheses, the interpreter cannot determine which function to calculate first. Negative constants must be expressed by subtracting from zero (e.g., (0-3.14)), so careful attention is required.
Here are some examples that demonstrate both incorrect and correct notations:
incorrect correct
(A+B*C) (A+(B*C))
(A+B+D+E) (A+(B+(D+E)))
(-20>A) ((0-20)>A)
(A*-B) (A*(0-B))
(AnotB) (Aand(notB))
ABS(a-b) (abs(A-B))
The correct usage ensures the interpreter calculates in the intended order.
And here comes the complete Instruction Set:
Addition: (A+B)
Subtraction: (A-B)
Multiplication: (A*B)
Division: (A/B)
Absolut value: (absA)
Power of: (A^B)
Natural Logarithm: (logA)
Lowest value of Low of last x bars: (lotx)
Highest value of High of last x bars: (hotx)
Modulo, Remainder of a Division: (A%B)
Round: (rndA)
round to ceil: (ceiA)
Round to floor: (floA)
Round to next minimal tick: (mitA)
EMA of A of last 3 bars: (e03A)
EMA of A of last 7 bars: (e07A)
EMA of A of last 10 bars: (e10A)
EMA of A of last 20 bars: (e20A)
EMA of A of last 50 bars: (e50A)
Smaller then: (AB)
Equal to: (A==B)
Unequal to: (A!=B)
And: (AandB)
Or: (AorB)
Exclusive Or: (AxorB)
Not: (notA)
Past bar value: (A ) ,whereby x can be 1,2,3,...,barIndex-1
Bar time: (T)
Bar index: (I)
Opening Price of Bar: (O)
Highest Price of Bar: (H)
Lowest Price of Bar: (L)
Closing Price of Bar: (C)
Min tick value for the current symbol: (K)
Trade Volume: (V)
True Range: (R)
Is Money invested: (M) ,Long position: M=1,
Short position: M=-1,
No position: M=0
Reminder: if you wanna replace A or B above don't forget the parentheses. So if you have (logA) and wanna replace A with D+F so the correct replacement would be (log(D+F)).
In the following there are some examples of popular bar patterns and useful filters:
Doji: ((abs(O-C))<(10*K))and((H-L)>(100*K))
green Hammer: (((H-C)<(5000*K))and(((O-L)/2)>(abs(O-C)))
Up trend: (C>(e10H))
Down trend: (C<(e10L))
cool down 7 bars: (( any buy condition )and((e07(absM))==0))
possible Pivot High: (H==(hot30))and((CC))
possible Pivot Low: (L==(lot30))and((C>H )or(O0)), goShort ((A>0)and((A )<0)), Enter Signal delay=0, Exit Signal delay=0, Alternate Trades=true
take profit 1 =0.4% (30%), take profit 2 =0.7%, trailing stop loss=0.2%, intrabar, start capital=1000$, qty=5%, fee=0.05%, no Session Filter
Image 1
6. Usage
First you need to attach some signals from external Indicators. In the example above we use the Stochastic RSI indicator from TradingView. Load the Stochastic RSI indicator to the chart. Then you go to the settings menu of this script, choose in the drop-down menu of Input A the signal .
In case you wanna use a signal which is not in the drop-down menu of Input A do the following:
1) You need to know the name of the boolean (or integer) variable of your indicator which hold the desired signal. Lets say that this boolean variable is called BUY. If this BUY variable is not plotted on the chart you simply add the following code line at the end of your pine script.
For boolean (true/false) BUY variables use this:
plot(BUY ? 1:0,'Your buy condition hold in that variable BUY',display = display.data_window)
And in case your script's BUY variable is an integer or float then use instate the following code line:
plot(BUY ,'Your buy condition hold in that variable BUY',display = display.data_window)
2) Probably the name of this BUY variable in your indicator is not BUY. Simply replace in the code line above the BUY with the name of your script's trade condition variable.
3) Do the same procedure for your SELL variable. Then save your changed Indicator script.
4) Then add the changed Indicator script from step before and this backtester script to the chart ...
5) and go to the settings of it. Choose under "Settings -> Input A " your Indicator. So in the example above choose .
The form is usually: ' : BUY'. Then you see something like Image 1
6) Decide about each trade logic for Go Long and Go Short . In this Example we use for GoLong if "Stoch RSI: K" is smaller then 20. The "Stoch RSI: K" we already loaded it in input A. So we set under Go Long (A<20) and set Enter Signal Delay to 0.
Now we setup Go Short if "Stoch RSI: K" is bigger then 80. So we set under Go Short A>80. Enter Signal Delay is already set.
7) For the Exit conditions you can choose (trailing) Stop loss or Take Profit or Exit by Indicator Signal. What ever comes first triggers the exit. If you like to use an EMA Indicator for the Exit by Indicator just load it in a free input slot B, D, E, F or use the inbuild EMA. For this example we use the inbuild EMA of the last 7 values of close. It is called by the following equation: (e07C). So to exit a long trade when the close price crossunder this EMA you have to type in Exit Long ((e07C)>C). For exit a short trade enter in Exit Short ((e07C)
CDVDThis script calculates and visualizes the Cumulative Delta Volume Divergence (CDVD) with the MACD indicator. It combines volume-based market analysis with MACD-style momentum to help identify false signals with divergences, trends or potential reversals.
The cumulative delta volume divergence is derived by summing up the differences between uptick volume (volume during price increases) and downtick volume (volume during price decreases) over time.
A Fast EMA and Slow EMA are calculated from the cumulative delta volume to smooth the data.
The difference between these EMAs forms the MACD Line.
A Signal Line is created by applying another EMA to the MACD Line.
The difference between the MACD Line and the Signal Line forms the Histogram:
This indicator helps traders:
Identify false signals with divergences unseen on MACD and Price Action.
Identify bullish or bearish momentum in market volume.
Spot potential trend reversals based on changes in cumulative delta volume dynamics.
Analyze the interplay between price momentum and volume flow.
It’s especially useful for traders who focus on volume-based market dynamics.
Snapshot: Use in conjunction with MACD to identify true divergences.
Important Notice:
Trading financial markets involves significant risk and may not be suitable for all investors. The use of technical indicators like this one does not guarantee profitable results. This indicator should not be used as a standalone analysis tool. It is essential to combine it with other forms of analysis, such as fundamental analysis, risk management strategies, and awareness of current market conditions. Always conduct thorough research.
Disclaimer:
Past performance is not indicative of future results. This indicator is provided for informational and educational purposes only and should not be considered investment advice. Always conduct your own research before making any trading decisions.
Note: The effectiveness of any technical indicator can vary based on market conditions and individual trading styles. It's crucial to test indicators thoroughly using historical data before applying them in live trading scenarios.

rsi wf breakoutRSI Breakout Asif
RSI Breakout Asif Indicator
Overview:
The RSI Breakout Asif indicator is a custom script designed to analyze and highlight potential
breakout points using the Relative Strength Index (RSI) combined with Williams Fractals. This
indicator is specifically developed for traders who want to identify key momentum shifts in the
market.
Features:
1. RSI Analysis:
- The RSI is calculated using a user-defined length and price source.
- Horizontal lines are plotted at levels 70 (overbought), 50 (neutral), and 30 (oversold) to visually
aid decision-making.
2. Williams Fractals on RSI:
- Detects fractal highs and lows based on RSI values.
- Highlights these fractal points with dynamic, symmetrical lines for better visibility.
3. Customization:
- Users can adjust the RSI length and price source for personalized analysis.
- Fractal settings (left and right bar length) are also adjustable, making the indicator versatile for
different trading styles.
4. Visual Enhancements:
- Fractal highs are marked in red, while fractal lows are marked in green.
Asif - Page 1
RSI Breakout Asif
- Precise line placement ensures clarity and reduces chart clutter.
5. Practical Utility:
- Use the fractal breakout signals in conjunction with other technical indicators for enhanced
decision-making.
Usage:
- Add the RSI Breakout Asif indicator to your TradingView chart.
- Adjust the settings according to your trading strategy.
- Observe the RSI values and fractal points to identify potential breakout zones.
Disclaimer:
This indicator is a technical analysis tool and should be used in combination with other analysis
methods. It does not guarantee profitable trades.
Watermarked by Asif.
Asif - Page 2

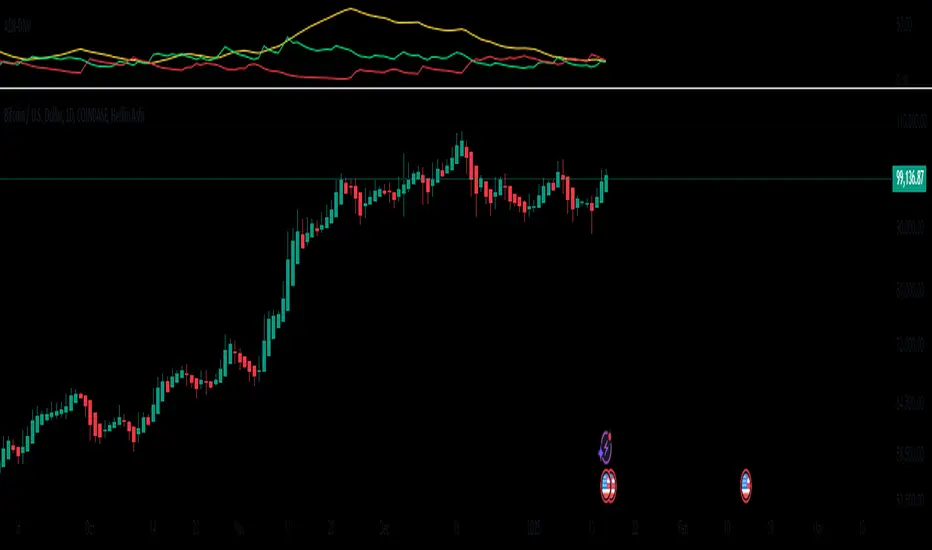
Z-Score + Valuation BTC | JeffreyTimmermansBTC Valuation Indicator with Z-Score Analysis
The BTC Valuation Indicator is a sophisticated tool designed to offer traders and analysts a deeper understanding of Bitcoin’s market valuation, empowering them to make more informed decisions. By utilizing a combination of key moving averages and a logarithmic trendline, along with advanced statistical analysis through the Z-Score Indicator, this tool provides a comprehensive view of Bitcoin’s potential undervaluation or overvaluation.
Key Features:
200MA/P (200-Day Moving Average to Price Ratio)
This component compares Bitcoin’s current price to its 200-day Simple Moving Average (SMA), offering insights into the long-term trend. A positive value signals a potential undervaluation of Bitcoin, while a negative value may indicate overvaluation.
Use case: Identifying long-term price trends to forecast potential buying or selling opportunities.
50MA/P (50-Day Moving Average to Price Ratio)
This ratio focuses on the short-term dynamics of Bitcoin’s price, comparing it to its 50-day SMA. It helps traders detect bullish or bearish trends in the immediate future.
Use case: Spotting short-term market movements and adjusting strategies accordingly.
LTL/P (Logarithmic TrendLine to Price Ratio)
This ratio incorporates Bitcoin’s historical age, using a logarithmic trendline to measure price movements against long-term expectations. A divergence from this trendline can signal potential overvaluation or undervaluation, assisting in aligning trading decisions with broader market trends.
Use case: Evaluating the overall trajectory of Bitcoin’s value over time and predicting significant market shifts.
Z-Score Indicator Integration:
The BTC Valuation Indicator utilizes the Z-Score, a powerful statistical measure, to assess how far each of the aforementioned ratios deviates from the mean. Z-Scores help standardize these ratios, allowing traders to gauge the severity of under or overvaluation compared to historical averages.
What is a Z-Score?
A Z-score measures how far a data point is from the mean in terms of standard deviations. A Z-score of 0 indicates the value is exactly at the mean, while a positive or negative score shows how much the value deviates from it. A higher Z-score signals a more significant deviation, potentially pointing to a market anomaly, while a Z-score near 0 indicates normal conditions.
For instance:
A Z-score above +2 indicates that Bitcoin may be overvalued, with the likelihood of a market correction or reversion to the mean.
A Z-score below -2 signals possible undervaluation, suggesting an upward trend may be on the horizon.
Z-Score and Market Volatility
The Z-Score Indicator can be used in conjunction with volatility measures, such as the CBOE Volatility Index (VIX), to forecast potential market volatility. Just as a Z-scored VIX above +2 suggests decreasing volatility and the possibility of an upward trend, a Z-scored VIX below -2 indicates increasing volatility and a potential downward trend. This parallel can be used to predict Bitcoin’s potential movements in times of market uncertainty.
How to Use:
The BTC Valuation Indicator, when paired with the Z-Score, provides a more refined statistical framework to analyze Bitcoin’s market conditions. This integration allows traders to assess the severity of potential trends and price anomalies, assisting in the identification of profitable entry and exit points.
Important Considerations:
No Guarantee of Market Predictions: While this indicator is a valuable tool for assessing market conditions, no indicator can guarantee future performance. Always consider multiple factors and use the indicator as part of a comprehensive strategy.
Market Dynamics:
As market conditions evolve, continuously refine your approach. Historical performance may not be indicative of future results, and traders should remain vigilant to changing trends and developments.
By combining the power of moving averages, logarithmic trend lines, and Z-scores, the BTC Valuation Indicator equips investors with a robust, data-driven approach to Bitcoin valuation, enhancing decision-making and enabling a more nuanced understanding of market dynamics.
-Jeffrey

ChristmasWishing You All a Merry Christmas! 🎄☃️❄️
May your charts be ever-green, your trades profitable, and your holiday season filled with joy, warmth, and magic. Happy Holidays!

Golden & Death Cross with Re-Activation [By Oberlunar]🎄 Merry Christmas to All Traders! 🎄
Let me introduce you to a practical and customizable classic tool: the Golden & Death Cross with Re-Activation. This script is designed to help you navigate the markets with precision and adaptability.
Why Is This Script Important?
1. Customizable Moving Averages
You can choose from SMA, EMA, WMA, HMA, or RMA for both moving averages. This flexibility allows you to tailor the strategy to fit different markets and trading styles.
2. Smart Signal Handling
The script generates Golden Cross (LONG) and Death Cross (SHORT) signals while deactivating them automatically when the moving averages start to converge, avoiding unnecessary noise.
3. Reactivation Based on Distance Threshold
With the treshold parameter, signals are reactivated only when the moving averages move apart sufficiently, ensuring that the signals remain meaningful and not just random market noise.
What Are These Moving Averages?
SMA (Simple Moving Average),
EMA (Exponential Moving Average),
WMA (Weighted Moving Average),
HMA (Hull Moving Average),
RMA (Relative Moving Average)
Community Input
We invite you to test this script on various markets (forex, stocks, crypto) and share your insights:
Which moving average combination works best for EUR/USD?
How about BTC/USD?
Does the treshold make a noticeable difference?
Let us know in the comments!
Example Settings
MA 1 Type: HMA, Length: 21
MA 2 Type: HMA, Length: 200
Reactivation Threshold: 0.5
Experiment with it, and let us know your findings.
Wishing you a calm holiday season and a profitable new year ahead! 🎁
🎄 Merry Christmas and Happy Trading! 🎄

Uptrick: Smart BoundariesThis script is an indicator that combines the RSI (Relative Strength Index) and Bollinger Bands to highlight potential points where price momentum and volatility may both be at extreme levels. Below is a detailed explanation of its components, how it calculates signals, and why these two indicators have been merged into one tool. This script is intended solely for educational purposes and for traders who want to explore the combined use of momentum and volatility measures. Please remember that no single indicator guarantees profitable results.
Purpose of This Script
This script is designed to serve as a concise, all-in-one tool for traders seeking to track both momentum and volatility extremes in real time. By overlaying RSI signals with Bollinger Band boundaries, it helps users quickly identify points on a chart where price movement may be highly stretched. The goal is to offer a clearer snapshot of potential overbought or oversold conditions without requiring two separate indicators. Additionally, its optional pyramiding feature enables users to manage how many times they initiate trades when signals repeat in the same direction. Through these combined functions, the script aims to streamline technical analysis by consolidating two popular measures—momentum via RSI and volatility via Bollinger Bands—into a single, manageable interface.
1. Why Combine RSI and Bollinger Bands
• RSI (Relative Strength Index): This is a momentum oscillator that measures the speed and magnitude of recent price changes. It typically ranges between 0 and 100. Traders often watch for RSI crossing into “overbought” or “oversold” levels because it may indicate a potential shift in momentum.
• Bollinger Bands: These bands are plotted around a moving average, using a standard deviation multiplier to create an upper and lower boundary. They help illustrate how volatile the price has been relative to its recent average. When price moves outside these boundaries, some traders see it as a sign the price may be overstretched and could revert closer to the average.
Combining these two can be useful because it blends two different perspectives on market movement. RSI attempts to identify momentum extremes, while Bollinger Bands track volatility extremes. By looking for moments when both conditions agree, the script tries to highlight points where price might be unusually stretched in terms of both momentum and volatility.
2. How Signals Are Generated
• Buy Condition:
- RSI dips below a specified “oversold” level (for example, 30 by default).
- Price closes below the lower Bollinger Band.
When these occur together, the script draws a label indicating a potential bullish opportunity. The underlying reasoning is that momentum (RSI) suggests a stronger-than-usual sell-off, and price is also stretched below the lower Bollinger Band.
• Sell Condition:
- RSI rises above a specified “overbought” level (for example, 70 by default).
- Price closes above the upper Bollinger Band.
When these occur together, a label is plotted for a potential bearish opportunity. The rationale is that momentum (RSI) may be overheated, and the price is trading outside the top of its volatility range.
3. Pyramiding Logic and Trade Count Management
• Pyramiding refers to taking multiple positions in the same direction when signals keep firing. While some traders prefer just one position per signal, others like to scale into a trade if the market keeps pushing in their favor.
• This script uses variables that keep track of how many recent buy or sell signals have fired. If the count reaches a user-defined maximum, no more signals of that type will trigger additional labels. This protects traders from over-committing to one direction if the market conditions remain “extreme” for a prolonged period.
• If you disable the pyramiding feature, the script will only plot one label per side until the condition resets (i.e., until RSI and price conditions are no longer met).
4. Labels and Visual Feedback
• Whenever a buy or sell condition appears, the script plots a label directly on the chart:
- Buy labels under the price bar.
- Sell labels above the price bar.
These labels make it easier to review where both RSI and Bollinger Band conditions align. It can be helpful for visually scanning the chart to see if the signals show any patterns related to market reversals or trend continuations.
• The Bollinger Bands themselves are plotted so traders can see when the price is approaching or exceeding the upper or lower band. Watching the RSI and Bollinger Band plots simultaneously can give traders more context for each signal.
5. Originality and Usefulness
This script provides a distinct approach by merging two well-established concepts—RSI and Bollinger Bands—within a single framework, complemented by optional pyramiding controls. Rather than using each indicator separately, it attempts to uncover moments when momentum signals from RSI align with volatility extremes highlighted by Bollinger Bands. This combined perspective can aid in spotting areas of possible overextension in price. Additionally, the built-in pyramiding mechanism offers a method to manage multiple signals in the same direction, allowing users to adjust how aggressively they scale into trades. By integrating these elements together, the script aims to deliver a tool that caters to diverse trading styles while remaining straightforward to configure and interpret.
6. How to Use the Indicator
• Configure the Inputs:
- RSI Length (the lookback period used for the RSI calculation).
- RSI Overbought and Oversold Levels.
- Bollinger Bands Length and Multiplier (defines the moving average period and the degree of deviation).
- Option to reduce pyramiding.
• Set Alerts (Optional):
- You can create TradingView alerts for when these conditions occur, so you do not have to monitor the chart constantly. Choose the buy or sell alert conditions in your alert settings.
• Integration in a Trading Plan:
- This script alone is not a complete trading system. Consider combining it with other forms of analysis, such as support and resistance, volume profiles, or candlestick patterns. Thorough research, testing on historical data, and risk management are always recommended.
7. No Performance Guarantees
• This script does not promise any specific trading results. It is crucial to remember that no single indicator can accurately predict future market movements all the time. The script simply tries to highlight moments when two well-known indicators both point to an extreme condition.
• Actual trading decisions should factor in a range of market information, including personal risk tolerance and broader market conditions.
8. Purpose and Limitations
• Purpose:
- Provide a combined view of momentum (RSI) and volatility (Bollinger Bands) in a single script.
- Assist in spotting times when price may be at an extreme.
- Offer a configurable system for labeling potential buy or sell points based on these extremes.
• Limitations:
- Overbought and oversold conditions can persist for an extended period in trending markets.
- Bollinger Band breakouts do not always result in immediate reversals. Sometimes price keeps moving in the same direction.
- The script does not include a built-in exit strategy or risk management rules. Traders must handle these themselves.
Additional Disclosures
This script is published open-source and does not rely on any external or private libraries. It does not use lookahead methods or repaint signals; all calculations are performed on the current bar without referencing future data. Furthermore, the script is designed for standard candlestick or bar charts rather than non-standard chart types (e.g., Heikin Ashi, Renko). Traders should keep in mind that while the script can help locate potential momentum and volatility extremes, it does not include an exit strategy or account for factors like slippage or commission. All code comes from built-in Pine Script functions and standard formulas for RSI and Bollinger Bands. Anyone reviewing or modifying this script should exercise caution and incorporate proper risk management when applying it to their own trading.
Calculation Details
The script computes RSI by examining a user-defined number of prior bars (the RSI Length) and determining the average of up-moves relative to the average of down-moves over that period. This ratio is then scaled to a 0–100 range, so lower values typically indicate stronger downward momentum, while higher values suggest stronger upward momentum. In parallel, Bollinger Bands are generated by first calculating a simple moving average (SMA) of the closing price for the user-specified length. The script then measures the standard deviation of closing prices over the same period and multiplies it by the chosen factor (the Bollinger Bands Multiplier) to form the upper and lower boundaries around the SMA. These two measures are checked in tandem: if the RSI dips below a certain oversold threshold and price trades below the lower Bollinger Band, a condition is met that may imply a strong short-term sell-off; similarly, if the RSI surpasses the overbought threshold and price rises above the upper Band, it may indicate an overextended move to the upside. The pyramiding counters track how many of these signals occur in sequence, preventing excessive stacking of labels on the chart if conditions remain extreme for multiple bars.
Conclusion
This indicator aims to provide a more complete view of potential market extremes by overlaying the RSI’s momentum readings on top of Bollinger Band volatility signals. By doing so, it attempts to help traders see when both indicators suggest that the market might be oversold or overbought. The optional reduced pyramiding logic further refines how many signals appear, giving users the choice of a single entry or multiple scaling entries. It does not claim any guaranteed success or predictive power, but rather serves as a tool for those wanting to explore this combined approach. Always be cautious and consider multiple factors before placing any trades.

Buyers vs SellersBuyers vs Sellers is an indicator which essentially weighs the strength of the buyers against the strength of the sellers. It defines the current relationship between the buyers and the sellers as well as the way that that relationship is changing over time.
User Inputs:
1. Number of Bars To Include In The Calculation - this is the look back period. The amount of past data that is being processed.
2. Length of The ATR - higher values are recommended. This ATR is used as a unit in which the price changes are expressed.
3. Bullish/Bearish Bias Threshold - the minimum value to consider the buyers or the sellers having control of the price.
4. Net Move Average Length - the moving average of the sum of bullish and bearish price changes.
The Calculation Process:
This indicator measures the difference between the opening and the closing prices of each bar in the look back period.
After that it sums together the sizes of the bodies of all the bullish bars and also the sizes of all the bearish bars to create the total bullish price change and total bearish price change for the look back period.
After that it converts the total price changes into percentages of the ATR and divides them by the look back period to get the price change per bar - it is a way of getting the price change values down to less ridiculous numbers regardless of the look back period and while still keeping the proportions intact.
After that it sums the two price changes together to get the net move and performs a simple moving average calculation on it in order to smooth out the values. This is a numerical representation of the relationship between the strength of the bullish and the bearish moves, which is easily readable from the chart.
After that the indicator performs a natural logarithm of the bullish price change divided by the bearish price change. This calculation gives a relationship between the two values which is not tied to the volatility of the instrument, but is expressed purely as a relationship between the strength of one value against the other. The idea is that this would allow for easier comparison across different instruments as the same numbers would represent exactly the same distribution of the strength difference.
The Plotting Logic:
The ATR is plotted as just a number as a reference.
The natural logarithm is presented in two ways.
One way is numerical, to be able to precisely read the value and the colour of the number changes depending if it is positive and above the bias threshold or negative and below the bias threshold.
The other way is in the form of a background colour. It only visualises the bias that can be interpreted based on the logarithm value in relation to the set bias threshold.
The total bullish price change and the total bearish price change are both plotted as a line with the fill between that line and the zero line. This helps visualise the bullish and the bearish moves individually.
The moving average of the sum of the bullish and the bearish moves is added as a line to represent the relationship between the two on a graph and not just as a logarithm.
I hope this indicator will serve you well and help with defining the relationship between the buyers and sellers more objectively, hopefully leading to more profitable trades.

Breadth of Volatility The Breadth of Volatility (BoV) is an indicator designed to help traders understand the activity and volatility of the market. It focuses on analyzing how fast prices are moving and how much trading volume is driving those movements. By combining these two factors—price speed and volume strength—the BoV provides a single value that reflects the current level of market activity. This can help traders identify when the market is particularly active or calm, which is useful for planning trading strategies.
The speed component of the BoV measures how quickly prices are moving compared to their recent average. This is done by using a metric called the Average True Range (ATR), which calculates the typical size of price movements over a specific period. The BoV compares the current price change to this average, showing whether the market is moving faster or slower than usual. Faster price movements generally indicate higher volatility, which might signal opportunities for active traders.
The strength component focuses on the role of trading volume in price changes. It multiplies the trading volume by the size of the price movement to create a value called volume strength. This value is then compared to the highest volume strength seen over a recent period, which helps gauge whether the current price action is being strongly supported by trading activity. When the strength value is high, it suggests that market participants are actively trading and supporting the price movement.
These two components—speed and strength—are averaged to calculate the Breadth of Volatility value. While the formula also includes a placeholder for a third component (related to fundamental analysis), it is currently inactive and does not influence the final value. The BoV is displayed as a line on a chart, with a zero line for reference. Positive BoV values indicate heightened market activity and volatility, while values near zero suggest a quieter market. This indicator is particularly helpful for new traders to monitor market conditions and adjust their strategies accordingly, whether they’re focusing on trend-following or waiting for calmer periods for more conservative trades.
Important Notice:
Trading financial markets involves significant risk and may not be suitable for all investors. The use of technical indicators like this one does not guarantee profitable results. This indicator should not be used as a standalone analysis tool. It is essential to combine it with other forms of analysis, such as fundamental analysis, risk management strategies, and awareness of current market conditions. Always conduct thorough research or consult with a qualified financial advisor before making trading decisions. Past performance is not indicative of future results.
Disclaimer:
Trading financial instruments involves substantial risk and may not be suitable for all investors. Past performance is not indicative of future results. This indicator is provided for informational and educational purposes only and should not be considered investment advice. Always conduct your own research and consult with a licensed financial professional before making any trading decisions.
Note: The effectiveness of any technical indicator can vary based on market conditions and individual trading styles. It's crucial to test indicators thoroughly using historical data and possibly paper trading before applying them in live trading scenarios.

Abnormal Delta Volume HistogramThis indicator can help traders spot potential turning points or heightened volatility and provides a dynamic measure of unusual market behavior by focusing on shifts in “delta volume.” Delta volume is approximated by assigning all of a bar’s volume to the bullish side if the close is higher than the open and to the bearish side if the close is lower. The result is a net volume measure that can hint at which side—buyers or sellers—has the upper hand. By comparing this delta volume to its historical averages and measuring how far current readings deviate in terms of standard deviations, the indicator can highlight bars that reflect significantly stronger than normal buying or selling pressure.
A histogram visualizes these delta volume values on a bar-by-bar basis, while additional reference lines for the mean and threshold boundaries allow traders to quickly identify abnormal conditions. When the histogram bars extend beyond the threshold lines, and are colored differently to signal abnormality, it can draw the trader’s eye to periods when market participation or sentiment may be shifting rapidly. This can be used as an early warning signal, prompting further investigation into price action, external news, or significant events that may be driving unusual volume patterns.
Important Notice:
Trading financial markets involves significant risk and may not be suitable for all investors. The use of technical indicators like this one does not guarantee profitable results. This indicator should not be used as a standalone analysis tool. It is essential to combine it with other forms of analysis, such as fundamental analysis, risk management strategies, and awareness of current market conditions. Always conduct thorough research or consult with a qualified financial advisor before making trading decisions. Past performance is not indicative of future results.
Disclaimer:
Trading financial instruments involves substantial risk and may not be suitable for all investors. Past performance is not indicative of future results. This indicator is provided for informational and educational purposes only and should not be considered investment advice. Always conduct your own research and consult with a licensed financial professional before making any trading decisions.
Note: The effectiveness of any technical indicator can vary based on market conditions and individual trading styles. It's crucial to test indicators thoroughly using historical data and possibly paper trading before applying them in live trading scenarios.

Santa's Secrets | FractalystSanta’s Secrets is a visually engaging trading tool that infuses holiday cheer into your charts. Inspired by the enchanting, mysterious vibes of the holiday season, this indicator overlays price charts with dynamic, multi-colored glitches that sync with market data, delivering a festive and whimsical visual experience.
The indicator brings a magical touch to your charts, featuring characters from classic holiday themes (e.g., Santa, reindeer, snowflakes, gift boxes) to create a fun and festive “glitch effect.” Users can select a theme for their matrix characters, adding a holiday twist to their trading visuals. As the market data moves, these themed characters are randomly picked and displayed on the chart in a colorful cascade.
Underlying Calculations and Logic
1.Character Management:
The indicator uses arrays to manage different sets of holiday-themed characters, such as Santa’s sleigh, snowflakes, and reindeer. These arrays allow dynamic selection and update of characters as the market moves, mimicking a festive glitch effect.
2. Current and Previous States:
Arrays track the current and previous states of characters, ensuring smooth transitions between visual updates. This dual-state management enables the effects to look like a magical, continuous movement, just like Santa’s sleigh cruising through the winter night.
3. Transparency Control:
Transparency levels are controlled through arrays, adjusting opacity to create subtle fading effects or more intense visual appearances. The result is a festive glow that can fade or intensify depending on the market’s volatility.
4. Rain Effect Simulation:
To create the “snowfall” or “glitching lights” effect, the indicator manages arrays that simulate falling characters, like snowflakes or candy canes, continuously updating their position and visibility. As new characters enter the top of the screen, older ones disappear from the bottom, with fading transparency to simulate a seamless flow.
5. Operational Flow:
• Initialization: Arrays initialize the characters and transparency controls, readying the script for smooth and continuous updates during trading.
• Updates: During each cycle, new characters are selected and the old ones shift, with updates in both content and appearance ensuring the matrix effect is visually appealing.
• Rendering: The arrays control how the characters are rendered, ensuring the magical holiday effect stays lively and eye-catching without interrupting the trading flow.
How to Use Santa’s Secrets Indicator
1. Apply the Indicator to Your Charts:
Add the Santa’s Secrets indicator to your chart, activating the holiday-themed visual effect on your selected trading instrument or time frame.
2. Select Your Holiday Theme:
In the settings, choose the holiday theme or character set. Whether it’s Santa’s sleigh, reindeer, snowflakes, or gift boxes, pick the one that brings the most festive cheer to your charts.
3. Choose Your Visual Effect (Snowfall or Glitch Burst):
Select between the “Snowfall” effect, where characters gently drift down the chart like snowflakes, or the “Glitch Burst” effect, where characters explode outward in a burst of holiday cheer, representing bursts of market volatility.
4. Adjust the Color for Holiday Vibes:
Customize the color of the characters to match your chart’s aesthetic or reflect different market conditions. Choose from red for a downtrend, green for an uptrend, or opt for a gradient of colors to capture a true holiday spirit.
5. Fit the Matrix to Your Display:
Adjust the width and height of the matrix display to make sure it fits perfectly with your chart layout. Ensure it doesn’t obscure your view while still providing the holiday-themed magic.
What Makes Santa’s Secrets Indicator Unique?
Holiday Theme Selection:
Santa’s Secrets allows traders to choose from a variety of holiday-themed characters. Whether you prefer the traditional Santa’s sleigh, snowflakes, reindeer, or gift boxes, you can bring the festive spirit into your trading. This personalized touch adds a fun, holiday twist to your charts and keeps you engaged during the festive season.
Dynamic Effects:
Choose between two exciting visual modes – Snowfall Mode or Glitch Burst Mode. The Snowfall Mode brings a gentle, peaceful effect with characters cascading down the chart like snowflakes, while Glitch Burst Mode creates a more intense effect, radiating characters outward in an explosive, holiday-themed display.
Customizable Holiday Colors:
Traders can fully customize the color of the matrix characters to match their trading environment. Whether you want a traditional red and green for a Christmas mood or a blue and white snow effect, Santa’s Secrets allows you to create the perfect holiday atmosphere while you trade.
Universal Display Compatibility:
No matter what screen or device you’re using – whether it’s a large monitor, laptop, or mobile – Santa’s Secrets is fully adjustable to fit your screen size. The holiday effect remains visually striking without compromising the integrity of your chart data.
Wishing you a happy year filled with success, growth, and profitable trades.🎅🎁
Let's kick off the new year strong with Santa's Secrets! 🚀🎄
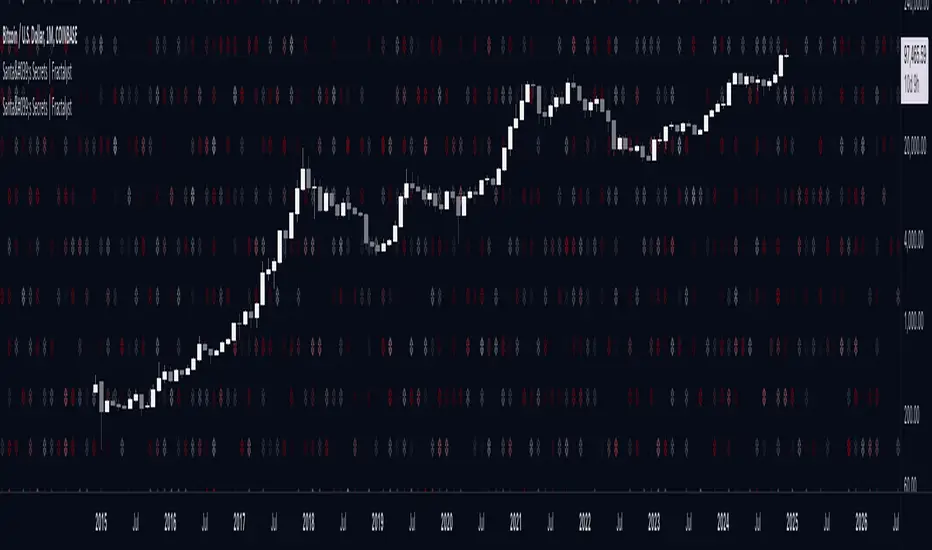
Supertrend StatsSupertrend with Probabilistic Stats and MA Filter
Overview: The Supertrend with Probabilistic Stats and MA Filter is a comprehensive TradingView Pine Script indicator designed to enhance trading strategies by combining the trend-detection capabilities of the Supertrend indicator with the trend-confirmation strength of Moving Averages (MA). Additionally, it offers robust statistical tracking to provide traders with valuable insights into the performance and reliability of their trading signals.
Key Features:
Supertrend Indicator Integration:
Trend Detection: Utilizes the Supertrend algorithm to identify prevailing market trends.
Buy/Sell Signals: Generates clear buy and sell signals based on trend reversals.
Customizable Parameters: Allows adjustment of ATR period and multiplier to suit different trading styles and market conditions.
Visual Aids: Plots Supertrend lines on the chart and highlights trend areas for easy visualization.
Moving Average (MA) Filter:
Trend Confirmation: Filters buy signals to occur only when the open price is above the MA and sell signals only when the open price is below the MA.
Customizable MA Types: Supports various MA types, including SMA, EMA, SMMA (RMA), WMA, and VWMA.
Flexible Configuration: Offers options to enable/disable the MA filter, select MA type, set MA length, and adjust MA source and offset.
Statistical Tracking:
Trimmed Mean Calculation: Computes trimmed means for bullish and bearish movements, removing outliers to provide a more accurate average movement.
Success Rate Metrics: Calculates the success rates (%) for both bullish and bearish signals, indicating the percentage of signals that resulted in favorable price movements.
Candle Count Analysis: Tracks the average number of candles each bullish and bearish move lasts, offering insights into the duration of trends.
Data Visualization: Presents all statistical data in a neatly formatted table on the chart, allowing for quick reference and analysis.
Customizable Statistics Table:
Text Color Customization: Provides an option to change the table text color to match personal preferences or chart aesthetics, enhancing readability.
Comprehensive Metrics: Displays key statistics such as Bullish/Bearish Averages, Counts, Success Rates, and Average Candle Counts.
Optional Pinbar Filtering:
Signal Refinement: Adds an additional layer of signal confirmation by filtering buy and sell signals based on pinbar candlestick patterns.
Adjustable Thresholds: Allows customization of the pinbar wick threshold to fine-tune signal accuracy.
Visual Enhancements:
Markers: Optionally displays markers on the first and last candles of bullish and bearish moves for better trend identification.
Highlighter: Shades the chart background to indicate current trend direction, aiding in visual trend recognition.
How It Works:
Trend Identification with Supertrend:
The indicator calculates the Supertrend based on user-defined ATR periods and multipliers.
It plots the Supertrend lines and generates buy/sell signals when the price crosses these lines, indicating a potential trend reversal.
Filtering Signals with Moving Average:
When the MA filter is enabled, the indicator ensures that buy signals are only considered valid if the candle's open price is above the selected MA, and sell signals only if the open price is below the MA.
This additional confirmation aligns trades with the broader market trend, potentially increasing signal reliability.
Statistical Analysis:
Upon triggering a buy or sell signal, the indicator records the entry price and tracks the subsequent price movements.
It calculates trimmed means to assess average movements while excluding extreme outliers.
Success rates are computed by comparing the closing price against the entry price, indicating how often signals result in favorable outcomes.
The average number of candles per move provides insight into trend duration and volatility.
Visualization and Customization:
All statistical data is presented in a table on the chart, with customizable text colors for enhanced readability.
Optional pinbar filtering and visual markers further refine and illustrate trading signals, aiding in decision-making.
Benefits to Traders:
Enhanced Signal Reliability:
By combining Supertrend with an MA filter, the indicator ensures that only signals aligning with the broader market trend are considered, potentially reducing false signals.
Data-Driven Decision Making:
The comprehensive statistical tracking offers traders insights into the performance of their signals, enabling informed adjustments to their trading strategies based on empirical data.
Trend Confirmation and Alignment:
The MA filter acts as a trend confirmation tool, ensuring that trades are placed in the direction of the prevailing trend, which can enhance the probability of successful trades.
Performance Metrics at a Glance:
The statistics table provides all necessary performance metrics in a single view, allowing traders to quickly assess the effectiveness of their strategy without sifting through extensive data.
Customization and Flexibility:
With options to adjust MA types, lengths, and table text colors, traders can tailor the indicator to fit their specific preferences and trading environments.
Visual Clarity and Aids:
The plotted Supertrend lines, MA line, signal markers, and highlighter enhance visual clarity, making it easier to identify trends and potential trade opportunities on the chart.
Usage Instructions:
Adding the Indicator:
Copy the Script: Select and copy the entire Pine Script provided.
Open TradingView: Navigate to TradingView and open your desired asset's chart.
Access Pine Editor: Click on the Pine Editor tab at the bottom of the TradingView interface.
Paste and Add to Chart: Paste the script into the editor and click "Add to Chart" to apply the indicator.
Configuring Settings:
Supertrend Parameters: Adjust the ATR period and multiplier to suit your trading style and the asset's volatility.
MA Filter Settings:
Enable MA Filter: Toggle "Enable MA Filter?" to ON to activate the filter.
Select MA Type: Choose from SMA, EMA, SMMA (RMA), WMA, or VWMA.
Set MA Length: Define the period for the MA calculation.
MA Source and Offset: Choose the price source (default is close) and set any desired plot offset.
Statistical Tracking:
Trimmed Mean Percentage: Set the percentage to trim outliers in mean calculations.
Show Cross Markers: Toggle to display or hide markers on the first and last candles of bullish and bearish moves.
Table Customization:
Table Text Color: Select your preferred text color for the statistics table to match your chart's theme or enhance readability.
Pinbar Filtering (Optional):
Enable Pinbar Filtering: Toggle to refine signals based on pinbar patterns.
Set Pinbar Wick Threshold: Adjust the threshold to define the characteristics of a valid pinbar.
Interpreting the Indicators:
Buy/Sell Signals: Look for labeled "BUY" and "SELL" signals on the chart that align with Supertrend reversals and MA conditions.
Statistics Table: Refer to the table located at the bottom right of the chart to assess:
Bullish/Bearish Averages: Average price movements following signals.
Counts: Total number of bullish and bearish signals.
Success Rates (%): Percentage of signals that resulted in profitable trades.
Candle Averages: Average duration of bullish and bearish moves in terms of candle counts.
Markers and Highlighter: Utilize visual markers and shaded trend areas to better understand market trends and the context of each signal.
Making Informed Decisions:
Assess Signal Performance: Use the success rates and averages to evaluate the effectiveness of your current settings and make necessary adjustments.
Adjust Parameters: Modify Supertrend and MA parameters based on observed performance and changing market conditions to optimize signal accuracy.
Combine with Other Analysis: Integrate insights from this indicator with other technical analysis tools and fundamental factors to form a holistic trading strategy.
Conclusion: The Supertrend with Probabilistic Stats and MA Filter indicator offers a powerful combination of trend detection, signal filtering, and statistical analysis. By providing detailed performance metrics and ensuring that trades align with the broader market trend, this indicator empowers traders to make more informed, data-driven decisions. Whether you're a novice seeking clarity or an experienced trader aiming to refine your strategy, this tool serves as a valuable asset in your trading toolkit.
If you have any further questions or require additional customizations, feel free to reach out!
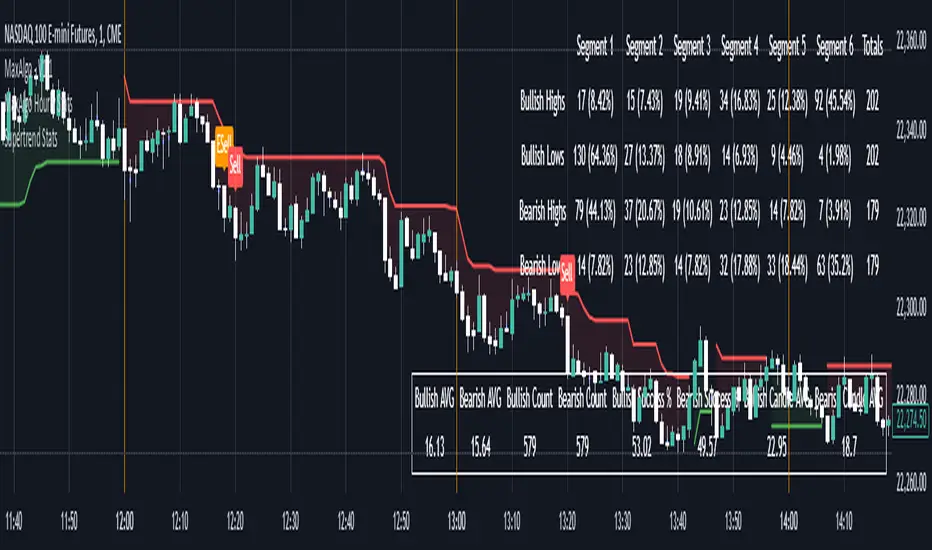
Buying and Selling Volume Pressure S/RThis custom indicator aims to visualize underlying market pressure by cumulatively analyzing where trade volume occurs relative to each candle's price range. By separating total volume into "buying" (when price closes near the high of the bar) and "selling" (when price closes near the low of the bar), the indicator identifies shifts in dominance between buyers and sellers over a defined lookback period.
When cumulative buying volume surpasses cumulative selling volume (a "bullish cross"), it suggests that buyers are gaining control. Conversely, when cumulative selling volume exceeds cumulative buying volume (a "bearish cross"), it indicates that sellers are taking the upper hand.
Based on these crossovers, the indicator derives dynamic Support and Resistance lines. After a bullish cross, it continuously tracks and updates the lowest low that occurs while the trend is bullish, forming a support zone. Similarly, after a bearish cross, it updates the highest high that appears during the bearish trend, forming a resistance zone.
A Mid Line is then calculated as the average of the current dynamic support and resistance levels, providing a central reference point. Around this Mid Line, the script constructs an upper and lower channel based on standard deviation, offering a sense of volatility or "divergence" from the mean level.
Finally, the indicator provides simple buy and sell signals: a buy signal is triggered when the price closes back above the Mid Line, suggesting a potential shift toward bullish conditions, while a sell signal appears when the price closes below the Mid Line, hinting at a possible bearish move.
In summary, this indicator blends volume-based market pressure analysis with adaptive support and resistance detection and overlays them onto the chart. It helps traders quickly gauge who controls the market (buyers or sellers), identify dynamic levels of support and resistance, and receive alerts on potential trend changes—simplifying decision-making in rapidly evolving market conditions.
Important Notice:
Trading financial markets involves significant risk and may not be suitable for all investors. The use of technical indicators like this one does not guarantee profitable results. This indicator should not be used as a standalone analysis tool. It is essential to combine it with other forms of analysis, such as fundamental analysis, risk management strategies, and awareness of current market conditions. Always conduct thorough research or consult with a qualified financial advisor before making trading decisions. Past performance is not indicative of future results.
Disclaimer:
Trading financial instruments involves substantial risk and may not be suitable for all investors. Past performance is not indicative of future results. This indicator is provided for informational and educational purposes only and should not be considered investment advice. Always conduct your own research and consult with a licensed financial professional before making any trading decisions.
Note: The effectiveness of any technical indicator can vary based on market conditions and individual trading styles. It's crucial to test indicators thoroughly using historical data and possibly paper trading before applying them in live trading scenarios.
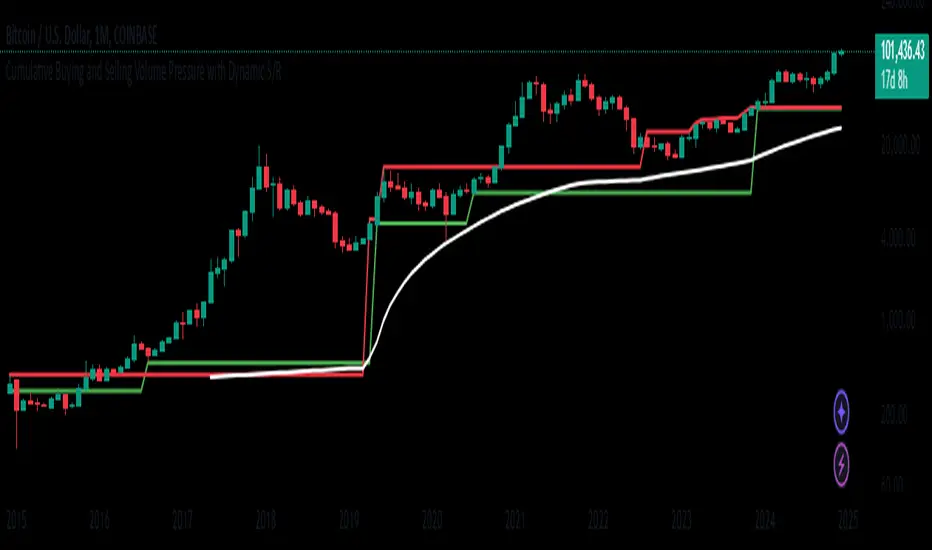
Market Anomaly Detector (MAD)Market Anomaly Detector (MAD) Indicator - Detailed Description:
The Market Anomaly Detector (MAD) Indicator is a unique tool designed to identify potential market anomalies by combining several price action-based and momentum indicators. This indicator is especially useful for traders who seek to identify significant market shifts and anomalies before they become visible in conventional technical indicators.
Key Features of the MAD Indicator:
1. Z-Score Threshold for Anomaly Detection:
• The Z-Score measures how far a current price is from its average over a defined period, normalized by standard deviation. This allows the MAD indicator to detect outliers or anomalies in price movements.
• By adjusting the Z-Score Threshold, traders can tune the sensitivity of the indicator to capture only the most significant price deviations, filtering out noise and reducing false signals.
2. Volume and Liquidity Filter:
• Volume is a key indicator of market participation and sentiment. The MAD Indicator uses a volume multiplier to assess when price movements are supported by sufficient trading volume.
• A volume spike is identified when the current volume exceeds the average volume by a certain multiplier. This ensures that only high-confidence signals are generated, particularly useful for spotting trend reversals and breakout opportunities.
3. Signal Cooldown Period:
• To prevent overfitting and reduce false signals, a signal cooldown period is implemented. Once a buy or sell signal is triggered, the indicator waits for a specified number of bars (e.g., 5) before triggering another signal, even if the price action meets the criteria for a new signal. This helps maintain a cleaner trading environment and avoids confusion when the market is volatile.
4. Upper and Lower Bands for Trend Confirmation:
• The MAD Indicator uses bands based on the mean price and standard deviation, similar to Bollinger Bands. These upper and lower bands help to define the expected price range for a given period, indicating overbought or oversold conditions.
• The combination of Z-Score, volume, and band analysis helps pinpoint when the price breaks out of expected ranges, providing early warning signs for potential market shifts.
5. Trend Confirmation from Higher Timeframes:
• The MAD Indicator includes a multi-timeframe approach to trend confirmation, using the 50-period EMA on a higher timeframe (e.g., 1-hour chart). This ensures that signals are aligned with the overall market trend, enhancing the reliability of buy and sell signals.
How It Works:
• The MAD Indicator continuously monitors price action, volume, and statistical anomalies, using the Z-Score to determine when the price is significantly deviating from its historical average.
• When the price breaks above the upper band and a bullish anomaly is detected, a buy signal is generated. (Green Background)
• Similarly, when the price breaks below the lower band and a bearish anomaly is detected, a sell signal is triggered. (Red Background
• By filtering signals based on volume and using the cooldown period, the MAD Indicator ensures that only high-quality trades are signaled.
How to Use the MAD Indicator:
• Buy Signal: Occurs when the price breaks above the upper band and there is a significant deviation from the mean (bullish anomaly).
• Sell Signal: Occurs when the price breaks below the lower band and there is a significant deviation from the mean (bearish anomaly).
• Volume Confirmation: Ensure that the buy/sell signals are supported by a volume spike, indicating strong market participation.
• Signal Cooldown Period: After a signal is triggered, the indicator waits for the cooldown period to avoid triggering multiple signals in quick succession.
Why It’s Worth Paying For:
The MAD Indicator combines advanced statistical analysis (Z-Score), price action, and volume analysis to identify market anomalies and breakouts before they are visible on standard indicators. By leveraging the power of mean reversion and statistical anomalies, this tool provides traders with high-confidence signals that can lead to profitable trades, especially in volatile markets. The integration of a multi-timeframe trend filter ensures that signals are aligned with the overall market trend, reducing the likelihood of false breakouts.
This indicator is ideal for trend-following traders looking for high-probability entries and mean-reversion traders aiming to capture price deviations. The signal cooldown period and volume filter provide an additional layer of precision, ensuring that you only act on the strongest market signals.

Dollar Volume DivergenceOverview
The Dollar Volume Profile and Divergence Indicator is a comprehensive tool designed to analyze both standard volume and dollar volume activity in the market. It visualizes dollar volume (calculated as close * volume) and highlights divergences between dollar volume and standard volume, providing insights into underlying market dynamics that aren't immediately visible with traditional volume analysis.
Key Features
Dollar Volume Profile:
Plots dollar volume as a histogram.
Highlights high-dollar volume bars in green (indicating significant trading activity).
Includes an optional average dollar volume line to show trends over time.
Volume-Divergence Analysis:
Calculates the difference (divergence) between dollar volume and standard volume.
Displays positive divergence (dollar volume > standard volume) in green and negative divergence (dollar volume < standard volume) in red.
Supports both histogram and boolean point visualization for divergence, offering flexibility in how the data is displayed.
Customizable Visualization:
Users can toggle between a Histogram or Boolean Points for divergence visualization.
Option to enable or disable the dollar volume profile and its average line.
Adjustable length parameter to fine-tune sensitivity for averages and divergences.
Use Cases
Volume Confirmation: Analyze whether dollar volume aligns with standard volume to confirm strong price movements.
Divergence Detection: Identify areas where dollar volume and standard volume deviate, which may signal potential reversals or exhaustion in a trend.
Market Strength Analysis: Assess the intensity of trading activity at specific price levels to determine key areas of interest.
How It Works
Dollar Volume Calculation:
Dollar volume is derived by multiplying the close price by the volume for each bar.
A moving average of dollar volume is used to determine relative activity levels.
Divergence Calculation:
The script calculates the difference between dollar volume and standard volume.
Positive values indicate that dollar volume exceeds standard volume, suggesting institutional or larger-scale trades.
Negative values highlight areas of lower dollar volume compared to standard volume.
Visualization:
The Dollar Volume Profile is displayed as a histogram, with high-dollar volume bars highlighted.
Divergences are overlaid as either a histogram or triangle markers, depending on user preference.
Average lines (optional) provide smoother trends for both dollar volume and divergence.
Customization Options
Length: Adjusts the period for moving average calculations.
Plot Style: Choose between Histogram or Boolean Points for divergence visualization.
Toggle Visibility: Enable or disable the Dollar Volume Profile and its average line for a cleaner chart.
Why Use This Indicator?
This indicator bridges the gap between traditional volume analysis and dollar volume analysis, offering deeper insights into market behavior. By combining these metrics, traders can detect nuanced patterns, validate trends, and identify divergences that may signal market turning points or continuation.
Best Practices
Use this indicator in conjunction with price action and other technical indicators for confirmation.
Look for divergences in high-dollar volume areas to detect potential trend reversals.
Analyze the interaction between the dollar volume profile and divergence histogram for a comprehensive view of market activity.
Important Notice:
Trading financial markets involves significant risk and may not be suitable for all investors. The use of technical indicators like this one does not guarantee profitable results. This indicator should not be used as a standalone analysis tool. It is essential to combine it with other forms of analysis, such as fundamental analysis, risk management strategies, and awareness of current market conditions. Always conduct thorough research or consult with a qualified financial advisor before making trading decisions. Past performance is not indicative of future results.
Disclaimer:
Trading financial instruments involves substantial risk and may not be suitable for all investors. Past performance is not indicative of future results. This indicator is provided for informational and educational purposes only and should not be considered investment advice. Always conduct your own research and consult with a licensed financial professional before making any trading decisions.
Note: The effectiveness of any technical indicator can vary based on market conditions and individual trading styles. It's crucial to test indicators thoroughly using historical data and possibly paper trading before applying them in live trading scenarios.

Enhanced Reversal DetectorEnhanced Reversal Detector - Script Description
Overview:
The Enhanced Reversal Detector is a highly refined indicator designed to identify precise trend reversals in financial markets. It improves upon the original reversal detection logic by incorporating additional filters for trend confirmation (using EMA), volume spikes, and candle patterns. These enhancements significantly increase the reliability and accuracy of reversal signals, making it an excellent tool for both short-term and long-term traders.
Key Features
Candle Lookback Logic:
The indicator evaluates historical price action over a user-defined lookback period to detect potential reversal zones.
Bullish reversal conditions are met when price consistently tests lows, and bearish reversal conditions are met when price tests highs.
Trend Confirmation (EMA Filter):
To ensure that reversal signals align with the broader market trend, the indicator incorporates an Exponential Moving Average (EMA) filter.
Bullish signals are only triggered when the price is above the EMA, while bearish signals are only triggered when the price is below the EMA.
Volume Spike Filter:
The indicator checks for significant increases in trading volume to confirm that the reversal is supported by strong market activity.
Volume spikes are calculated as trading volume exceeding a multiple of the 20-bar average volume (default: 1.5x).
Confirmation Period:
Users can define a confirmation window within which reversal signals must be validated.
This reduces false positives and ensures only strong reversals are considered.
Non-Repainting Mode:
Offers a non-repainting option, where signals are based on confirmed conditions from previous bars, ensuring reliability for backtesting.
Visual and Alert Features:
Clear visual markers on the chart indicate bullish (green triangle) and bearish (red triangle) reversal points.
Alert notifications can be enabled for both bullish and bearish reversals, keeping traders informed in real-time.
Inputs
Candle Lookback: Number of candles to evaluate for reversal conditions.
Confirm Within: Number of candles within which a reversal must be validated.
Non-Repainting Mode: Option to enable or disable repainting for signals.
EMA Length: The length of the Exponential Moving Average used for trend confirmation.
Volume Spike Multiplier: Multiplier for identifying significant increases in trading volume.
How It Works
Reversal Detection:
Bullish signals are triggered when:
Price consistently tests recent lows (lookback period).
Price closes above the EMA.
A significant volume spike occurs.
Bearish signals are triggered under opposite conditions (price testing highs, closing below EMA, and volume spike).
Signal Filtering:
Incorporates EMA and volume-based filters to eliminate false positives and focus on high-confidence reversal signals.
Alert Notifications:
Alerts notify users of bullish or bearish reversal opportunities as soon as they are detected.
Use Cases
Scalping and Day Trading:
Ideal for identifying reversals on lower timeframes (e.g., 1-minute or 5-minute charts).
Swing Trading:
Works effectively on higher timeframes (e.g., 1-hour or daily charts) for capturing significant
trend reversals.
Volatile Markets:
Particularly useful in high-volatility markets like cryptocurrencies or forex.
Customization Tips
Adjust the lookback period to fine-tune the sensitivity of the reversal detection.
Increase the volume spike multiplier for markets with irregular trading volumes to focus on significant moves.
Experiment with the EMA length to align signals with your trading strategy's preferred trend duration.
Conclusion
The Enhanced Reversal Detector combines advanced price action analysis, trend confirmation, and market participation filters to deliver high-accuracy reversal signals. With its customizable settings and robust filtering mechanisms, this indicator is an invaluable tool for identifying profitable trading opportunities while minimizing noise and false signals.
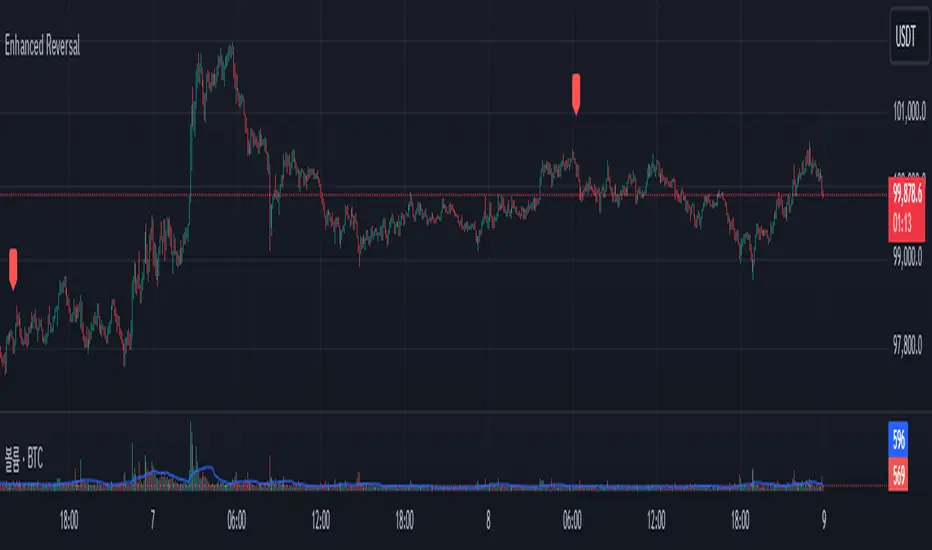
Spot PositionThis TradingView indicator helps traders manage their trades by providing visual information about open trades and profit/loss ratios. The indicator allows users to enter trade details such as entry price, stop loss, number of targets, and desired profit percentage. The indicator displays the current profit or loss percentage in real time, with profitable trades highlighted in green and losing trades in red. The indicator also displays profit and loss levels as well as the risk-to-reward ratio (RRR) for each trade, helping traders make quick and informed decisions.
This indicator does not provide signals or contribute to candlestick analysis; it is only for tracking your open trades to see where they have reached in a simple and easy graphical way, allowing better access to profit and loss ratios
The indicator allows adding five open trades at once and plots the targets of each trade on the chart and displays a table with a summary of open trades in terms of profit and loss
You can write your trade targets by writing the prices of all targets and separating each price with a comma (,) or write the number of targets and the profit percentage and the indicator will distribute the targets evenly over the prices
