Kinetic Elasticity Reversion System - Adaptive Genesis Engine🧬 KERS-AGE - EVOLVED KINETIC ELASTICITY REVERSION SYSTEM
EDUCATIONAL GUIDE & THEORETICAL FOUNDATION
⚠️ IMPORTANT DISCLAIMER
This indicator and guide are provided for educational and informational purposes only. This is NOT financial advice, investment advice, or a recommendation to buy or sell any security.
Trading involves substantial risk of loss. Past performance does not guarantee future results. The performance metrics, win rates, and examples shown are from historical backtesting and do not represent actual trading results. Always conduct your own research, paper trade extensively, and never risk capital you cannot afford to lose.
The developers assume no responsibility for any trading losses incurred through use of this indicator.
INTRODUCTION
KERS-AGE (Kinetic Elasticity Reversion System - Adaptive Genetic Evolution) represents an educational exploration of adaptive trading systems. Unlike traditional indicators with fixed parameters, KERS-AGE demonstrates a dynamic, evolving approach that adjusts to market conditions through genetic algorithms and machine learning techniques.
This guide explains the theoretical concepts, technical implementation, and educational examples of how the system operates.
CONCEPTUAL FRAMEWORK
Traditional Indicators vs. Adaptive Systems:
Traditional Indicators:
Fixed parameters
Single strategy approach
Static behavior
Designed for specific conditions
Require manual optimization
Adaptive System Approach (KERS-AGE):
Dynamic parameters (adjust based on conditions)
Multiple strategies tested simultaneously
Pattern recognition (cluster analysis)
Regime-aware (speciation)
Automated optimization (genetic algorithms)
Transparent operation (detailed dashboard)
CORE CONCEPTS EXPLAINED
1. THE ELASTICITY ANALOGY 🎯
The indicator models price behavior as if connected to a moving average by an elastic band:
Price extends away → Elastic tension builds → Potential reversion point identified
Key Measurements:
STRETCH: Distance from price to equilibrium (MA)
TENSION: Normalized force calculation
THRESHOLD: Point where multiple factors align
Theoretical Foundation:
Markets have historically shown mean-reverting tendencies around fair value. This concept quantifies the deviation and identifies potential reversal zones based on multiple confluence factors.
Mathematical Approach:
text
Tension Score = (Price Distance from MA) / (Band Width) × Volatility Scaling
Signal Threshold = Multiple of ATR × Dynamic Volatility Ratio
Confluence = Tension Score + Additional Factors
2. THE 6 SIGNAL TYPES 📊
The system recognizes 6 distinct pattern categories:
A. ELASTIC SIGNALS
Pattern: Price reaches statistical band extremes
Theory: Maximum deviation from mean suggests potential reversion
Detection: Price touches outer zones (typically 2-3× ATR from MA)
Component: Mathematical band extension measurement
Historical Context: Often observed in markets with clear swing patterns
B. WICK SIGNALS
Pattern: Extended rejection wicks on candles
Theory: Failed breakout attempts may indicate directional exhaustion
Detection: Upper/lower wick exceeding 2× body size
Component: Real-time price rejection measurement
Historical Context: Common in volatile conditions with rapid reversals
C. EXHAUSTION SIGNALS
Pattern: Decelerating momentum despite price extension
Theory: Velocity and acceleration divergence may precede reversals
Detection: Decreasing velocity with negative acceleration
Component: Momentum derivative analysis
Historical Context: Often seen at trend maturity points
D. CLIMAX SIGNALS
Pattern: Volume spike at price extreme
Theory: Unusual volume at extremes historically correlates with turning points
Detection: Volume 1.5-2.5× average at band extreme
Component: Volume-price relationship analysis
Historical Context: Associated with institutional activity or capitulation
E. STRUCTURE SIGNALS
Pattern: Fractal pivot formations (swing highs/lows)
Theory: Market structure points have historically acted as support/resistance
Detection: 2-4 bar pivot patterns
Component: Classical technical analysis
Historical Context: Universal across timeframes and markets
F. DIVERGENCE SIGNALS
Pattern: RSI divergence versus price
Theory: Momentum divergence has historically preceded price reversals
Detection: Price makes new extreme but RSI does not
Component: Oscillator divergence detection
Historical Context: Considered a leading indicator in technical analysis
Pattern Confluence:
Historical testing suggests stronger signals when multiple types align:
Elastic + Wick + Volume = Higher confluence score
Elastic + Exhaustion + Divergence = Multiple confirmation factors
Any 3+ types = Increased pattern strength
Note: Past pattern performance does not guarantee future occurrence.
3. REGIME DETECTION 🌍
The system attempts to classify market conditions into three behavioral regimes:
📈 TREND REGIME
Detection Methodology:
text
Efficiency Ratio = Net Movement / Total Movement
Classification: Efficiency > 0.5 AND Volatility < 1.3 → TREND
Characteristics Observed:
Directional price movement
Relatively lower volatility
Defined higher highs/lower lows
Persistent directional momentum
System Response:
Reduces signal frequency
Prioritizes trend-specialist strategies
Applies additional filtering to counter-trend signals
Increases confluence requirements
Educational Note:
In trending conditions, counter-trend mean reversion signals historically have shown reduced reliability. Users may consider additional confirmation when trend regime is detected.
↔️ RANGE REGIME
Detection Methodology:
text
Classification: Efficiency < 0.5 AND Volatility 0.9-1.4 → RANGE
Characteristics Observed:
Oscillating price action
Defined support/resistance zones
Mean-reverting behavior patterns
Relatively balanced directional flow
System Response:
Increases signal frequency
Activates range-specialist strategies
Adjusts bands relative to volatility
Reduces confluence threshold
Educational Note:
Historical backtesting suggests mean reversion systems have performed better in ranging conditions. This does not guarantee future performance.
🌊 VOLATILE REGIME
Detection Methodology:
text
Classification: DVS (Dynamic Volatility Scaling) > 1.5 → VOLATILE
Characteristics Observed:
Erratic price swings
Expanded ranges
Elevated ATR readings
Often news or event-driven
System Response:
Activates volatility-specialist strategies
Widens bands automatically
Prioritizes wick rejection signals
Emphasizes volume confirmation
Educational Note:
Volatile conditions historically present both opportunity and increased risk. Wider stops may be appropriate for risk management.
4. GENETIC EVOLUTION EXPLAINED 🧬
The system employs genetic algorithms to optimize parameters - an approach used in computational finance research.
The Evolution Process:
STEP 1: INITIALIZATION
text
Initial State: System creates 4 starter strategies
- Strategy 0: Range-optimized parameters
- Strategy 1: Trend-optimized parameters
- Strategy 2: Volatility-optimized parameters
- Strategy 3: Balanced parameters
Each contains 14 adjustable parameters (genes):
- Band sensitivity
- Extension multiplier
- Wick threshold
- Momentum threshold
- Volume multiplier
- Component weights (elastic, wick, momentum, volume, fractal)
- Target percentage
STEP 2: COMPETITION (Shadow Trading)
text
Early Bars: All strategies generate signals in parallel
- Each tracks hypothetical performance independently
- Simulated P&L, win rate, Sharpe ratio calculated
- No actual trades executed (educational simulation)
- Performance metrics recorded for analysis
STEP 3: FITNESS EVALUATION
text
Fitness Calculation =
0.25 × Win Rate +
0.25 × PnL Score +
0.15 × Drawdown Score +
0.30 × Sharpe Ratio Score +
0.05 × Trade Count Score
With Walk-Forward enabled:
Fitness = 0.60 × Test Score + 0.40 × Train Score
With Speciation enabled:
Fitness adjusted by Diversity Penalty
STEP 4: SELECTION (Tournament)
text
Periodically (default every 50 bars):
- Randomly select 4 active strategies
- Compare fitness scores
- Top 2 selected as "parents"
STEP 5: CROSSOVER (Breeding)
text
Parent 1 Fitness: 0.65
Parent 2 Fitness: 0.55
Weight calculation: 0.65/(0.65+0.55) = 54%
For each parameter:
Child Parameter = (0.54 × Parent1) + (0.46 × Parent2)
Example:
Band Sensitivity: (0.54 × 1.5) + (0.46 × 2.0) = 1.73
STEP 6: MUTATION
text
For each parameter:
if random(0-1) < Mutation Rate (default 0.15):
Add random variation: -12% to +12%
Purpose: Prevents premature convergence
Enables: Discovery of novel parameter combinations
ADAPTIVE MUTATION:
If population fitness converges → Mutation rate × 1.5
(Encourages exploration when diversity decreases)
STEP 7: INSERTION
text
New strategy added to population:
- Assigned unique ID number
- Generation counter incremented
- Begins shadow trading
- Competes with existing strategies
STEP 8: CULLING (Selection Pressure)
text
Periodically (default every 100 bars):
- Identify lowest fitness strategy
- Verify not elite (protected top performers)
- Verify not last of species
- Remove from population
Result: Maintains selection pressure
Effect: Prevents weak strategies from diluting signals
STEP 9: SIGNAL GENERATION LOGIC
text
When determining signals to display:
If Ensemble enabled:
- All strategies cast weighted votes
- Weights based on fitness scores
- Specialists receive boost in matching regime
- Signal generated if consensus threshold reached
If Ensemble disabled:
- Single highest-fitness strategy used
STEP 10: ADAPTATION OBSERVATION
text
Over time: Population characteristics may shift
- Lower-performing strategies removed
- Higher-performing strategies replicated
- Parameters adjust toward observed optima
- Fitness scores generally trend upward
Long-term: Population reaches maturity
- Strategies become specialized
- Parameters optimized for recent conditions
- Performance stabilizes
Educational Context:
Genetic algorithms are a recognized computational method for optimization problems. This implementation applies those concepts to trading parameter optimization. Past optimization results do not guarantee future performance.
5. SPECIATION (Niche Specialization) 🐟🦎🦅
Inspired by biological speciation theory applied to algorithmic trading.
The Three Species:
RANGE SPECIALISTS 📊
text
Optimized for: Sideways market conditions
Parameter tendencies:
- Tighter bands (1.0-1.5× ATR)
- Higher sensitivity to elastic stretch
- Emphasis on fractal structure
- More frequent signal generation
Typically emerge when:
- Range regime detected
- Clear support/resistance present
- Mean reversion showing historical success
Historical backtesting observations:
- Win rates often in 55-65% range
- Smaller reward/risk ratios (0.5-1.5R)
- Higher trade frequency
TREND SPECIALISTS 📈
text
Optimized for: Directional market conditions
Parameter tendencies:
- Wider bands (2.0-2.5× ATR)
- Focus on momentum exhaustion
- Emphasis on divergence patterns
- More selective signal generation
Typically emerge when:
- Trend regime detected
- Strong directional movement observed
- Counter-trend exhaustion signals sought
Historical backtesting observations:
- Win rates often in 40-55% range
- Larger reward/risk ratios (1.5-3.0R)
- Lower trade frequency
VOLATILITY SPECIALISTS 🌊
text
Optimized for: High-volatility conditions
Parameter tendencies:
- Expanded bands (1.5-2.0× ATR)
- Priority on wick rejection patterns
- Strong volume confirmation requirement
- Very selective signals
Typically emerge when:
- Volatile regime detected
- High DVS ratio (>1.5)
- News-driven or event-driven conditions
Historical backtesting observations:
- Win rates often in 50-60% range
- Variable reward/risk ratios (1.0-2.5R)
- Opportunistic trade timing
Species Protection Mechanism:
text
Minimum Per Species: Configurable (default 2)
If Range specialists = 1:
→ Preferential spawning of Range type
→ Protection from culling process
Purpose: Ensures coverage across regime types
Theory: Markets cycle between behavioral states
Goal: Prevent extinction of specialized approaches
Fitness Sharing:
text
If Species has 4 members:
Individual Fitness × 1 / (4 ^ 0.3)
Individual Fitness × 0.72
Purpose: Creates pressure toward species diversity
Effect: Prevents single approach from dominating population
Educational Note: Speciation is a theoretical framework for maintaining strategy diversity. Past specialization performance does not guarantee future regime classification accuracy or signal quality.
6. WALK-FORWARD VALIDATION 📈
An out-of-sample testing methodology used in quantitative research to reduce overfitting risk.
The Overfitting Problem:
text
Hypothetical Example:
In-Sample Backtest: 85% win rate
Out-of-Sample Results: 35% win rate
Explanation: Strategy may have optimized to historical noise
rather than repeatable patterns
Walk-Forward Methodology:
Timeline Structure:
text
┌──────────────────────────────────────────────────────┐
│ Train Window │ Test Window │ Train │ Test │
│ (200 bars) │ (50 bars) │ (200) │ (50) │
└──────────────────────────────────────────────────────┘
In-Sample Out-of-Sample IS OOS
(Optimize) (Validate) Cycle 2...
TRAIN PHASE (In-Sample):
text
Example Bars 1-200: Strategies optimize parameters
- Performance tracked
- Not yet used for primary fitness
- Learning period
TEST PHASE (Out-of-Sample):
text
Example Bars 201-250: Strategies use optimized parameters
- Performance tracked separately
- Validation period
- Out-of-sample evaluation
FITNESS CALCULATION EXAMPLE:
text
Train Win Rate: 65%
Test Win Rate: 58%
Composite Fitness:
= (0.40 × 0.65) + (0.60 × 0.58)
= 0.26 + 0.35
= 0.61
Note: Test results weighted 60%, Train 40%
Theory: Out-of-sample may better indicate forward performance
OVERFIT DETECTION MECHANISM:
text
Gap = Train WR - Test WR = 65% - 58% = 7%
If Gap > Overfit Threshold (default 25%):
Fitness Penalty = Gap × 2
Example with 30% gap:
Strategy shows: Train 70%, Test 40%
Gap: 30% → Potential overfit flagged
Penalty: 30% × 2 = 60% fitness reduction
Result: Strategy likely to be culled
WINDOW ROLLING:
text
Example Bar 250: Test window complete
→ Reset both windows
→ Start new cycle
→ Previous results retained for analysis
Cycle Count increments
Historical performance tracked across multiple cycles
Educational Context:
Walk-forward analysis is a recognized approach in quantitative finance research for evaluating strategy robustness. However, past out-of-sample performance does not guarantee future results. Market conditions can change in ways not represented in historical data.
7. CLUSTER ANALYSIS 🔬
An unsupervised machine learning approach for pattern recognition.
The Concept:
text
Scenario: System identifies a price pivot that wasn't signaled
→ Extract pattern characteristics
→ Store features for analysis
→ Adjust detection for similar future patterns
Implementation:
STEP 1: FEATURE EXTRACTION
text
When significant move occurs without signal:
Extract 5-dimensional feature vector:
Feature Vector =
Example:
Observed Pattern:
STEP 2: CLUSTER ASSIGNMENT
text
Compare to existing cluster centroids using distance metric:
Cluster 0:
Cluster 1: ← Minimum distance
Cluster 2:
...
Assign to nearest cluster
STEP 3: CENTROID UPDATE
text
Old Centroid 1:
New Pattern:
Decay Rate: 0.95
Updated Centroid:
= 0.95 × Old + 0.05 × New
= Exponential moving average update
=
STEP 4: PROFIT TRACKING
text
Cluster Average Profit (hypothetical):
Old Average: 2.5R
New Observation: 3.2R
Updated: 0.95 × 2.5 + 0.05 × 3.2 = 2.535R
STEP 5: LEARNING ADJUSTMENT
text
If Cluster Average Profit > Threshold (e.g., 2.0R):
Cluster Learning Boost += increment (e.g., 0.1)
(Maximum cap: 2.0)
Effect: Future signals resembling this cluster receive adjustment
STEP 6: SCORE MODIFICATION
text
For signals matching cluster characteristics:
Base Score × Cluster Learning Boost
Example:
Base Score: 5.2
Cluster Boost: 1.3
Adjusted Score: 5.2 × 1.3 = 6.76
Result: Pattern more likely to generate signal
Cluster Interpretation Example:
text
CLUSTER 0: "High elastic, low volume"
Centroid:
Avg Profit: 3.5R (historical backtest)
Interpretation: Pure elastic signals in ranges historically favorable
CLUSTER 1: "Wick rejection, volatile"
Centroid:
Avg Profit: 2.8R (historical backtest)
Interpretation: Wick signals in volatility showed positive results
CLUSTER 2: "Exhaustion divergence"
Centroid:
Avg Profit: 4.2R (historical backtest)
Interpretation: Momentum exhaustion in trends performed well
Learning Progress Metrics:
text
Missed Total: 47
Clusters Updated: 142
Patterns Learned: 28
Interpretation:
- System identified 47 significant moves without signals
- Clusters updated 142 times (incremental refinement)
- Made 28 parameter adjustments
- Theoretically improving pattern recognition
Educational Note: Cluster analysis is a recognized machine learning technique. This implementation applies it to trading pattern recognition. Past cluster performance does not guarantee future pattern profitability or accurate classification.
8. ENSEMBLE VOTING 🗳️
A collective decision-making approach common in machine learning.
The Wisdom of Crowds Concept:
text
Single Model:
- May have blind spots
- Subject to individual bias
- Limited perspective
Ensemble of Models:
- Blind spots may offset
- Biases may average out
- Multiple perspectives considered
Implementation:
STEP 1: INDIVIDUAL VOTES
text
Example Bar 247:
Strategy 0 (Range): LONG (fitness: 0.65)
Strategy 1 (Trend): FLAT (fitness: 0.58)
Strategy 2 (Volatile): LONG (fitness: 0.52)
Strategy 3 (Balanced): SHORT (fitness: 0.48)
Strategy 4 (Range): LONG (fitness: 0.71)
Strategy 5 (Trend): FLAT (fitness: 0.55)
STEP 2: WEIGHT CALCULATION
text
Base Weight = Fitness Score
If strategy's species matches current regime:
Weight × Specialist Boost (configurable, default 1.5)
If strategy has recent positive performance:
Weight × Recent Performance Factor
Example for Strategy 0:
Base: 0.65
Range specialist in Range regime: 0.65 × 1.5 = 0.975
Recent performance adjustment: 0.975 × 1.13 = 1.10
STEP 3: WEIGHTED TALLYING
text
LONG votes:
S0: 1.10 + S2: 0.52 + S4: 0.71 = 2.33
SHORT votes:
S3: 0.48 = 0.48
FLAT votes:
S1: 0.58 + S5: 0.55 = 1.13
Total Weight: 2.33 + 0.48 + 1.13 = 3.94
STEP 4: CONSENSUS CALCULATION
text
LONG %: 2.33 / 3.94 = 59.1%
SHORT %: 0.48 / 3.94 = 12.2%
FLAT %: 1.13 / 3.94 = 28.7%
Minimum Consensus Setting: 60%
Result: NO SIGNAL (59.1% < 60%)
STEP 5: SIGNAL DETERMINATION
text
If LONG % >= Min Consensus:
→ Display LONG signal
→ Show consensus percentage in dashboard
If SHORT % >= Min Consensus:
→ Display SHORT signal
If neither threshold reached:
→ No signal displayed
Practical Examples:
text
Strong Consensus (85%):
5 strategies LONG, 0 SHORT, 1 FLAT
→ High agreement among models
Moderate Consensus (62%):
3 LONG, 2 SHORT, 1 FLAT
→ Borderline agreement
No Consensus (48%):
3 LONG, 2 SHORT, 1 FLAT
→ Insufficient agreement, no signal shown
Educational Note: Ensemble methods are widely used in machine learning to improve model robustness. This implementation applies ensemble concepts to trading signals. Past ensemble performance does not guarantee future signal quality or profitability.
9. THOMPSON SAMPLING 🎲
A Bayesian reinforcement learning technique for balancing exploration and exploitation.
The Exploration-Exploitation Dilemma:
text
EXPLOITATION: Use what appears to work
Benefit: Leverages observed success patterns
Risk: May miss better alternatives
EXPLORATION: Try less-tested approaches
Benefit: May discover superior methods
Risk: May waste resources on inferior options
Thompson Sampling Solution:
STEP 1: BETA DISTRIBUTIONS
text
For each signal type, maintain:
Alpha = Successes + 1
Beta = Failures + 1
Example for Elastic signals:
15 wins, 10 losses
Alpha = 16, Beta = 11
STEP 2: PROBABILITY SAMPLING
text
Rather than using simple Win Rate = 15/25 = 60%
Sample from Beta(16, 11) distribution:
Possible samples: 0.55, 0.62, 0.58, 0.64, 0.59...
Rationale: Incorporates uncertainty
- Type with 5 trades: High uncertainty, wide sample variation
- Type with 50 trades: Lower uncertainty, narrow sample range
STEP 3: TYPE PRIORITIZATION
text
Example Bar 248:
Elastic sampled: 0.62
Wick sampled: 0.58
Exhaustion sampled: 0.71 ← Highest this sample
Climax sampled: 0.52
Structure sampled: 0.63
Divergence sampled: 0.45
Exhaustion type receives temporary boost
STEP 4: SIGNAL ADJUSTMENT
text
If current signal is Exhaustion type:
Score × (0.7 + 0.71 × 0.6)
Score × 1.126
If current signal is other type with lower sample:
Score × (0.7 + sample × 0.6)
(smaller adjustment)
STEP 5: OUTCOME FEEDBACK
text
When trade completes:
If WIN:
Alpha += 1
(Beta unchanged)
If LOSS:
Beta += 1
(Alpha unchanged)
Effect: Shifts probability distribution for future samples
Educational Context:
Thompson Sampling is a recognized Bayesian approach to the multi-armed bandit problem. This implementation applies it to signal type selection. The mathematical optimality assumes stationary distributions, which may not hold in financial markets. Past sampling performance does not guarantee future type selection accuracy.
10. DYNAMIC VOLATILITY SCALING (DVS) 📉
An adaptive approach where parameters adjust based on current vs. baseline volatility.
The Adaptation Problem:
text
Fixed bands (e.g., always 1.5 ATR):
In low volatility environment (vol = 0.5):
Bands may be too wide → fewer signals
In high volatility environment (vol = 2.0):
Bands may be too tight → excessive signals
The DVS Approach:
STEP 1: BASELINE ESTABLISHMENT
text
Calculate volatility over baseline period (default 100 bars):
Method options: ATR / Close, Parkinson, or Garman-Klass
Example average volatility = 1.2%
This represents "normal" for recent conditions
STEP 2: CURRENT VOLATILITY
text
Current bar volatility = 1.8%
STEP 3: DVS RATIO
text
DVS Ratio = Current / Baseline
= 1.8 / 1.2
= 1.5
Interpretation: Volatility currently 50% above baseline
STEP 4: BAND ADJUSTMENT
text
Base Band Width: 1.5 ATR
Adjusted Band Width:
Upper: 1.5 × DVS = 1.5 × 1.5 = 2.25 ATR
Lower: Same
Result: Bands expand 50% to accommodate higher volatility
STEP 5: THRESHOLD ADJUSTMENT
text
Base Thresholds:
Wick: 0.15
Momentum: 0.6
Adjusted:
Wick: 0.15 / DVS = 0.10 (easier to trigger in high vol)
Momentum: 0.6 × DVS = 0.90 (harder to trigger in high vol)
DVS Calculation Methods:
text
ATR RATIO (Simplest):
DVS = (ATR / Close) / SMA(ATR / Close, 100)
PARKINSON (Range-based):
σ = √(∑(ln(H/L))² / (4×n×ln(2)))
DVS = Current σ / Baseline σ
GARMAN-KLASS (Comprehensive):
σ = √(0.5×(ln(H/L))² - (2×ln(2)-1)×(ln(C/O))²)
DVS = Current σ / Baseline σ
ENSEMBLE (Robust):
DVS = Median(ATR_Ratio, Parkinson, Garman_Klass)
Educational Note: Dynamic volatility scaling is an approach to normalize indicators across varying market conditions. The effectiveness depends on the assumption that recent volatility patterns continue, which is not guaranteed. Past volatility adjustment performance does not guarantee future normalization accuracy.
11. PRESSURE KERNEL 💪
A composite measurement attempting to quantify directional force beyond simple price movement.
Components:
1. CLOSE LOCATION VALUE (CLV)
text
CLV = ((Close - Low) - (High - Close)) / Range
Examples:
Close at top of range: CLV = +1.0 (bullish position)
Close at midpoint: CLV = 0.0 (neutral)
Close at bottom: CLV = -1.0 (bearish position)
2. WICK ASYMMETRY
text
Wick Pressure = (Lower Wick - Upper Wick) / Range
Additional factors:
If Lower Wick > Body × 2: +0.3 (rejection boost)
If Upper Wick > Body × 2: -0.3 (rejection penalty)
3. BODY MOMENTUM
text
Body Ratio = Body Size / Range
Body Momentum = Close > Open ? +Body Ratio : -Body Ratio
Strong bullish candle: +0.9
Weak bullish candle: +0.2
Doji: 0.0
4. PATH ESTIMATE
text
Close Position = (Close - Low) / Range
Open Position = (Open - Low) / Range
Path = Close Position - Open Position
Additional adjustments:
If closed high with lower wick: +0.2
If closed low with upper wick: -0.2
5. MOMENTUM CONFIRMATION
text
Price Change / ATR
Examples:
+1.5 ATR move: +1.0 (capped)
+0.5 ATR move: +0.5
-0.8 ATR move: -0.8
COMPOSITE CALCULATION:
text
Pressure =
CLV × 0.25 +
Wick Pressure × 0.25 +
Body Momentum × 0.20 +
Path Estimate × 0.15 +
Momentum Confirm × 0.15
Volume context applied:
If Volume > 1.5× avg: × 1.3
If Volume < 0.5× avg: × 0.7
Final smoothing: 3-period EMA
Pressure Interpretation:
text
Pressure > 0.3: Suggests buying pressure
→ May support LONG signals
→ May reduce SHORT signal strength
Pressure < -0.3: Suggests selling pressure
→ May support SHORT signals
→ May reduce LONG signal strength
-0.3 to +0.3: Neutral range
→ Minimal directional bias
Educational Note: The Pressure Kernel is a custom composite indicator combining multiple price action metrics. These weightings are theoretical constructs. Past pressure readings do not guarantee future directional movement or signal quality.
USAGE GUIDE - EDUCATIONAL EXAMPLES
Getting Started:
STEP 1: Add Indicator
Open TradingView
Add KERS-AGE to chart
Allow minimum 100 bars for initialization
Verify dashboard displays Gen: 1+
STEP 2: Initial Observation Period
text
First 200 bars:
- System is in learning phase
- Signal frequency typically low
- Population evolution occurring
- Fitness scores generally increasing
Recommendation: Observe without trading during initialization
STEP 3: Signal Evaluation Criteria
text
Consider evaluating signals based on:
- Confidence percentage
- Grade assignment (A+, A, B+, B, C)
- Position within bands
- Historical win rate shown in dashboard
- Train vs. Test performance gap
Example Signal Evaluation Checklist:
Educational Criteria to Consider:
Signal appeared (⚡ arrow displayed)
Confidence level meets personal threshold
Grade meets personal quality standard
Ensemble consensus (if enabled) meets threshold
Historical win rate acceptable
Test performance reasonable vs. Train
Price location at band extreme
Regime classification appropriate for strategy
If trending: Signal direction aligns with personal analysis
Stop loss distance acceptable for risk tolerance
Position size appropriate (example: 1-2% account risk)
Note: This is an educational checklist, not trading advice. Users should develop their own criteria based on personal risk tolerance and strategy.
Risk Management Educational Examples:
POSITION SIZING EXAMPLE:
text
Hypothetical scenario:
Account: $10,000
Risk tolerance: 1.5% per trade = $150
Indicated stop distance: 1.5 ATR = $300 per contract
Calculation: $150 / $300 = 0.5 contracts
This is an educational example only, not a recommendation.
STOP LOSS EXAMPLES:
text
System provides stop level (red line)
Typically calculated as 1.5 ATR from entry
Alternative approaches users might consider:
LONG: Below recent swing low
SHORT: Above recent swing high
Users should determine stops based on personal risk management.
TAKE PROFIT EXAMPLES:
text
System provides target level (green line)
Typically calculated as price stretch × 60%
Alternative approaches users might consider:
Scale out: Partial exit at 1R, remainder at 2R
Trailing stop: Adjust stop after profit threshold
Users should determine targets based on personal strategy.
Educational Note: These are theoretical examples for educational purposes. Actual position sizing and risk management should be determined by each user based on their individual risk tolerance, account size, and trading plan.
OPTIMIZATION BY MARKET TYPE - EDUCATIONAL SUGGESTIONS
RANGE-BOUND MARKETS
Suggested Settings for Testing:
Population Size: 6-8
Min Confluence: 5.0-6.0
Min Consensus: 70%
Enable Speciation: Consider enabling
Min Per Species: 2
Theoretical Rationale:
More strategies may provide better coverage
Moderate confluence may generate more signals
Higher consensus may filter quality
Speciation may encourage range specialist emergence
Historical Backtest Observations:
Win rates in testing: Varied, often 50-65% range
Reward/risk ratios observed: 0.5-1.5R
Signal frequency: Relatively frequent
Disclaimer: Past backtesting results do not guarantee future performance.
TRENDING MARKETS
Suggested Settings for Testing:
Population Size: 4-5
Min Confluence: 6.0-7.0
Consider enabling MTF filter
MTF Timeframe: 3-5× current timeframe
Specialist Boost: 1.8-2.0
Theoretical Rationale:
Fewer strategies may adapt faster
Higher confluence may filter counter-trend noise
MTF may reduce counter-trend signals
Specialist boost may prioritize trend specialists
Historical Backtest Observations:
Win rates in testing: Varied, often 40-55% range
Reward/risk ratios observed: 1.5-3.0R
Signal frequency: Less frequent
Disclaimer: Past backtesting results do not guarantee future performance.
VOLATILE MARKETS (e.g., Cryptocurrency)
Suggested Settings for Testing:
Base Length: 25-30
Band Multiplier: 1.8-2.0
DVS: Consider enabling (Ensemble method)
Consider enabling Volume Filter
Volume Multiplier: 1.5-2.0
Theoretical Rationale:
Longer base may smooth noise
Wider bands may accommodate larger swings
DVS may be critical for adaptation
Volume filter may confirm genuine moves
Historical Backtest Observations:
Win rates in testing: Varied, often 45-60% range
Reward/risk ratios observed: 1.0-2.5R
Signal frequency: Moderate
Disclaimer: Cryptocurrency markets are highly volatile and risky. Past backtesting results do not guarantee future performance.
SCALPING (1-5min timeframes)
Suggested Settings for Testing:
Base Length: 15-20
Train Window: 150
Test Window: 30
Spawn Interval: 30
Min Confluence: 5.5-6.5
Consider enabling Ensemble
Min Consensus: 75%
Theoretical Rationale:
Shorter base may increase responsiveness
Shorter windows may speed evolution cycles
Quick spawning may enable rapid adaptation
Higher confluence may filter noise
Ensemble may reduce false signals
Historical Backtest Observations:
Win rates in testing: Varied, often 50-65% range
Reward/risk ratios observed: 0.5-1.0R
Signal frequency: Frequent but filtered
Disclaimer: Scalping involves high frequency trading with increased transaction costs and slippage risk. Past backtesting results do not guarantee future performance.
SWING TRADING (4H-Daily timeframes)
Suggested Settings for Testing:
Base Length: 25-35
Train Window: 300
Test Window: 100
Population Size: 7-8
Consider enabling Walk-Forward
Cooldown: 8-10 bars
Theoretical Rationale:
Longer timeframe may benefit from longer lookbacks
Larger windows may improve robustness testing
More population may increase stability
Walk-forward may be valuable for multi-day holds
Longer cooldown may reduce overtrading
Historical Backtest Observations:
Win rates in testing: Varied, often 45-60% range
Reward/risk ratios observed: 2.0-4.0R
Signal frequency: Infrequent but potentially higher quality
Disclaimer: Swing trading involves overnight and weekend risk. Past backtesting results do not guarantee future performance.
DASHBOARD GUIDE - INTERPRETATION EXAMPLES
Reading Each Section:
HEADER:
text
🧬 KERS-AGE EVOLVED 📈 TREND
Regime indication:
Color coding suggests current classification
(Green = Range, Orange = Trend, Purple = Volatile)
POPULATION:
text
Pop: 6/6
Gen: 42
Interpretation:
- Population at target size
- System at generation 42
- May indicate mature evolution
SPECIES (if enabled):
text
R:2 T:3 V:1
Interpretation:
- 2 Range specialists
- 3 Trend specialists
- 1 Volatility specialist
In TREND regime this distribution may be expected
WALK-FORWARD (if enabled):
text
Phase: 🧪 TEST
Cycles: 5
Train: 65%
Test: 58%
Considerations:
- Currently in test phase
- Completed 5 full cycles
- 7% performance gap between train and test
- Gap under default 25% overfit threshold
ENSEMBLE (if enabled):
text
Vote: 🟢 LONG
Consensus: 72%
Interpretation:
- Weighted majority voting LONG
- 72% agreement level
- Exceeds default 60% consensus threshold
SELECTED STRATEGY:
text
ID:23
Trades: 47
Win%: 58%
P&L: +8.3R
Fitness: 0.62
Information displayed:
- Strategy ID 23, Trend specialist
- 47 historical simulated trades
- 58% historical win rate
- +8.3R historical cumulative reward/risk
- 0.62 fitness score
Note: These are historical simulation metrics
SIGNAL QUALITY:
text
Conf: 78%
Grade: B+
Elastic: ████████░░
Wick: ██████░░░░
Momentum: ███████░░░
Pressure: ███████░░░
Information displayed:
- 78% confluence score
- B+ grade assignment
- Elastic component strongest
- Visual representation of component strengths
LEARNING (if enabled):
text
Missed: 47
Learned: 28
Interpretation:
- System identified 47 moves without signals
- 28 pattern adjustments made
- Suggests ongoing learning process
POSITION:
text
POS: 🟢 LONG
Score: 7.2
Current state:
- Simulated long position active
- 7.2 confluence score
- Monitor for potential exit signal
Educational Note: Dashboard displays are for informational and educational purposes. All performance metrics are historical simulations and do not represent actual trading results or future expectations.
FREQUENTLY ASKED QUESTIONS - EDUCATIONAL RESPONSES
Q: Why aren't signals showing?
A: Several factors may affect signal generation:
System may still be initializing (check Gen: counter)
Confluence score may be below threshold
Ensemble consensus (if enabled) may be below requirement
Current regime may naturally produce fewer signals
Filters may be active (volume, noise reduction)
Consider adjusting settings or allowing more time for evolution.
Q: The win rate seems low compared to backtesting?
A: Consider these factors:
First 200 bars typically represent learning period
Focus on TEST % rather than TRAIN % for realistic expectations
Trend regime historically shows 40-55% win rates in backtesting
Different market conditions may affect performance
System emphasizes reward/risk ratio alongside win rate
Past performance does not guarantee future results
Q: Should I take all signals?
A: This is a personal decision. Some users may consider:
Taking higher grades (A+, A) in any regime
Being more selective in trend regimes
Requiring higher ensemble consensus
Only trading during specific regimes
Paper trading extensively before live trading
Each user should develop their own signal selection criteria.
Q: Signals appear then disappear?
A: This may be expected behavior:
Default requires 2-bar persistence
Designed to filter brief spikes
Confirmation delay intended to reduce false signals
Wait for persistence requirement to be met
This is an intentional feature, not a malfunction.
Q: Test % much lower than Train %?
A: This may indicate:
Overfit detection system functioning
Gap exceeding threshold triggers penalty
Strategy may be optimizing to in-sample noise
System designed to cull such strategies
Walk-forward protection working as intended
This is a safety feature to reduce overfitting risk.
Q: The population keeps culling strategies?
A: This is part of normal evolution:
Lower-performing strategies removed periodically
Higher-performing strategies replicate
Population quality theoretically improves over time
Total culled count shows selection pressure
This is expected evolutionary behavior.
Q: Which timeframe works best?
A: Backtesting suggests 15min to 4H may be suitable ranges:
Lower timeframes may be noisier, may need more filtering
Higher timeframes may produce fewer signals
Extensive historical testing recommended for chosen asset
Each asset may behave differently
Consider paper trading across multiple timeframes
Personal testing is recommended for your specific use case.
Q: Does it work on all asset types?
A: Historical testing suggests:
Cryptocurrency: Consider longer Base Length (25-30) due to volatility
Forex: Standard settings may be appropriate starting point
Stocks: Standard settings, possibly smaller population (4-5)
Indices: Trend-focused settings may be worth testing
Each asset class has unique characteristics. Extensive testing recommended.
Q: Can settings be changed after initialization?
A: Yes, but considerations:
Population will reset
Strategies restart evolution
Learning progress resets
Consider testing new settings on separate chart first
May want to compare performance before committing
Settings changes restart the evolutionary process.
Q: Walk-Forward enabled or disabled?
A: Educational perspective:
Walk-Forward adds out-of-sample validation
May reduce overfitting risk
Results may be more conservative
Considered best practice in quantitative research
Requires more bars for meaningful data
Recommended for those concerned about robustness
Individual users should assess based on their needs.
Q: Ensemble mode or single strategy?
A: Trade-offs to consider:
Ensemble approach:
Requires consensus threshold
May have higher consistency
Typically fewer signals
Multiple perspectives considered
Single strategy approach:
More signals (varying quality)
Faster response to conditions
Higher variability
More active signal generation
Personal preference and risk tolerance should guide this choice.
ADVANCED CONSIDERATIONS
Evolution Time: Consider allowing 200+ bars for population maturity
Regime Awareness: Historical performance varies by regime classification
Confluence Range: Testing suggests 70-85% may be informative range
Ensemble Levels: 80%+ consensus historically associated with stronger agreement
Out-of-Sample Focus: Test performance may be more indicative than train performance
Learning Metrics: "Learned" count shows pattern adjustment over time
Pressure Levels: >0.4 pressure historically added confirmation
DVS Monitoring: >1.5 DVS typically widens bands and affects frequency
Species Balance: Healthy distribution might be 2-2-2 or 3-2-1, avoid 6-0-0
Timeframe Testing: Match to personal trading style, test thoroughly
Volume Importance: May be more critical for stocks/crypto than forex
MTF Utility: Historically more impactful in trending conditions
Grade Significance: A+ in trend regime historically rare and potentially significant
Risk Parameters: Standard risk management suggests 1-2% per trade maximum
Stop Levels: System stops are pre-calculated, widening may affect reward/risk
THEORETICAL FOUNDATIONS
Genetic Algorithms in Finance:
Traditional Optimization Approaches:
Grid search: Exhaustive but computationally expensive
Gradient descent: Efficient but prone to local optima
Random search: Simple but inefficient
Genetic Algorithm Characteristics:
Explores parameter space through evolutionary process
Balances exploration (mutation) and exploitation (selection)
Mitigates local optima through population diversity
Parallel evaluation via population approach
Inspired by biological evolution principles
Academic Context: Genetic algorithms are studied in computational finance literature for parameter optimization. Effectiveness varies based on problem characteristics and implementation.
Ensemble Methods in Machine Learning:
Single Model Limitations:
May overfit to specific patterns
Can have blind spots in certain conditions
May be brittle to distribution shifts
Ensemble Theoretical Benefits:
Variance reduction through averaging
Robustness through diversity
Improved generalization potential
Widely used (Random Forests, Gradient Boosting, etc.)
Academic Context: Ensemble methods are well-studied in machine learning literature. Performance benefits depend on base model diversity and correlation structure.
Walk-Forward Analysis:
Alternative Approaches:
Simple backtest: Risk of overfitting to full dataset
Single train/test split: Limited validation
Cross-validation: May violate time-series properties
Walk-Forward Characteristics:
Continuous out-of-sample validation
Respects temporal ordering
Attempts to detect strategy degradation
Used in quantitative trading research
Academic Context: Walk-forward analysis is discussed in quantitative finance literature as a robustness check. However, it assumes future regimes will resemble recent test periods, which is not guaranteed.
FINAL EDUCATIONAL SUMMARY
KERS-AGE demonstrates an adaptive systems approach to technical analysis. Rather than fixed rules, it implements:
✓ Evolutionary Optimization: Parameter adaptation through genetic algorithms
✓ Regime Classification: Attempted market condition categorization
✓ Out-of-Sample Testing: Walk-forward validation methodology
✓ Pattern Recognition: Cluster analysis and learning systems
✓ Ensemble Methodology: Collective decision-making framework
✓ Full Transparency: Comprehensive dashboard and metrics
This indicator is an educational tool demonstrating advanced algorithmic concepts.
Critical Reminders:
The system:
✓ Attempts to identify potential reversal patterns
✓ Adapts parameters to changing conditions
✓ Provides multiple filtering mechanisms
✓ Offers detailed performance metrics
Users must understand:
✓ No system guarantees profitable results
✓ Past performance does not predict future results
✓ Extensive testing and validation recommended
✓ Risk management is user's responsibility
✓ Market conditions can change unpredictably
✓ This is educational software, not financial advice
Success in trading requires: Proper education, risk management, discipline, realistic expectations, and personal responsibility for all trading decisions.
For Educational Use
🧬 KERS-AGE Development Team
⚠️ FINAL DISCLAIMER
This indicator and documentation are provided strictly for educational and informational purposes.
NOT FINANCIAL ADVICE: Nothing in this guide constitutes financial advice, investment advice, trading advice, or any recommendation to buy, sell, or hold any security or to engage in any trading strategy.
NO GUARANTEES: No representation is made that any account will or is likely to achieve profits or losses similar to those shown in backtests, examples, or historical data. Past performance is not indicative of future results.
SUBSTANTIAL RISK: Trading stocks, forex, futures, options, and cryptocurrencies involves substantial risk of loss and is not suitable for every investor. The high degree of leverage can work against you as well as for you.
YOUR RESPONSIBILITY: You are solely responsible for your own investment and trading decisions. You should conduct your own research, perform your own analysis, and consult with qualified financial advisors before making any trading decisions.
NO LIABILITY: The developers, contributors, and distributors of this indicator disclaim all liability for any losses or damages, direct or indirect, that may result from use of this indicator or reliance on any information provided.
PAPER TRADE FIRST: Users are strongly encouraged to thoroughly test this indicator in a paper trading environment before risking any real capital.
By using this indicator, you acknowledge that you have read this disclaimer, understand the risks involved in trading, and agree that you are solely responsible for your own trading decisions and their outcomes.
Educational Software Only | Trade at Your Own Risk | Not Financial Advice
Taking you to school. — Dskyz , Trade with insight. Trade with anticipation.
스크립트에서 "profitable"에 대해 찾기

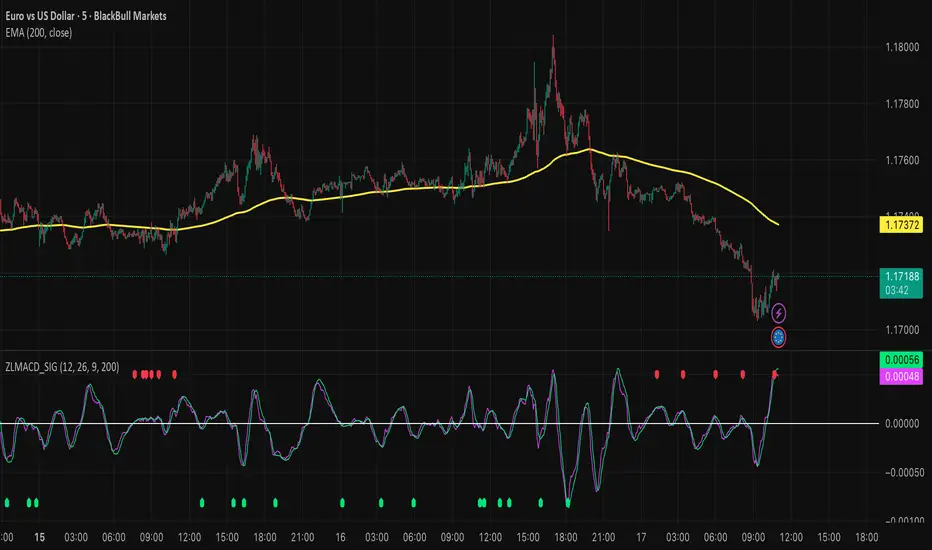
Zero Lag MACD and EMA 200 with SignalsZero Lag MACD with EMA Filter and Smart Signals
This indicator is an enhanced version of the traditional MACD that uses Zero Lag EMA calculations to provide faster and more responsive signals for scalping and day trading.
Key Features:
🎯 Zero Lag Technology - Uses double-smoothed EMA calculations to eliminate lag and provide earlier signals compared to standard MACD
📊 Clean Visualization - Displays histogram with MACD and Signal lines for clear trend analysis
🔍 Smart Signal Logic - Only shows valid trading signals based on strict conditions:
Buy Signal (Green dot at bottom): Triggers when price is above 200 EMA AND MACD crosses Signal line from below AND crossover occurs below zero line
Sell Signal (Red dot at top): Triggers when price is below 200 EMA AND MACD crosses Signal line from above AND crossover occurs above zero line
🔔 Built-in Alerts - Easy alert setup for both buy and sell signals so you never miss a trading opportunity
📈 200 EMA Filter - Incorporates trend filter to avoid counter-trend trades and improve signal quality
⚙️ Fully Customizable - Adjust all parameters:
Fast EMA Length (default: 12)
Slow EMA Length (default: 26)
Signal Length (default: 9)
EMA Filter Length (default: 200)
How to Use:
-Add the indicator to your chart
-Look for green dots (buy signals) when price is in an uptrend above 200 EMA
-Look for red dots (sell signals) when price is in a downtrend below 200 EMA
-Set up alerts by clicking "Create Alert" and selecting "Buy Signal" or "Sell Signal"
-Use signals in conjunction with your trading strategy and risk management
Best Practices:
-Works best on 1-15 minute timeframes for scalping
-Combine with support/resistance levels for confirmation
-Use proper stop-loss and take-profit levels
-Not all signals will be profitable - use proper risk management
-Signals are filtered to reduce noise and false entries
Color Scheme:
Histogram: Red (bearish) / Cyan (bullish)
MACD Line: Fuchsia/Pink
Signal Line: Lime/Green
Buy Signal: Green dot (bottom)
Sell Signal: Red dot (top)
This indicator is perfect for traders who want a cleaner, faster-responding MACD with built-in trend filtering and clear entry signals. Free to use and customize!
Carry Stress Trigger (ZAR)A regime indicator for detecting stress in ZAR carry trades before price moves aggressively
Overview
Carry Stress Trigger (ZAR) is a regime-detection indicator that identifies early warning signals of carry-trade stress in the South African Rand (ZAR).
ZAR is one of the most widely used high-yield carry currencies, but its performance can reverse sharply when:
- Global risk sentiment deteriorates.
- Funding currencies (especially JPY) strengthen.
- Emerging market FX begins to underperform
This indicator combines risk, funding, and EM FX signals into a single Carry Stress Score, helping traders avoid being caught on the wrong side of sudden USDZAR or ZARJPY moves.
Indicator Logic (How It Works)
The model evaluates three independent conditions, each representing a core driver of carry trade behaviour:
Global Risk-Off Signal (VIX)
- Uses the VIX index as a proxy for global risk appetite
- Condition is triggered when:
VIX > its 20-period moving average
This captures rising volatility and risk aversion — a common precursor to EM FX sell-offs.
Funding Stress Signal (JPY Strength)
- JPY is the primary funding currency for global carry trades
- Condition is triggered when:
USDJPY < its 20-period moving average
A strengthening JPY often signals carry unwinds across EM FX.
EM FX Underperformance (ZAR vs USD)
- Measures whether ZAR is underperforming relative to the USD
- Uses a relative ratio:
USDZAR / DXY
The signal triggers when ZAR weakens beyond broad USD strength, isolating ZAR-specific stress rather than general dollar moves.
Carry Stress Score
Each condition contributes 1 point:
Score Regime Interpretation
0–1 Carry Friendly Risk-on environment, carry trades supported
2 Warning Stress building, caution advised
3 Carry Stress High risk of carry unwind / sharp ZAR moves
The score is plotted as a step line and optionally highlighted with background shading when stress rises.
How to Use It
USDZAR Traders
Score 0–1: Trend continuation and carry strategies more reliable
Score ≥ 2: Avoid fading USDZAR upside aggressively
Score = 3: Expect volatility expansion and fast upside spikes
ZARJPY / Carry Baskets
Score ≥ 2: Reduce exposure, tighten stops
Score = 3: Carry trades historically underperform
Risk Management
Use the indicator as a regime filter, not a standalone entry signal
Best combined with:
- Key USDZAR levels (support/resistance)
- SARB / CPI / Fed event weeks
-Volatility-based position sizing
Timeframe Notes
- The Lookback Length applies to the current chart timeframe
- On Daily charts, a length of 20 ≈ 1 trading months
- On Intraday charts, the signals become faster and more tactical
- For macro and swing trading, the Daily timeframe is recommended.
Important Notes
- This indicator is not predictive — it identifies regime conditions
- Carry trades can remain profitable even during early stress
- The strongest signals occur when Score = 3 aligns with key price levels or macro events

Kinetic Scalper [BULLBYTE]KINETIC SCALPER - ADVANCED MOMENTUM & CONFLUENCE TRADING SYSTEM
A SOPHISTICATED MULTI-FACTOR ANALYSIS INDICATOR FOR PRECISION ENTRIES
The Kinetic Scalper is a comprehensive trading analysis tool that combines volume-weighted momentum calculations, multi-oscillator divergence detection, and a proprietary 15-factor confluence scoring system to identify high-probability reversal setups across all timeframes.
WHAT MAKES THIS INDICATOR ORIGINAL
This is NOT a simple mashup of existing indicators.
The Kinetic Scalper features a completely custom momentum engine called the "Kinetic Pulse" - a volume-weighted momentum oscillator with Fisher Transform normalization that fundamentally differs from standard RSI or other momentum indicators. Every component feeds into a unified algorithmic framework designed specifically for this system.
KEY INNOVATIONS:
KINETIC PULSE ENGINE
Unlike standard RSI which uses simple price changes, the Kinetic Pulse applies:
→ Volume weighting to price movements (high-volume moves carry more weight)
→ EMA smoothing instead of traditional SMA (faster response to changes)
→ Fisher Transform normalization for improved signal clarity
→ Adaptive period adjustment based on current volatility regime
→ Result: A momentum oscillator that responds to conviction, not just price noise
15-FACTOR CONFLUENCE SCORING SYSTEM
Every signal is graded based on the number of confirming factors present:
→ Momentum position (oversold/overbought extremes)
→ Momentum velocity (direction change confirmation)
→ Momentum acceleration (strength of reversal)
→ Multi-oscillator divergence (price vs. 3 oscillators)
→ Volume confirmation (above-average participation)
→ Volume delta analysis (buying vs. selling pressure)
→ Higher timeframe alignment (trend confirmation from larger timeframe)
→ Session timing (major forex session awareness)
→ Structure clearance (clear path to profit targets)
→ Support/resistance proximity (confluence with key levels)
→ Market regime filtering (trending vs. choppy conditions)
Signals are graded A+, A, or B based on how many factors align:
• CONSERVATIVE MODE: A+ requires 12+ factors, A requires 9+, B requires 7+
• BALANCED MODE: A+ requires 10+ factors, A requires 7+, B requires 5+
• AGGRESSIVE MODE: A+ requires 8+ factors, A requires 5+, B requires 3+
TRADE ANALYSIS STATE MACHINE
A sophisticated monitoring system that tracks trade conditions in real-time using:
→ 5-state analysis framework (Factors Aligned / Positive Bias / Mixed Signals / Factors Weakening / Negative Bias)
→ Hysteresis-based transitions (different thresholds to enter vs. exit states)
→ Confidence smoothing with EMA (reduces noise, prevents flip-flopping)
→ Minimum commitment periods before state changes
→ Override logic for significant events (near TP/SL, momentum reversals)
→ Result: Stable, actionable guidance that doesn't change on every bar
INSTRUMENT-AWARE CALIBRATION
Automatically detects what you're trading and applies optimized parameters:
→ Forex Majors: Standard ATR, high session weight
→ Forex Crosses: Tighter stops, moderate session weight
→ Crypto: Wider stops (1.8x multiplier), reduced session weight (24/7 markets)
→ Indices: Moderate-wide stops, high session weight
→ Commodities: Moderate stops, moderate session weight
WHAT THIS INDICATOR DOES
The Kinetic Scalper is designed to identify high-confluence reversal opportunities by analyzing multiple dimensions of market behavior simultaneously.
CORE FUNCTIONS:
1. SIGNAL GENERATION
→ Identifies potential reversal points at oversold/overbought extremes
→ Confirms with multi-oscillator divergence detection
→ Validates with volume, higher timeframe, and structural analysis
→ Filters out low-probability setups automatically
→ Grades signals based on total confluence factors present
2. AUTOMATED TRADE TRACKING
→ Calculates structure-based or ATR-based stop loss levels
→ Projects take profit targets using risk-to-reward ratios
→ Monitors live position status (P/L, distance to targets, R-multiple)
→ Tracks TP1 and TP2 hits automatically
→ Displays outcome markers (TP HIT, PARTIAL WIN, STOPPED)
3. REAL-TIME CONDITION MONITORING
→ Analyzes 6 factor categories during active trades
→ Provides confidence scoring (0-100 scale)
→ Generates actionable guidance based on current market state
→ Alerts when conditions deteriorate or improve
→ Helps with trade management decisions
4. COMPREHENSIVE MARKET ANALYSIS
→ Session detection (Asian, London, New York, Overlap)
→ Volatility regime identification (Low, Normal, High, Extreme)
→ Trend state classification (Trending Up/Down, Ranging, Transitioning)
→ Volume analysis (relative volume and delta approximation)
→ Choppiness filtering (blocks signals in ranging markets)
WHY USE THIS INDICATOR
PROBLEM: Most momentum indicators generate too many false signals at extremes.
SOLUTION: The Kinetic Scalper requires MULTIPLE confirming factors before generating a signal, dramatically reducing noise and focusing on high-confluence setups.
ADVANTAGES:
✓ QUALITY OVER QUANTITY
→ Signal grading ensures you can filter for only the highest-quality setups
→ A+ signals have 10-12+ confirming factors aligned
→ Cooldown periods prevent over-trading the same move
✓ COMPLETE TRADE FRAMEWORK
→ Entry signals with confluence justification
→ Calculated stop loss based on market structure or ATR
→ Two profit targets with clear risk-to-reward ratios
→ Live trade monitoring with factor analysis
→ Outcome tracking and visual markers
✓ ADAPTIVE TO MARKET CONDITIONS
→ Volatility-based period adjustment for momentum calculations
→ Instrument-specific ATR multipliers
→ Session awareness for forex traders
→ Higher timeframe trend filtering
→ Automatic regime detection (trending vs. choppy)
✓ TRANSPARENT METHODOLOGY
→ Every input has detailed tooltips explaining its purpose
→ Signal tooltips show exactly why a signal was generated
→ Dashboard displays all relevant market conditions
→ Factor scores are visible during trades
→ No "black box" mystery calculations
✓ NON-REPAINTING & RELIABLE
→ All signals use barstate.isconfirmed (only on closed bars)
→ Higher timeframe data uses lookahead_off with historical offset
→ No future data access or repainting behavior
→ What you see is what you get - signals don't disappear or move
HOW THE INDICATOR WORKS
SIGNAL GENERATION PROCESS:
STEP 1: MOMENTUM ANALYSIS
The Kinetic Pulse engine calculates volume-weighted momentum:
→ Price changes are weighted by volume ratio vs. 20-bar average
→ High-volume moves have more influence on the oscillator
→ Gains and losses are smoothed using EMA (not SMA like RSI)
→ Fisher Transform is applied for normalization to 0-100 scale
→ Result: Momentum reading that emphasizes conviction, not noise
STEP 2: REVERSAL DETECTION
The indicator looks for potential reversal conditions:
→ Kinetic Pulse reaching oversold zone (below dynamic lower threshold)
→ Momentum velocity turning positive after being negative (for longs)
→ OR bullish divergence detected on multiple oscillators
→ Price making lower lows while oscillators make higher lows = divergence
STEP 3: MULTI-OSCILLATOR DIVERGENCE CONFIRMATION
Divergence is validated across three sources:
→ Kinetic Pulse divergence
→ CCI divergence
→ Stochastic divergence
→ Multiple oscillators confirming divergence increases signal reliability
STEP 4: CONFLUENCE FACTOR SCORING
The system evaluates all 15 possible confirming factors:
→ Momentum position: Is pulse oversold/overbought? (+0 to +2 points)
→ Momentum direction: Is velocity reversing? (+0 to +2 points)
→ Momentum acceleration: Is reversal strengthening? (+0 to +1 point)
→ Divergence count: How many oscillators show divergence? (+0 to +2 points)
→ Volume strength: Is volume above 1.3x average? (+0 to +1 point)
→ Volume delta: Is cumulative delta positive/negative? (+0 to +1 point)
→ HTF alignment: Does higher timeframe support direction? (+0 to +2 points)
→ Session timing: Is it a prime trading session? (+0 to +1 point)
→ Clear air: Is path to targets clear of obstacles? (+0 to +1 point)
→ Structure confluence: Are we near support/resistance? (+0 to +1 point)
→ Market regime: Is market trending, not choppy? (+0 to +1 point)
Total possible score: 15 points
Minimum for signal: 3-12 points depending on sensitivity mode
STEP 5: FILTER VALIDATION
Before generating a signal, additional checks are performed:
→ Volume must be above minimum threshold (if filter enabled)
→ Higher timeframe must not oppose the signal direction (if filter enabled)
→ Target path must be clear of major resistance/support (if filter enabled)
→ Volatility must not be EXTREME (blocks signals in chaos)
→ Risk-to-reward ratio must meet minimum requirement
→ Cooldown period must have elapsed since last signal
STEP 6: SIGNAL GRADING
If all filters pass, the signal is graded based on score:
→ A+ Grade: Highest confluence (8-12+ factors depending on sensitivity)
→ A Grade: High confluence (5-9+ factors)
→ B Grade: Moderate confluence (3-7+ factors)
Only graded signals (A+, A, or B) are displayed.
STEP 7: TRADE LEVEL CALCULATION
Stop loss and targets are calculated automatically:
STOP LOSS METHODS:
• Structure-Based: Uses recent swing low/high with ATR buffer, constrained by min/max ATR limits
• ATR-Based: Pure ATR multiplier with min/max constraints
• Fixed ATR: Simple ATR multiplier, no adjustments
TARGET CALCULATION:
• TP1: Entry ± (Stop Distance × Target 1 R:R)
• TP2: Entry ± (Stop Distance × Target 2 R:R)
• Default: TP1 at 1.0 R:R (1:1), TP2 at 2.0 R:R (1:2)
STEP 8: TRADE MONITORING
Once a signal is taken, the indicator tracks:
→ Current P/L in ticks and R-multiples
→ Distance to each target in ATR units
→ Distance to stop loss in ATR units
→ TP1 hit detection (marks with label, updates lines)
→ TP2 hit detection (closes trade, marks outcome)
→ Stop loss hit detection (closes trade, differentiates partial vs. full loss)
STEP 9: FACTOR ANALYSIS (DURING TRADES)
The Trade Analysis Panel monitors 6 key factor categories:
→ Momentum: Is momentum still aligned with trade direction? (-15 to +15 pts)
→ Position: Current R-multiple position (-12 to +12 pts)
→ Volume: Is volume still supportive? (-6 to +6 pts)
→ HTF Alignment: Does HTF still support trade? (-6 to +8 pts)
→ Target Proximity: How close are we to targets? (0 to +10 pts)
→ Stop Proximity: Are we dangerously close to stop? (-15 to +3 pts)
Raw scores are summed and smoothed using 5-bar EMA to create Confidence Score (0-100).
STEP 10: STATE MACHINE TRANSITIONS
Based on smoothed confidence, the system transitions between 5 states:
→ FACTORS ALIGNED (72+): Everything looks good
→ POSITIVE BIAS (58-72): Conditions favorable
→ MIXED SIGNALS (48-58): Neutral conditions
→ FACTORS WEAKENING (22-48): Concerning signals
→ NEGATIVE BIAS (<22): Poor conditions
Hysteresis prevents rapid flipping between states (different entry/exit thresholds).
RECOMMENDED TIMEFRAMES & INSTRUMENTS
TIMEFRAME VERSATILITY:
Despite the name "Scalper," this indicator works on ALL timeframes:
✓ LOWER TIMEFRAMES (1m - 15m)
→ Ideal for: Scalping and very short-term trades
→ Expect: More signals, faster trades, requires active monitoring
→ Best for: Forex majors, liquid crypto pairs
→ Tip: Use Conservative sensitivity to reduce noise
✓ MID TIMEFRAMES (15m - 1H)
→ Ideal for: Intraday trading and day trading
→ Expect: Moderate signal frequency, 1-4 hour trade duration
→ Best for: Forex, indices, major crypto
→ Tip: Balanced sensitivity works well here
✓ HIGHER TIMEFRAMES (4H - Daily)
→ Ideal for: Swing trading and position trading
→ Expect: Fewer signals, higher-quality setups, multi-day trades
→ Best for: All instruments
→ Tip: Can use Aggressive sensitivity for more opportunities
INSTRUMENT COMPATIBILITY:
✓ FOREX MAJORS (EUR/USD, GBP/USD, USD/JPY, etc.)
→ Auto-detected or manually select "Forex Major"
→ Session filtering is highly valuable here
→ London/NY overlap generates best signals
✓ FOREX CROSSES (EUR/GBP, AUD/NZD, etc.)
→ Auto-detected or manually select "Forex Cross"
→ Slightly tighter stops applied automatically
→ Session weight reduced vs. majors
✓ CRYPTOCURRENCIES (BTC, ETH, SOL, etc.)
→ Auto-detected or manually select "Crypto"
→ Wider stops (1.8x multiplier) due to volatility
→ Session filtering less relevant (24/7 markets)
→ Works well on both spot and perpetual futures
✓ INDICES (S&P 500, NASDAQ, DAX, etc.)
→ Auto-detected or manually select "Index"
→ Session opens (NY, London) are important
→ Moderate stop widths applied
✓ COMMODITIES (Gold, Silver, Oil, etc.)
→ Auto-detected or manually select "Commodity"
→ Moderate stops and session awareness
→ Works well on both spot and futures
VISUAL ELEMENTS EXPLAINED
SIGNAL MARKERS:
The indicator offers 3 display styles (choose in settings):
• PREMIUM STYLE (Default)
→ Signal appears below/above candles with connecting line
→ Background panel with grade badge (LONG , SHORT , etc.)
→ Entry price displayed
→ Direction arrow pointing to entry candle
→ Most informative, best for detailed analysis
• MINIMAL STYLE
→ Simple dot marker with grade text next to it
→ Clean, unobtrusive design
→ Best for mobile devices or cluttered charts
→ Less visual noise
• CLASSIC STYLE
→ Diamond marker with grade badge below/above
→ Traditional indicator aesthetic
→ Good balance between info and simplicity
ALL STYLES INCLUDE:
→ Signal tooltips with complete trade plan details
→ Grade display (A+, A, or B)
→ Color coding (bright colors for A+, standard for A/B)
SIGNAL TOOLTIP CONTENTS:
When you hover over any signal marker, you'll see:
→ Signal direction and grade
→ Confluence score (actual points vs. required)
→ Reason for signal (divergence type, reversal pattern)
→ Complete trade plan (Entry, Stop, TP1, TP2)
→ Risk in ticks
→ Risk-to-reward ratios
→ Market conditions at signal (Pulse value, HTF status, Volume, Session)
TRADE LEVEL LINES:
When Trade Tracking is enabled:
• ENTRY LINE (Yellow/Gold)
→ Solid horizontal line at entry price
→ Shaded zone around entry (±ATR buffer)
→ Label showing entry price
→ Extends 20-25 bars into future
• STOP LOSS LINE (Orange/Red)
→ Dashed line at stop level
→ Label showing stop price and distance in ticks
→ Turns dotted and changes color after TP1 hit (breakeven implied)
→ Deleted when trade closes
• TAKE PROFIT 1 LINE (Blue)
→ Dotted line at TP1 level
→ Label showing price and R:R ratio (e.g., "1:1.0")
→ Turns solid and changes to green when hit
→ Deleted after TP1 hit
• TAKE PROFIT 2 LINE (Blue)
→ Solid line at TP2 level
→ Label showing price and R:R ratio (e.g., "1:2.0")
→ This is the "full win" target
→ Deleted when trade closes
OUTCOME MARKERS:
When trade milestones are reached:
• - Green label appears when first target is touched
• - Green label when second target is touched (trade complete)
• - Red label if stop loss hit before any target
• - Orange label if TP1 hit but then stopped out
PREVIOUS DAY LEVELS:
If enabled (Show Previous Day Levels):
• PDH (Previous Day High) - Solid red/orange line
→ Label shows "PDH: "
→ Useful resistance reference for intraday trading
• PDL (Previous Day Low) - Solid green line
→ Label shows "PDL: "
→ Useful support reference for intraday trading
BACKGROUND TINTS:
Subtle background colors indicate states:
→ Light green tint: Active long position being tracked
→ Light red tint: Active short position being tracked
→ Light orange tint: Extreme volatility warning (signals blocked)
DASHBOARD GUIDE
The indicator features TWO dashboard panels:
━━━━━━━━━━━━━━━━━━━━━━━━━━━━━━━━━━━━━━━━━━━━━━━━━━━━━━━━━━━━━━━━━━━━━━━━━━━━━
MAIN DASHBOARD (Top Right by default)
━━━━━━━━━━━━━━━━━━━━━━━━━━━━━━━━━━━━━━━━━━━━━━━━━━━━━━━━━━━━━━━━━━━━━━━━━━━━━
WHEN NO TRADE IS ACTIVE:
→ Bias: Current market bias (BULLISH, BEARISH, NEUTRAL, LEAN LONG/SHORT)
→ Based on Kinetic Pulse position and velocity
→ Helps you understand overall momentum direction
→ Pulse: Current Kinetic Pulse value (0-100 scale)
→ <30 = Oversold (potential long setups developing)
→ >70 = Overbought (potential short setups developing)
→ 40-60 = Neutral zone
→ Volatility: Current volatility regime (LOW, NORMAL, HIGH, EXTREME)
→ Calculated from ATR ratio vs. 100-period average
→ EXTREME volatility blocks all signals (too chaotic)
→ Trend: Market state classification
→ TREND UP / TREND DOWN: ADX > 25, directional movement clear
→ RANGING: ADX < 20, choppy conditions
→ TRANSITIONING: ADX 20-25, developing conditions
→ VOLATILE: Extreme ATR regime
→ Session: Current forex session
→ ASIAN (00:00-08:00 UTC)
→ LONDON (07:00-16:00 UTC)
→ NEW YORK (13:00-22:00 UTC)
→ LDN/NY (13:00-16:00 UTC) - Overlap period, highest volatility
→ OFF-HOURS: Outside major sessions
→ Volume: Current volume vs. 20-bar average
→ Displayed as multiplier (e.g., "1.45x" = 45% above average)
→ Green if >1.3x (high volume, bullish for signal quality)
→ Red if <0.8x (low volume, bearish for signal quality)
→ HTF: Higher timeframe analysis status
→ BULLISH: HTF momentum supports longs
→ BEARISH: HTF momentum supports shorts
→ NEUTRAL: No clear HTF direction
→ Best Score: Highest confluence score currently available
→ Shows both long and short scores
→ Format: " / "
→ Example: "8/7 " means long score is 8, threshold is 7, long is leading
→ Helps you anticipate which direction might signal next
→ PDH/PDL: Previous day high and low prices
→ Quick reference for intraday support/resistance
WHEN TRADE IS ACTIVE:
→ Trade: Direction and grade (e.g., "LONG ")
→ Entry: Entry price of current trade
→ P/L: Current profit/loss
→ Shown in ticks and R-multiples
→ Format: "+45 | +0.75R" or "-20 | -0.35R"
→ Green when positive, red when negative
→ TP1: First target status
→ Shows price and distance if not hit
→ Shows "HIT" in green if reached
→ TP2: Second target price and distance
→ Stop: Stop loss price and current distance from stop
→ Bars: Number of bars since entry (trade duration)
━━━━━━━━━━━━━━━━━━━━━━━━━━━━━━━━━━━━━━━━━━━━━━━━━━━━━━━━━━━━━━━━━━━━━━━━━━━━━
TRADE ANALYSIS PANEL (Bottom Left by default)
━━━━━━━━━━━━━━━━━━━━━━━━━━━━━━━━━━━━━━━━━━━━━━━━━━━━━━━━━━━━━━━━━━━━━━━━━━━━━
This panel provides algorithmic analysis of market conditions. It does NOT provide investment advice or recommendations.
WHEN NO TRADE IS ACTIVE:
Shows scanning status and signal readiness:
→ Long/Short Readiness Gauges
→ Visual bar showing proximity to signal threshold
→ Score display (e.g., "8/7" means 8 points scored, 7 needed)
→ "RDY" indicator when threshold reached
→ Status Messages
→ "Scanning for setups..." - Normal scanning mode
→ "Long setup ready - cooldown: X bars" - Signal qualified but in cooldown
→ "Oversold conditions - watch for reversal" - Setup developing
→ "Choppy conditions detected" - Warning about market state
→ "Extreme volatility - signals blocked" - Safety filter active
WHEN TRADE IS ACTIVE:
Header shows current analysis state:
→ FACTORS ALIGNED (Green) - Everything looks good, confidence 72+
→ POSITIVE BIAS (Light Green) - Conditions favorable, confidence 58-72
→ MIXED SIGNALS (Blue) - Neutral conditions, confidence 48-58
→ FACTORS WEAKENING (Orange) - Concerning signals, confidence 22-48
→ NEGATIVE BIAS (Red) - Poor conditions, confidence <22
Confidence Score:
→ Displayed as percentage (0-100%)
→ Visual gauge (|||||.....)
→ Trend indicator (Rising, Falling, Stable)
→ Shows momentum of confidence change
Factor Breakdown (if enabled):
Shows 6 factor categories with individual scores:
→ Momentum: Is momentum aligned with trade? (-15 to +15 points)
→ Positive if velocity matches trade direction
→ Negative if momentum opposes trade
→ Position: Current R-multiple analysis (-12 to +12 points)
→ Positive if trade is in profit
→ Negative if underwater
→ Score increases as profit grows
→ Volume: Is volume supportive? (-6 to +6 points)
→ Positive if volume above average
→ Negative if volume weak
→ HTF Align: Higher timeframe status (-6 to +8 points)
→ Positive if HTF still supports trade direction
→ Negative if HTF turned against trade
→ Target: Proximity to profit targets (0 to +10 points)
→ Higher score when approaching targets
→ Bonus if TP1 already hit and near TP2
→ Stop Dist: Distance from stop loss (-15 to +3 points)
→ Negative if dangerously close to stop (<0.3 ATR)
→ Positive if well away from stop (>1.5 ATR)
Each factor shows:
• Score value with +/- indicator
• Trend symbol: + (improving), - (deteriorating), = (stable)
• Visual gauge
Guidance Messages:
→ "TARGET 2 APPROACHING" - TP2 within 0.3 ATR
→ "TARGET 1 APPROACHING" - TP1 within 0.3 ATR
→ "STOP PROXIMITY WARNING" - Stop within 0.3 ATR
→ "Factors aligned - Holding" - Positive state, stay in trade
→ "Conditions favorable" - Still looking good
→ "Conditions mixed - " - Neutral assessment
→ "Factors deteriorating" - Warning of weakening setup
→ "Confluence weakening - secure gains" - Consider exit if profitable
COMPACT MODE (Mobile-Friendly):
→ Reduces panel size by showing only essential info
→ Factor icons instead of full breakdowns
→ Simplified guidance messages
→ Perfect for smaller screens
SETTINGS GUIDE
MASTER SETTINGS:
Instrument Type
→ Purpose: Optimizes ATR multipliers and session weights for your asset
→ Options: Auto-Detect (recommended), Forex Major, Forex Cross, Crypto, Index, Commodity
→ Default: Auto-Detect
→ When to change: If auto-detection is incorrect for your symbol
Signal Sensitivity
→ Purpose: Controls how many factors required before generating signals
→ Options:
• Conservative: Requires 12+ for A+, 9+ for A, 7+ for B (fewer, highest quality)
• Balanced: Requires 10+ for A+, 7+ for A, 5+ for B (recommended)
• Aggressive: Requires 8+ for A+, 5+ for A, 3+ for B (more frequent)
→ Default: Balanced
→ When to change: If you want fewer signals (Conservative) or more opportunities (Aggressive)
Enable Trade Signals
→ Purpose: Master on/off switch for signal generation
→ Default: ON
→ When to disable: If you only want to use the analysis dashboards without signals
Enable Trade Tracking
→ Purpose: Tracks active trades and monitors conditions until TP/SL hit
→ Default: ON
→ When to disable: If you manage trades manually and don't want automatic tracking
Show Entry/Stop/Target Levels
→ Purpose: Displays trade plan lines and labels on chart
→ Default: ON
→ When to disable: If you prefer clean charts or manage levels yourself
DISPLAY SETTINGS:
Color Theme
→ Purpose: Optimizes colors for your chart background
→ Options: Dark (for dark charts), Light (for light charts)
→ Default: Dark
Signal Display Style
→ Purpose: Visual style of signal markers
→ Options:
• Premium: Badge with line and background panel (most detailed)
• Minimal: Simple dot with grade text (cleanest)
• Classic: Diamond marker with badge (traditional)
→ Default: Premium
Signal Distance
→ Purpose: How far signal labels appear from price bars (in ATR units)
→ Range: 0.5 to 10.0
→ Default: 2.0
→ When to adjust: Increase to 3.0-4.0 if signals hide behind candle wicks
TP/SL Label Distance
→ Purpose: Spacing of price labels to prevent overlap
→ Range: 0.5 to 5.0
→ Default: 1.5
Show Previous Day Levels
→ Purpose: Display PDH/PDL reference lines
→ Default: ON
→ Best for: Intraday traders who respect previous day levels
MAIN DASHBOARD:
Show Main Dashboard
→ Purpose: Toggle visibility of market conditions table
→ Default: ON
Main Dashboard Position
→ Options: Top Right, Top Left, Bottom Right, Bottom Left
→ Default: Top Right
→ When to change: To avoid overlap with TradingView's built-in panels
TRADE ANALYSIS PANEL:
Show Trade Analysis Panel
→ Purpose: Toggle factor analysis dashboard
→ Default: ON
Analysis Panel Position
→ Options: Top Right, Top Left, Bottom Right, Bottom Left, Middle Right, Middle Left
→ Default: Bottom Left
→ Recommended: Bottom Right or Middle Right to avoid overlap with Main Dashboard
Compact Mode
→ Purpose: Reduces panel size for mobile or smaller screens
→ Default: OFF
→ When to enable: Mobile trading, small screens, or minimalist preference
Show Factor Details
→ Purpose: Displays individual factor scores vs. overall confidence only
→ Default: ON
→ When to disable: For more compact view showing only state and confidence
RISK MANAGEMENT:
Stop Loss Method
→ Purpose: How stop loss distance is calculated
→ Options:
• Structure-Based: Uses swing highs/lows with ATR buffer (recommended)
• ATR-Based: Pure ATR multiplier with min/max constraints
• Fixed ATR: Simple multiplier, no adjustments
→ Default: Structure-Based
→ Impact: Structure-Based respects market geometry but constrains within safe limits
ATR Stop Multiplier
→ Purpose: Multiplier for ATR-based stop calculation
→ Range: 0.5 to 3.0
→ Default: 1.5
→ When to adjust:
• Increase to 2.0-2.5 for more breathing room (fewer false stops)
• Decrease to 1.0-1.2 for tighter stops (but more stop-outs)
Maximum Stop Distance (ATR)
→ Purpose: Cap on stop width to prevent excessive risk
→ Range: 1.0 to 5.0
→ Default: 2.5
→ Impact: If structure-based stop exceeds this, ATR-based stop is used instead
Minimum Stop Distance (ATR)
→ Purpose: Floor on stop width to avoid noise-induced stops
→ Range: 0.2 to 1.0
→ Default: 0.5
→ Impact: Prevents stops too tight to survive normal volatility
Target 1 Risk/Reward Ratio
→ Purpose: R:R for first profit target
→ Range: 0.5 to 2.0
→ Default: 1.0 (1:1 ratio)
→ Common values: 1.0 for quick profit taking, 1.5 for patient trading
Target 2 Risk/Reward Ratio
→ Purpose: R:R for second profit target (full win)
→ Range: 1.0 to 4.0
→ Default: 2.0 (1:2 ratio)
→ Common values: 2.0-3.0 for balanced risk/reward
Minimum R:R Required
→ Purpose: Filters out signals with poor risk/reward
→ Range: 0.5 to 2.0
→ Default: 1.0
→ Impact: Signals where potential reward doesn't meet this ratio are rejected
→ WARNING: Always ensure your position sizing means a stop loss = no more than 1-2% of your account, regardless of R:R ratio
SIGNAL FILTERS:
Session Awareness
→ Purpose: Weights signals higher during major forex sessions
→ Default: ON
→ Impact: Doesn't block signals, but session quality factors into scoring
→ Best for: Forex traders
Session Timezone
→ Purpose: Timezone for session calculations
→ Options: UTC, America/New_York, Europe/London, Asia/Tokyo, Asia/Hong_Kong
→ Default: UTC
→ When to change: Match your broker's server time
Higher Timeframe Alignment
→ Purpose: Checks HTF momentum before generating signals
→ Default: ON
→ Impact: Filters counter-trend signals, improves quality
→ Recommended: Keep enabled
HTF Timeframe
→ Purpose: Which higher timeframe to check
→ Default: Auto (blank field)
→ Auto selection:
• 1m chart → 5m HTF
• 5m chart → 15m HTF
• 15m chart → 1H HTF
• 1H chart → 4H HTF
• 4H+ chart → Daily HTF
→ Manual override: Enter any timeframe (e.g., "60" for 1-hour)
Volume Confirmation
→ Purpose: Requires above-average volume for signals
→ Default: ON
→ Impact: Filters low-liquidity false signals
→ Recommended: Keep enabled
Minimum Volume Ratio
→ Purpose: Volume threshold vs. 20-bar average
→ Range: 0.3 to 2.0
→ Default: 0.8 (80% of average)
→ When to adjust:
• Increase to 1.2-1.5 for only high-volume signals
• Decrease to 0.5-0.7 for more permissive filtering
Structure Clearance Check
→ Purpose: Ensures clear path to targets (no nearby resistance/support)
→ Default: ON
→ Impact: Prevents trades with immediate obstacles
→ Recommended: Keep enabled
Minimum Bars Between Signals
→ Purpose: Cooldown period after each signal
→ Range: 1 to 10
→ Default: 3
→ Impact: After a signal, this many bars must pass before another in same direction
→ When to adjust:
• Increase to 5-7 to prevent over-trading
• Decrease to 1-2 for faster re-entries
ADVANCED TUNING:
Momentum Period
→ Purpose: Base period for Kinetic Pulse calculation
→ Range: 5 to 30
→ Default: 14
→ When to adjust:
• Lower (8-10): More responsive, noisier
• Higher (18-21): Smoother, slower to react
→ Note: If Adaptive Period enabled, this is adjusted automatically
Adaptive Period
→ Purpose: Auto-adjusts momentum period based on volatility
→ Default: ON
→ Impact: Shortens period in high volatility, lengthens in low volatility
→ Recommended: Keep enabled for automatic optimization
Divergence Lookback
→ Purpose: How far back to search for divergence patterns
→ Range: 10 to 60
→ Default: 30
→ When to adjust:
• Shorter (15-20): Only recent divergences
• Longer (40-50): Catches older divergences (may be less relevant)
Swing Detection Bars
→ Purpose: Bars required on each side to confirm swing high/low
→ Range: 2 to 7
→ Default: 3
→ Impact on stops:
• Lower (2-3): More swing points, potentially tighter stops
• Higher (5-7): Only major swings, wider stops
Choppiness Index Threshold
→ Purpose: Threshold above which market considered choppy
→ Range: 38.2 to 80.0
→ Default: 61.8
→ Impact:
• Lower (50-55): Stricter quality filter (fewer signals in ranging markets)
• Higher (65-70): More permissive (allows signals in choppier conditions)
HOW TO READ SIGNALS
SIGNAL ANATOMY:
When a signal appears, you'll see:
1. DIRECTIONAL MARKER
→ Arrow, dot, or diamond pointing to entry candle (depends on style)
→ Positioned below price for LONG, above price for SHORT
→ Connected to price with line (Premium style)
2. GRADE BADGE
→ Displays signal quality: LONG , SHORT , etc.
→ Color coding:
• Bright green/cyan for A+ longs
• Standard green for A/B longs
• Bright pink/magenta for A+ shorts
• Standard red for A/B shorts
3. ENTRY PRICE (Premium style only)
→ Shows exact entry price at signal generation
4. TOOLTIP (all styles)
→ Hover over signal to see complete trade plan
→ Includes: Entry, Stop, TP1, TP2, Risk, R:R ratios, market conditions, signal reason, confluence score
INTERPRETING GRADES:
→ A+ SIGNALS (Highest Quality)
• 8-12+ confirming factors aligned
• Multiple divergences OR strong momentum reversal
• HTF alignment + volume + session timing + clear structure
• These are your highest-probability setups
• Recommended action: Give these priority, consider larger position size
→ A SIGNALS (High Quality)
• 5-9+ confirming factors aligned
• Good confluence, most key factors present
• Missing 1-2 optimal conditions
• These are still quality trades
• Recommended action: Standard position size, solid setups
→ B SIGNALS (Moderate Quality)
• 3-7+ confirming factors aligned
• Minimum viable confluence
• May be missing HTF alignment, volume, or session timing
• Higher variance outcomes
• Recommended action: Smaller position size or skip if conservative
SIGNAL NARRATIVE:
Each signal tooltip includes a narrative explaining WHY it was generated:
→ "Multi-divergence at oversold extreme"
• Multiple oscillators showing bullish divergence
• Kinetic Pulse in oversold zone
• High-quality reversal setup
→ "Bullish divergence near support"
• Divergence detected
• Price near key support level (swing low or PDL)
• Structure confluence
→ "Momentum reversal with HTF alignment"
• Kinetic Pulse velocity reversing
• Higher timeframe supports direction
• Strong trend-following setup
→ "Oversold momentum reversal"
• Extreme Kinetic Pulse reading reversing
• May not have divergence but strong momentum shift
READING THE TRADE PLAN:
Every signal comes with a complete trade plan:
→ ENTRY: The close price of the signal candle
• This is where the signal triggered
• If using limit orders, you might improve on this price
→ STOP: Calculated stop loss level
• Based on your Stop Loss Method setting
• Distance shown in ticks
• Risk tolerance: Ensure this represents ≤1-2% of your account
→ TP1: First profit target
• Default: 1:1 risk-reward
• This is your partial profit or first exit
• Consider taking 50% off at TP1
→ TP2: Second profit target
• Default: 1:2 risk-reward
• This is your "full win" target
• Hold remaining position for this level
SIGNAL FREQUENCY EXPECTATIONS:
Frequency varies by timeframe, sensitivity, and market conditions:
→ AGGRESSIVE MODE
• Lower timeframes (1m-5m): 5-15 signals per day
• Mid timeframes (15m-1H): 2-5 signals per day
• Higher timeframes (4H-D): 1-3 signals per week
→ BALANCED MODE (Default)
• Lower timeframes: 3-8 signals per day
• Mid timeframes: 1-3 signals per day
• Higher timeframes: 2-5 signals per week
→ CONSERVATIVE MODE
• Lower timeframes: 1-4 signals per day
• Mid timeframes: 0-2 signals per day
• Higher timeframes: 1-3 signals per week
Note: Frequency also depends on market volatility and trending vs. ranging conditions.
Example - Kinetic Scalper Trade Sequence
Here's an example showing the complete trade lifecycle with all dashboard transitions, annotations, and descriptions.
INSTRUMENT & TIMEFRAME DETAILS
Symbol: Nifty 50 Index (NSE)
Date: December 15, 2025
Session: London session (active trading hours)
Instrument Type: Index (auto-detected)
TRADE SEQUENCE BREAKDOWN
SCREENSHOT 1: Pre-Signal Setup Building (Image 1)
Time: ~12:00-14:30 UTC+5:30(approx.)
Price Action: Uptrend showing signs of exhaustion near 26,200
Market State: Price at session highs
Main Dashboard (Top Right):
- Bias: LEAN SHORT
- Pulse: 58.9 (approaching overbought)
- Volatility: NORMAL
- Trend: TRANSITIONING
- Session: LONDON (favorable timing)
- Volume: 0.98x (slightly below average)
- HTF: BULLISH (caution for counter-trend)
- Best Score: 9/5 (Short score building)
- PDH/PDL: 26098.25 / 25938.95
Trade Analysis Panel (Bottom Left):
- Status: NO ACTIVE TRADE
- Long Score: 5/5 (RDY)
- Short Score: 9/5 (RDY)
- Panel Message: "Short pattern developing - score: 9"
Description :
Setup Development Phase: The indicator identifies a potential short opportunity as price reaches the previous day's high. The short confluence score has climbed to 9/15 points, meeting the 'Balanced' sensitivity threshold for a Grade B signal. Notice the 'LEAN SHORT' bias and the Kinetic Pulse reading of 58.9 approaching overbought territory. The Trade Analysis panel shows 'Short pattern developing' with 9/5 factors aligned. Key factors: momentum approaching reversal zone, price at resistance (PDH), and London session providing favorable conditions.
SCREENSHOT 2: Signal Generated & Trade Entered (Image 2)
Time: ~13:00 UTC+5:30 (signal bar)
Entry Price: 26,184.65
Signal Grade: Grade
Main Dashboard (Top Right):
- Trade: SHORT
- Entry: 26184.65
- P/L: 5.95 pts | +0.2R (early positive movement)
- TP1: 26157.00 (33.2 pts away)
- TP2: 26129.35 (60.84 pts away)
- Stop: 26212.30 (22.1 pts away)
- Bars: 1 (just entered)
Trade Analysis Panel (Bottom Left):
- Header: TRADE ANALYSIS
- Status Bar: "Conditions mixed - improving 57%"
- Confidence: 57% RISING
- Factor Breakdown:
- Momentum: -4 (velocity not yet aligned)
- Position: +4 (slight profit)
- Volume: +2 = (volume present)
- HTF Align: +2 = (not strongly aligned)
- Target: +0 - (far from TP)
- Stop Dist: +3 - (good distance)
- Bottom Status: "Conditions mixed - Monitoring"
- Disclaimer: "Analysis only - Not financial advice"
Description:
Signal Activation: A Grade A short signal triggers at 26,184.65 after the short confluence score reached qualifying levels. The indicator places a structure-based stop loss at 26,212.30 (27.65 points risk) with dual targets at 1:1 and 1:2 risk-reward ratios.
The Trade Analysis Panel immediately begins monitoring with an initial confidence score of 57% - classified as 'MIXED SIGNALS' but showing a 'RISING' trend. Factor analysis reveals: momentum not yet aligned (-4 points as price just reversed), position slightly favorable (+4 points already +0.2R), volume adequate (+2), HTF showing weak alignment (+2 as we're counter-trend), stop well-placed (+3), but targets still distant (0 points).
Notice how the Main Dashboard switches from market scanning mode to active trade tracking, now displaying entry price, live P/L in both points (5.95 pts) and R-multiples (+0.2R), and distances to all key levels. The analysis panel provides real-time factor scoring to help monitor trade health.
SCREENSHOT 3: TP1 Hit - Trade Performing Well (Image 3)
Time: ~14:20 UTC+5:30(approx)
Price: ~26,154 (TP1 zone)
Bars in Trade: 29
Main Dashboard (Top Right):
- Trade: SHORT
- Entry: 26184.65
- P/L: 30.85 pts | +1.12R (excellent progress)
- TP1: HIT (displayed in green)
- TP2: 26129.35 (24.44 pts away)
- Stop: 26212.30 (58.5 pts away - well protected)
- Bars: 29
Trade Analysis Panel (Bottom Left):
- Header: TRADE ANALYSIS
- Status Bar: "Multiple factors positive"
- Confidence: 78% RISING
- Factor Breakdown:
- Momentum: +8 = (ALIGNED)
- Position: +8 + (strong profit zone)
- Volume: +2 + (continued support)
- HTF Align: +8 = (now strongly aligned)
- Target: +10 + (TP1 achieved, approaching TP2)
- Stop Dist: +3 + (excellent cushion)
- Bottom Status: "Multiple factors positive"
- Visual State: Green background (FACTORS ALIGNED state)
Description:
Trade Execution Phase - First Target Achieved: After 29 bars , price reaches the first take-profit target at 26,157.00. The ' ' marker confirms partial profit taking. Current P/L shows +30.85 points (+1.12R), exceeding the initial 1:1 risk-reward.
The Trade Analysis Panel shows dramatic improvement - confidence has surged to 78% (FACTORS ALIGNED state) with most factors now positive:
- Momentum factor improved to +8 (velocity aligned with trade direction)
- Position factor at +8 (over +1R profit zone)
- HTF Align jumped to +8 (higher timeframe now confirming the move)
- Target factor maxed at +10 (TP1 achieved, TP2 within reach)
- Stop Distance at +3 (58.5 points cushion providing safety)
Notice the panel status displays 'Multiple factors positive' with a green-tinted background, indicating optimal trade conditions. The confidence trend shows 'RISING' suggesting continued momentum. With TP1 secured and only 24.44 points to TP2, the trade is well-positioned for a full 1:2R win.
SCREENSHOT 4: TP2 Reached - Trade Complete (Image 4)
Time: ~15:00+ UTC+5:30
Final Exit: 26,129.35 (TP2)
Final Result: Full TP2 win
Main Dashboard (Top Right):
- Bias: NEUTRAL (reverted to scanning mode)
- Pulse: 45.2 (returned to neutral zone)
- Volatility: NORMAL
- Trend: TREND DOWN (confirmed the move)
- Session: LONDON
- Volume: 1.26x (increased as move developed)
- HTF: BEARISH (fully aligned post-trade)
- Best Score: 5/5 (neutral after completion)
Trade Analysis Panel (Bottom Left):
- Status: NO ACTIVE TRADE (reverted)
- Long Score: 5/5 (RDY)
- Short Score: 5/5 (RDY)
- Panel Message: "Scanning - prime session active"
- Light blue/cyan background (back to scanning mode)
Description:
Trade Completion - Full Target Achieved: The short trade reaches its second take-profit target at 26,129.35, securing a complete 1:2 risk-reward win. The ' ' marker confirms the exit. Final results:
- Entry: 26,184.65
- Exit: 26,129.35
- Profit: 55.30 points (approximately +2.0R)
- Outcome: Full TP2 success
Post-Trade Analysis: After trade closure, the indicator automatically returns to market scanning mode. The Main Dashboard reverts to showing market conditions rather than trade metrics. Notice how the 'Trend' now displays 'TREND DOWN' - confirming the move we captured. Volume increased to 1.26x during the winning move, validating the signal quality.
The Trade Analysis Panel switches back to 'NO ACTIVE TRADE' status and resumes displaying long/short setup scores. The confidence-based factor monitoring was instrumental throughout the trade:
- Initial entry at 57% confidence (MIXED SIGNALS)
- Peak confidence of 78% at TP1 (FACTORS ALIGNED)
- Real-time factor updates helped confirm trade validity
This example demonstrates the indicator's complete workflow: setup identification → signal generation → entry execution → live trade monitoring → systematic exit at targets.
KEY FEATURES DEMONSTRATED
1. Dual Dashboard System
- Main Dashboard: Market conditions (scanning) → Trade metrics (active position)
- Analysis Panel: Setup scores (scanning) → Factor-based confidence (in-trade)
2. Visual Trade Management
- Color-coded entry zones (yellow)
- Risk levels clearly marked (red dashed stop)
- Profit targets with R:R ratios labeled
- Achievement markers ( , )
3. Real-Time Factor Analysis
- 6-factor scoring system (Momentum, Position, Volume, HTF, Target, Stop Dist)
- Confidence percentage with trend indicators
- State machine (MIXED → FACTORS ALIGNED)
- Hysteresis prevents false state changes
4. Risk Management
- Structure-based stop placement (respects swing highs)
- Multiple take-profit levels (1:1 and 1:2 R:R)
- Live P/L tracking in points and R-multiples
- Distance monitoring to all key levels
This complete example showcases the indicator's progression from setup identification through trade completion, demonstrating how the dual-dashboard system and factor-based analysis provide continuous trade guidance. The structured stop-loss and dual-target approach delivered the planned 1:2 risk-reward ratio with systematic, rule-based execution.
ALERT SYSTEM
The indicator includes 9 built-in alert conditions:
SIGNAL ALERTS:
→ High-Grade Long Signal (A+)
• Triggers only on A+ long signals
• For traders who want only the highest-quality longs
• Message: "KINETIC SCALPER: LONG @ "
→ High-Grade Short Signal (A+)
• Triggers only on A+ short signals
• For traders who want only the highest-quality shorts
• Message: "KINETIC SCALPER: SHORT @ "
→ Long Signal
• Triggers on ANY qualified long signal (A+, A, or B)
• For traders who want all long opportunities
• Message: "KINETIC SCALPER: LONG @ "
→ Short Signal
• Triggers on ANY qualified short signal
• For traders who want all short opportunities
• Message: "KINETIC SCALPER: SHORT @ "
TRADE MANAGEMENT ALERTS:
→ TP1 Hit
• Triggers when first profit target is reached
• Useful for partial profit taking notifications
• Message: "KINETIC SCALPER: TP1 REACHED"
→ TP2 Reached
• Triggers when second profit target is reached
• Trade is complete, full win achieved
• Message: "KINETIC SCALPER: TP2 REACHED"
→ Stop Loss Hit
• Triggers when stop loss is reached
• Important for trade management and risk tracking
• Message: "KINETIC SCALPER: STOP LOSS"
ANALYSIS STATE ALERTS:
→ Analysis State: Negative Bias
• Triggers when factor analysis enters "Negative Bias" state
• Warning that trade conditions are deteriorating
• Consider reducing position or preparing to exit
• Message: "KINETIC SCALPER: Analysis state changed to NEGATIVE BIAS"
→ Analysis State: Factors Weakening
• Triggers when factor analysis enters "Factors Weakening" state
• Caution that confluence is diminishing
• Monitor trade closely
• Message: "KINETIC SCALPER: Analysis state changed to FACTORS WEAKENING"
HOW TO SET UP ALERTS:
1. Click the "Create Alert" button in TradingView
2. Condition: Select "Kinetic Scalper "
3. Choose your desired alert from the dropdown
4. Configure your alert options:
→ Once Per Bar Close (recommended for non-repainting)
→ Frequency: Once Per Bar Close or Only Once
5. Set expiration and notification methods (popup, email, webhook, etc.)
6. Create alert
RECOMMENDED ALERT STRATEGY:
For active traders:
→ Set "Long Signal" and "Short Signal" alerts for all opportunities
→ Set "TP1 Hit", "TP2 Reached", and "Stop Loss Hit" for trade management
→ Consider "Analysis State: Negative Bias" for trade monitoring
For selective traders:
→ Set only "High-Grade Long Signal (A+)" and "High-Grade Short Signal (A+)"
→ Focus on the absolute highest-quality setups
→ Set TP/SL alerts for position management
USAGE TIPS & BEST PRACTICES
SIGNAL SELECTION:
✓ GRADE MATTERS
→ A+ signals have statistically more confluence factors
→ If you're conservative, trade only A+ signals
→ B signals can work but require more discretion
✓ CONFLUENCE WITH YOUR ANALYSIS
→ Use this indicator as CONFIRMATION, not sole decision criteria
→ Combine with your own support/resistance analysis
→ Check for fundamental events (news, economic data)
→ Respect major round numbers and psychological levels
✓ SESSION TIMING (Forex)
→ Best signals often occur during London/NY overlap
→ Avoid signals 10 minutes before major news releases
→ Asian session signals can be valid but lower liquidity
✓ TIMEFRAME CONFLUENCE
→ If you get an A+ signal on 15m, check if 1H chart agrees
→ Higher timeframe confirmation adds conviction
→ Avoid signals that oppose the daily/4H trend
TRADE MANAGEMENT:
✓ POSITION SIZING
→ ALWAYS size positions so stop loss = 1-2% of account
→ Never risk more than you can afford to lose
→ Smaller position on B signals, standard on A, larger on A+ (within limits)
✓ PARTIAL PROFIT TAKING
→ Consider taking 50% off at TP1
→ Move stop to breakeven after TP1 hit
→ Let remaining position run to TP2
✓ TRAILING STOPS
→ The indicator doesn't auto-trail stops (manual decision)
→ After TP1, you might manually move stop to entry (breakeven)
→ Consider ATR-based trailing stop for runners
✓ WATCH THE ANALYSIS PANEL
→ If state changes to "Factors Weakening" while in profit, consider exit
→ "Negative Bias" during a trade is a strong warning
→ "Factors Aligned" confirms your trade thesis is still valid
RISK MANAGEMENT:
✓ NEVER IGNORE STOPS
→ The calculated stop is there for a reason
→ Moving stop further away increases risk exponentially
→ If stopped out, accept it and wait for next setup
✓ AVOID REVENGE TRADING
→ If you get stopped out, resist urge to immediately re-enter
→ Signal cooldown helps with this
→ Wait for next qualified signal
✓ RESPECT VOLATILITY WARNINGS
→ If indicator shows "EXTREME" volatility, signals are blocked for a reason
→ Don't force trades in chaotic conditions
→ Wait for regime to normalize
✓ CORRELATION RISK
→ Be aware of correlation if trading multiple pairs
→ EUR/USD and GBP/USD are highly correlated
→ Don't stack risk on correlated instruments
OPTIMIZATION:
✓ START WITH DEFAULTS
→ Default settings are well-tested
→ Don't over-optimize for recent market behavior
→ Give settings at least 20-30 trades before judging
✓ TIMEFRAME-SPECIFIC ADJUSTMENTS
→ Lower timeframes: Consider increasing Signal Distance to 3.0-4.0
→ Higher timeframes: ATR Stop Multiplier might go to 2.0-2.5
→ Crypto: Ensure Instrument Type is set to "Crypto" for proper stops
✓ SENSITIVITY CALIBRATION
→ Too many signals? Switch to Conservative
→ Missing good setups? Try Balanced or Aggressive
→ Quality > Quantity always
✓ KEEP A JOURNAL
→ Track which signal grades work best for you
→ Note which sessions produce best results
→ Review stopped trades for patterns
THINGS TO AVOID:
✗ DON'T chase signals after several bars have passed
✗ DON'T ignore the stop loss or move it further away
✗ DON'T overtrade by taking every B-grade signal
✗ DON'T trade during major news if you're not experienced
✗ DON'T use this as your only analysis tool
✗ DON'T expect 100% win rate (no indicator has this)
✗ DON'T risk more than 1-2% per trade regardless of signal grade
UNDERSTANDING THE METHODOLOGY
WHY VOLUME WEIGHTING?
Traditional momentum oscillators treat all price moves equally. A 10-point move on low volume is weighted the same as a 10-point move on high volume.
The Kinetic Pulse corrects this by:
→ Calculating volume ratio vs. 20-bar average
→ Applying square root transformation to volume ratio (prevents extreme weights)
→ Multiplying price changes by volume weight
→ Result: High-volume moves influence the oscillator more than low-volume noise
This helps filter false breakouts and emphasizes moves with participation.
WHY FISHER TRANSFORM?
Fisher Transform is a mathematical transformation that:
→ Normalizes probability distributions
→ Creates sharper turning points
→ Amplifies extremes while compressing the middle
→ Makes overbought/oversold levels more distinct
Applied to the Kinetic Pulse, it helps identify genuine extremes vs. noise.
WHY MULTI-OSCILLATOR DIVERGENCE?
Single-source divergence can give false signals. By requiring divergence confirmation across multiple oscillators (Kinetic Pulse, CCI, Stochastic), the system filters out:
→ Divergences caused by calculation quirks in one oscillator
→ Temporary momentum anomalies
→ False divergence on noisy, low-timeframe charts
Multiple sources confirming the same pattern increases reliability.
WHY ADAPTIVE PERIODS?
Fixed periods can be:
→ Too slow during high volatility (miss fast reversals)
→ Too fast during low volatility (generate noise)
The adaptive system:
→ Shortens period when ATR ratio > 1.3 (high volatility = need faster response)
→ Lengthens period when ATR ratio < 0.7 (low volatility = need noise filtering)
→ Keeps period in reasonable range (60% to 140% of base period)
→ Result: Oscillator adjusts to current market pace automatically
WHY HYSTERESIS IN STATE MACHINE?
Without hysteresis, the analysis state would flip-flop on every bar, creating:
→ Confusing, contradictory guidance
→ Analysis paralysis
→ Lack of actionable information
Hysteresis solves this by:
→ Using different thresholds to ENTER vs. EXIT a state
→ Example: Enter "Factors Aligned" at 72+ confidence, but don't exit until <62
→ This creates stable states that persist through minor fluctuations
→ Requires minimum commitment period (3 bars) before state changes
→ Overrides commitment for significant events (near TP/SL)
→ Result: Stable, trustworthy analysis that changes only when truly warranted
WHY CONFIDENCE SMOOTHING?
Raw factor scores fluctuate bar-by-bar based on momentary conditions. Smoothing:
→ Uses 5-period EMA on raw confidence scores
→ Filters out single-bar anomalies
→ Preserves genuine trends in confidence
→ Prevents false state transitions
→ Result: More reliable assessment of actual trade health
WHY INSTRUMENT-SPECIFIC PARAMETERS?
Different instruments have different characteristics:
→ Forex is highly liquid, respects technical levels well, standard ATR works
→ Crypto is extremely volatile, needs wider stops (1.8x) to avoid false stops
→ Indices respect session opens strongly, session weighting is important
→ Commodities fall in between
Auto-detection applies research-based multipliers automatically.
WHY STRUCTURE-BASED STOPS?
ATR-based stops can:
→ Place stop in middle of consolidation (easily hit)
→ Ignore obvious invalidation levels
→ Be too tight during expansion or too wide during contraction
Structure-based stops:
→ Use actual swing highs/lows (where traders actually place stops)
→ Add small ATR buffer to avoid stop hunting
→ Constrain within min/max ATR limits for safety
→ Result: Stops that respect market geometry while managing risk
DISCLAIMER & RISK WARNING
READ THIS CAREFULLY BEFORE USING THIS INDICATOR
This indicator is provided for EDUCATIONAL and INFORMATIONAL purposes only.
❌ NOT FINANCIAL ADVICE
This indicator does NOT constitute financial advice, investment recommendations, or solicitation to buy or sell any financial instrument. All information is for educational purposes only.
❌ NO GUARANTEES
→ Past performance does NOT guarantee future results
→ No indicator can predict future price movements with certainty
→ Signal grades represent confluence, NOT win probability
→ A+ signals can lose, B signals can win - markets are probabilistic
❌ SUBSTANTIAL RISK
Trading financial instruments involves SUBSTANTIAL RISK of loss:
→ You can lose your entire investment
→ Leveraged trading amplifies both gains AND losses
→ Never trade with money you cannot afford to lose
→ Never risk more than 1-2% of your account per trade
❌ YOUR RESPONSIBILITY
→ All trading decisions are YOUR responsibility
→ You must conduct your own analysis before entering trades
→ Consult a licensed financial advisor before trading
→ Understand the risks specific to your jurisdiction and situation
→ Only trade with capital you can afford to lose completely
❌ NO HOLY GRAIL
→ This indicator is a TOOL, not a complete trading system
→ It should be used as part of a broader analysis framework
→ Combine with your own technical analysis, risk management, and judgment
→ No indicator works 100% of the time in all market conditions
❌ ANALYSIS PANEL DISCLAIMER
The "Trade Analysis Panel" provides ALGORITHMIC ANALYSIS of market factors.
→ It does NOT provide investment advice or recommendations
→ Factor scores are mathematical calculations, not predictions
→ Guidance messages are informational, not directives
→ All trading decisions remain your responsibility
❌ BACKTESTING LIMITATIONS
→ This is an indicator, not a strategy, so no backtesting results are provided
→ Any backtesting you perform includes hindsight bias and optimization bias
→ Historical performance does not indicate future performance
→ Slippage, commissions, and real-world execution differ from backtests
❌ MARKET CONDITIONS
→ This indicator performs differently in trending vs. ranging markets
→ Extreme volatility can produce false signals or whipsaws
→ Low liquidity periods increase execution risk
→ Major news events can invalidate technical analysis
BY USING THIS INDICATOR, YOU ACKNOWLEDGE:
→ You have read and understood this disclaimer
→ You accept full responsibility for your trading decisions
→ You understand the substantial risks involved in trading
→ You will not hold the author liable for any losses incurred
→ You are using this tool as part of your own due diligence process
KEY FEATURES SUMMARY
✅ Volume-Weighted Kinetic Pulse Engine (proprietary momentum calculation)
✅ 15-Factor Confluence Scoring System (graded signals: A+, A, B)
✅ Multi-Oscillator Divergence Detection (Pulse + CCI + Stochastic)
✅ Higher Timeframe Trend Alignment Filter
✅ Adaptive Period Adjustment (volatility-responsive)
✅ Instrument-Aware Calibration (Forex, Crypto, Indices, Commodities)
✅ Structure-Based Stop Loss Calculation (respects swing highs/lows)
✅ Automated Trade Tracking (entry, stop, TP1, TP2, P/L)
✅ Real-Time Factor Analysis State Machine (5-state system with hysteresis)
✅ Session Awareness (Asian, London, New York, Overlap)
✅ Volatility Regime Detection (blocks signals in extreme conditions)
✅ Choppiness Filter (reduces signals in ranging markets)
✅ Volume Confirmation (relative volume and delta analysis)
✅ Clean Air Check (validates clear path to targets)
✅ Comprehensive Dashboards (market conditions + trade analysis)
✅ Customizable Display (3 signal styles, color themes, positioning)
✅ 9 Built-In Alert Conditions (signals, TP/SL hits, state changes)
✅ Fully Non-Repainting (barstate.isconfirmed, lookahead_off)
✅ Previous Day Levels (PDH/PDL reference lines)
✅ Mobile-Friendly Compact Mode (for smaller screens)
TECHNICAL SPECIFICATIONS
→ Pine Script Version: v6
→ Indicator Type: Overlay (displays on price chart)
→ License: Mozilla Public License 2.0
→ Copyright: BULLBYTE
→ Object Limits: 300 labels, 100 lines, 50 boxes
→ Memory Management: Automatic cleanup system (FIFO queue)
→ Repainting: Non-repainting (signals confirmed on bar close)
→ Timeframe Support: All timeframes (1s to Monthly)
→ Instrument Support: Forex, Crypto, Indices, Commodities, Stocks
→ HTF Data Handling: lookahead_off with historical offset
VERSION HISTORY
v1.0 - Initial Release
→ Kinetic Pulse engine with volume weighting and Fisher Transform
→ 15-factor confluence scoring system
→ Trade analysis state machine with hysteresis
→ Automated trade tracking and monitoring
→ Dual dashboard system (market conditions + factor analysis)
→ 9 alert conditions
→ 3 signal display styles
→ Instrument-aware calibration
→ Full risk management framework
WHO IS THIS INDICATOR FOR?
IDEAL FOR:
✓ Scalpers and day traders seeking high-confluence reversal entries
✓ Swing traders who want quality over quantity
✓ Traders who appreciate systematic, rules-based analysis
✓ Multi-timeframe traders who value HTF confirmation
✓ Forex traders who respect session timing
✓ Crypto traders needing volatility-adjusted parameters
✓ Traders who want complete trade management (entry, stop, targets)
✓ Analytical traders who want transparency in signal generation
NOT IDEAL FOR:
✗ Traders seeking a "set and forget" holy grail system
✗ Traders who don't want to learn the methodology
✗ Traders unwilling to accept losing trades as part of the process
✗ Traders who need constant signals (this is a quality-focused system)
✗ Traders who ignore risk management
FINAL THOUGHTS
The Kinetic Scalper is the result of extensive research into momentum behavior, volume confirmation, and multi-factor confluence analysis. It's designed to identify high-probability reversal setups while maintaining strict risk management and providing complete transparency.
This is NOT a magic solution. It's a sophisticated TOOL that requires:
→ Understanding of the methodology
→ Proper risk management discipline
→ Patience to wait for quality setups
→ Willingness to accept losses as part of trading
→ Integration with your own analysis and judgment
Used properly as part of a complete trading plan, the Kinetic Scalper can help you identify high-confluence opportunities and manage trades systematically.
Remember: Quality over quantity. Discipline over emotion. Risk management over everything.
Trade smart. Trade safe.
© 2025 BULLBYTE | Kinetic Scalper v1.0 | For Educational Purposes Only

EAP Trader NY BreakoutMy own profitable NY Breakout Playbook - backtested with statistics
by
EAP Trader
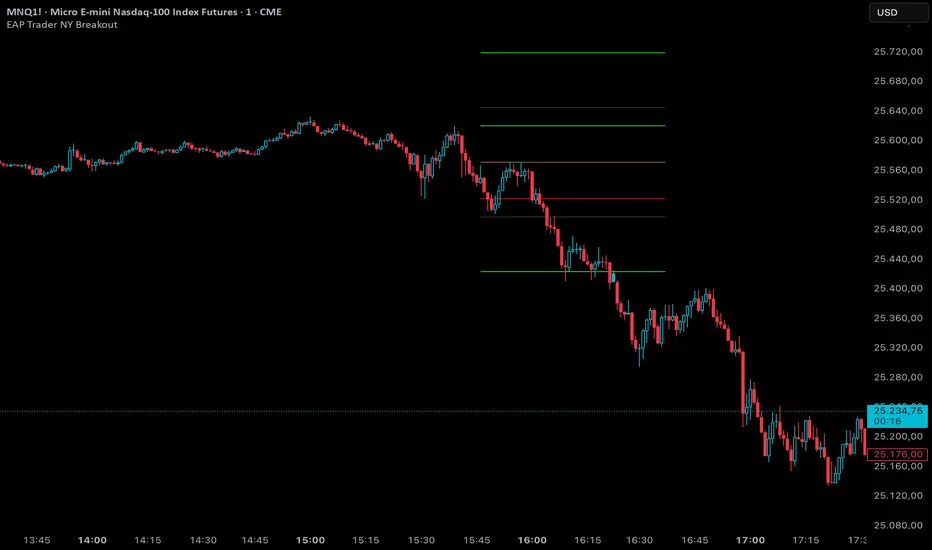
Seasonality Scanner by thedatalayers.comThe Seasonality Scanner automatically detects seasonal patterns by scanning a user-defined number of past years (e.g., the last 10 years).
Based on this historical window, the indicator identifies the strongest seasonal tendency for the currently selected date range.
The scanner evaluates all valid seasonal windows using two filters:
• Hit Rate - the percentage of profitable years
• Average Return - the highest mean performance across the analyzed period
The best-scoring seasonal setup is displayed directly on the chart, including the exact start and end dates of the identified pattern for the chosen time range.
Users can define the period they want to analyze, and the indicator will automatically determine which seasonal window performed best over the selected history.
Recommended Settings (Standard Use)
For optimal and consistent results, the following settings are recommended:
• Search Window: 20-30
• Minimum Length: 5
• Time Period: from 2015 onward
• US Election Cycle: All Years
These settings provide a balanced and reliable baseline to detect meaningful seasonal tendencies across markets.
This indicator helps traders understand when recurring seasonal patterns typically occur and how they may align with ongoing market conditions.
This indicator is intended to be used exclusively on the daily timeframe, as all calculations are based on daily candles.
Using it on lower timeframes may result in inaccurate or misleading seasonal readings.

Gann Volume Swing (GVS)## **Gann Volume Swing (GVS) Indicator**
*Professional Hybrid Volume-Gann Reversal Detector*
### **Core Concept & Purpose**
The Gann Volume Swing (GVS) indicator is a sophisticated trading tool designed to identify high-probability reversal points by integrating three key market dimensions: **volume dynamics**, **geometric price levels**, and **momentum confirmation**. Developed for serious technical traders, GVS addresses the common challenge of distinguishing meaningful breakouts/reversals from temporary noise.
The indicator operates on the principle that **significant volume expansions** at **precise geometric support/resistance levels** (derived from Gann theory) often precede substantial price movements. By combining these elements with traditional momentum filters (RSI, MACD), GVS provides a multi-factor approach to market timing.
### **Theoretical Foundation**
The methodology synthesizes:
1. **Wyckoff's Volume-Price Relationship**: Volume precedes and confirms price action
2. **Gann's Geometric Trading**: Price moves in predictable angular patterns from swing points
3. **Modern Momentum Filters**: Additional confirmation from established oscillators
This creates a robust framework that respects both classical technical analysis and contemporary trading psychology.
---
## **TECHNICAL ARCHITECTURE**
### **1. Volume Engine Module**
```
Inputs:
• Volume MA Period (20): Smoothing window for volume baseline
• Volume Multiplier (2.0): Threshold for "abnormal" volume detection
Calculation Logic:
Current Volume > AND
Current Volume >
Output: Boolean flag signaling institutional-grade participation
```
### **2. Gann Geometry Module**
```
Pivot Detection:
• Swing Highs: PivotHigh(25,25) - Identifies significant peaks
• Swing Lows: PivotLow(25,25) - Identifies significant troughs
Line Generation:
• 1x1 Lines: Base angular lines from pivots (45-degree equivalents)
• 2x1 Lines: Secondary steeper/flatter lines (dynamic angles)
Key Parameter:
• Gann Sensitivity (0.5): Controls line steepness (0.1=flat, 1.0=steep)
```
### **3. Signal Generation Logic**
```
Long Signal =
+ + + +
Short Signal =
+ + + +
Anti-Whipsaw Protection:
• 5-bar cooldown between same-direction signals
• Proximity threshold: 0.5×ATR from Gann lines
```
### **4. Visualization System**
```
Primary Elements:
• Real-time Gann lines (4 colors, 2 styles)
• Signal markers (▲/▼ triangles)
• Bar coloring (lime/red highlights)
Display Control:
• Toggle Gann lines on/off
• Adjust transparency levels
• Custom alert configurations
```
---
## **QUICK REFERENCE CARD**
**GANN VOLUME SWING (GVS)**
*Volume-Powered Geometric Reversal Indicator*
### **🔧 PARAMETER SETTINGS**
**VOLUME GROUP**
`Volume MA Period`: 20 (14-30 range)
`Volume Multiplier`: 2.0 (1.5-2.5 optimal)
**GANN GROUP**
`Swing Period`: 50 bars (pivot sensitivity)
`Gann Sensitivity`: 0.3-0.5 (adjust for market type)
**FILTERS GROUP**
`RSI Period`: 14 (standard)
`Use Filters`: ON (recommended)
**DISPLAY GROUP**
`Show Gann Levels`: ON
`Cooldown Bars`: 5 (prevents signal flooding)
### **🎯 SIGNAL INTERPRETATION**
**LONG SETUP (Green ▲)**
- Volume spike (2× average) + Price at Gann support + Bullish candle
- Entry: Close of signal bar
- SL: 1.5×ATR below support line
- TP: Next Gann resistance or 2:1 R/R
**SHORT SETUP (Red ▼)**
- Volume spike + Price at Gann resistance + Bearish candle
- Entry: Close of signal bar
- SL: 1.5×ATR above resistance line
- TP: Next Gann support or 2:1 R/R
### **📊 VISUAL ELEMENTS KEY**
**LINES**
- `Solid Green`: 1x1 Support (primary)
- `Solid Red`: 1x1 Resistance (primary)
- `Blue Dots`: 2x1 Support (secondary)
- `Orange Dots`: 2x1 Resistance (secondary)
**MARKERS**
- `▲ Below Bar`: Long signal
- `▼ Above Bar`: Short signal
- `Bar Coloring`: Confirmation highlight
### **⚙️ OPTIMIZATION GUIDE**
**TRENDING MARKETS**
- Sensitivity: 0.2-0.3 (shallower angles)
- Volume Multiplier: 1.8-2.0
- Filters: Strict (RSI 65/35)
**RANGING MARKETS**
- Sensitivity: 0.6-0.8 (steeper angles)
- Volume Multiplier: 2.2-2.5
- Filters: Moderate (RSI 70/30)
**HIGH VOLATILITY**
- Increase ATR multiplier to 0.7-1.0
- Extend cooldown to 7-10 bars
- Require stronger volume confirmation
### **🚫 LIMITATIONS & NOTES**
**KNOWN CONSTRAINTS**
- Less effective in extremely choppy markets
- Requires adequate historical data (200+ bars)
- Volume reliability varies by asset class
- Gann lines repaint as new pivots form
**BEST PRACTICES**
- Combine with higher timeframe trend analysis
- Use on 1H+ charts for reliability
- Wait for close confirmation before acting
- Track win rate by market condition
**ALERT CONFIGURATION**
- Enable both Long/Short alerts
- Set to "Once Per Bar Close"
- Include ATR distance in alert message
- Log all signals for performance review
---
## **TRADING SYSTEM INTEGRATION**
### **Recommended Confluence Factors**
1. **Trend Alignment** (Higher timeframe direction)
2. **Market Structure** (Support/Resistance clusters)
3. **Economic Context** (News event proximity)
4. **Session Timing** (High-volume trading hours)
### **Risk Management Protocol**
- Maximum risk: 1% per trade
- Correlation limit: 2 simultaneous GVS signals
- Daily loss cap: 3% of portfolio
- Weekly review of signal accuracy
### **Performance Metrics to Track**
- Signal-to-Noise ratio (profitable signals/total)
- Average Reward/Risk achieved
- Best/worst market conditions
- Optimal parameter sets per asset
---
## **SUMMARY**
The **Gann Volume Swing** indicator represents a sophisticated approach to technical analysis, blending time-tested principles with modern computational techniques. By focusing on the confluence of **unusual volume**, **geometric price levels**, and **momentum confirmation**, it provides traders with a structured framework for identifying high-quality setups.
**Ideal User Profile**: Intermediate to advanced traders comfortable with multi-factor analysis, geometric concepts, and disciplined risk management.
**Disclaimer**: This tool generates probabilities, not certainties. Always combine with comprehensive market analysis and strict risk control measures.
---
**Version**: 5.0
**Category**: Volume + Geometric Analysis
**Complexity**: Advanced
**Best Timeframe**: 1H - Daily
**Recommended Assets**: Liquid stocks, major Forex pairs, indices

Session Trader - Optimal Hours📊 Overview
Never miss the best trading hours again! This indicator provides a comprehensive, real-time session tracker that shows you EXACTLY when to trade crypto and when to stay out of the market. Automatically converts all times to your local timezone, highlights the current active session, and shows what's coming next.
Perfect for crypto traders who want to maximize profits by trading during high-liquidity, high-volume sessions while avoiding choppy, low-liquidity periods that lead to losses.
✨ Key Features
🎯 Real-Time Session Tracking
LIVE indicator shows which session is currently active with bright highlighting
NEXT UP feature highlights the upcoming session when between trading periods
Smart header displays current status at a glance
Real-time countdown timers for every session (opens/closes)
📍 6 Critical Trading Sessions Covered
✅ BEST TRADING SESSIONS (Green):
London Open (07:00-09:00 UTC) - High volatility kickoff, institutional orders
London-NY Overlap (13:30-15:30 UTC) - THE BEST period! Maximum liquidity & volume
NY Momentum (15:30-18:00 UTC) - Strong trending moves, continuation plays
❌ AVOID TRADING SESSIONS (Red):
4. Pre-Asia Quiet (21:00-00:00 UTC) - Low liquidity, erratic moves, wide spreads
5. Asia Lunch (03:30-05:00 UTC) - Choppy markets, whipsaws, unreliable patterns
6. Post-US Drift (20:00-21:00 UTC) - Market slows, unpredictable behavior
🌍 Automatic Timezone Conversion
Times display in YOUR chart timezone - no manual conversion needed!
Works in Berlin, New York, Tokyo, Sydney, or anywhere in the world
Switch between 12-hour and 24-hour formats
🎨 Visual Clarity
Active TRADE sessions = Bright green background, impossible to miss
Active AVOID sessions = Bright red background, clear warning
NEXT UP session = Orange highlight when between sessions
Inactive sessions = Faded gray, stays out of your way
Color-coded status column with clear ✓ TRADE or ✗ AVOID indicators
⚙️ Fully Customizable
9 table positions (top-left, top-right, bottom-center, etc.)
6 text sizes (tiny to huge) for any screen size
Toggle individual sessions on/off
Show/hide descriptions for cleaner view
Custom colors for each session type
Countdown timer toggle
🔔 Built-In Alerts
Automatic alerts when TRADE sessions start
Alerts when AVOID sessions begin (so you don't enter bad conditions)
Customizable per session
📖 How To Use
Basic Setup:
Add indicator to any crypto chart (BTC, ETH, etc.)
Times automatically convert to your chart's timezone
Watch the header - shows current session or next upcoming
Look for bright colors:
🟢 Bright green = TRADE NOW
🔴 Bright red = AVOID NOW
🟠 Orange = NEXT UP (coming soon)
Trading Strategy:
Focus on GREEN sessions (London Open, London-NY Overlap, NY Momentum)
Avoid RED sessions (Pre-Asia Quiet, Asia Lunch, Post-US Drift)
Prepare for ORANGE sessions (next up - get ready!)
Use countdown timers to plan entries/exits perfectly
Pro Tips:
London-NY Overlap is the BEST - highest volume, tightest spreads, cleanest trends
First 30 minutes of London can have quick reversals - use caution
NY Momentum is perfect for riding trends with trailing stops
NEVER trade during Asia Lunch - choppy, unpredictable, costs you money
Post-US Drift looks tempting but often leads to whipsaws
🔧 Indicator Settings
Display Options:
Table Position: Choose from 9 positions on your chart
Text Size: Auto, Tiny, Small, Normal, Large, Huge
Time Format: 12-hour (AM/PM) or 24-hour format
Show Countdown: Toggle real-time countdown timers
Show Description: Toggle detailed session descriptions
Highlight Next Session: Orange highlight for upcoming session
Session Toggles:
Enable/disable any of the 6 sessions individually:
London Open
London-NY Overlap
NY Momentum
Pre-Asia Quiet
Asia Lunch
Post-US Drift
Color Customization:
Active TRADE session color (default: bright green)
Active AVOID session color (default: bright red)
NEXT UP session color (default: orange)
Inactive session color (default: faded gray)
Alerts:
Individual alert toggles for each session
Alerts fire when sessions start (not every bar)
Includes context in alert message
📊 Session Details
🟢 London Open (07:00-09:00 UTC)
Status: TRADE ✓
Characteristics:
London opens with high volatility as European traders enter
Major institutional orders create significant price movements
Perfect for breakout and trend-following strategies
Watch for quick reversals in first 30 minutes
Good liquidity and volume
🟢 London-NY Overlap (13:30-15:30 UTC)
Status: TRADE ✓
THE BEST TRADING PERIOD!
Maximum liquidity as London & NY markets overlap
Institutional volume peaks, creating clean trends
Reliable technical setups, tightest spreads
Best execution quality
Focus on momentum and breakout trades
🟢 NY Momentum (15:30-18:00 UTC)
Status: TRADE ✓
Characteristics:
Strong directional moves as US market dominates
Trending behavior ideal for position trades
Continuation patterns highly reliable
Major news impact is highest during this period
Use trailing stops to ride trends effectively
🔴 Pre-Asia Quiet (21:00-00:00 UTC)
Status: AVOID ✗
WARNING:
Pre-Asian session with minimal liquidity
Thin order books cause erratic price action
Fake breakouts and stop-hunting common
Wide spreads increase trading costs
High risk, low reward - wait for better conditions
🔴 Asia Lunch (03:30-05:00 UTC)
Status: AVOID ✗
WARNING:
Asian lunch break creates choppy, directionless markets
Low volume leads to whipsaws and false signals
Market makers widen spreads significantly
Technical patterns unreliable
Not worth the risk - take a break!
🔴 Post-US Drift (20:00-21:00 UTC)
Status: AVOID ✗
WARNING:
Post-US session as major markets close
Liquidity dries up, causing unpredictable moves
High slippage risk
Market enters consolidation before Asian open
Better to wait for next quality session
🎯 Who Is This For?
Perfect for:
✅ Crypto day traders who want to maximize profits by timing the markets
✅ Scalpers who need high liquidity and tight spreads
✅ Swing traders who want to enter during optimal conditions
✅ Beginners who need clear guidance on when to trade
✅ Anyone tired of choppy sessions that eat away profits
Ideal Markets:
Bitcoin (BTC/USD, BTC/USDT)
Ethereum (ETH/USD, ETH/USDT)
Major altcoins (SOL, XRP, ADA, etc.)
Any 24/7 crypto market
💡 Why Session Timing Matters
Trading crypto during low-liquidity sessions is one of the biggest mistakes traders make:
❌ Trading during bad sessions causes:
Wider spreads (higher costs per trade)
Choppy, unpredictable price action
Fake breakouts and stop-hunting
Poor trade execution and slippage
Emotional frustration and overtrading
✅ Trading during optimal sessions gives you:
Tight spreads (lower costs)
Clean, trending price action
Reliable technical patterns
Better execution quality
Higher win rates and confidence
The difference between a profitable trader and a losing trader is often WHEN they trade, not HOW they trade.
🚀 Technical Details
Version: Pine Script v6
Type: Overlay indicator (table display)
Repainting: Non-repainting (all times are fixed to session schedules)
Updates: Real-time on every bar
Performance: Lightweight, no lag
Compatibility: Works on any timeframe (1m to 1D+)
📈 Best Practices
Plan your trading schedule around GREEN sessions
Set alerts for session starts so you never miss opportunities
Use the countdown to prepare entries/exits in advance
Combine with your strategy - this indicator tells you WHEN, your strategy tells you WHAT
Respect the RED sessions - discipline is profit
Keep descriptions ON when learning, turn OFF for cleaner charts later
🔄 Updates & Support
This indicator is actively maintained. Future updates may include:
Session volume statistics
Historical session performance tracking
Additional regional sessions
More customization options

Beast Mode PRO v4.0# Beast Mode PRO v4.0 - Advanced Multi-Regime Trading System
## Overview
Beast Mode PRO v4.0 is a sophisticated technical analysis indicator designed for active traders seeking high-probability setups across multiple timeframes. This system combines machine learning-inspired clustering algorithms with traditional technical analysis to identify market regimes and generate precision entry signals. The indicator adapts to different trading styles through intelligent preset configurations and multiple trading modes.
---
## Core Methodology
### Signal Generation Framework
The indicator employs a **multi-component voting system** that analyzes market conditions through several independent technical perspectives:
**Technical Components:**
- **RSI (Relative Strength Index)**: Momentum oscillator measuring overbought/oversold conditions
- **Fisher Transform**: Price transformation technique that normalizes price distributions for clearer turning points
- **DMI (Directional Movement Index)**: Trend strength indicator measuring directional pressure
- **Z-Score Analysis**: Statistical measure identifying price deviations from historical norms
- **Moving Average Ratio**: Price relationship to its moving average baseline
- **MFI (Money Flow Index)**: Volume-weighted momentum indicator
- **Stochastic Oscillator**: Momentum indicator comparing closing price to price range
- **CCI (Commodity Channel Index)**: Measures current price level relative to average price level
### Clustering Engine
The system utilizes a **k-means inspired clustering algorithm** that categorizes each technical indicator's normalized values into distinct market regimes (bullish, bearish, neutral). This approach:
1. **Normalizes** all indicators using z-score transformation over a historical lookback window
2. **Clusters** normalized values using percentile-based thresholds
3. **Aggregates** individual votes into a composite score ranging from -100 to +100
4. **Smooths** the composite score using selectable methods (SMA, EMA, WMA, HMA, TEMA, DEMA)
The clustering percentiles adapt dynamically based on current market volatility (ATR-normalized), ensuring the system remains responsive across different market conditions.
---
## Trading Modes
### 1. Normal Mode
Standard crossover-based signals using fixed thresholds (+10/-10). Suitable for balanced trading with moderate signal frequency.
### 2. Scalper Mode
Dynamic threshold adjustment based on recent score volatility. Generates more frequent signals by adapting to short-term price movements.
### 3. Aggressive Mode
Reversal-focused approach that triggers signals when the composite score crosses extreme levels (+80/-80), targeting major trend reversals.
### 4. Hybrid Mode
Combines Normal and Aggressive signals, capturing both standard crossovers and extreme reversals for comprehensive market coverage.
### 5. Super Scalper Mode
Ultra-responsive mode using signal line crossovers (14-period HMA of composite score) for maximum trade frequency.
### 6. Sniper Mode (Premium Feature)
Multi-confirmation system requiring alignment of:
- Composite score threshold breach
- Positive fast momentum (10-period SMI)
- Positive trend momentum (200-period SMI)
- Price above/below smart trend filter MA
This mode prioritizes precision over frequency, filtering out low-probability setups.
---
## Timeframe Presets
Pre-optimized configurations for common trading timeframes:
### 1 Minute Preset
- Fast smoothing (10-period WMA)
- Tight chop filter (61.8 threshold)
- Optimized for rapid scalping with minimal lag
### 2 Minute Preset
- Balanced smoothing (12-period EMA)
- Enhanced volume filtering
- Moderate cooling period (5 bars)
### 3 Minute Preset
- HMA smoothing for reduced lag
- Stochastic and CCI enabled
- Balanced approach for intraday trading
### 5 Minute Preset
- TEMA smoothing for trend following
- Stronger filters to reduce noise
- Extended lookback (1000 bars)
### 15 Minute Preset
- DEMA smoothing for swing positions
- Maximum filtering configuration
- All technical indicators enabled
- Suitable for swing trading and position building
Users can also select "Custom" to manually configure all parameters.
---
## Advanced Filtering System
### 1. Choppy Market Filter
Uses Choppiness Index calculation to identify consolidating markets. When CI exceeds the threshold, signals are suppressed to avoid whipsaw trades.
### 2. Smart Trend Filter
Configurable moving average (SMA/EMA/WMA/HMA/TEMA/DEMA/VWMA/RMA) that prevents counter-trend signals. Long signals require price above the MA, shorts require price below.
### 3. Volume Filter
Compares current volume to its moving average. Signals are suppressed when volume falls below the specified multiplier of average volume.
### 4. ATR Volatility Filter
Prevents trading during low volatility periods when ATR falls below its moving average multiplied by the specified factor.
### 5. Session Filter
Time-based filtering for Asia, London, New York, or combined sessions. Ensures trading only during preferred market hours.
### 6. Multi-Timeframe Confirmation
Optionally requires higher timeframe alignment before generating signals, adding confluence for higher probability trades.
### 7. Cooling Off Period
Prevents signal clustering by enforcing a minimum number of bars between consecutive signals.
---
## Smart Money Concepts Integration
### Order Block Detection
Identifies institutional supply/demand zones using multi-timeframe analysis:
- Detects strong directional candles followed by breakout moves
- Volume confirmation ensures significance
- Customizable timeframe selection (current TF or higher TF: 5m, 15m, 30m, 1H, Daily)
- Visual boxes mark active order blocks with automatic expiration after lookback period
- Price interaction alerts when touching active zones
### Liquidity Zones
Marks equal highs (EQH) and equal lows (EQL) where stop losses typically cluster, indicating potential reversal or breakout points.
---
## Momentum Analysis
### Fast Momentum (Default: 10-period)
Short-term momentum oscillator using Stochastic Momentum Index (SMI) calculation. Provides early warning of momentum shifts.
### Trend Momentum (Default: 200-period)
Long-term momentum gauge confirming overall trend direction. Used in Sniper Mode for multi-confirmation.
### Momentum Divergence Detection
Automatically identifies:
- **Regular Divergence**: Price makes new high/low but momentum doesn't (reversal signal)
- **Hidden Divergence**: Price makes higher low/lower high but momentum doesn't (continuation signal)
---
## Visual Components
### Price Chart Overlay
- **Smart Trend MA**: Dynamically colored moving average based on price position
- **EMA Cloud**: 50/200 EMA cloud showing long-term trend (background shading)
- **Trend Background**: Subtle background coloring based on composite score
- **Order Block Boxes**: Institutional supply/demand zones
- **Entry/Exit Markers**: Clear visual signals with emoji labels
- **Liquidity Markers**: EQH/EQL identification
### Bar Coloring
Bars change color based on active mode and market regime:
- **Sniper Mode**: Purple (bull) / Pink (bear)
- **Aggressive Mode**: Bright Green / Bright Red
- **Super Scalper**: Neon Green / Neon Red
- **Timeframe Presets**: Unique color schemes per preset
- **Choppy/Neutral**: Always gray regardless of mode
### Oscillator Pane
- **Composite Score Line**: Gradient-colored stepline showing current regime strength
- **Fast/Trend Momentum**: Optional overlays (gold/cyan colors)
- **Divergence Markers**: Visual alerts for regular, hidden, and momentum divergences
- **Power Zones**: Overbought/oversold regions (80/-80 levels)
- **Dynamic/Fixed Thresholds**: Visual reference lines based on active mode
### Interactive Dashboards
**Main Dashboard** displays:
- Active preset/mode configuration
- Real-time indicator values and votes
- Current market status (active/choppy/counter-trend/low volume/low ATR/MTF misalignment)
- Regime classification (Strong Long/Long/Neutral/Short/Strong Short)
- Smart Trend MA status
**Performance Dashboard** shows:
- Exit strategy (Fixed TP/SL, Trailing Stop, Opposite Signal)
- Total trades and win rate
- Total points and average per NY session
- Profit factor and recovery factor
- Best/worst trades and max drawdown
- Maximum winning/losing streaks
- Sharpe ratio and average risk:reward
**TP Optimizer** (33 variations tested):
- Tests take profit levels from 40 to 200 ticks (5-tick increments)
- Sortable by: Profit Factor, Win Rate, Total Points, Sharpe Ratio
- Displays top 5 configurations with full metrics
- Real-time optimization during backtesting
---
## Backtest Engine
### Exit Strategies
**1. Fixed TP/SL**
- Configurable in Ticks, ATR multiples, or Percentage
- Precise risk management with predefined targets
**2. Exit on Opposite Signal**
- Closes position when counter-signal appears
- Adapts to changing market conditions
- Useful for trend-following approaches
**3. Trailing Stop**
- Dynamic stop loss that follows profitable moves
- Configurable trailing offset percentage
- Locks in profits while allowing trends to develop
### Risk Management
- Optional minimum risk:reward filter
- Prevents trades below specified R:R threshold
- Date range filtering for historical analysis
- Session-based performance tracking
### Performance Metrics
- Win rate, profit factor, Sharpe ratio
- Maximum drawdown and recovery factor
- Consecutive win/loss streaks
- Average win/loss analysis
- Gross profit vs gross loss breakdown
---
## Alert System
Comprehensive alert conditions for:
- Entry signals (Long/Short)
- Exit events (TP/SL/Opposite/Trailing)
- Trend signals (Strong bullish/bearish)
- Divergences (Regular/Hidden/Momentum)
- Order block detection and touches
- Multi-condition strong signals (all confirmations aligned)
---
## How to Use
### Quick Start
1. Select your preferred timeframe preset (1m, 2m, 3m, 5m, 15m, or Custom)
2. Choose a trading mode (Normal, Scalper, Aggressive, Hybrid, Super Scalper, or Sniper)
3. Configure session filter to match your trading hours
4. Enable desired filters (choppy, trend, volume, ATR, MTF)
5. Set your exit strategy and TP/SL levels
6. Monitor signals on price chart and oscillator pane
### Optimization Workflow
1. Enable "Run TP Optimizer" in backtest settings
2. Run backtest on historical data
3. Review Optimizer Dashboard for best TP levels
4. Sort by preferred metric (Profit Factor, Win Rate, Total Points, Sharpe)
5. Apply winning configuration to live trading
### Advanced Configuration
- Customize individual indicator lengths and enable/disable specific components
- Adjust clustering parameters (lookback window, percentiles, cluster count)
- Fine-tune smoothing methods and lengths
- Configure order block detection timeframe and sensitivity
- Set cooling off period to control signal frequency
---
## Unique Features
1. **Adaptive Clustering**: Volatility-adjusted percentiles ensure consistent performance across market conditions
2. **Multi-Mode Architecture**: Six distinct trading modes from conservative to ultra-aggressive
3. **Timeframe Intelligence**: Pre-optimized presets eliminate guesswork for common timeframes
4. **Smart Money Integration**: Order block detection and liquidity zone marking
5. **Comprehensive Backtesting**: Three exit strategies with 33-variation TP optimization
6. **Visual Clarity**: Mode-specific bar coloring and clean chart presentation
7. **Filter Stack**: Seven-layer filtering system prevents low-quality signals
8. **Real-Time Metrics**: Live performance tracking with advanced statistics
---
## Benefits
- **Reduced False Signals**: Multi-confirmation clustering approach filters noise
- **Adaptability**: Works across timeframes and market conditions through preset system
- **Transparency**: Open visualization of all component votes and filtering status
- **Risk Management**: Built-in TP/SL optimization and R:R filtering
- **Time Efficiency**: Preset configurations save hours of manual optimization
- **Educational Value**: Dashboard shows exactly why signals trigger or get filtered
- **Professional Tools**: Institutional concepts (order blocks, liquidity zones) accessible to retail traders
---
## Best Practices
- Use Sniper Mode for high-probability setups during volatile markets
- Enable choppy filter during consolidation periods
- Combine Smart Trend Filter with MTF confirmation for swing trades
- Run TP Optimizer monthly to adapt to changing market dynamics
- Monitor Sharpe Ratio in addition to win rate for risk-adjusted performance
- Use session filters to avoid low-liquidity hours
- Start with preset configurations before custom optimization
---
## Technical Requirements
- TradingView Premium/Pro/Pro+ for full feature access
- Minimum chart history: 500 bars (adjustable in clustering settings)
- Works on all instruments (stocks, forex, crypto, futures)
- Compatible with standard candles (Heikin Ashi optional but not recommended for backtesting)
---
## Disclaimer
This indicator is a technical analysis tool designed to assist trading decisions. It does not guarantee profits and should be used in conjunction with proper risk management, fundamental analysis, and personal trading experience. Past performance does not indicate future results. Users should thoroughly test the indicator on demo accounts before live trading.
---
**Version**: 4.0
**Language**: Pine Script v6
**Type**: Overlay Indicator with Oscillator Pane
**Calculation**: On bar close (default) or real-time (configurable)

Star V12⭐ Star Engine — Multi-Component, Multi-Timeframe Trade Execution System
The Star Engine is a stateful trade execution and analytics system designed to transform indicator confluence into structured, measurable trade runs. Rather than producing isolated buy/sell signals, the engine decomposes market behavior into pressure, confirmation, event grouping, and trade lifecycle management. Each component plays a specific role, and no single component is sufficient on its own. Below is a detailed breakdown of each subsystem and why it exists.
💣 Bomb Engine — Directional Pressure Measurement
The Bomb Engine is responsible for identifying directional pressure in the market. It evaluates whether price action exhibits sustained momentum in one direction, independent of whether that direction is immediately tradable.
What Bomb Uses
Bomb aggregates momentum- and trend-oriented inputs such as MACD-based momentum direction, momentum persistence and continuation logic, directional bias filters, and impulse strength evaluation. All inputs are evaluated across multiple timeframes, with each timeframe contributing independently.
How Bomb Works
Each timeframe produces a directional contribution (bullish, bearish, or neutral). Contributions are aggregated into a net Bomb total. The total is mapped into discrete tone buckets (blue, green, red, black, etc.). Higher totals indicate stronger directional dominance.
What Bomb Tells You
Bomb answers one question: Is there directional pressure building or persisting? It does not determine entry timing, exhaustion, or trade quality. Bomb is context, not execution. This allows Bomb to be early without being responsible for precision.
✨ Golden Engine — Structural Confirmation & Regime Filtering
The Golden Engine evaluates whether the directional pressure detected by Bomb is structurally supported. Golden exists to prevent entries during momentum exhaustion, conflicting timeframe regimes, and counter-structure moves.
What Golden Uses
Golden relies on a different indicator stack than Bomb, focused on confirmation and balance, including RSI regime classification (not simple overbought/oversold), momentum agreement vs divergence, trend-following vs counter-trend positioning, overextension detection, and compression and rotational behavior. Each timeframe is evaluated independently using the same logic.
The Role of RSI in Golden
RSI in Golden is used to identify regimes, not signals. It answers questions such as: Is momentum expanding or decaying? Is the move early, mid-structure, or extended? Do multiple timeframes share compatible RSI states? If RSI regimes conflict across timeframes, Golden will not confirm. This is one of the main mechanisms that makes Golden selective.
Momentum & Alignment Logic
Golden evaluates whether momentum supports continuation, is fragmenting, is diverging from price, or is contradicting higher-timeframe structure. If lower-timeframe impulses are not supported by higher-timeframe structure, Golden suppresses confirmation — even if Bomb remains strong.
What Golden Guarantees
Golden does not guarantee profitable trades. Golden guarantees that the detected directional pressure is not internally contradictory across RSI regimes, momentum behavior, and timeframe structure. This replaces vague terms like “clean” with explicit structural conditions.
🔗 Multi-Timeframe Aggregation (MTF)
Both Bomb and Golden operate on a multi-timeframe voting system. Lower timeframes capture early impulses, higher timeframes enforce structural context, each timeframe votes independently, conflicts weaken totals, and alignment strengthens totals. This creates temporal confluence, not just price-based confluence.
⭐ Star Events — Qualified Market Impulses
A Star (⭐) is created only when Bomb is active, Golden is active, both agree on direction, and all gating rules pass (thresholds, time filters, modes). A Star represents a qualified impulse, not a trade. Stars are atomic events used by the execution layer.
⏱ Star Clusters — Trade Run State
The Star Cluster groups Stars into runs. The first Star starts a cluster, anchor price, bar, and time are recorded, each additional Star increments the cluster count, and all Stars belong to the same run until exit. This prevents duplicate entries, signal spam, and overtrading in volatile conditions.
⛔ Reset Gap Logic — Temporal Control
To prevent rapid re-entry, a minimum time gap is required to start a new run. Stars occurring too close together are merged. Reset does not terminate active runs. This enforces time-based discipline, not indicator-based guessing.
1➡️ Entry Logic — Confirmation-Based Execution
The engine never enters on the first Star. Instead, the user defines 🔢 N (Entry Star Index). Entry occurs only on the Nth Star, and that bar is marked 1➡️🔢N. This ensures entries occur after persistence, not detection. At ENTRY, Best = 0.00 and Worst = 0.00. Statistics measure real trade performance, not early signal noise.
📊 STAT Engine — Live Trade Measurement
Once entry is active, the STAT engine tracks ⏱ run progression, 🏅 maximum favorable excursion, and 📉 maximum adverse excursion. Mechanics: uses highs and lows, not closes; updates every bar; entry bar resets stats; historical bars marked 🎨. This creates an objective performance envelope for every trade.
🛑 Exit Engine — Deterministic Outcomes
Trades are exited using explicit rules: 🏅 WIN → profit threshold reached, 📉 LOSE → risk threshold breached, ⏱ QUIT → structural or safety exit.
Safety Exits
🐢 Idle Stop — no Stars for N bars.
🧯 Freeze Failsafe — STAT inactivity.
QUIT is a controlled termination, not failure. Each exit is recorded with a short cause tag.
🧾 Trade Memory & Journaling
Every trade produces immutable records. Entry: time, price, side, confirmation index. Exit: time, price, PnL, result, cause. These records power tables, alerts, JSON output, and external automation.
📊 Time-Block Performance (NY Clock)
Performance is grouped by real time, not bar count. Rolling NY blocks (e.g. 3 hours). Independent statistics per block. Live trades persist across block boundaries. This enables session-based analysis.
🔔 Alerts & Automation
Alerts are state-based: Entry confirmed → Long / Short alert. Trade closed → Exit alert. Optional JSON output allows integration with bots, journals, and dashboards.
Summary
The Star Engine is a component-based trade execution system, where Bomb measures pressure, Golden validates structure, Stars qualify impulses, clusters define runs, entry is delayed by confirmation, stats measure reality, exits are deterministic, and results are time-aware. It is not designed to “predict the market”, but to control how trades are formed, managed, and evaluated.

Seasonality Screener Best Long & Short Patterns Auto-ScanThe Seasonality Screener automatically scans a market’s history to find the most profitable seasonal patterns in the days ahead.
It searches for both long and short setups and shows you the two best patterns based on historical performance.
For each pattern, the screener looks back over past years and calculates:
Average return
Hit rate (win rate)
Winning years vs. total years
The results are displayed in a compact on-chart table with:
Entry date & exit date (calendar days)
Pattern length
Average return & hit rate
Win/trade count
Optionally, the indicator can also draw highlighted boxes in the chart’s history for the selected long and/or short pattern, so you can visually inspect how the seasonal window performed in each year.
You can:
Define how far ahead the screener should look (e.g. next X days),
Control the minimum and maximum pattern length,
Choose how many years of history to use,
And filter by simple regimes such as US election cycle years.
Internally, all calculations are based on daily data, so the seasonal analysis has to be done on the daily timeframe.
This tool is designed as a research and idea generator for seasonal tendencies and should be used together with your own risk management and trading plan.

Dynamic MAs Zscore | Lyro RSThe Dynamic MAs Zscore is an adaptive momentum and valuation oscillator built around advanced moving averages and statistical Z-Score normalization. By combining a wide selection of moving average types with dynamic deviation bands, this indicator delivers clear insights into trend strength , directional bias , and relative valuation — all in a clean, visually intuitive format.
━━━━━━━━━━━━━━━
Key Features
━━━━━━━━━━━━━━━
Dynamic Moving Average Engine
Applies one of 12 selectable moving average types (SMA, EMA, WMA, VWMA, HMA, ALMA, TEMA, etc.) to the chosen source. This allows fine-tuning between responsiveness and smoothness depending on market conditions.
Z-Score Normalization
Transforms the selected moving average into a standardized Z-Score:
(MA − mean) / standard deviation
This normalization makes momentum strength comparable across assets and timeframes.
Adaptive Deviation Bands
Upper and lower bands are derived from the rolling standard deviation of the Z-Score:
Custom band length
Independent positive and negative multipliers
These bands dynamically expand and contract with volatility.
Dual Signal Modes
Trend Mode – Focuses on directional continuation. Color changes and signals occur when Z-Score breaks above or below deviation bands.
Valuation Mode – Highlights relative overvaluation and undervaluation using a gradient color scale and predefined value zones.
Advanced Visual System
Includes bold layered plots, gradient fills, background shading, and candle/bar coloring to clearly reflect current market state.
Custom Color Palettes
Choose from multiple preset themes (Classic, Mystic, Accented, Royal) or define your own bullish and bearish colors.
━━━━━━━━━━━━━━━
How It Works
━━━━━━━━━━━━━━━
MA Calculation – The selected moving average type is applied to the chosen price source.
Z-Score Computation – The MA is normalized over a user-defined lookback period to quantify deviation from its mean.
Band Construction – Standard deviation of the Z-Score is calculated over the band length and scaled by positive/negative multipliers.
Mode-Dependent Logic
Trend Mode – Breaks above the upper band signal bullish momentum; breaks below the lower band signal bearish momentum.
Valuation Mode – A gradient reflects relative valuation from undervalued to overvalued, with background highlights at extreme Z-Score levels.
━━━━━━━━━━━━━━━
Signal Interpretation
━━━━━━━━━━━━━━━
Trend Confirmation
In Trend Mode, sustained moves beyond deviation bands indicate strong directional bias.
Momentum Strength
The distance of the Z-Score from zero reflects the intensity of trend momentum.
Relative Valuation
In Valuation Mode, deep negative Z-Scores suggest undervaluation, while high positive Z-Scores suggest overvaluation.
Visual Clarity
Bar and candle coloring aligned with oscillator state allows for rapid assessment of market conditions.
━━━━━━━━━━━━━━━
Customization
━━━━━━━━━━━━━━━
Adjust MA type and length to balance speed vs. smoothness.
Modify Z-Score length to control sensitivity.
Tune band length and multipliers for volatility adaptation.
Switch between Trend and Valuation modes depending on strategy.
Personalize visuals using preset or custom color palettes.
━━━━━━━━━━━━━━━
Alerts
━━━━━━━━━━━━━━━
Bullish condition when Z-Score > 0
Bearish condition when Z-Score < 0
Overvalued and undervalued valuation alerts
⚠️ Disclaimer
This indicator is intended for technical analysis and educational purposes only. It does not guarantee profitable outcomes and should be used alongside other tools, confirmation methods, and sound risk management. The author is not responsible for any financial decisions made using this indicator.

Quality Detector (Buffett Style) + Beta [Solid]This indicator acts as an on-chart fundamental screener, designed to instantly evaluate the quality and financial health of a company directly on your price chart.
The concept is inspired by "Buffettology" principles: looking for large, profitable companies with low debt. Additionally, it includes a Beta calculation to assess market volatility risk.
The tool displays a panel in the bottom-right corner featuring four key metrics and a final verdict.
How it Works & Metrics Used
The script retrieves quarterly fundamental data ("FQ") and performs calculations to verify if the asset meets specific criteria.
1. Market Cap (Size)
What it is: The total market value of the company's outstanding shares.
Goal: To identify established, large-cap companies.
Default Threshold: Must be greater than $10 Billion.
2. ROE - Return on Equity (Quality)
What it is: A measure of financial performance calculated by dividing net income by shareholders' equity.
Goal: To find companies that are efficient at generating profits from shareholders' capital.
Default Threshold: Must be higher than 15%.
3. Total Debt to Equity (Health)
What it is: A ratio indicating the relative proportion of shareholders' equity and debt used to finance a company's assets.
Calculation: This script manually calculates this ratio by fetching TOTAL_DEBT and dividing it by TOTAL_EQUITY from fundamental data to ensure robustness across different symbols.
Goal: To ensure the company is not overly leveraged.
Default Threshold: Must be lower than 1.5.
4. Beta (Risk/Volatility)
What it is: A measure of a stock's volatility in relation to the overall market (S&P 500).
Calculation: It is calculated by comparing the asset's returns against SPY (S&P 500 ETF) returns over a 252-day period (approx. 1 trading year).
Goal: To understand if the stock is more volatile (Beta > 1) or less volatile (Beta < 1) than the market.
Note: Beta does not affect the final "Quality" score but serves as an extra risk indicator, highlighting in orange if Beta > 1.
The Verdict (Scoring System)
The indicator assigns a score from 0 to 3 based on the first three fundamental metrics (Size, ROE, and Debt/Equity).
If a metric passes the threshold, it gets a green background and +1 point.
If it fails, it gets a red background.
Final Verdict:
💎 QUALITY GEM: The company passed all 3 fundamental checks (Score = 3/3).
⚠️ DISCARD: The company failed one or more fundamental checks.
Settings
You can customize the thresholds to fit your own investment strategy in the indicator settings:
Minimum Market Cap (in Billions).
Minimum ROE (%).
Maximum Debt/Equity Ratio.
Disclaimer: This tool is for informational and educational purposes only. It relies on third-party fundamental data which may sometimes be delayed or unavailable. Do not base investment decisions solely on this indicator.

RSI Candles Pro [MTF]**RSI Candles Pro**
## **Overview**
The RSI Candles Pro indicator provides an advanced framework for visualizing RSI momentum through candlestick representation, structural analysis, and multi-dimensional confirmation signals. Unlike conventional RSI oscillators that display only a line plot, this system transforms RSI into a complete OHLC candlestick chart with integrated strength metrics, structural break detection, divergence analysis, and dynamic support/resistance mapping.
Each element adapts continuously to RSI behavior, offering traders a living map of momentum shifts, structural changes, and reversal potential. The indicator doesn't simply show overbought/oversold conditions—it quantifies momentum strength, tracks structural breaks, detects price-RSI divergences, and projects key inflection levels with precision.
The result is a comprehensive, momentum-aware representation of market structure:
- **RSI OHLC Candles** visualize momentum direction, strength, and conviction through candlestick patterns with dynamic color intensity.
- **Strength Scoring System** quantifies momentum conviction using distance from neutral, momentum acceleration, and candle body characteristics.
- **RSI Structure Lines & Zones** connect swing highs and lows, creating visual support/resistance zones within RSI space.
- **Break of Structure (BOS) Detection** identifies decisive momentum shifts when RSI breaks previous structural levels, complete with projected support/resistance lines.
- **Auto Pivot Horizontal Lines** dynamically map key RSI levels where price repeatedly reacts, serving as momentum inflection zones.
- **Divergence Detection** captures classic bullish and bearish divergences between price action and RSI behavior, flagging potential reversal conditions.
Unlike static RSI line plots or simple zone highlighting, RSI Candles Pro fuses candlestick visualization with structural awareness, strength quantification, and divergence analysis to provide a clear, multi-dimensional picture of momentum dynamics and potential turning points.
---
## **Theoretical Foundation**
The RSI Candles Pro indicator builds on principles of **momentum oscillation theory**, **structural market analysis**, and **divergence recognition**—concepts widely used by technical analysts to identify trend strength, exhaustion, and reversal conditions.
Standard RSI indicators display momentum as a single line crossing threshold levels, but this approach ignores critical dimensions: **momentum strength**, **structural context**, and **rate of change acceleration**. This indicator recognizes that RSI behavior can be decomposed into candlestick patterns that reveal conviction, hesitation, and reversal signals just as price candles do.
At its core are six interacting components:
### **1. RSI OHLC Candlestick Construction**
The indicator calculates RSI independently for open, high, low, and close prices within each bar, creating true RSI candlesticks rather than a single-line plot. This reveals:
- **Momentum direction** (bullish vs. bearish candles)
- **Momentum volatility** (wick length shows RSI range)
- **Momentum conviction** (body size indicates decisiveness)
- **Indecision patterns** (doji candles signal momentum exhaustion)
### **2. Strength Scoring Algorithm**
A composite strength score quantifies momentum conviction by analyzing three factors:
- **Distance from neutral (50 level)**: Greater distance indicates stronger directional bias
- **Momentum acceleration**: Rate of RSI change over recent bars reveals building or fading momentum
- **Body-to-range ratio**: Larger bodies relative to total candle range show decisive momentum vs. indecision
This produces a 0-100 strength score that dynamically adjusts candle transparency—strong moves appear vibrant, weak moves appear faded—providing instant visual feedback on momentum quality.
### **3. RSI EMA with Slope-Sensitive Coloring**
A smoothed exponential moving average of RSI serves as a trend filter, but with a critical enhancement: **dynamic color coding based on slope direction**. When the RSI EMA slopes upward, it displays in bullish color; when sloping downward, bearish color. This provides instant trend context and filters noise from raw RSI fluctuations.
### **4. RSI Structural Framework**
The indicator identifies swing highs and lows within RSI space using pivot detection, then:
- **Connects consecutive swings with lines** to visualize RSI trend channels
- **Creates shaded zones between swings** to highlight support/resistance regions in momentum space
- **Implements cooloff periods** to prevent redundant signals and maintain chart clarity
These structural elements reveal whether RSI is forming higher highs/higher lows (bullish structure) or lower highs/lower lows (bearish structure).
### **5. Break of Structure (BOS) Logic**
The system detects **decisive momentum shifts** when RSI breaks previous structural levels in alignment with RSI EMA trend direction:
- **Bullish BOS**: RSI breaks above previous swing high while RSI EMA is rising
- **Bearish BOS**: RSI breaks below previous swing low while RSI EMA is falling
When BOS occurs, the indicator automatically:
- Places a BOS label at the breakout point
- Projects a support/resistance line forward (20+ bars)
- Creates a shaded zone around the S/R level
- Provides tooltip information with exact S/R values
This gives traders actionable levels where momentum shifts may be defended or rejected.
### **6. Price-RSI Divergence Detection**
Classic divergence analysis identifies conditions where price and momentum disagree:
- **Bullish Divergence**: Price makes lower low, RSI makes higher low (momentum refusing to confirm weakness)
- **Bearish Divergence**: Price makes higher high, RSI makes lower high (momentum weakening despite price strength)
Divergences often precede significant reversals, providing early warning signals before price structure breaks.
### **7. Auto Pivot Horizontal Lines**
The indicator dynamically tracks historical RSI pivot points and plots horizontal lines at these levels, extended forward in time. These act as **momentum support/resistance zones**—levels where RSI has repeatedly turned in the past and may respect again in the future. The system:
- Detects unique pivot levels (filtering duplicates within 2 RSI points)
- Maintains a configurable maximum number of lines per side
- Optionally extends lines infinitely right for persistent reference
- Labels each line with its exact RSI value
By integrating these elements, the indicator provides both micro-level momentum analysis (individual candle strength) and macro-level structural context (swing patterns, BOS events, divergences, key levels), maintaining clarity while revealing momentum dynamics in real time.
---
## **How It Works**
The RSI Candles Pro indicator operates through layered processing stages:
### **Stage 1: RSI OHLC Calculation**
- Four independent RSI calculations are performed for each bar: RSI(open), RSI(high), RSI(low), RSI(close)
- These are combined to form RSI candlesticks:
- **RSI Open/Close**: Determines candle body direction and size
- **RSI High**: Highest value among all four RSI calculations becomes upper wick
- **RSI Low**: Lowest value among all four RSI calculations becomes lower wick
- This creates a complete candlestick representation in RSI space that mirrors price action behavior
### **Stage 2: Strength Score Computation**
For each RSI candle, a composite strength score is calculated:
This score drives **dynamic transparency**: strong moves (score > 70) display with high opacity, weak moves (score < 40) display faded, providing instant visual feedback on momentum quality.
### **Stage 3: RSI EMA Trend Filter**
- An exponential moving average smooths RSI values over a configurable period (default 9)
- The slope is calculated: `rsiEmaSlope = rsiEMA - rsiEMA `
- Dynamic coloring:
- **Positive slope** → Green/Bullish color
- **Negative slope** → Red/Bearish color
- **Flat slope** → Gray/Neutral color
- This provides trend context and filters out noise from raw RSI oscillations
### **Stage 4: Structural Swing Detection**
- Swing highs and lows are identified using pivot detection with configurable lookback (default 5 bars left/right)
- **Cooloff mechanism** prevents redundant signals by requiring minimum bars between swings (default 8)
- When new swings are detected:
- Previous swing values are stored for BOS comparison
- Lines connect consecutive swings to visualize momentum structure
- Shaded boxes (zones) highlight the range between swings as support/resistance regions
### **Stage 5: Break of Structure (BOS) Analysis**
The system monitors RSI behavior relative to previous structural levels:
**Bullish BOS triggers when:**
1. RSI EMA slope is positive (uptrend filter)
2. Current RSI close exceeds previous swing high
3. Previous bar's RSI was below that swing high (confirms break)
4. Cooloff period has elapsed since last bullish BOS (default 10 bars)
**Bearish BOS triggers when:**
1. RSI EMA slope is negative (downtrend filter)
2. Current RSI close breaks below previous swing low
3. Previous bar's RSI was above that swing low (confirms break)
4. Cooloff period has elapsed since last bearish BOS
Upon BOS detection, the indicator automatically:
- Places a labeled marker at the breakout point
- Calculates S/R level with buffer (e.g., RSI low - 0.5 points for bullish BOS)
- Draws a dashed S/R line extending forward (configurable, default 20 bars)
- Creates a shaded S/R zone (±0.5 points from line)
- Adds an "S/R" label at the line's end
### **Stage 6: Auto Pivot Line Management**
- Pivot highs and lows are detected using a separate lookback period (default 5)
- When a new pivot forms:
- System checks if a similar level already exists (within 2 RSI points)
- If unique, adds a horizontal line at that RSI value
- Lines are stored in arrays with configurable maximum capacity (default 4 per side)
- Oldest lines are automatically removed when capacity is exceeded
- Optional labels display exact RSI values at pivot levels
### **Stage 7: Divergence Detection**
The system compares price pivot points with RSI pivot points:
**Bearish Divergence:**
- Price makes higher high compared to previous pivot high
- RSI makes lower high compared to previous RSI pivot high
- RSI must be above 50 (mid-level) to confirm overbought context
- Triangle-down marker placed above candle with "DIV" text
**Bullish Divergence:**
- Price makes lower low compared to previous pivot low
- RSI makes higher low compared to previous RSI pivot low
- RSI must be below 50 to confirm oversold context
- Triangle-up marker placed below candle with "DIV" text
### **Stage 8: Strength Dot Visualization**
Colored dots appear according to Delta Volume strength:
### **Stage 9: Real-Time Info Table**
Through these processes, the indicator creates a living, adaptive representation of RSI behavior that reveals both momentum strength and structural context in real time.
---
## **Interpretation**
The RSI Candles Pro indicator reframes momentum reading from simple overbought/oversold levels to structured awareness of momentum behavior:
### **Candle Patterns**
- **Large-bodied bullish candles (vibrant green)**: Strong, decisive bullish momentum—continuation likely
- **Large-bodied bearish candles (vibrant red)**: Strong, decisive bearish momentum—continuation likely
- **Small-bodied or doji candles (faded/gray)**: Indecision or momentum exhaustion—reversal possible
- **Long upper wicks**: Failed bullish momentum—rejection at resistance
- **Long lower wicks**: Failed bearish momentum—support holding
### **RSI EMA Trend Context**
- **RSI EMA rising (green)**: Momentum uptrend—favor bullish setups
- **RSI EMA falling (red)**: Momentum downtrend—favor bearish setups
- **RSI EMA flat (gray)**: Momentum consolidation—wait for directional clarity
### **Structural Analysis**
- **RSI making higher swing lows with rising EMA**: Bullish structure intact—look for dip-buying opportunities
- **RSI making lower swing highs with falling EMA**: Bearish structure intact—look for rally-selling opportunities
- **Shaded structure zones**: Key support/resistance in momentum space—expect reactions at these levels
### **Break of Structure Signals**
- **Bullish BOS + S/R line**: Momentum confirming upward shift—S/R line becomes support if price dips
- **Bearish BOS + S/R line**: Momentum confirming downward shift—S/R line becomes resistance if price rallies
- **S/R line break**: Momentum structure failing—potential reversal or deeper retracement
### **Pivot Lines**
- **Price approaching RSI pivot high**: Momentum resistance—watch for rejection or breakout
- **Price approaching RSI pivot low**: Momentum support—watch for bounce or breakdown
- **Multiple pivot lines clustered**: Strong momentum support/resistance zone—high-probability reaction area
### **Divergences**
- **Bullish divergence in oversold zone**: Momentum refusing to make new lows despite price weakness—reversal setup
- **Bearish divergence in overbought zone**: Momentum weakening despite price strength—reversal setup
- **Divergence + structure break**: High-conviction reversal signal—combined technical and momentum confirmation
### **Strength Dots**
- **Large dots**: High-conviction moves—reliable trend continuation signals
- **Small dots**: Low-conviction moves—increased reversal risk, avoid chasing
- **Diamond warnings in extremes**: Overextended conditions—prepare for mean reversion
### **Zone Background**
- **Red background (RSI > 70)**: Overbought—watch for bearish divergence or momentum exhaustion
- **Green background (RSI < 30)**: Oversold—watch for bullish divergence or momentum recovery
- **No background (30-70)**: Neutral zone—rely on structure and BOS for directional bias
---
## **Strategy Integration**
RSI Candles Pro integrates seamlessly into momentum-based and reversal trading systems:
### **Trend Continuation Strategies**
- **Entry trigger**: Bullish BOS in rising RSI EMA context with strong candle (large dot)
- **Confirmation**: Price respecting S/R line as support on pullback
- **Exit**: Bearish divergence or RSI candle indecision (doji) at pivot resistance
### **Reversal Strategies**
- **Setup**: Divergence forming in extreme zone (RSI > 70 or < 30)
- **Trigger**: RSI structure break opposite to prevailing trend (bearish BOS in uptrend)
- **Confirmation**: RSI EMA slope change + decisive candle in reversal direction
- **Entry**: On pullback to S/R line or pivot level
### **Momentum Fade Strategies**
- **Signal**: Small strength dots appearing in extreme zones
- **Setup**: RSI touching pivot resistance/support with indecision candle
- **Entry**: Opposite-direction candle with medium/large dot
- **Stop**: Beyond recent RSI structure level
### **Structure-Based Entries**
- **Align higher-timeframe RSI trend** (EMA slope direction)
- **Wait for lower-timeframe BOS** in alignment with higher trend
- **Enter on retest** of S/R line with strength confirmation (large dot)
- **Scale out** at next pivot level or divergence signal
### **Multi-Indicator Confluence**
Combine RSI Candles Pro with:
- **Price structure indicators** (Smart Money Concepts, market structure) for trade direction
- **Volume indicators** to confirm momentum with participation
- **Volatility indicators** (ATR, Bollinger Bands) for position sizing context
- **Institutional Zone Detector** for volume profile alignment—RSI BOS + price at VAL/VAH = high-conviction entry
### **Multi-Timeframe Coordination**
- **Higher timeframe** (4H-Daily): Identify RSI EMA trend direction and major structure
- **Lower timeframe** (15min-1H): Execute entries on BOS signals aligned with higher timeframe
- **Micro timeframe** (1-5min): Fine-tune entries using strength dots and pivot reactions
---
## **Technical Implementation Details**
### **Core Engine**
- **RSI OHLC calculation**: Four independent RSI computations per bar create candlestick representation
- **Strength scoring**: Multi-factor composite algorithm quantifies momentum conviction
- **Dynamic transparency**: Real-time opacity adjustment based on strength score
### **Structural Framework**
- **Pivot-based swing detection**: Configurable left/right bar lookback with cooloff mechanism
- **Line and zone visualization**: Connects consecutive swings with shaded support/resistance regions
- **Array-based storage**: Previous swing values preserved for BOS comparison logic
### **BOS Detection Engine**
- **Dual-condition logic**: Structure break + trend alignment (RSI EMA slope) required
- **Automatic S/R projection**: Lines, zones, and labels generated upon BOS events
- **Cooloff management**: Prevents signal spam during extended directional moves
### **Divergence System**
- **Price-RSI pivot comparison**: Detects higher-high/lower-high and lower-low/higher-low patterns
- **Zone filtering**: Divergences only trigger in appropriate zones (above/below 50)
- **Visual markers**: Triangle shapes with "DIV" text for instant recognition
### **Auto Pivot Management**
- **Dynamic level tracking**: Arrays store lines, values, and labels
- **Duplicate filtering**: Prevents redundant lines within 2 RSI points
- **Capacity control**: Automatic removal of oldest lines when maximum reached
- **Optional extension**: Lines can extend infinitely right for persistent reference
### **Performance Profile**
- **Lightweight computation**: Efficient pivot detection and array management
- **Real-time responsiveness**: Immediate updates on bar close
- **Scalable across timeframes**: Maintains clarity from 1-minute to daily charts
- **Configurable visual elements**: All features can be toggled for custom layouts
---
## **Optimal Application Parameters**
### **Timeframe Guidance**
**1-5 Minute Charts (Scalping):**
- RSI Length: 9-11 (faster response)
- RSI EMA Length: 5-7
- Structure Lookback: 3-4
- Pivot Lookback: 3-4
- Use Case: Micro momentum shifts, quick BOS entries
**15-60 Minute Charts (Intraday Swing):**
- RSI Length: 14 (standard)
- RSI EMA Length: 9
- Structure Lookback: 5
- Pivot Lookback: 5
- Use Case: Intraday structure breaks, divergence reversals
**4 Hour - Daily Charts (Position Trading):**
- RSI Length: 14-21
- RSI EMA Length: 13-21
- Structure Lookback: 7-10
- Pivot Lookback: 7-10
- Use Case: Major momentum shifts, high-timeframe divergences
### **Suggested Configuration (Default)**
- **RSI Length**: 14 (industry standard)
- **RSI EMA Length**: 9 (smooth but responsive)
- **Overbought Level**: 70
- **Oversold Level**: 30
- **Structure Lookback**: 5 bars
- **Structure Cooloff**: 8 bars
- **BOS Cooloff**: 10 bars
- **S/R Extension**: 20 bars
- **S/R Buffer**: 0.5 RSI points
- **Pivot Lookback**: 5 bars
- **Max Pivot Lines**: 4 per side
- **Divergence Lookback**: 5 bars
- Use strength dots as primary filter—require large dots for entries
- Rely heavily on divergences and structure zones
**Trending Markets:**
- Focus on BOS signals aligned with RSI EMA slope
- Use pivot lines as profit targets
- Ignore counter-trend divergences until RSI EMA changes slope
**Ranging Markets:**
- Emphasize divergences at extreme levels
- Trade bounces from pivot lines
- Reduce reliance on BOS signals (more false breaks)
---
## **Performance Characteristics**
### **High Effectiveness:**
- **Trending markets with clear momentum cycles**: RSI structure aligns with price structure for reliable BOS signals
- **Markets with defined swing patterns**: Pivot lines and structure zones provide accurate support/resistance
- **Divergence-prone assets**: Assets that respect momentum/price divergences (equities, major FX pairs)
- **Timeframes with sufficient volatility**: RSI candles show meaningful patterns when price moves decisively
### **Reduced Effectiveness:**
- **Choppy, sideways markets**: RSI oscillates around 50 with no structural pattern, generating false BOS signals
- **Low-liquidity assets**: Erratic price action creates unreliable RSI swings
- **News-driven volatility spikes**: Sudden moves invalidate structure and create whipsaws
- **Extremely low timeframes (< 1 minute)**: Noise overwhelms signal, structure breaks lack follow-through
### **Optimal Market Conditions:**
- **Clear momentum phases** with defined RSI EMA trend
- **Respect for previous swing levels** in RSI space
- **Volume participation** during BOS events (combine with volume indicator)
- **Alignment between RSI structure and price structure**
---
## **Integration Guidelines**
### **Confluence Framework**
Combine RSI Candles Pro with:
1. **Volume analysis** (Institutional Zone Detector, volume profile) to confirm RSI BOS with volume participation
2. **Price structure** (Smart Money Concepts, order blocks) to align RSI momentum with price levels
3. **Trend indicators** (moving averages, Supertrend) for higher-timeframe directional bias
4. **Volatility indicators** (ATR, Bollinger Bands) for stop-loss and profit target placement
### **Directional Control**
- **Never trade against RSI EMA slope** unless high-conviction divergence present
- **Require BOS alignment** with RSI EMA direction for continuation trades
- **Wait for RSI EMA slope change** before taking counter-trend reversals
### **Risk Calibration**
- **Stop-loss placement**: Beyond recent RSI structure swing (converted to price)
- **Position sizing**: Larger positions for strong candles (large dots) at BOS events
- **Profit targets**: Next pivot line level or opposite-zone boundary (70/30)
- **Trail stops**: Use S/R lines as trailing stop levels after BOS
### **Multi-Timeframe Synergy**
1. **Check higher timeframe** (3x-5x current): RSI EMA slope and major structure
2. **Identify current timeframe**: BOS events and divergences
3. **Execute on lower timeframe** (1/3x-1/5x current): Strength-confirmed entries at pivot levels
4. **Align all timeframes**: Only trade when RSI structure agrees across timeframes
### **Alert Strategy**
Enable alerts for:
- **RSI BOS events**: Immediate notification of momentum structure breaks
- **Divergences**: Early warning of potential reversals
- **Extreme zone entries**: RSI crossing 70/30 levels
- **RSI EMA trend changes**: Shifts in momentum trend direction
---
## **Disclaimer**
The RSI Candles Pro indicator is a professional-grade momentum visualization and structural analysis tool. It is not predictive or guaranteed profitable; performance depends on parameter tuning, market regime, and disciplined execution.
**Key Considerations:**
- RSI is a **derivative indicator** (calculated from price), not a leading indicator—it confirms momentum but does not predict future price
- **Divergences can persist** for extended periods; early entries may require multiple attempts
- **BOS signals may fail** in choppy markets; always use stop-losses and risk management
- **Optimal parameters vary** by asset, timeframe, and volatility regime—backtesting recommended
- **No indicator works in isolation**; combine with price action, volume, and market context
**Best Practices:**
- Paper trade new configurations before risking capital
- Maintain a trading journal to identify which signals work best for your style
- Adjust cooloff periods and lookback lengths based on asset characteristics
- Use in conjunction with fundamental analysis and broader market context
- Never risk more than 1-2% of capital per trade, regardless of indicator signals
This indicator is designed to enhance decision-making, not replace it. Traders should integrate RSI Candles Pro into a comprehensive analytical framework that includes price structure, volume analysis, and risk management protocols. Success requires consistent application of tested strategies, emotional discipline, and continuous adaptation to changing market conditions.

BB/KC Squeeze Channels (v6)Technical Specification for the BB/KC Squeeze Volatility Indicator in Algorithmic Cryptocurrency Trading
I. Theoretical Foundations of Volatility Dynamics
The "Contraction-Expansion" Principle (Volatility Contraction/Expansion)
The fundamental analysis of market volatility dynamics relies on the principle popularized by John Bollinger: periods of low volatility are inevitably followed by periods of high volatility. This phenomenon, known as the cyclical nature of volatility, is the cornerstone of trading strategies based on range breakouts (Breakout Strategy). In the context of technical analysis, volatility contraction manifests as a consolidation phase where the trading range narrows, preceding a strong, directional price impulse.
The essence of volatility contraction lies in a phase of market equilibrium that is inherently unstable. Most often, this reflects the covert activities of large market participants who are either accumulating or distributing a significant volume of the asset. These actions occur within a narrow price corridor to avoid sharp price movements until the entire position is acquired. As a result, activity decreases, the range narrows, and the market accumulates "energy" for the subsequent large-scale expansion. For the cryptocurrency market, characterized by high impulsivity and a tendency toward sharp trending moves, accurately identifying the deep contraction phase becomes a powerful algorithmic predictor.
Identifying Prerequisites: Distinguishing Pre-Breakout Contraction
To build a reliable indicator, it is crucial to distinguish a true pre-breakout squeeze from other types of volatility reduction that do not lead to a strong impulse. Specifically, volatility, measured by the Average True Range (ATR), will always decline after the completion of a strong vertical movement, as the market enters a pullback or deceleration phase. Such a decline is post-impulse and does not necessarily signal an imminent breakout.
It is necessary to find signs of abnormally low volatility that occurs precisely in the consolidation phase. The optimal time to look for a Squeeze signal is the formation of a distinct sideways channel. In this phase, the middle line of the channel indicator (e.g., EMA or SMA) should be relatively horizontal. This confirms that the market is currently in a ranging state (absence of a strong current trend), not in a deceleration phase after a trend. Therefore, the Squeeze indicator algorithm must include a check for confirmed sideways movement (e.g., through analyzing the slope of the middle line or its statistical deviation from the horizontal over the last X periods). Only abnormally low volatility during a range can be classified as a high-confidence pre-breakout contraction.
II. Instrument Selection: Justification for the Composite BB/KC Squeeze Approach
For effective algorithmic determination of the extreme contraction phase, it is necessary to use an indicator that combines the advantages of the two most reliable methods for measuring volatility: Bollinger Bands and Keltner Channels.
Comparative Analysis of Volatility Indicators
| Indicator | Base Metric | Volatility Response | Primary Role in Squeeze |
|---|---|---|---|
| Bollinger Bands (BB) | Standard Deviation (SD) | Fast, Highly Sensitive | Contraction sensor, Early breakout signal |
| Keltner Channels (KC) | Average True Range (ATR) | Smooth, Noise Filtering | Defines stable range, Filters false signals |
Bollinger Bands (BB)
Bollinger Bands are based on the Standard Deviation (SD) of the price from a moving average. This statistical metric makes BB highly sensitive, as they quickly react to sudden changes in volatility. Due to this sensitivity, BB are ideal for early registration of a contraction and for generating the breakout signal. However, their high sensitivity is also a drawback, as it can lead to false signals and premature expansion during market noise.
Keltner Channels (KC)
Keltner Channels, in the modern version developed by Linda Raschke, use the Average True Range (ATR) to calculate the channel width. ATR represents the averaged true range of fluctuations, which provides a smoother and more stable measure of volatility. KC react to market changes slower than BB, but their smoothness allows for better filtering of false signals and determination of the true direction of movement. Unlike fixed-width price channels or percentage envelopes, which perform poorly in dynamic environments, BB and KC automatically adapt to market conditions.
The Squeeze Mechanism: Synergy of Instruments
The BB/KC Squeeze indicator uses the synergy of BB and KC to achieve maximum accuracy in identifying the accumulation phase.
The technical Squeeze condition (Squeeze ON) is defined when the fast and statistically-oriented Bollinger Bands (BB) are inside the wider and smoother Keltner Channels (KC). This state represents quantitative confirmation of extremely low volatility.
In standard settings, BB use a multiplier of 2.0 for Standard Deviation (SD), and KC use a multiplier of 1.5 for ATR. For the statistical width of BB (based on price deviation from the average) to narrow inside the width of KC (based on the averaged range), the current statistical deviation of the price must fall to abnormally low values relative to the historical average range of fluctuations. This is not just low volatility, but its extreme contraction, indicating maximum accumulation of potential energy before an impulse.
III. Quantitative Analysis: How Much, Why, and How Volatility Contracts
How Much: Mathematical Definition of the Degree of Contraction
The degree of volatility contraction before a breakout is measured through a strict mathematical condition that ensures the current volatility is significantly below its averaged historical value.
The Squeeze Condition (Squeeze ON) requires both of the following mathematical formulas to be true :
To understand how much the movement should contract, we must consider the channel width formulas:
* Bollinger Bands Width (\text{BB}_{\text{Width}}):
\text{KC}_{\text{Width}} = 2 \times (\text{ATR} \times 1.5) = 3.0 \times \text{ATR}$$
The Squeeze ON state means that \text{BB}_{\text{Width}} < \text{KC}_{\text{Width}}. This condition is equivalent to \text{SD} \times 4.0 < \text{ATR} \times 3.0. As a result, the current Standard Deviation (SD) must fall below 75% of the Average True Range (ATR) for the contraction to be registered. This requirement for SD to decrease to a level significantly below ATR is the criterion for identifying the deep market calm that serves as the energy base for the subsequent directional movement.
Why and How: Qualitative Signs
Volatility decreases because large market participants are slowly and covertly accumulating positions. They keep the price within a narrow range to fully acquire the necessary volume before allowing the price to impulsively exit consolidation. This creates a sideways movement phase, minimizing risks for the trader and enabling timely tracking of a bullish or bearish breakout.
To enhance the algorithm's reliability and prevent entry into false ranges, the following qualitative signs accompanying a true squeeze must be considered:
* Squeeze Duration: The longer the price remains in the Squeeze ON state, the more energy is accumulated. Experience suggests a minimum duration of 4–8 periods. Extended contraction periods (over 10–12 bars) often precede the strongest impulsive movements in the crypto market.
* Price Position: During the contraction phase, the price should remain close to the middle line (EMA/SMA). This confirms that the market is in equilibrium, and accumulation is occurring around the "fair" price of the current range.
* Momentum Context: The volatility indicator (BB/KC) determines when a move will happen, but not its direction. To predict the direction (prerequisite), a momentum component must be used (e.g., a histogram, as in the TTM Squeeze variant ). The appearance of positive momentum during the contraction, even without price movement, signals potential bullish strength, increasing the likelihood of an upward breakout.
Squeeze State Logic Table
| State | Mathematical Condition (BB vs KC) | Market Interpretation |
|---|---|---|
| Squeeze ON | (\text{BB}_{\text{Upper}} < \text{KC}_{\text{Upper}}) AND (\text{BB}_{\text{Lower}} > \text{KC}_{\text{Lower}}) | Extreme volatility contraction, accumulation phase, breakout pending. |
| Squeeze OFF | \text{BB}_{\text{Upper}} \ge \text{KC}_{\text{Upper}} OR \text{BB}_{\text{Lower}} \le \text{KC}_{\text{Lower}} | Normal volatility, trending movement, or unstable range. |
IV. Technical Specification: Step-by-Step Algorithm for the Squeeze Indicator (BB/KC)
This algorithm represents the sequence of steps required to code the indicator, which captures the contraction state and generates breakout signals.
1. Initialization and Calculation of Basic Values
* Define Period N: Determine the period N (recommended value N=20) for calculating the moving averages, ATR, and Standard Deviation (SD).
* Calculate True Range (TR): For each bar, calculate \text{TR} as the maximum value of three metrics: (High – Low), \text{Abs}(\text{High} - \text{Close}_{\text{prev}}), \text{Abs}(\text{Low} - \text{Close}_{\text{prev}}).
2. Calculation of Keltner Channel (KC) Components
* Calculate KC Middle Line (EMA): Calculate the Exponential Moving Average (EMA) of the closing price (\text{Close}) over period N.
* Calculate ATR: Calculate the Average True Range (ATR) as the moving average of \text{TR} over period N.
* Calculate KC Boundaries: Calculate the Upper and Lower KC lines, using the ATR multiplier Y (recommended Y=1.5 ):
* * 3. Calculation of Bollinger Band (BB) Components
* Calculate BB Middle Line (SMA): Calculate the Simple Moving Average (SMA) of the closing price (\text{Close}) over period N.
* Calculate SD: Calculate the Standard Deviation (SD) of the closing price over period N.
* Calculate BB Boundaries: Calculate the Upper and Lower BB, using the SD multiplier X (recommended X=2.0 ):
* * 4. Algorithm for Determining the "Squeeze" State
* Check Squeeze ON Condition: For the current bar, check if both conditions are met: \text{BB}_{\text{Upper}} < \text{KC}_{\text{Upper}} AND \text{BB}_{\text{Lower}} > \text{KC}_{\text{Lower}}.
* Assign State: IF both conditions in step 9 are true, THEN assign the variable \text{SqueezeState} the value \text{ON} (e.g., 1). ELSE assign the value \text{OFF} (e.g., 0).
5. Algorithm for Generating Breakout Signals
* Identify Trigger: Check if \text{SqueezeState} has changed from \text{ON} to \text{OFF} on the current bar. This signifies that volatility has expanded after the contraction period.
* Bullish Breakout Signal: IF \text{SqueezeState}_{\text{prev}} = \text{ON} AND \text{SqueezeState}_{\text{current}} = \text{OFF}, AND the closing price (\text{Close}) of the current bar is above \text{BB}_{\text{Upper}}, THEN generate a BUY (Breakout Long) signal.
* Bearish Breakout Signal: IF \text{SqueezeState}_{\text{prev}} = \tex (start_span) (end_span)t{ON} AND \text{SqueezeState}_{\text{current}} = \text{OFF}, AND the closing price (\text{Close}) of the current bar is below \text{BB}_{\text{Lower}}, THEN generate a SELL (Breakout Short) signal.
* Additional Momentum Filtering: To increase reliability, the breakout signal should be valid only IF the breakout occurs in the direction confirmed by a momentum indicator (e.g., if Momentum > 0 for a Bullish breakout, and Momentum < 0 for a Bearish breakout).
The Role of Momentum in the Algorithm
A key addition to the volatility indicator is the momentum component. Defining the Squeeze ON/OFF state helps understand the potential for movement, but not its direction. The momentum indicator (often implemented as a histogram, as in TTM Squeeze ) measures whether accumulation of buying or selling pressure occurs during the contraction phase. Therefore, the indicator must include a sub-component that measures this pressure. Using momentum in conjunction with the BB breakout ensures that entry occurs not just after volatility expansion, but after expansion in a confirmed direction, significantly reducing the number of false breakouts.
V. Parameters, Optimization, and Nuances for the Cryptocurrency Market
Adapting Standard Settings (20, 2.0, 1.5)
The standard parameters N=20, X_{\text{BB}}=2.0, and Y_{\text{KC}}=1.5 are designed for stock markets and provide a reliable starting point. However, the high volatility and dynamics of the cryptocurrency market require fine-tuning to optimize performance.
1. Optimization of Period N
Reducing the period N (e.g., to 18 or 14) on lower timeframes (1-hour and below) increases the indicator's sensitivity to local, fast contractions, which is useful for scalping. However, this may also generate more signals, including false ones. For medium-term trading strategies (4h, Daily), a period of N=20 or N=21 provides an optimal balance between sensitivity and noise filtering.
2. Optimization of Multiplier Y_{\text{KC}}
The Keltner Channel multiplier (Y) defaults to 1.5. KC are smoother and more stable due to the use of ATR. If backtesting shows the indicator generates too many false Squeeze ON signals, it may indicate that the KC channel is too narrow. In this case, a slight increase in multiplier Y (e.g., to 1.6 or 1.7) widens the KC. This requires an even more extreme drop in Standard Deviation for the BB to narrow inside the KC, thereby increasing the strictness and reliability of the Squeeze ON signal.
Importance of Timeframe Selection
While some indicators like KC and BB show higher effectiveness in trending conditions for trading off channel boundaries , the Squeeze Play strategy is fundamentally different. It deliberately seeks a range (volatility contraction) with the goal of catching the start of a new strong trend.
In the cryptocurrency market, false breakouts and market noise (chop) can be particularly intense on low timeframes. Therefore, for the Squeeze strategy, it is recommended to use timeframes where consolidation is cleanest: 4-hour, Daily, or Weekly charts for major crypto pairs like BTC/USD or ETH/USD. On lower timeframes, multi-timeframe confirmation must be implemented, for example, using a trend filter from a higher timeframe.
VI. Strategic Application of Squeeze Play and Filtering
Using Momentum for Direction Determination
As noted, the volatility indicator (BB/KC) is not a directional indicator. The squeeze function (Squeeze ON) only identifies a high probability of a strong movement. Therefore, successful trading requires the integration of Momentum.
The breakout should be used as a trigger, but the direction must be confirmed by Momentum. For example, a BUY signal should only be generated if two conditions are met:
* Exit from the Squeeze ON state and the closing price breaking above the upper BB (\text{Close} > \text{BB}_{\text{Upper}}).
* The momentum indicator confirms upward pressure (Momentum value is positive).
This approach prevents entries into false breakouts where volatility expands but not in the direction of the accumulated market pressure.
Risk and Position Management
Since the Keltner Channel is based on ATR, which is a dynamic measure of volatility , ATR should be used for setting the Stop-Loss (SL) in the algorithmic strategy.
* Stop-Loss (SL) Setting: It is recommended to set the SL at a level determined by 1 \times \text{ATR} below the middle line (EMA/SMA) or beyond the KC boundary opposite the breakout. Using ATR ensures that the SL dynamically adapts to the current volatility, avoiding overly tight stops during periods of normal range.
* Take-Profit (TP) Setting: Since the goal of Squeeze Play is to catch a strong directional movement, the take-profit can be set based on a fixed Risk/Reward ratio (e.g., 2:1 or 3:1) or based on the price exiting the KC boundaries. Breaking the KC often indicates an extreme price move and can serve as a point for partial or full profit taking.
Filtering Against False Signals in a Range
The main drawback of breakout trading is the high percentage of false signals in wide but non-directional ranges. Using the composite BB/KC Squeeze indicator effectively addresses this problem.
KC, being based on smoothed ATR, is less susceptible to short-term volatility spikes than BB. The Squeeze filter requires the sensitive BB to narrow inside the smoothed KC. This ensures that we enter only those breakouts that were preceded by a prolonged and abnormally low volatility phase. The breakout must be confirmed by the price breaking the BB after the Squeeze ON state ends, signaling a sustained volatility expansion rather than a brief price spike.
VII. Conclusion
The analysis confirms that the user's observation about the relationship between volatility contraction and subsequent strong movements is a fundamentally sound principle, the best implementation of which in the cryptocurrency market is achieved using the composite BB/KC Squeeze indicator.
This indicator provides a precise quantitative definition of "how much" volatility must contract (SD must fall below 75% of ATR) and includes the necessary qualitative prerequisites ("why and how" — consolidation, confirmed by momentum). The presented step-by-step algorithm provides the technical foundation for coding a highly effective tool that identifies accumulation phases and generates breakout signals, adapted to the dynamics of the crypto market. The inclusion of momentum-based filtering and proper risk management tied to ATR are key factors for transitioning from a pure indicator to a profitable trading strategy.
Техническая Спецификация Индикатора Волатильности BB/KC Squeeze для Алгоритмической Торговли Криптовалютами
I. Теоретические Основы Динамики Волатильности
Принцип "Сжатие-Расширение" (Volatility Contraction/Expansion)
Фундаментальный анализ динамики рыночной волатильности опирается на принцип, популяризированный Джоном Боллинджером: периоды низкой волатильности неизбежно сменяются периодами высокой волатильности. Это явление, известное как цикличность волатильности, является краеугольным камнем торговых стратегий, основанных на пробое диапазона (Breakout Strategy). В контексте технического анализа сжатие волатильности проявляется как фаза консолидации, в которой торговый диапазон сужается, предшествуя сильному, направленному ценовому импульсу.
Смысл контракции волатильности заключается в фазе рыночного равновесия, которое, однако, является неустойчивым. Чаще всего это отражает скрытую деятельность крупных участников, которые либо накапливают (аккумуляция), либо распределяют (дистрибуция) значительный объем актива. Эти действия происходят в узком ценовом коридоре, чтобы избежать резкого движения цены, пока позиция не будет полностью набрана. В результате активность падает, диапазон сужается, и рынок накапливает «энергию» для последующего масштабного расширения. Для криптовалютного рынка, который характеризуется высокой импульсивностью и склонностью к резким трендовым движениям, точная идентификация фазы глубокого сжатия становится мощным алгоритмическим предиктором.
Идентификация Предпосылок: Отличие Пред-пробойного Сжатия
Для построения надежного индикатора критически важно уметь отличать истинное пред-пробойное сжатие от других типов снижения волатильности, которые не ведут к сильному импульсу. В частности, волатильность, измеряемая, например, индикатором Average True Range (ATR), всегда будет снижаться после завершения сильного вертикального движения, поскольку рынок переходит в фазу отката или замедления. Такое снижение является пост-импульсным и не обязательно сигнализирует о скором пробое.
Требуется найти признаки аномально низкой волатильности, которая возникает именно в фазе консолидации. Оптимальный момент для поиска сигнала Сжатия — это возникновение четкого бокового канала. В этой фазе средняя линия канального индикатора (например, EMA или SMA) должна быть относительно горизонтальной. Это подтверждает, что рынок в данный момент находится в состоянии рейнджа (отсутствие сильного текущего тренда), а не в фазе замедления после тренда. Таким образом, в алгоритм индикатора Squeeze необходимо заложить проверку на подтверждение бокового движения (например, через анализ наклона средней линии или ее статистического отклонения от горизонтали за последние X периодов). Только аномально низкая волатильность в фазе рейнджа может быть квалифицирована как высоконадежное пред-пробойное сжатие.
II. Выбор Инструмента: Обоснование Композитного Подхода BB/KC Squeeze
Для эффективного алгоритмического определения фазы экстремального сжатия необходимо использовать индикатор, который комбинирует преимущества двух наиболее надежных методов измерения волатильности: Полос Боллинджера и Каналов Кельтнера.
Сравнительный Анализ Индикаторов Волатильности
Полосы Боллинджера (Bollinger Bands, BB)
Полосы Боллинджера основаны на Стандартном Отклонении (SD) цены от скользящей средней. Эта статистическая метрика делает BB высокочувствительными, поскольку они быстро реагируют на внезапные изменения волатильности. Благодаря этой чувствительности, BB идеально подходят для ранней регистрации начавшегося сжатия и для генерации сигнала пробоя. Однако их высокая чувствительность также является недостатком, так как она может приводить к ложным срабатываниям и преждевременному расширению в условиях рыночного шума.
Каналы Кельтнера (Keltner Channels, KC)
Каналы Кельтнера, в современной версии, разработанной Линдой Рашке, используют Average True Range (ATR) для расчета ширины канала. ATR представляет собой усредненный истинный диапазон колебаний, что обеспечивает более сглаженную и устойчивую меру волатильности. KC реагируют на изменения рынка медленнее, чем BB, но их плавность позволяет лучше фильтровать ложные сигналы и определять истинное направление движения. В отличие от ценовых каналов с фиксированной шириной или процентными конвертами, которые плохо работают в динамичных средах, BB и KC автоматически адаптируются к рыночным условиям.
Механизм Squeeze: Синергия Инструментов
Индикатор BB/KC Squeeze использует синергию BB и KC для достижения максимальной точности в идентификации фазы накопления.
Техническое условие Сжатия (Squeeze ON) определяется, когда быстрые и статистически ориентированные Полосы Боллинджера (BB) оказываются внутри более широких и сглаженных Каналов Кельтнера (KC). Это состояние представляет собой количественное подтверждение экстремально низкой волатильности.
В стандартных настройках BB используют множитель 2.0 от Стандартного Отклонения (SD), а KC используют множитель 1.5 от ATR. Для того чтобы статистическая ширина BB (основанная на отклонении цены от средней) сузилась внутрь ширины KC (основанной на усредненном диапазоне), текущее статистическое отклонение цены должно упасть до аномально низких значений по отношению к историческому среднему диапазону колебаний. Это не просто низкая волатильность, а ее экстремальное сокращение, указывающее на максимальное накопление потенциальной энергии перед импульсом.
Таблица Сравнения Ключевых Индикаторов Волатильности
| Индикатор | Базовая Метрика | Реакция на Волатильность | Основная Роль в Squeeze |
|---|---|---|---|
| Bollinger Bands (BB) | Стандартное Отклонение (SD) | Быстрая, Высокочувствительная | Датчик сжатия, Ранний сигнал пробоя |
| Keltner Channels (KC) | Average True Range (ATR) | Плавная, Фильтрация шума | Определение устойчивого диапазона, Фильтр ложных сигналов |
III. Количественный Анализ: На Сколько, Почему и Как Сокращается Волатильность
На Сколько: Математическое Определение Степени Сжатия
Степень сокращения волатильности перед пробоем измеряется через строгое математическое условие, которое обеспечивает, что текущая волатильность значительно ниже ее усредненного исторического значения.
Условие Сжатия (Squeeze ON) требует выполнения обеих следующих математических формул :
Для понимания того, на сколько должно сократиться движение, необходимо рассмотреть формулы ширины каналов:
* Ширина Полос Боллинджера (\text{BB}_{\text{Width}}):
\text{KC}_{\text{Width}} = 2 \times (\text{ATR} \times 1.5) = 3.0 \times \text{ATR}$$
Состояние Squeeze ON означает, что \text{BB}_{\text{Width}} < \text{KC}_{\text{Width}}. Это условие эквивалентно \text{SD} \times 4.0 < \text{ATR} \times 3.0. В результате, текущее стандартное отклонение (SD) должно упасть ниже 75% от усредненного истинного диапазона (ATR), чтобы сжатие было зарегистрировано. Такое требование к снижению SD до уровня, значительно ниже ATR, является критерием для идентификации глубокого покоя рынка, который служит энергетической базой для последующего направленного движения.
Почему и Как: Качественные Признаки
Снижение волатильности происходит потому, что крупные участники рынка медленно и скрытно накапливают позиции. Они поддерживают цену в узком диапазоне, чтобы полностью набрать необходимый объем, прежде чем позволить цене импульсивно выйти из консолидации. Это создает фазу бокового движения, минимизируя риски для трейдера и позволяя оперативно отследить «бычий» или «медвежий» прорыв.
Для повышения надежности алгоритма и предотвращения входа в ложные диапазоны, необходимо учитывать следующие качественные признаки, сопровождающие истинное сжатие:
* Длительность Сжатия: Чем дольше цена находится в состоянии Squeeze ON, тем больше энергии накапливается. Опыт показывает, что минимальная длительность должна составлять 4–8 периодов. Длительные периоды сжатия (более 10–12 баров) часто предшествуют наиболее сильным импульсным движениям на крипторынке.
* Положение Цены: Во время фазы сжатия цена должна находиться в непосредственной близости к средней линии (EMA/SMA). Это подтверждает, что рынок находится в состоянии равновесия, и накопление происходит вокруг "справедливой" цены текущего диапазона.
* Контекст Моментума: Индикатор волатильности (BB/KC) определяет когда произойдет движение, но не его направление. Для предсказания направления (признак) необходимо использовать компонент моментума (например, гистограмму, как в варианте TTM Squeeze ). Появление положительного моментума во время сжатия, даже при отсутствии движения цены, является признаком потенциальной бычьей силы, усиливающей вероятность пробоя вверх.
Логика Определения Состояния "Сжатия" (Squeeze State Logic)
| Состояние | Математическое Условие (BB vs KC) | Интерпретация Рынка |
|---|---|---|
| Squeeze ON | (\text{BB}_{\text{Upper}} < \text{KC}_{\text{Upper}}) И (\text{BB}_{\text{Lower}} > \text{KC}_{\text{Lower}}) | Экстремальная контракция волатильности, фаза накопления, ожидание прорыва. |
| Squeeze OFF | \text{BB}_{\text{Upper}} \ge \text{KC}_{\text{Upper}} ИЛИ \text{BB}_{\text{Lower}} \le \text{KC}_{\text{Lower}} | Нормальная волатильность, трендовое движение или неустойчивый диапазон. |
IV. Техническая Спецификация: Пошаговый Алгоритм Индикатора Squeeze (BB/KC)
Данный алгоритм представляет собой последовательность шагов, необходимых для кодирования индикатора, фиксирующего состояние сжатия и генерирующего сигналы пробоя.
1. Инициализация и Расчет Базовых Величин
* Определение Периода N: Определить период N (рекомендуемое значение N=20) для расчета скользящих средних, ATR и Стандартного Отклонения (SD).
* Расчет Истинного Диапазона (True Range, TR): Для каждого бара рассчитать \text{TR} как максимальное значение из трех метрик: (High – Low), \text{Abs}(\text{High} - \text{Close}_{\text{prev}}), \text{Abs}(\text{Low} - \text{Close}_{\text{prev}}).
2. Расчет Компонентов Канала Кельтнера (KC)
* Расчет Средней Линии KC (EMA): Рассчитать экспоненциальную скользящую среднюю (EMA) цены закрытия (\text{Close}) за период N.
* Расчет ATR: Рассчитать Средний Истинный Диапазон (ATR) как скользящую среднюю \text{TR} за период N.
* Расчет Границ KC: Рассчитать Верхнюю и Нижнюю линии KC, используя множитель ATR Y (рекомендуется Y=1.5 ):
* * 3. Расчет Компонентов Полос Боллинджера (BB)
* Расчет Средней Линии BB (SMA): Рассчитать простую скользящую среднюю (SMA) цены закрытия (\text{Close}) за период N.
* Расчет SD: Рассчитать Стандартное Отклонение (SD) цены закрытия за период N.
* Расчет Границ BB: Рассчитать Верхнюю и Нижнюю полосы BB, используя множитель SD X (рекомендуется X=2.0 ):
* * 4. Алгоритм Определения Состояния "Squeeze"
* Проверка Условия Squeeze ON: Для текущего бара проверить, выполняются ли оба условия: \text{BB}_{\text{Upper}} < \text{KC}_{\text{Upper}} И \text{BB}_{\text{Lower}} > \text{KC}_{\text{Lower}}.
* Присвоение Состояния: ЕСЛИ оба условия в шаге 9 истинны, ТО присвоить переменной \text{SqueezeState} значение \text{ON} (например, 1). ИНАЧЕ присвоить значение \text{OFF} (например, 0).
5. Алгоритм Генерации Сигналов Пробоя
* Идентификация Триггера: Проверить, что \text{SqueezeState} изменился с \text{ON} на \text{OFF} на текущем баре. Это означает, что волатильность расширилась после периода сжатия.
* Сигнал Бычьего Пробоя: ЕСЛИ \text{SqueezeState}_{\text{prev}} = \text{ON} И \text{SqueezeState}_{\text{current}} = \text{OFF}, И цена закрытия (\text{Close}) текущего бара выше \text{BB}_{\text{Upper}}, ТО генерировать сигнал ПОКУПКА (Breakout Long).
* Сигнал Медвежьего Пробоя: ЕСЛИ \text{SqueezeState}_{\text{prev}} (start_span) (end_span)= \text{ON} И \text{SqueezeState}_{\text{current}} = \text{OFF}, И цена закрытия (\text{Close}) текущего бара ниже \text{BB}_{\text{Lower}}, ТО генерировать сигнал ПРОДАЖА (Breakout Short).
* Дополнительная Фильтрация Моментумом: Для повышения надежности, сигнал пробоя должен быть действителен только ЕСЛИ пробой происходит в направлении, подтвержденном моментум-индикатором (например, если Моментум > 0 для Бычьего пробоя, и Моментум < 0 для Медвежьего пробоя).
Роль Моментума в Алгоритме
Ключевым дополнением к индикатору волатильности является компонент моментума. Определение состояния Squeeze ON/OFF позволяет понять потенциал движения, но не его направление. Моментум-индикатор (часто реализованный в виде гистограммы, как в TTM Squeeze ) позволяет измерить, происходит ли накопление давления покупателей или продавцов во время фазы сжатия. Следовательно, индикатор должен включать подкомпонент, который измеряет это давление. Использование моментума в сочетании с пробоем BB гарантирует, что вход в позицию происходит не просто после расширения волатильности, а после ее расширения в подтвержденном направлении, что существенно снижает количество ложных пробоев.
V. Параметры, Оптимизация и Нюансы для Криптовалютного Рынка
Адаптация Стандартных Настроек (20, 2.0, 1.5)
Стандартные параметры N=20, X_{\text{BB}}=2.0 и Y_{\text{KC}}=1.5 разработаны для фондовых рынков и являются надежной отправной точкой. Однако высокая волатильность и динамика криптовалютного рынка требуют тонкой настройки для оптимизации производительности.
1. Оптимизация Периода N
Уменьшение периода N (например, до 18 или 14) на более низких таймфреймах (1-часовой и ниже) увеличит чувствительность индикатора к локальным, быстрым сжатиям, что полезно для скальпинга. Однако, это также может привести к генерации большего количества сигналов, в том числе ложных. Для среднесрочных торговых стратегий (4h, Daily) период N=20 или N=21 обеспечивает оптимальный баланс между чувствительностью и фильтрацией шума.
2. Оптимизация Множителя Y_{\text{KC}}
Множитель Каналов Кельтнера (Y) по умолчанию равен 1.5. KC более плавные и устойчивые благодаря использованию ATR. Если в процессе тестирования индикатор генерирует слишком много ложных сигналов Squeeze ON, это может указывать на то, что канал KC слишком узок. В этом случае, небольшое увеличение множителя Y (например, до 1.6 или 1.7) расширит KC. Это потребует еще более экстремального падения Стандартного Отклонения, чтобы BB сузились внутрь KC, тем самым повышая строгость и надежность сигнала Squeeze ON.
Важность Выбора Таймфрейма
Хотя некоторые индикаторы, такие как KC и BB, показывают более высокую эффективность в трендовом состоянии для торговли отскоками от границ , стратегия Squeeze Play принципиально иная. Она целенаправленно ищет рейндж (контракцию волатильности) с целью поймать начало нового сильного тренда.
На рынке криптовалют ложные пробои и рыночный шум (chop) могут быть особенно интенсивными на низких таймфреймах. Поэтому для стратегии Squeeze рекомендуется использовать таймфреймы, на которых консолидация наиболее чиста: 4-часовой, Daily или Weekly графики для основных криптопар, таких как BTC/USD или ETH/USD. На более низких таймфреймах необходимо внедрять мультитаймфреймовое подтверждение, используя, например, фильтр тренда с более высокого таймфрейма.
VI. Стратегическое Применение Squeeze Play и Фильтрация
Использование Momentum для Определения Направления
Как уже было отмечено, индикатор волатильности (BB/KC) не является индикатором направления. Функция сжатия (Squeeze ON) лишь идентифицирует высокую вероятность сильного движения. Следовательно, для успешной торговли необходимо интегрировать Моментум.
Прорыв следует использовать как триггер, но направление должно быть подтверждено Моментумом. Например, сигнал ПОКУПКА должен быть сгенерирован, только если соблюдены два условия:
* Выход из состояния Squeeze ON и пробитие ценой закрытия верхней полосы BB (\text{Close} > \text{BB}_{\text{Upper}}).
* Моментум-индикатор подтверждает восходящее давление (значение Моментума положительно).
Такой подход предотвращает входы в ложные пробои, когда волатильность расширяется, но не в направлении накопленного рыночного давления.
Управление Рисками и Позицией
Поскольку Канал Кельтнера основан на ATR, который является динамической мерой волатильности , именно ATR следует использовать для установки стоп-лосса (SL) в алгоритмической стратегии.
* Установка Стоп-Лосса (SL): Рекомендуется устанавливать SL на уровне, определяемом 1 \times \text{ATR} ниже средней линии (EMA/SMA) или за границей канала KC, противоположной пробою. Использование ATR обеспечивает, что SL динамически адаптируется к текущей волатильности, избегая слишком узких стопов в периоды нормального диапазона.
* Установка Тейк-Профита (TP): Поскольку цель Squeeze Play — поймать сильное направленное движение, тейк-профит может быть установлен на основе фиксированного соотношения Риск/Прибыль (например, 2:1 или 3:1) или на основе выхода цены за пределы KC. Пробитие KC часто указывает на экстремальное ценовое движение и может служить точкой для частичной или полной фиксации прибыли.
Фильтрация Против Ложных Сигналов в Рейндже
Основной недостаток торговли на пробой — высокий процент ложных сигналов в широких, но не направленных диапазонах. Использование композитного индикатора BB/KC Squeeze эффективно решает эту проблему.
KC, будучи основанным на сглаженном ATR, менее подвержен краткосрочным всплескам волатильности, чем BB. Фильтр Сжатия требует, чтобы чувствительные BB сузились внутрь сглаженных KC. Это гарантирует, что мы входим только в те прорывы, которым предшествовала длительная и аномально низкая фаза волатильности. Пробой должен быть подтвержден тем, что цена пробивает BB после завершения состояния Squeeze ON, что сигнализирует об устойчивом расширении волатильности, а не о кратковременном ценовом всплеске.
VII. Заключение
Анализ подтверждает, что наблюдение пользователя о связи между сокращением волатильности и последующими сильными движениями является фундаментально верным принципом, наилучшая реализация которого на рынке криптовалют достигается с помощью композитного индикатора BB/KC Squeeze.
Этот индикатор предоставляет точное количественное определение "на сколько" волатильность должна сократиться (SD должно упасть ниже 75% от ATR) и включает необходимые качественные предпосылки ("почему и как" — консолидация, подтвержденная моментумом). Представленный пошаговый алгоритм обеспечивает техническую основу для кодирования высокоэффективного инструмента, который идентифицирует фазы аккумуляции и генерирует сигналы пробоя, адаптированные к динамике крипторынка. Включение фильтрации на основе моментума и надлежащее управление риском, привязанное к ATR, являются ключевыми факторами для перехода от чистого индикатора к прибыльной торговой стратегии.

EBC 310 Pullback EngineEBC 310 Pullback Engine
A proprietary momentum oscillator designed specifically for identifying high-probability pullback entries in trending markets.
📊 What It Does:
The EBC 310 Pullback Engine calculates the difference between 3-period and 10-period simple moving averages, then smooths this differential with a 16-period moving average to identify momentum shifts and trend exhaustion points.
🎯 How To Use:
For LONG Entries (Pullback in Uptrend):
Wait for fast line (histogram) to dip below zero line
Enter when fast line turns GREEN (momentum returning)
Best when slow line is above zero (confirming uptrend)
For SHORT Entries (Pullback in Downtrend):
Wait for fast line to spike above zero line
Enter when fast line turns RED (momentum failing)
Best when slow line is below zero (confirming downtrend)
🔧 Features:
✅ Color-Coded Momentum:
Green bars = Rising momentum (bullish)
Red bars = Falling momentum (bearish)
Blue bars = No change (consolidation)
✅ Trend Confirmation:
Blue slow line = Rising trend strength
Purple slow line = Weakening trend
Orange slow line = Trend pause
✅ Zero Line Reference:
Gray line marks equilibrium
Above = bullish bias
Below = bearish bias
⚙️ Settings:
3-10 Diff Moving Average Window: Default 16
Lower values (10-12) = More sensitive, faster signals
Higher values (20-25) = Smoother, fewer false signals
💡 Trading Strategy:
Identify overall trend direction on higher timeframe
Wait for pullback (fast line crosses zero against trend)
Enter when momentum returns (color change with trend)
Exit when fast line crosses zero in opposite direction
📈 Best Timeframes:
Scalping: 1-5 min charts
Day Trading: 15-30 min charts
Swing Trading: 1H-4H charts
⚠️ Risk Disclaimer:
This indicator is a momentum tool and should be used in conjunction with proper risk management, support/resistance levels, and additional confirmation signals. No indicator guarantees profitable trades.

Fib Green zone / Red zone + Elliott Wave 3═══════════════════════════════════════════
🎯 FIB GREEN ZONE / RED ZONE + ELLIOTT WAVE 3
═══════════════════════════════════════════
OVERVIEW
--------
A comprehensive technical analysis tool combining Fibonacci retracement levels
with Elliott Wave theory to identify high-probability trading opportunities.
KEY FEATURES
------------
✅ Dynamic Fibonacci Levels (0%, 23.6%, 38.2%, 50%, 61.8%, 78.6%, 100%)
✅ Color-Coded Trading Zones:
• Green Zone (0-23.6%): Strong support area
• Golden Zone (50-61.8%): High-probability reversal zone
• Red Zone (78.6-100%): Potential resistance area
✅ Elliott Wave 3 Detection:
• Automatic Wave 1 & 2 identification
• Wave 3 entry signals
• Golden Pocket setups (highest probability)
• Customizable retracement parameters
✅ Fully Customizable:
• Toggle individual levels on/off
• Customize all colors and line styles
• Adjust Elliott Wave sensitivity
• Show/hide labels and zones
IDEAL FOR
---------
- Day traders and swing traders
- Fibonacci-based trading strategies
- Elliott Wave practitioners
- Support/resistance trading
ALERT SYSTEM
------------
Built-in alerts for:
- Price crossing key Fibonacci levels
- Wave 3 entry signals
- Golden Pocket setups
HOW TO USE
----------
1. Apply to any timeframe (works best on 1min-1hr for intraday)
2. Watch for price action in zones
3. Wave 3 signals appear when setup criteria are met
4. Use with other confirmations (volume, price action, etc.)
IMPORTANT DISCLAIMER
-------------------
This indicator is for educational purposes only. It does not guarantee
profitable trades. Past performance does not indicate future results.
Always use proper risk management and conduct your own analysis.
═══════════════════════════════════════════
📧 For access requests or questions, please message me directly.

XΩ — T+ Sentiment Sniper
**XΩ — T+ Sentiment Sniper**
Crowd psychology helper for timing T+ reversals and managing risk
---
### 1. What is XΩ — T+ Sentiment Sniper?
XΩ — T+ Sentiment Sniper is a **crowd sentiment companion indicator**.
It estimates whether the market as a whole is currently:
- Deep in profit (euphoria, FOMO‑prone)
- Deep in loss (panic, capitulation‑prone)
- Slightly profitable / slightly losing
From that, it marks:
- Potential **supply/demand absorption** zones at panic lows and euphoric highs
- **Sentiment divergences** between price and crowd PnL
You use it as a **psychology layer on top of your main system**, especially for timing T+ style moves (the next 1–3 swings after an emotional extreme).
You do not need to understand the internal math to use it.
---
### 2. How to read the panel
The indicator runs in a **separate pane** (not on the price chart) and shows:
1. **Crowd Sentiment (Raw) – columns**
- Green/red columns represent how “good” or “bad” the crowd’s current PnL is.
- Taller columns = more emotional / more extreme conditions.
2. **Signal Line – white line**
- A smoothed line summarising the **overall direction of sentiment**.
- Helps you see whether psychology is improving or deteriorating.
3. **Horizontal levels**
- `0 (Neutral)` → sentiment is roughly balanced.
- `Euphoria` → crowd is strongly in profit (high risk of FOMO and distribution).
- `Panic` → crowd is deeply underwater (high risk of capitulation and absorption).
4. **Dashboard label on the latest bar**
- Status: `EUPHORIA (Risk)`, `PANIC (Opp.)`, `SLIGHT PROFIT`, or `SLIGHT LOSS`.
- Current **Crowd PnL (%)**.
- A short note about volume (stable vs unusually high, with a T+2 warning when needed).
At a glance, you know:
> “Is the market currently euphoric, panicking, or somewhere in between?”
---
### 3. What the signals mean
The indicator plots shapes at the top/bottom of the pane:
- **ABS (Absorption – Buy)**
- Small green circle near the bottom.
- Suggests **demand absorption**: sentiment is bad (panic), but strong buying appears against the selling.
- Use as a **potential bottom area** to watch, not an automatic “buy now”.
- **DST (Distribution – Sell)**
- Small red circle near the top.
- Suggests **distribution**: sentiment is very positive (euphoria), but strong selling appears into that optimism.
- Use as a **potential top area** to watch for taking profits or avoiding FOMO entries.
- **DIV triangle up (Bullish Div – Buy)**
- Yellow triangle pointing up near the bottom.
- Price makes new lows while sentiment stops getting worse and starts to improve.
- Suggests selling pressure is fading; potential for an upward reversal.
- **DIV triangle down (Bearish Div – Sell)**
- Orange triangle pointing down near the top.
- Price makes new highs while sentiment stops getting better and starts to weaken.
- Suggests buying pressure is fading; potential for a downward reversal.
Think of these as **context signals / alerts**, not as “must‑take” entries on their own.
---
### 4. Suggested ways to use it
#### 4.1. As a context filter before entering trades
Use Sentiment Sniper to avoid trading directly into emotional extremes:
- Avoid opening **new longs** when:
- The indicator is in the **Euphoria** zone and you see **DST or Bearish DIV** near resistance.
- Avoid opening **new shorts** when:
- The indicator is in the **Panic** zone and you see **ABS or Bullish DIV** near support.
In other words, use it as a **“do not chase” filter** for tops and bottoms.
---
#### 4.2. To spot potential T+ reversal zones
Example workflow:
1. Use your normal tools to mark **key zones** (support/resistance, liquidity areas, higher‑timeframe levels).
2. When price reaches those zones, look at T+ Sentiment Sniper:
- Near **Panic** with **ABS or Bullish DIV** → watch for potential long opportunities.
- Near **Euphoria** with **DST or Bearish DIV** → watch for potential short/exit opportunities.
3. Only take trades when:
- You also have confirmation from your own system (reversal candle, structure break, etc.).
4. Expect a **T+ style move** (1–3 swings) away from the extreme.
---
#### 4.3. To manage open positions
- When you are **heavily in profit**:
- If Sentiment Sniper moves into **Euphoria** and starts printing **DST or Bearish DIV**, consider:
- Taking partial profits
- Tightening stops
- Reducing risk to protect gains
- When you are **stuck in drawdown**:
- If sentiment is deep in **Panic** but there is **no** ABS or Bullish DIV yet, be careful:
- Avoid catching a falling knife too early.
- Look for sentiment to stabilise (ABS/DIV + your own confirmation) before committing.
---
### 5. User‑level settings (simple view)
You typically only need to think of them like this:
- **Half-Life (Memory Decay)**
- Higher value → sentiment reacts more slowly (more “long‑term” feel).
- Lower value → sentiment reacts faster to recent moves (better for short‑term trading).
- **Euphoria / Panic Threshold (%)**
- Define what counts as an “extreme”.
- For very volatile assets (crypto, small caps), you may want slightly wider thresholds.
- For calmer markets (majors, large caps), slightly tighter thresholds may be enough.
- **Avg Volume Length**
- Period to define “normal” volume.
- Spikes above this are used to flag meaningful absorption/distribution.
- **Show Sentiment Divergence / Show Supply/Demand Absorption**
- Turn off one or both if you feel the chart is too crowded.
- Keep only the parts that match your own style.
---
### 6. Alerts
In TradingView’s **Alerts** panel you will find:
- `XΩ SNIPER BUY`
- Triggers when a **psychological Buy** signal appears (Absorption or Bullish Divergence, if enabled).
- `XΩ SNIPER SELL`
- Triggers when a **psychological Sell** signal appears (Distribution or Bearish Divergence, if enabled).
Use alerts to be notified when the crowd hits important **Panic/Euphoria zones**, without watching the screen all day.
---
### 7. Important notes
- This is a **sentiment / context tool**, not a standalone “black box” system.
- Always combine it with:
- Price structure on higher timeframes
- Your own entry/exit rules
- Proper risk management
- Backtest and forward‑test before applying it with real capital.

Bayesian Liquidity Pain & Gain [Instit. Vol Weighted]Bayesian Liquidity Pain & Gain Indicator
Stop guessing where support and resistance are.
The Bayesian Liquidity Pain & Gain indicator moves beyond arbitrary lines and raw price action. It quantifies Institutional Intent by calculating the exact price levels where large volume has been accumulated and visualizes the "Pain" (stress) those participants feel when the market moves against them.
The Logic: Quantified Institutional Stress
Institutions don't trade single candles; they accumulate positions over time. This indicator tracks their Volume-Weighted Average Cost Basis to answer two critical questions:
Where did they enter? (The Cost Basis Lines)
Are they underwater? (The Pain Clouds)
By normalizing price distance using volatility (ATR) and statistical deviation (Z-Score), we filter out noise and only highlight zones where "Smart Money" is statistically forced to defend their positions or capitulate.
How to Read the Chart
1. The Cost Basis Lines (Anchors)
• 🟢 Green Line (Buyer Cost Basis): The average price where institutions accumulated long positions. This acts as dynamic Support.
• 🔴 Red Line (Seller Cost Basis): The average price where institutions accumulated short positions. This acts as dynamic Resistance.
2. The Pain Clouds (Signals)
When price moves significantly away from the cost basis (Z-Score > 2.0), "Clouds" appear to visualize the PnL status of the participants:
• 🔴 Red Cloud (Buyer Pain): Price is below the buyer's entry. Buyers are losing money (in the red). This creates a "Discount" zone where they may defend support.
• 🟢 Green Cloud (Seller Pain): Price is above the seller's entry. Sellers are losing money (shorts are squeezed). This indicates strong bullish momentum.
3. The Multi-Timeframe Dashboard
A real-time HUD showing the Z-Score status across 4 timeframes (1m, 5m, 15m, 1h):
• 🟢 Green: Profitable/Neutral (Trend Continuation)
• 🟠 Orange: Warning (Pressure Building)
• 🔴 Red: Critical Pain (High Probability Reversal)
Trading Strategies
Setup 1: The Defensive Bounce (Long)
• Context: Price drops into a 🔴 Red Cloud (Buyer Pain).
• Trigger: Price touches the 🟢 Green Line (Buyer Cost Basis) and shows a rejection wick.
• Logic: Institutional buyers defend their cost basis to avoid realizing losses.
Setup 2: The Short Squeeze (Momentum)
• Context: Price rallies into a 🟢 Green Cloud (Seller Pain).
• Trigger: Price holds above the 🔴 Red Line (Seller Cost Basis).
• Logic: Short sellers are trapped and forced to buy back (cover), fueling the rally.
Fractal Alignment:
For high-conviction trades, wait for the Dashboard to show "Pain" signals on both the 1h (Anchor) and 5m (Trigger) timeframes simultaneously.
Settings
• Memory Length (Default 144): The lookback period for the institutional cost basis. Increase for swing trading, decrease for scalping.
• Sigma Threshold (Default 2.0): The statistical confidence level for "Pain". Higher values = fewer, stronger signals.
• Volume Amp: When enabled, high volume amplifies the pain signal, giving more weight to institutional footprints.


FTPM - Institutional Trend Pressure Suite @darshaksscThis indicator provides an informational view of market trend pressure using fractal-based momentum events, smoothed pressure calculations, higher timeframe confirmation, and divergence analysis. It does not produce buy or sell signals. Instead, it presents market context to help traders interpret trend conditions in a structured and data-driven way.
The indicator includes the following components:
1). Non-repainting Trend Pressure Engine
The pressure line is derived from confirmed fractal events, body-to-range ratios, displacement strength, and a controlled decay factor. The value is normalized to a 0 to 100 scale. A rising pressure value suggests increasing trend strength, while a declining value indicates weakening strength. This is informational only.
2). Pressure Shifts
The tool highlights transitions where pressure crosses above or below key thresholds. These labels do not represent entries or exits, but simply indicate contextual changes in momentum.
3). Higher Timeframe Pressure Confirmation
Users can compare current timeframe pressure to a selected higher timeframe. When both pressures align in similar regions, it may indicate agreement in broader market structure. This feature is informational only and does not generate trading signals.
4). Divergence Detection
Identifies confirmed bullish or bearish divergences between price pivots and pressure pivots. Divergences are simply analytical tools and should not be interpreted as actionable trading signals.
5). Institutional Dashboard
A multi-line dashboard summarizes current pressure, regime classification, higher timeframe regime, pressure direction, divergence status, and alignment conditions. The dashboard is informational only. No part of the dashboard should be interpreted as a trade instruction.
6). Dashboard Size Selector
Users may switch between Full, Medium, or Thin dashboard layouts to match their screen preferences. This affects only display, not indicator logic.
Important Notes
This indicator does not forecast future price movement.
It does not generate buy, sell, long, or short signals.
It does not guarantee profitable outcomes.
It is intended purely for visual analysis and market context.
All information is derived from confirmed historical data.
No part of this script is designed to automate trading decisions.
This tool is suitable for traders who want a clear, non-repainting visualization of pressure conditions and structural behavior without violating TradingView House Rules.
======================================================================
HOW TO USE
The indicator helps traders observe whether pressure is increasing or decreasing, whether higher timeframe conditions agree with the current chart, and whether divergences are present. All outputs are informational and should be combined with the user's preferred strategy or manual analysis. The indicator is not intended to signal trades or provide recommendations.
======================================================================
DISCLAIMERS
This indicator is for educational and informational purposes only.
It does not constitute financial advice.
It does not provide buy, sell, long, or short signals.
It does not predict future price movement.
Past performance does not guarantee future results.
======================================================================

Smart Christmas Tree Overlay with Live Market StatusGet into the holiday spirit while you trade! 🎅📈
This script adds a festive, animated Christmas tree overlay to your chart that reacts to live market conditions in real-time. It is designed with a "Slim Fit" ratio to minimize screen real estate while maximizing the holiday vibe.
Key Features:
🎄 Trend-Reactive Lighting:
Bullish (Up): The tree lights sparkle in Green tones, and a special Blue Diamond (🔷) shines to indicate upward momentum.
Bearish (Down): The tree lights turn Red, and a Red Diamond (♦️) blinks to warn of downward movement.
✨ Real-Time Animation: The lights and star blink dynamically based on price updates, making the chart feel alive.
📊 Mini Market HUD: Displays the current Ticker, Last Price, Price Change, and Change % neatly below the tree.
📐 Fully Customizable: You can easily change the tree's Position (Corners/Middle) and Size (Small to Large) via the settings menu.
🖼️ "Always On" Overlay: Uses the TradingView table function to stay fixed on your screen, regardless of zoom or scroll.
How to use: Simply add it to your chart, select your preferred corner in the settings, and enjoy the show!
Happy Holidays and Profitable Trading! 🎁
==================================================================================
트레이딩을 하면서 연말 분위기를 느껴보세요! 🎅📈
이 스크립트는 실시간 시장 상황에 반응하는 애니메이션 크리스마스 트리 오버레이를 차트에 추가합니다. 화면 공간을 최소한으로 차지하도록 "슬림 핏" 비율로 디자인되었습니다.
주요 기능:
🎄 추세 반응형 조명:
상승장 (Bullish): 트리 조명이 녹색 톤으로 반짝이며, 상승 모멘텀을 나타내는 특별한 **파란색 다이아몬드(🔷)**가 빛납니다.
하락장 (Bearish): 트리 조명이 빨간색으로 변하고, **빨간색 다이아몬드(♦️)**가 깜빡이며 하락을 경고합니다.
✨ 실시간 애니메이션: 가격 업데이트에 따라 조명과 별이 역동적으로 깜빡여 차트에 생동감을 줍니다.
📊 미니 시세판 (HUD): 트리 바로 아래에 현재 종목명, 현재가, 가격 변동폭, 변동률(%)을 깔끔하게 표시합니다.
📐 완벽한 커스터마이징: 설정 메뉴를 통해 트리의 위치(모서리/중간)와 크기(작게~크게)를 쉽게 변경할 수 있습니다.
🖼️ "Always On" 오버레이: TradingView의 table 기능을 사용하여 줌이나 스크롤에 관계없이 화면에 고정됩니다.
사용 방법: 차트에 추가하고 설정에서 원하는 위치를 선택하기만 하면 됩니다!
행복한 연말 보내시고 성투하세요! 🎁
양키트레이더 from PropKorea.com

VB-MainLiteVB-MainLite – v1.0 Initial Release
Overview
VB-MainLite is a consolidated market-structure and execution framework designed to streamline decision-making into a single chart-level view. The script combines multi-timeframe trend, volatility, volume, and liquidity signals into one cohesive visual layer, reducing indicator clutter while preserving depth of information for active traders.
Core Architecture
Trend Backbone – EMA 200
Dedicated EMA 200 acts as the primary trend filter and higher-timeframe bias reference.
Serves as the “spine” of the system for contextualizing all secondary signals (swings, reversals, volume events, etc.).
Custom MA Suite (Envelope Ready)
Four configurable moving averages with flexible source, length, and smoothing.
Default configuration (preset idea: “8/89 Envelope”):
MA #1: EMA 8 on high
MA #2: EMA 8 on low
MA #3: EMA 89 on high
MA #4: EMA 89 on low
All four are disabled by default to keep the chart minimal. Users can toggle them on from the Custom MAs group for envelope or cloud-style configurations.
Nadaraya–Watson Smoother (Swing Framework)
Gaussian-kernel Nadaraya–Watson regression applied to price (hl2) to build a smooth synthetic curve.
Two layers of functionality:
Swing labels (▲ / ▼) at inflection points in the smoothed curve.
Optional curve line that visually tracks the turning structure over the last ~500 bars.
Designed to surface early swing potential before standard MAs react.
Hull Moving Average (Trend Overlay)
Optional Hull MA (HMA) for faster trend visualization.
Color-coded by slope (buy/sell bias).
Default: off to prevent overloading the chart; can be enabled under Hull MA settings.
Momentum, Exhaustion & Pattern Engine
CCI-Based Bar Coloring
CCI applied to close with configurable thresholds.
Overbought / oversold CCI zones map directly into candle coloring to visually highlight short-term momentum extremes.
RSI Top / Bottom Exhaustion Finder
RSI logic applied separately to high-driven (tops) and low-driven (bottoms) sequences.
Plots:
Top arrows where high-side RSI stretches into high-risk territory.
Bottom arrows where low-side RSI indicates exhaustion on the downside.
Useful as confluence around the Nadaraya swing turns and EMA 200 regime.
Engulfing + MA Trend Engine (“Fat Bull / Fat Bear”)
Detects bullish and bearish engulfing patterns, then combines them with MA trend cross logic.
Only when both pattern and MA regime align does the engine flag:
Fat Bull (Engulf + MA aligned long)
Fat Bear (Engulf + MA aligned short)
Candles are marked via conditional barcolor to highlight strong, structured shifts in control.
Fat Finger Detection (Wick Spikes / Stop Runs)
Identifies abnormal wick extensions relative to the prior bar’s body range with configurable tolerance.
Supports detection of potential liquidity grabs, stop runs, or “excess” that may precede reversals or mean-reversion behavior.
Volume & Liquidity Intelligence
Bull Snort (Aggressive Buy Spikes)
Flags events where:
Volume is significantly above the 50-period average, and
Price closes in the upper portion of the bar and above prior close.
Plots a labeled marker below the bar to indicate aggressive upside initiative by buyers.
Pocket Pivots (Accumulation Flags)
Compares current volume vs prior 10 sessions with a filter on prior “up” days.
Highlights pocket pivot days where current green candle volume outclasses recent down-day volumes, suggesting stealth accumulation.
Delta Volume Core (Directional Volume by Price)
Internal volume-by-price style engine over a user-defined lookback.
Splits volume into up-close and down-close buckets across dynamic price bins.
Feeds into S&R and ICT zone logic to quantify where buying vs selling pressure built up.
Structural Context: S&R and ICT Zones
S&R Power Channel
Computes local high/low band over a configurable lookback window.
Renders:
Upper and lower S&R channel lines.
Shaded support / resistance zones using boxes.
Adds Buy Power / Sell Power metrics based on the ratio of up vs down bars inside the window, displayed directly in the zone overlays.
Drops ◈ markers where price interacts dynamically with the top or bottom band, highlighting reaction points.
ICT-Style Premium / Discount & Macro Zones
Two tiered structures:
Local Premium / Discount zones over a shorter SR window.
Macro Premium / Discount zones over a longer macro window.
Each zone:
Uses underlying directional volume to annotate accumulation vs distribution bias.
Provides Delta Volume Bias shading in the mid-band region, visually encoding whether local power flows are net-buying or net-selling.
Enables traders to quickly see whether current trade location is in a local/macro discount or premium context while still respecting volume profile.
Positioning Intelligence: PCD (Stocks)
Position Cost Distribution (PCD) – Stocks Only
Available for stock symbols on intraday up to daily timeframe (≤ 1D).
Uses:
TOTAL_SHARES_OUTSTANDING fundamentals,
Daily OHLCV snapshot, and
A bucketed distribution engine
to approximate cost basis distribution across price.
Outputs:
Horizontal “PCD bars” to the right of current price, density-scaled by estimated share concentration.
Color-coding by profitability relative to current price (profitable vs unprofitable positions).
Labels for:
Current price
Average cost
Profit ratio (share % below current price)
90% cost range
70% cost range
Range overlap as a measure of clustering / concentration.
Multi-Timeframe Trend: Two-Pole Gaussian Dashboard
Two-Pole Gaussian Filter (Line + Cloud)
Smooths a user-selected source (default: close) using a two-pole Gaussian filter with tunable alpha.
Plots:
A thin Gaussian trend line, and
A thick Gaussian “cloud” line with transparency, colored by slope vs past (offsetG).
Functions as a responsive trend backbone that is more sensitive than EMA 200 but less noisy than raw price.
Multi-Timeframe Gaussian Dashboard
Evaluates Gaussian trend direction across up to six timeframes (e.g., 1H / 2H / 4H / Daily / Weekly).
Renders a compact bottom-right table:
Header: symbol + overall bias arrow (up / down) based on average trend alignment.
Row of colored cells per timeframe (green for uptrend, magenta for downtrend) with human-readable TF labels (e.g., “60M”, “4H”, “1D”).
Gives an immediate read on whether intraday, swing, and higher-timeframe flows are aligned or fragmented.
Default Configuration & Usage Guidance
Default state after adding the script:
Enabled by default:
EMA 200 trend backbone
Nadaraya–Watson swing labels and curve
CCI bar coloring
RSI top/bottom arrows
Fat Bull / Fat Bear engine
Bull Snort & Pocket Pivots
S&R Power Channel
ICT Local + Macro zones
Two-pole Gaussian line + cloud + dashboard
PCD engine for stocks (auto-active where data is available)
Disabled by default (opt-in):
Custom MA suite (4x MAs, preset as EMA 8/8/89/89)
Hull MA overlay
How traders can use VB-MainLite in practice:
Use EMA 200 + Gaussian dashboard to define top-down directional bias and avoid trading directly against multi-TF trend.
Use Nadaraya swing labels, RSI exhaustion arrows, and CCI bar colors to time entries within that higher-timeframe bias.
Use Fat Bull / Fat Bear events as structured confirmation that both pattern and MA regime have flipped in the same direction.
Use Bull Snort, Pocket Pivots, and S&R / ICT zones to align execution with liquidity, volume, and location (premium vs discount).
On stocks, use PCD as a positioning map to understand trapped supply, support zones near crowded cost basis, and where profit-taking is likely.
