Profit Accumulator Relative Strength IndexHi Everyone
Thought I'd share this nice and simple RSI indicator with you which uses short and long length crossover to determine potential long and short trades. This indicator also has multiple timeframe functionality.
Please use this with other indicators or price action etc to confirm long and short trades.
Personally I like to see the crossover on the longer timeframe and close out on a lower timeframe (i.e. spot the entry on the 1hr charts and close my position based on the 15min)
If anyone would like alerts putting on here for crossover then just let me know.
Cheers
Mike
스크립트에서 "profit"에 대해 찾기

Profit Accumulator Support and ResistanceHi Everyone
Thought I'd share this support and resistance script.
This has two settings on it which are resolution (timeframe) and the number of bars back to look. The default setting is 1 Week and 2 bars which is the one I like using the most.
The highest high and lowest low are indicated by the thicker red lines on the chart.
Enjoy using this.
Cheers
Mike
Profit Accumulator Heat MapHi Everyone
Happy to share this heat map packed full of indicators to make those trading decisions. There are a whole host of indicators including:
Inverse Fischer Transform
Moving Average Slope
EMA50 Crossover
Schaff Trend Cycle
MACD
RSI
Stochastic RSI
Moving Average Cross Over
Quantitative Qualitative Estimation
On Balance Volume
All of the indicators are customisable in the settings so you can adjust them to how you want.
I often find that the combination of MACD and QQE provide good early entry and exit signals.
Any comments or improvements then please feel free to get in touch.
Cheers
Mike
Big thanks go to @everget, @JustUncleL and @LazyBear for the use of their codes.

Profit Accumulator VolatilityHi Everyone
I thought I'd share my new volatility trend indicator for anyone to use.
The indicator tracks the volatility in the market and plots this accordingly. Any plot above the zero line is a bullish signal and anything below the zero line is a bearish signal.
Long and Short Entry points are indicated at the 10 and -10 values respectively. A value of over 40 , or under -40 indicates a strong trend.
Possible entry and exit points are also highlighted on the chart.
I've added alerts onto this indicator highlighting possible entry and exit points as well as when strong trends are developing and when they are over.
This is intended to be used with your own indicators and/or analysis of the market and should be used carefully.
I personally like to use this indicator for entry on the one hour chart and then drop down to the 15 minute chart to confirm my entry and to use that timeframe for my exit.
Please feel free to forward any improvements that you'd like to make.
Cheers
Mike

Profit Accumulator On Balance VolumeOn Balance Volume Indicator
This is a support indicator to the Main Indicator which has also been published.
This indicator is from the basis of user Everget and a friend of mine on another site. This indicator has used a smoothing function in an attempt to provide more robust signals.
In this indicator the user is looking for:
Long trade: Upward sloping signal line and OBV greater than the signal line (shaded green).
Short trade: Downward sloping signal line and OBV less than the signal line (shaded red).
A horizontal signal line is a sign that the market is moving horizontally and trades should be placed very carefully. This indicator should definitely be used with the others in the suite to provide confluence when making a trade.
I've been using this successfully on the one hour FX charts, but seems to work equally as well on higher or lower time frames (not less than 15min).
The other indicators which are part of the suite are shown on the website which is highlighted in my signature at the bottom of the page. Purchase of the main indicator gives access to the full suite of eight indicators. I use the other indicators to confirm the direction of the trade and to determine if I want to trade or not. I use it along with the 2min, 15min and 4hr timeframes to identify the best entry window and how long I'm likely to be in the trade.
Support can be provided via private message or in the comments below.
The links are provided below for access to the indicator.

Profit Accumulator Heat MapHeat Map Indicator
This is a support indicator to the Main Indicator which has also been published.
This is a list of a number of indicators which cover trend, momentum and volatility. The key is very simple for this indicator, green is a long trade, red is a short trade and grey is an indicator which may be transitioning. The indicators uses are: MACD, PSAR, Bollinger Bands, RSI, Momentum and Chandelier Exit. All of the settings are customisable within the indicator and the user can best fit these around their charts. The simplicity of the heat map is that the more of one colour there is, the more likely it is that a trade can be placed.
I've been using this successfully on the one hour FX charts, but seems to work equally as well on higher or lower time frames (not less than 15min).
The other indicators which are part of the suite are shown on the website which is highlighted in my signature at the bottom of the page. Purchase of the main indicator gives access to the full suite of eight indicators. I use the other indicators to confirm the direction of the trade and to determine if I want to trade or not. I use it along with the 2min, 15min and 4hr timeframes to identify the best entry window and how long I'm likely to be in the trade.
Support can be provided via private message or in the comments below.
The links are provided below for access to the indicator.
Profit Accumulator Moving Average SlopeMoving Average Slope Indicator
This is a support indicator to the Main Indicator which has also been published.
This indicator makes use of custom and adjustable moving averages. There are two options for this centred oscillator:
Average of Three Moving Averages on Current Time Frame
Average of Three Moving Average Time Frames for One Length (i.e. if I'm using a 1hr time frame I would take the average of 30min, 1hr and 4hr moving averages with a 12 length).
When the trend line crosses above zero it is an indication for a long trade and when the trend line crosses below zero it is an indication for a short trade.
Whilst an actual alert function is not set for the indicator, the TradingView alert function can be used to trigger a message when the trendline crosses above or below zero.
I've been using this successfully on the one hour FX charts, but seems to work equally as well on higher or lower time frames (not less than 15min).
The other indicators which are part of the suite are shown on the website which is highlighted in my signature at the bottom of the page. Purchase of the main indicator gives access to the full suite of eight indicators. I use the other indicators to confirm the direction of the trade and to determine if I want to trade or not. I use it along with the 2min, 15min and 4hr timeframes to identify the best entry window and how long I'm likely to be in the trade.
Support can be provided via private message or in the comments below.
The links are provided below for access to the indicator.

Profit Accumulator Momentum Trend IndicatorMomentum Trend Indicator
This is a support indicator to the Main Indicator which has also been published.
This indicator uses a modified stochastic trendline and a smoothed momentum line (which combines stochastic, RSI and moving average). This is a centred oscillator from -100 to 100 which makes it easier to track. The stochastic line is the quicker moving line which potentially acts as the first trigger. If the momentum line then begins to follow, then it is an indication that a trade should be made.
Long Trades: The Stochastic line is above 25 and the momentum line is greater than -25.
Short Trade: The Stochastic line is below -25 and the momentum line is less than 25.
Whilst an actual alert function is not set for the indicator, the TradingView alert function can be used to trigger a message when either the stochastic line or momentum line crosses -25/25 (the key levels).
I've been using this successfully on the one hour FX charts, but seems to work equally as well on higher or lower time frames (not less than 15min).
The other indicators which are part of the suite are shown on the website which is highlighted in my signature at the bottom of the page. Purchase of the main indicator gives access to the full suite of eight indicators. I use the other indicators to confirm the direction of the trade and to determine if I want to trade or not. I use it along with the 2min, 15min and 4hr timeframes to identify the best entry window and how long I'm likely to be in the trade.
Support can be provided via private message or in the comments below.
The links are provided below for access to the indicator.
Profit Accumulator %BB%Bollinger Band Width
This is a support indicator to the Main Indicator which has also been published.
This indicator uses the close of a candle and compares where it is in relation to the upper and lower levels of a Bollinger Band. This is a centred oscillator where anything below the zero line is indicating a short signal and anything above zero is indicating a long signal. The crossing of the zero line is an important point for this indicator.
Whilst an actual alert function is not set for the indicator, the TradingView alert function can be used to trigger a message when the line crosses zero (up or down).
I've been using this successfully on the one hour FX charts, but seems to work equally as well on higher or lower time frames (not less than 15min).
The other indicators which are part of the suite are shown on the website which is highlighted in my signature at the bottom of the page. Purchase of the main indicator gives access to the full suite of eight indicators. I use the other indicators to confirm the direction of the trade and to determine if I want to trade or not. I use it along with the 2min, 15min and 4hr timeframes to identify the best entry window and how long I'm likely to be in the trade.
Support can be provided via private message or in the comments below.
The links are provided below for access to the indicator.

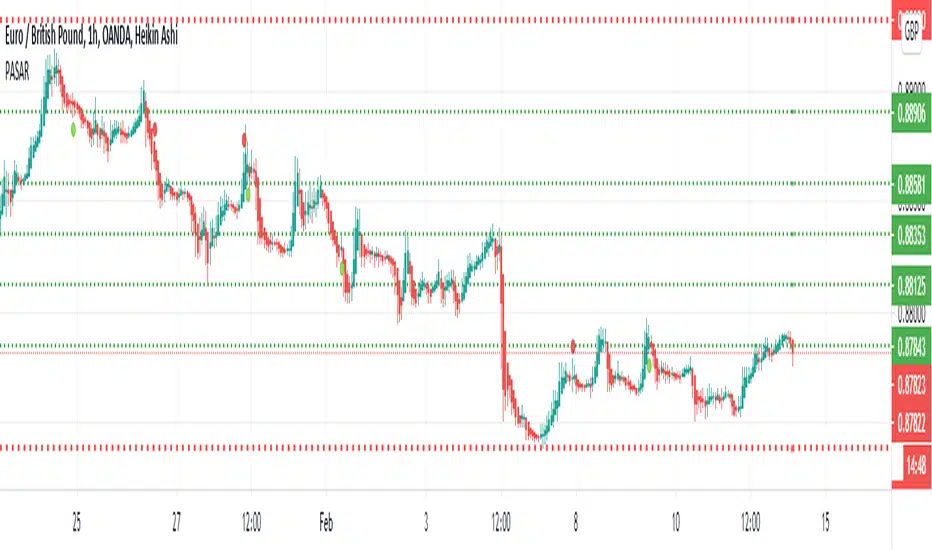
Profit target areaUpdate.
- you can specify count of bars used to detect reversal pattern
- you can specify count of bars used to determine lowest or highest price to place support or resistance
- area between lines is filled by green - ascending, red - descending trend
To trade:
- open position using stop command on S/R
- close position using limit command on retracement line
- close position when background colour indicates trend change
(erratum: last balloon on right should say "buy limit")

Peace of Mind Trader: MA Trend SystemPeace of Mind Trader: MA Trend System (Free Edition)
Developed by: Peace of Mind Trader
Trade with Logic, Profit with Peace.
Contact : wizardkidtrader@gmail.com
facebook : Peace of Mind Trader
----
🇬🇧 English
Simple & Elegant Trend Following System
Stop guessing the market direction. This system is designed to guide you with clarity and peace of mind.
- Trend Ribbon: Auto-coloring EMA ribbon (🟢 Green = Uptrend / 🔴 Red = Downtrend).
- Smart Dashboard: Real-time market status (BULLISH / BEARISH) on your screen.
- Clear Signals: Non-overlapping labels for entry/exit points.
- Clean Chart: Option to hide historical signals and show only the latest one.
How to use: Buy when the ribbon is Green + "BULL" label. Sell when the ribbon is Red + "BEAR" label.
-----
🇹🇭 Thai
ระบบจับเทรนด์ ดูง่าย สบายตา
เลิกเดาทิศทางตลาดด้วยตัวเอง! ให้ระบบช่วยจับจังหวะเทรนด์ใหญ่ให้คุณ ด้วยดีไซน์ที่ทันสมัยและใช้งานง่ายที่สุด
- Trend Ribbon: ริบบิ้นเปลี่ยนสีอัตโนมัติ (🟢 เขียว = ขาขึ้น / 🔴 แดง = ขาลง)
- Smart Dashboard: แผงควบคุมบอกสถานะตลาด (BULLISH / BEARISH) ทันที
- Clear Signals: มีป้ายบอกจุดเปลี่ยนเทรนด์ชัดเจน ไม่ทับแท่งเทียน
- Clean Chart: เลือกปิดสัญญาณเก่าๆ ได้ โชว์แค่สถานะล่าสุด กราฟไม่รก
วิธีใช้: หาจังหวะ Buy เมื่อริบบิ้นสีเขียว และหาจังหวะ Sell เมื่อริบบิ้นสีแดง
----
Developed by: Peace of Mind Trader
Trade with Logic, Profit with Peace.
Contact : wizardkidtrader@gmail.com

Price Action High 2 + Risk/Reward VisualizerIntroduction: Price Action High 2 (Bull Flag) Setup
This script identifies the High 2 (H2) setup, a staple price action pattern popularized by Al Brooks. The High 2 is a high-probability continuation pattern designed to catch the resumption of a bull trend after a two-legged pullback (a "complex" bull flag).
In a strong uptrend, the first attempt to end a pullback often fails (High 1). The High 2 represents the second, and usually more reliable, attempt by bulls to take control, often forming a "double bottom" structure within the flag.
How the Logic Works
The indicator follows a strict state-machine logic to ensure the pattern is valid:
Trend Confirmation: The script filters for an established uptrend where price is above a rising EMA (adjustable in settings).
Pullback Identification: It looks for a sequence of bars making lower highs.
High 1 (H1): The first bar in the correction that breaks above the high of the prior bar.
The Second Leg: The script then waits for the price to again fail to break a high, confirming a second leg of the pullback.
High 2 (H2): The signal is triggered when a bar breaks the high of the previous bar for the second time.
Key Features
Signal Bar Quality Filter: Not all High 2s are equal. This script includes a filter ensuring the signal bar closes in the upper portion of its range (bullish conviction) to avoid "weak" breakouts.
Automated Risk/Reward Visualizer: Upon a signal, the script automatically projects a Stop Loss (at the signal bar low) and a Take Profit level based on a customizable R:R ratio.
Clean Visuals: Labeled "H2" markers and dashed trend lines keep the chart uncluttered.
How to Trade It
Entry: Place a buy-stop order 1 tick above the High 2 signal bar.
Stop Loss: Traditionally placed below the low of the signal bar or the most recent swing low.
Target: Common targets include a 1:2 Risk/Reward ratio or the previous major swing high.
Settings Guide
EMA Length: Adjust this to match your timeframe (e.g., 20 for intraday, 50 for daily).
Min Close %: Set this to 50% or higher to ensure you only take trades where the bulls finished the bar strong.
Risk:Reward Ratio: Customize your profit targets to align with your personal trading plan.

Interest ZonesThis indicator automatically identifies and plots "Interest Zones" around significant pivot highs and lows, representing potential areas of institutional interest, support/resistance, or accumulation/distribution. Zones are dynamically merged when pivots cluster near the same price level and extended for visibility.
How It Works (Technical Methodology)
Pivot Point Detection
The indicator uses Pine Script's ta.pivothigh() and ta.pivotlow() with asymmetric left/right lengths (default left=20, right=13) to detect swing highs and lows. This allows for customizable sensitivity – longer left for stronger confirmation, shorter right for faster detection.
Zone Start Condition (Filtering)
Multiple modes control from which point in history zones begin to be drawn:
"None": All historical pivots (limited by max zones).
"Auto (Start of Day)": Zones only from the beginning of the current trading day (resets daily).
"Manual Date": User-defined fixed date.
"Interactive (Chart)": User-confirmed date via input (useful for backtesting specific periods).
"Last X Bars": Only pivots within the last user-defined number of bars (default 400).
A vertical line marks the start point in date-based modes for visual reference.
Zone Construction
For each valid pivot:
Zone thickness is based on ATR(14) × user-defined multiplier (default 0.3) for dynamic, volatility-adjusted height.
Pivot High zones: Centered below the high (potential supply/resistance).
Pivot Low zones: Centered above the low (potential demand/support).
Zones are drawn as boxes extending to the right, with gray fill and border.
Merge & Overlap Logic
When a new pivot falls inside an existing zone or is very close (within user-defined "Proximity Sensitivity %" of the zone's midpoint, default 1.1%):
The new pivot is merged into the existing zone.
A counter ("x2", "x3", etc.) is displayed on the zone, indicating how many pivots have clustered there.
The zone is strengthened visually (counter text) and extended further right.
This highlights high-interest levels where price repeatedly reversed.
Zone Management
In "None" mode: Only the most recent user-defined max zones are kept (default 5) – oldest deleted automatically.
In other modes: Up to ~490 zones (performance limit), oldest pruned if exceeded.
All zones auto-extend to the right on the last bar for continuous visibility.
Visual Elements
Uniform gray color for all zones (configurable).
Transparent background fill (adjustable).
Counter text in white (configurable) when zones have multiple touches.
Clean, non-directional design – focuses purely on clustered reversal points.
How to Use
Interest Zones highlight price levels where the market has shown repeated respect through multiple swing pivots – often coinciding with institutional order clusters, psychological levels, or hidden support/resistance.
Higher counter values ("x3+", "x5+"): Stronger zones – higher probability of reaction on retest.
Use for:
Potential reversal or bounce areas when price approaches a zone.
Confluence with other tools (order blocks, FVG, volume profile, etc.).
Stop-loss placement beyond zones or take-profit at opposite zones.
Daily reset ("Auto Start of Day"): Ideal for intraday trading – fresh zones each session.
Backtesting: Use "Manual" or "Interactive" date modes to analyze specific historical periods.
"Last X Bars": Good for medium-term swing analysis without full history clutter.
Adjust ATR multiplier for tighter (lower) or wider (higher) zones based on asset volatility. Increase proximity sensitivity for more aggressive merging in ranging markets.
Combine with trend direction, volume, or higher-timeframe structure for best results.
Disclaimer
This indicator is a technical analysis tool and should be used in conjunction with other forms of analysis. Past performance does not guarantee future results. Always use proper risk management.

The Cantillon Institutional overlay (pro)🏛 Stop Trading the "Rearview Mirror." Start Tracking the Flow.
Most retail indicators (RSI, MACD, Moving Averages) suffer from a fatal flaw: they are derivatives of past price. They tell you what has already happened.
The Cantillon Institutional Overlay is different. It is designed to track the "First Receivers" of liquidity—the institutions, banks, and market makers who move the market—rather than the retail crowd chasing it.
Based on the economic principles of Richard Cantillon (18th Century), this tool visualizes the "Unfair Advantage" of the insider. It answers two critical questions:
Where is the true trend? (The Institutional Average)
Where is the trap? (The Statistical Extremes)
🛠 What is Inside?
This script combines three institutional data points into a single, clean overlay:
1. The Institutional Anchor (Cyan AVWAP) This is not a standard Moving Average. It is an Anchored Volume Weighted Average Price, typically anchored to the session or week open.
Logic: This represents the average entry price of the "First Receivers."
Signal: If Price > AVWAP, institutions are net long (Markup Phase). If Price < AVWAP, institutions are net short (Markdown Phase).
2. The Sigma Bands (Statistical Traps) Standard Deviation channels that adapt to volatility.
The Red Band (+2σ): The "Statistical Ceiling." When price hits this, it is mathematically over-extended. This is where institutions often offload positions into retail FOMO (The Trap).
The Green Band (-2σ): The "Statistical Floor." This is the buy zone for mean reversion.
3. Institutional Order Blocks Automatically highlights hidden zones of liquidity where resting orders are likely waiting. These act as "magnets" for price action.
🎯 How to Trade This
Strategy A: The Trend Follower
Rule: Only take Longs when price is above the Cyan AVWAP line.
Trigger: Wait for price to pull back to the Gray "Fair Value" zone and reject.
Strategy B: The Reversion Trader (The Fade)
Rule: Fade the extremes.
Trigger: If price hits the Red Sigma Band (+2σ) and volume dries up, the move is exhausted. We look for shorts back to the mean.
⚠️ Why "First Receivers"?
In the Cantillon Effect, money flows to the insiders first. By the time it trickles down to retail indicators, the move is often over. This overlay allows you to align your bias with the "House" rather than the "Gambler."
Recommended Setup: For the complete institutional view, pair this Overlay with The Cantillon CVD to confirm volume intent behind every move.
Disclaimer: This tool provides statistical analysis and does not guarantee profits. Past performance is not indicative of future results.

RSS3 - Reversal Score System v3 [Rulph]RSS3 - Reversal Score System v3
RSS3 is a quantitative reversal detection system that combines volatility pressure analysis with directional momentum exhaustion to produce a unified reversal strength score from -1 (extreme bullish) to +1 (extreme bearish).
Unlike traditional single-indicator divergence systems (RSI, MACD), RSS3 cross-validates signals between two independent analytical engines (VPI and TDFI) and applies multi-timeframe contextual filtering to reduce false signals.
RSS3 is not a visual overlay of separate indicators. It implements a unified calculation pipeline where VPI and TDFI components feed into a single normalized Score through weighted aggregation. The divergence bonus system creates feedback loops where price-indicator relationships dynamically adjust the final Score, producing signals that cannot be replicated by simply viewing RSI, Bollinger Bands, and moving averages side-by-side.
━━━━━━━━━━━━━━━━━━━━━━━━━━━━━━━━━━
WHY COMBINE VOLATILITY + TREND FORCE?
━━━━━━━━━━━━━━━━━━━━━━━━━━━━━━━━━━
Most reversal systems rely on a single dimension:
• RSI divergence tracks momentum exhaustion
• Bollinger extremes track volatility expansion
• MACD divergence tracks trend deceleration
RSS3 recognizes that major reversals typically require both :
1. Volatility pressure buildup (market stretched beyond normal range)
2. Directional force exhaustion (trend losing momentum despite stretched price)
When VPI (volatility) and TDFI (trend force) diverge simultaneously from price, it signals a high-probability reversal zone. When only one diverges, the signal is weighted accordingly.
This dual-validation approach filters out:
• Momentum exhaustion in low-volatility consolidations (no VPI confirmation)
• Volatility spikes within strong trends (no TDFI exhaustion)
━━━━━━━━━━━━━━━━━━━━━━━━━━━━━━━━━━
COMPONENT 1: VOLATILITY PRESSURE INDEX (VPI)
━━━━━━━━━━━━━━━━━━━━━━━━━━━━━━━━━━
VPI quantifies how far the market has deviated from its equilibrium state using four factors:
1. RSI deviation from 50
Measures directional bias accumulation. When RSI stays at 70+ or 30- for extended periods, it signals persistent one-sided pressure.
2. Annualized volatility (VIX-style)
Calculates rolling standard deviation of returns scaled to annual terms. Rising volatility indicates increasing uncertainty and potential for mean reversion.
3. Normalized candle range
Compares current bar's range to recent average range. Expanding ranges signal climactic moves.
4. Bollinger Band position
Measures price distance from statistical mean (middle band). Touches or penetrations of outer bands indicate statistical overextension.
How they combine:
Each component is normalized to 0-1 scale, then weighted based on current market regime (trending vs ranging). The weighted average produces VPI reading where:
• VPI > 0.5 = overbought pressure zone
• VPI < -0.5 = oversold pressure zone
━━━━━━━━━━━━━━━━━━━━━━━━━━━━━━━━━━
COMPONENT 2: TREND DIRECTION FORCE INDEX (TDFI)
━━━━━━━━━━━━━━━━━━━━━━━━━━━━━━━━━━
TDFI measures the strength and sustainability of directional movement using moving average dynamics:
1. MA spread (fast MMA vs slow SMMA)
When fast MA pulls far from slow MA, it indicates strong directional momentum. When the spread contracts, momentum is fading.
2. Average impulse between MAs
Calculates the velocity of the spread change. Rapid expansion = acceleration phase; slowing expansion or contraction = deceleration/exhaustion.
3. Normalized trend strength
The spread and impulse are normalized relative to recent volatility to make TDFI comparable across different instruments and market conditions.
Output:
• TDFI > 0.7 = unsustainably strong bullish momentum
• TDFI < -0.7 = unsustainably strong bearish momentum
• TDFI near 0 = directionless or balanced market
━━━━━━━━━━━━━━━━━━━━━━━━━━━━━━━━━━
SCORE CALCULATION & DIVERGENCE INTEGRATION
━━━━━━━━━━━━━━━━━━━━━━━━━━━━━━━━━━
Base Score:
Score = (VPI_weight × VPI) + (TDFI_weight × TDFI)
This creates a continuous measure where:
• Score > +0.5 = bearish reversal zone (high VPI + weak bullish TDFI)
• Score < -0.5 = bullish reversal zone (low VPI + weak bearish TDFI)
Divergence Bonus System:
When classic divergences are detected (price makes new high/low but VPI or TDFI doesn't), a bonus/penalty is applied to Score:
• Decay mechanism: Divergence influence fades linearly over 15 bars (default). Fresh divergences have maximum impact; older ones gradually lose weight.
• Amplitude weighting: Larger divergences (bigger spread between price and indicator pivots) receive stronger bonuses.
• Dual-source amplification: When VPI and TDFI diverge on the same pivot (double divergence), their bonuses stack, creating extreme Score readings near ±1.0.
This means:
• Score = 0.9 with v3t2 label = third VPI + second TDFI bearish divergence, very high confidence
• Score = -0.85 with v1 label = first VPI bullish divergence, strong but early signal
━━━━━━━━━━━━━━━━━━━━━━━━━━━━━━━━━━
CALCULATION MECHANICS (DETAILED)
━━━━━━━━━━━━━━━━━━━━━━━━━━━━━━━━━━
VPI Component Weighting:
Weights are dynamically adjusted based on market regime detected by TDFI:
• Trending regime (|TDFI| > 0.5): RSI deviation 40%, BB position 30%, volatility 15%, range 15%
• Ranging regime (|TDFI| < 0.3): Volatility 35%, range 35%, RSI deviation 15%, BB position 15%
• Transition zones: linear interpolation between the two weight sets
Normalization Approach:
Each VPI/TDFI component is rescaled using rolling percentile rank over 100-bar window:
• Value at 100th percentile (highest) → 1.0
• Value at 0th percentile (lowest) → 0.0
• Current value → percentile position between 0-1
This makes the indicator adaptive to changing volatility and comparable across instruments.
Divergence Amplitude Measurement:
When a divergence is detected, its strength is quantified as:
Amplitude = (price_pivot_delta / ATR) × (indicator_pivot_delta / indicator_stddev)
Where:
• price_pivot_delta = distance between current and previous pivot
• indicator_pivot_delta = distance between indicator values at those pivots
• ATR and stddev provide normalization
Larger amplitude → larger bonus/penalty to Score (up to ±0.3 maximum).
Decay Function:
Divergence bonus decays linearly: Bonus(t) = Initial_Bonus × (1 - t/15), where t is bars since divergence. After 15 bars, bonus reaches zero. This ensures recent divergences dominate the Score.
Why This Design:
This architecture creates a system where:
• Components adapt to market regime automatically
• Signals are normalized across timeframes and instruments
• Multiple divergences create amplification (bonuses stack)
• Stale signals fade out naturally
This is fundamentally different from displaying RSI + Bollinger + MA separately, as the unified Score cannot be replicated by visual inspection alone.
━━━━━━━━━━━━━━━━━━━━━━━━━━━━━━━━━━
SEQUENTIAL DIVERGENCE LABELS (v/t SYSTEM)
━━━━━━━━━━━━━━━━━━━━━━━━━━━━━━━━━━
Each divergence is tracked separately for VPI and TDFI:
v-series: VPI divergences (v1, v2, v3...)
t-series: TDFI divergences (t1, t2, t3...)
The counter increments each time a new divergence appears in the same direction (e.g., consecutive bearish divergences). When direction flips (bearish → bullish), counters reset to 1.
Why this matters:
• v1 or t1 = early warning, potentially premature
• v3 or v4 = late-stage exhaustion, higher probability of reversal
• v2t3 = double divergence with second VPI + third TDFI = strong confluence
Traders can filter signals by label:
• Aggressive: trade v1/t1
• Conservative: wait for v2+/t2+ or double divergences
━━━━━━━━━━━━━━━━━━━━━━━━━━━━━━━━━━
MULTI-TIMEFRAME FILTER
━━━━━━━━━━━━━━━━━━━━━━━━━━━━━━━━━━
The MTF filter analyzes a higher timeframe to determine if the current market structure supports the divergence signal.
Modes:
• Off: All divergences shown
• Reduce: Counter-trend divergences have their bonus reduced by 70% (visual indication: dimmed/gray markers)
• Block: Counter-trend divergences completely hidden
Logic:
If 1H shows bearish divergence but 4H is in strong uptrend (Score < -0.3), the 1H signal is likely premature. MTF filter prevents entering shorts against higher timeframe momentum.
This protects against:
• Catching falling knives in strong downtrends
• Shorting pullbacks in strong uptrends
• Low-probability mean-reversion attempts
━━━━━━━━━━━━━━━━━━━━━━━━━━━━━━━━━━
HOW TO USE RSS3
━━━━━━━━━━━━━━━━━━━━━━━━━━━━━━━━━━
Entry Setup:
1. Wait for divergence marker (green = bullish, red = bearish)
2. Check Score magnitude:
• |Score| > 0.5 = higher confidence
• |Score| > 0.8 = extreme zone
3. Check v/t label:
• v1/t1 = early (more risk, more reward potential)
• v2+/t2+ or double = late but more reliable
4. Optional: wait +2 bars for pivot confirmation
Exit Options:
• Conservative: opposite divergence appears
• Aggressive: Score crosses through 0 or opposite ±0.5 threshold
• Always use volatility-based stop (2-3× ATR)
Timeframe Recommendations:
• 5-15m: intraday (use MTF 1H-4H)
• 1-4H: swing trading (use MTF Daily-Weekly)
• Daily: position trading (use MTF Weekly-Monthly)
Complementary Tools:
RSS3 is a reversal timing engine, not a complete strategy. Combine with:
• Support/resistance for target zones
• Volume analysis for confirmation
• Trend filters for directional bias
━━━━━━━━━━━━━━━━━━━━━━━━━━━━━━━━━━
WHAT MAKES RSS3 ORIGINAL
━━━━━━━━━━━━━━━━━━━━━━━━━━━━━━━━━━
vs Traditional RSI Divergence:
• RSI divergence = binary yes/no
• RSS3 = quantified strength score with dual-source validation
vs MACD Divergence:
• MACD = single dimension (momentum)
• RSS3 = volatility pressure + trend force + MTF context
vs Bollinger + RSI mashup:
• Standard mashup = two separate signals
• RSS3 = unified scoring system where components interact through weighted bonuses
Unique features:
• Decay-weighted divergence bonuses (recent divergences matter more)
• Amplitude-sensitive scoring (stronger divergences = higher score impact)
• Sequential tracking (v/t labels show signal maturity)
• MTF-aware filtering (context-dependent signal validation)
• Closed-loop system (divergences → Score → priority weighting → signal)
━━━━━━━━━━━━━━━━━━━━━━━━━━━━━━━━━━
EXAMPLE INTERPRETATION
━━━━━━━━━━━━━━━━━━━━━━━━━━━━━━━━━━
Scenario: BTC 2H chart shows:
• Red triangle appears above price
• Label: v1 + t2
• Recent Score Value: 1
What this means:
• Second consecutive TDFI bearish divergence detected (t2)
• First VPI bearish divergence on same pivot (v1)
• Double divergence stacking → Score near maximum
• Market is in extreme overbought/overextended zone
• High probability of short-term reversal
Trading decision:
• Aggressive trader: short immediately with tight stop
• Conservative trader: wait for Score to drop below 0.5 or opposite divergence for exit
━━━━━━━━━━━━━━━━━━━━━━━━━━━━━━━━━━
CHART LEGEND
━━━━━━━━━━━━━━━━━━━━━━━━━━━━━━━━━━
The published chart shows:
• Green triangles below price = bullish divergences (v/t labels indicate sequence)
• Red triangles above price = bearish divergences
• Score line in lower panel = reversal strength from -1 to +1
• Colored clouds = pressure accumulation zones (optional display)
• Text annotations = example entry/exit points for educational purposes
━━━━━━━━━━━━━━━━━━━━━━━━━━━━━━━━━━
Disclaimer: All trading involves risk. This indicator does not guarantee profits. Always backtest and apply proper risk management.

cd_VW_Cx IMPROVED - Quant VWAP System: Regime, Magnets & Z-ScoQuant VWAP System: Regime, Magnets & Z-Score Matrix
This indicator is a comprehensive Quantitative Trading System designed to move beyond simple support and resistance. Instead of static lines, it uses Statistical Probability (Z-Score) and Standard Deviation to define the current market regime, identify institutional value zones, and project high-probability liquidity targets.
It is engineered for Day Traders and Scalpers (Crypto & Futures) who need to know if the market is Trending, Ranging, or preparing for a Breakout.
1. The "Regime" System (Standard Deviation Bands)
The core engine anchors a VWAP (Volume Weighted Average Price) to your chosen timeframe (Daily, Weekly, or Monthly) and projects volatility bands based on market variance.
The Trend Zone (Inner Band / 1.0 SD): This is the "Fair Value" zone. In a healthy trend, price will pull back into this zone and hold. A hold here signals a high-probability continuation (Trend Following).
The Reversion Zone (Outer Band / 2.0 SD): This represents a statistical extreme. Price rarely sustains movement beyond 2 Standard Deviations without a reversion. A touch of this band signals "Overbought" or "Oversold" conditions.
2. Liquidity Magnets (Virgin VWAPs)
The script automatically tracks "Unvisited VWAPs" from previous sessions. These are price levels where significant volume occurred but have not yet been re-tested.
The Logic: Algorithms often target these "open loops." The script visualizes them as Blue Dashed Lines with price tags.
Smart Scaling (Anti-Scrunch): Includes a custom "Ghost Engine" that automatically hides or "ghosts" magnets that are too far away. This prevents your chart from being squashed (scrunched) on lower timeframes, keeping your candles perfectly readable while still tracking targets in the background.
3. The Quant Matrix (Dashboard)
A real-time Heads-Up Display (HUD) that interprets the data for you:
Regime: Detects Volatility Squeezes. If the bands compress, it signals "⚠ SQUEEZE", warning you to stop mean-reversion trading and prepare for an explosive breakout.
Bias: Color-coded Trend Direction (Bullish/Bearish) based on VWAP slope.
Signal: actionable text prompts such as "BUY DIP" (Trend Following), "FADE EXT" (Mean Reversion), or "PREP BREAK" (Squeeze).
4. Visual Intelligence
Bold Day Separators: Clear, vertical dotted dividers with Date Stamps to instantly separate trading sessions.
Dynamic Labels: Floating labels on the right axis identify exactly which deviation level is which, preventing chart confusion.
How to Use
Strategy A: The Trend Pullback (continuation)
Check Matrix: Ensure Bias is BULLISH (Green).
Wait: Allow price to pull back into the Inner Band (Dark Green Zone).
Trigger: If price holds the Center VWAP or the -1.0 SD line, enter Long.
Target: The next Liquidity Magnet above or the +2.0 SD band.
Strategy B: The Reversion Fade (Counter-Trend)
Check Matrix: Ensure price is labeled "EXTREME" or Signal says "FADE EXT".
Trigger: Price touches or pierces the Outer Band (2.0 SD).
Action: Enter counter-trend (Short) with a target back to the Center VWAP (Mean Reversion).
Strategy C: The Magnet Target
Identify a "MAGNET" line (Blue Dashed) near current price.
These act as high-probability Take Profit levels. Price will often rush to these levels to "close the loop" before reversing.
Settings
Anchor: Daily (default), Weekly, or Monthly.
Magnet Focus Range: Adjusts how aggressively the script hides distant magnets to fix chart scaling (Default: 2%).
Visuals: Fully customizable colors, label sizes, and dashboard position.

Backtesting & Trading Engine [PineCoders]The PineCoders Backtesting and Trading Engine is a sophisticated framework with hybrid code that can run as a study to generate alerts for automated or discretionary trading while simultaneously providing backtest results. It can also easily be converted to a TradingView strategy in order to run TV backtesting. The Engine comes with many built-in strats for entries, filters, stops and exits, but you can also add you own.
If, like any self-respecting strategy modeler should, you spend a reasonable amount of time constantly researching new strategies and tinkering, our hope is that the Engine will become your inseparable go-to tool to test the validity of your creations, as once your tests are conclusive, you will be able to run this code as a study to generate the alerts required to put it in real-world use, whether for discretionary trading or to interface with an execution bot/app. You may also find the backtesting results the Engine produces in study mode enough for your needs and spend most of your time there, only occasionally converting to strategy mode in order to backtest using TV backtesting.
As you will quickly grasp when you bring up this script’s Settings, this is a complex tool. While you will be able to see results very quickly by just putting it on a chart and using its built-in strategies, in order to reap the full benefits of the PineCoders Engine, you will need to invest the time required to understand the subtleties involved in putting all its potential into play.
Disclaimer: use the Engine at your own risk.
Before we delve in more detail, here’s a bird’s eye view of the Engine’s features:
More than 40 built-in strategies,
Customizable components,
Coupling with your own external indicator,
Simple conversion from Study to Strategy modes,
Post-Exit analysis to search for alternate trade outcomes,
Use of the Data Window to show detailed bar by bar trade information and global statistics, including some not provided by TV backtesting,
Plotting of reminders and generation of alerts on in-trade events.
By combining your own strats to the built-in strats supplied with the Engine, and then tuning the numerous options and parameters in the Inputs dialog box, you will be able to play what-if scenarios from an infinite number of permutations.
USE CASES
You have written an indicator that provides an entry strat but it’s missing other components like a filter and a stop strategy. You add a plot in your indicator that respects the Engine’s External Signal Protocol, connect it to the Engine by simply selecting your indicator’s plot name in the Engine’s Settings/Inputs and then run tests on different combinations of entry stops, in-trade stops and profit taking strats to find out which one produces the best results with your entry strat.
You are building a complex strategy that you will want to run as an indicator generating alerts to be sent to a third-party execution bot. You insert your code in the Engine’s modules and leverage its trade management code to quickly move your strategy into production.
You have many different filters and want to explore results using them separately or in combination. Integrate the filter code in the Engine and run through different permutations or hook up your filtering through the external input and control your filter combos from your indicator.
You are tweaking the parameters of your entry, filter or stop strat. You integrate it in the Engine and evaluate its performance using the Engine’s statistics.
You always wondered what results a random entry strat would yield on your markets. You use the Engine’s built-in random entry strat and test it using different combinations of filters, stop and exit strats.
You want to evaluate the impact of fees and slippage on your strategy. You use the Engine’s inputs to play with different values and get immediate feedback in the detailed numbers provided in the Data Window.
You just want to inspect the individual trades your strategy generates. You include it in the Engine and then inspect trades visually on your charts, looking at the numbers in the Data Window as you move your cursor around.
You have never written a production-grade strategy and you want to learn how. Inspect the code in the Engine; you will find essential components typical of what is being used in actual trading systems.
You have run your system for a while and have compiled actual slippage information and your broker/exchange has updated his fees schedule. You enter the information in the Engine and run it on your markets to see the impact this has on your results.
FEATURES
Before going into the detail of the Inputs and the Data Window numbers, here’s a more detailed overview of the Engine’s features.
Built-in strats
The engine comes with more than 40 pre-coded strategies for the following standard system components:
Entries,
Filters,
Entry stops,
2 stage in-trade stops with kick-in rules,
Pyramiding rules,
Hard exits.
While some of the filter and stop strats provided may be useful in production-quality systems, you will not devise crazy profit-generating systems using only the entry strats supplied; that part is still up to you, as will be finding the elusive combination of components that makes winning systems. The Engine will, however, provide you with a solid foundation where all the trade management nitty-gritty is handled for you. By binding your custom strats to the Engine, you will be able to build reliable systems of the best quality currently allowed on the TV platform.
On-chart trade information
As you move over the bars in a trade, you will see trade numbers in the Data Window change at each bar. The engine calculates the P&L at every bar, including slippage and fees that would be incurred were the trade exited at that bar’s close. If the trade includes pyramided entries, those will be taken into account as well, although for those, final fees and slippage are only calculated at the trade’s exit.
You can also see on-chart markers for the entry level, stop positions, in-trade special events and entries/exits (you will want to disable these when using the Engine in strategy mode to see TV backtesting results).
Customization
You can couple your own strats to the Engine in two ways:
1. By inserting your own code in the Engine’s different modules. The modular design should enable you to do so with minimal effort by following the instructions in the code.
2. By linking an external indicator to the engine. After making the proper selections in the engine’s Settings and providing values respecting the engine’s protocol, your external indicator can, when the Engine is used in Indicator mode only:
Tell the engine when to enter long or short trades, but let the engine’s in-trade stop and exit strats manage the exits,
Signal both entries and exits,
Provide an entry stop along with your entry signal,
Filter other entry signals generated by any of the engine’s entry strats.
Conversion from strategy to study
TradingView strategies are required to backtest using the TradingView backtesting feature, but if you want to generate alerts with your script, whether for automated trading or just to trigger alerts that you will use in discretionary trading, your code has to run as a study since, for the time being, strategies can’t generate alerts. From hereon we will use indicator as a synonym for study.
Unless you want to maintain two code bases, you will need hybrid code that easily flips between strategy and indicator modes, and your code will need to restrict its use of strategy() calls and their arguments if it’s going to be able to run both as an indicator and a strategy using the same trade logic. That’s one of the benefits of using this Engine. Once you will have entered your own strats in the Engine, it will be a matter of commenting/uncommenting only four lines of code to flip between indicator and strategy modes in a matter of seconds.
Additionally, even when running in Indicator mode, the Engine will still provide you with precious numbers on your individual trades and global results, some of which are not available with normal TradingView backtesting.
Post-Exit Analysis for alternate outcomes (PEA)
While typical backtesting shows results of trade outcomes, PEA focuses on what could have happened after the exit. The intention is to help traders get an idea of the opportunity/risk in the bars following the trade in order to evaluate if their exit strategies are too aggressive or conservative.
After a trade is exited, the Engine’s PEA module continues analyzing outcomes for a user-defined quantity of bars. It identifies the maximum opportunity and risk available in that space, and calculates the drawdown required to reach the highest opportunity level post-exit, while recording the number of bars to that point.
Typically, if you can’t find opportunity greater than 1X past your trade using a few different reasonable lengths of PEA, your strategy is doing pretty good at capturing opportunity. Remember that 100% of opportunity is never capturable. If, however, PEA was finding post-trade maximum opportunity of 3 or 4X with average drawdowns of 0.3 to those areas, this could be a clue revealing your system is exiting trades prematurely. To analyze PEA numbers, you can uncomment complete sets of plots in the Plot module to reveal detailed global and individual PEA numbers.
Statistics
The Engine provides stats on your trades that TV backtesting does not provide, such as:
Average Profitability Per Trade (APPT), aka statistical expectancy, a crucial value.
APPT per bar,
Average stop size,
Traded volume .
It also shows you on a trade-by-trade basis, on-going individual trade results and data.
In-trade events
In-trade events can plot reminders and trigger alerts when they occur. The built-in events are:
Price approaching stop,
Possible tops/bottoms,
Large stop movement (for discretionary trading where stop is moved manually),
Large price movements.
Slippage and Fees
Even when running in indicator mode, the Engine allows for slippage and fees to be included in the logic and test results.
Alerts
The alert creation mechanism allows you to configure alerts on any combination of the normal or pyramided entries, exits and in-trade events.
Backtesting results
A few words on the numbers calculated in the Engine. Priority is given to numbers not shown in TV backtesting, as you can readily convert the script to a strategy if you need them.
We have chosen to focus on numbers expressing results relative to X (the trade’s risk) rather than in absolute currency numbers or in other more conventional but less useful ways. For example, most of the individual trade results are not shown in percentages, as this unit of measure is often less meaningful than those expressed in units of risk (X). A trade that closes with a +25% result, for example, is a poor outcome if it was entered with a -50% stop. Expressed in X, this trade’s P&L becomes 0.5, which provides much better insight into the trade’s outcome. A trade that closes with a P&L of +2X has earned twice the risk incurred upon entry, which would represent a pre-trade risk:reward ratio of 2.
The way to go about it when you think in X’s and that you adopt the sound risk management policy to risk a fixed percentage of your account on each trade is to equate a currency value to a unit of X. E.g. your account is 10K USD and you decide you will risk a maximum of 1% of it on each trade. That means your unit of X for each trade is worth 100 USD. If your APPT is 2X, this means every time you risk 100 USD in a trade, you can expect to make, on average, 200 USD.
By presenting results this way, we hope that the Engine’s statistics will appeal to those cognisant of sound risk management strategies, while gently leading traders who aren’t, towards them.
We trade to turn in tangible profits of course, so at some point currency must come into play. Accordingly, some values such as equity, P&L, slippage and fees are expressed in currency.
Many of the usual numbers shown in TV backtests are nonetheless available, but they have been commented out in the Engine’s Plot module.
Position sizing and risk management
All good system designers understand that optimal risk management is at the very heart of all winning strategies. The risk in a trade is defined by the fraction of current equity represented by the amplitude of the stop, so in order to manage risk optimally on each trade, position size should adjust to the stop’s amplitude. Systems that enter trades with a fixed stop amplitude can get away with calculating position size as a fixed percentage of current equity. In the context of a test run where equity varies, what represents a fixed amount of risk translates into different currency values.
Dynamically adjusting position size throughout a system’s life is optimal in many ways. First, as position sizing will vary with current equity, it reproduces a behavioral pattern common to experienced traders, who will dial down risk when confronted to poor performance and increase it when performance improves. Second, limiting risk confers more predictability to statistical test results. Third, position sizing isn’t just about managing risk, it’s also about maximizing opportunity. By using the maximum leverage (no reference to trading on margin here) into the trade that your risk management strategy allows, a dynamic position size allows you to capture maximal opportunity.
To calculate position sizes using the fixed risk method, we use the following formula: Position = Account * MaxRisk% / Stop% [, which calculates a position size taking into account the trade’s entry stop so that if the trade is stopped out, 100 USD will be lost. For someone who manages risk this way, common instructions to invest a certain percentage of your account in a position are simply worthless, as they do not take into account the risk incurred in the trade.
The Engine lets you select either the fixed risk or fixed percentage of equity position sizing methods. The closest thing to dynamic position sizing that can currently be done with alerts is to use a bot that allows syntax to specify position size as a percentage of equity which, while being dynamic in the sense that it will adapt to current equity when the trade is entered, does not allow us to modulate position size using the stop’s amplitude. Changes to alerts are on the way which should solve this problem.
In order for you to simulate performance with the constraint of fixed position sizing, the Engine also offers a third, less preferable option, where position size is defined as a fixed percentage of initial capital so that it is constant throughout the test and will thus represent a varying proportion of current equity.
Let’s recap. The three position sizing methods the Engine offers are:
1. By specifying the maximum percentage of risk to incur on your remaining equity, so the Engine will dynamically adjust position size for each trade so that, combining the stop’s amplitude with position size will yield a fixed percentage of risk incurred on current equity,
2. By specifying a fixed percentage of remaining equity. Note that unless your system has a fixed stop at entry, this method will not provide maximal risk control, as risk will vary with the amplitude of the stop for every trade. This method, as the first, does however have the advantage of automatically adjusting position size to equity. It is the Engine’s default method because it has an equivalent in TV backtesting, so when flipping between indicator and strategy mode, test results will more or less correspond.
3. By specifying a fixed percentage of the Initial Capital. While this is the least preferable method, it nonetheless reflects the reality confronted by most system designers on TradingView today. In this case, risk varies both because the fixed position size in initial capital currency represents a varying percentage of remaining equity, and because the trade’s stop amplitude may vary, adding another variability vector to risk.
Note that the Engine cannot display equity results for strategies entering trades for a fixed amount of shares/contracts at a variable price.
SETTINGS/INPUTS
Because the initial text first published with a script cannot be edited later and because there are just too many options, the Engine’s Inputs will not be covered in minute detail, as they will most certainly evolve. We will go over them with broad strokes; you should be able to figure the rest out. If you have questions, just ask them here or in the PineCoders Telegram group.
Display
The display header’s checkbox does nothing.
For the moment, only one exit strategy uses a take profit level, so only that one will show information when checking “Show Take Profit Level”.
Entries
You can activate two simultaneous entry strats, each selected from the same set of strats contained in the Engine. If you select two and they fire simultaneously, the main strat’s signal will be used.
The random strat in each list uses a different seed, so you will get different results from each.
The “Filter transitions” and “Filter states” strats delegate signal generation to the selected filter(s). “Filter transitions” signals will only fire when the filter transitions into bull/bear state, so after a trade is stopped out, the next entry may take some time to trigger if the filter’s state does not change quickly. When you choose “Filter states”, then a new trade will be entered immediately after an exit in the direction the filter allows.
If you select “External Indicator”, your indicator will need to generate a +2/-2 (or a positive/negative stop value) to enter a long/short position, providing the selected filters allow for it. If you wish to use the Engine’s capacity to also derive the entry stop level from your indicator’s signal, then you must explicitly choose this option in the Entry Stops section.
Filters
You can activate as many filters as you wish; they are additive. The “Maximum stop allowed on entry” is an important component of proper risk management. If your system has an average 3% stop size and you need to trade using fixed position sizes because of alert/execution bot limitations, you must use this filter because if your system was to enter a trade with a 15% stop, that trade would incur 5 times the normal risk, and its result would account for an abnormally high proportion in your system’s performance.
Remember that any filter can also be used as an entry signal, either when it changes states, or whenever no trade is active and the filter is in a bull or bear mode.
Entry Stops
An entry stop must be selected in the Engine, as it requires a stop level before the in-trade stop is calculated. Until the selected in-trade stop strat generates a stop that comes closer to price than the entry stop (or respects another one of the in-trade stops kick in strats), the entry stop level is used.
It is here that you must select “External Indicator” if your indicator supplies a +price/-price value to be used as the entry stop. A +price is expected for a long entry and a -price value will enter a short with a stop at price. Note that the price is the absolute price, not an offset to the current price level.
In-Trade Stops
The Engine comes with many built-in in-trade stop strats. Note that some of them share the “Length” and “Multiple” field, so when you swap between them, be sure that the length and multiple in use correspond to what you want for that stop strat. Suggested defaults appear with the name of each strat in the dropdown.
In addition to the strat you wish to use, you must also determine when it kicks in to replace the initial entry’s stop, which is determined using different strats. For strats where you can define a positive or negative multiple of X, percentage or fixed value for a kick-in strat, a positive value is above the trade’s entry fill and a negative one below. A value of zero represents breakeven.
Pyramiding
What you specify in this section are the rules that allow pyramiding to happen. By themselves, these rules will not generate pyramiding entries. For those to happen, entry signals must be issued by one of the active entry strats, and conform to the pyramiding rules which act as a filter for them. The “Filter must allow entry” selection must be chosen if you want the usual system’s filters to act as additional filtering criteria for your pyramided entries.
Hard Exits
You can choose from a variety of hard exit strats. Hard exits are exit strategies which signal trade exits on specific events, as opposed to price breaching a stop level in In-Trade Stops strategies. They are self-explanatory. The last one labelled When Take Profit Level (multiple of X) is reached is the only one that uses a level, but contrary to stops, it is above price and while it is relative because it is expressed as a multiple of X, it does not move during the trade. This is the level called Take Profit that is show when the “Show Take Profit Level” checkbox is checked in the Display section.
While stops focus on managing risk, hard exit strategies try to put the emphasis on capturing opportunity.
Slippage
You can define it as a percentage or a fixed value, with different settings for entries and exits. The entry and exit markers on the chart show the impact of slippage on the entry price (the fill).
Fees
Fees, whether expressed as a percentage of position size in and out of the trade or as a fixed value per in and out, are in the same units of currency as the capital defined in the Position Sizing section. Fees being deducted from your Capital, they do not have an impact on the chart marker positions.
In-Trade Events
These events will only trigger during trades. They can be helpful to act as reminders for traders using the Engine as assistance to discretionary trading.
Post-Exit Analysis
It is normally on. Some of its results will show in the Global Numbers section of the Data Window. Only a few of the statistics generated are shown; many more are available, but commented out in the Plot module.
Date Range Filtering
Note that you don’t have to change the dates to enable/diable filtering. When you are done with a specific date range, just uncheck “Date Range Filtering” to disable date filtering.
Alert Triggers
Each selection corresponds to one condition. Conditions can be combined into a single alert as you please. Just be sure you have selected the ones you want to trigger the alert before you create the alert. For example, if you trade in both directions and you want a single alert to trigger on both types of exits, you must select both “Long Exit” and “Short Exit” before creating your alert.
Once the alert is triggered, these settings no longer have relevance as they have been saved with the alert.
When viewing charts where an alert has just triggered, if your alert triggers on more than one condition, you will need the appropriate markers active on your chart to figure out which condition triggered the alert, since plotting of markers is independent of alert management.
Position sizing
You have 3 options to determine position size:
1. Proportional to Stop -> Variable, with a cap on size.
2. Percentage of equity -> Variable.
3. Percentage of Initial Capital -> Fixed.
External Indicator
This is where you connect your indicator’s plot that will generate the signals the Engine will act upon. Remember this only works in Indicator mode.
DATA WINDOW INFORMATION
The top part of the window contains global numbers while the individual trade information appears in the bottom part. The different types of units used to express values are:
curr: denotes the currency used in the Position Sizing section of Inputs for the Initial Capital value.
quote: denotes quote currency, i.e. the value the instrument is expressed in, or the right side of the market pair (USD in EURUSD ).
X: the stop’s amplitude, itself expressed in quote currency, which we use to express a trade’s P&L, so that a trade with P&L=2X has made twice the stop’s amplitude in profit. This is sometimes referred to as R, since it represents one unit of risk. It is also the unit of measure used in the APPT, which denotes expected reward per unit of risk.
X%: is also the stop’s amplitude, but expressed as a percentage of the Entry Fill.
The numbers appearing in the Data Window are all prefixed:
“ALL:” the number is the average for all first entries and pyramided entries.
”1ST:” the number is for first entries only.
”PYR:” the number is for pyramided entries only.
”PEA:” the number is for Post-Exit Analyses
Global Numbers
Numbers in this section represent the results of all trades up to the cursor on the chart.
Average Profitability Per Trade (X): This value is the most important gauge of your strat’s worthiness. It represents the returns that can be expected from your strat for each unit of risk incurred. E.g.: your APPT is 2.0, thus for every unit of currency you invest in a trade, you can on average expect to obtain 2 after the trade. APPT is also referred to as “statistical expectancy”. If it is negative, your strategy is losing, even if your win rate is very good (it means your winning trades aren’t winning enough, or your losing trades lose too much, or both). Its counterpart in currency is also shown, as is the APPT/bar, which can be a useful gauge in deciding between rivalling systems.
Profit Factor: Gross of winning trades/Gross of losing trades. Strategy is profitable when >1. Not as useful as the APPT because it doesn’t take into account the win rate and the average win/loss per trade. It is calculated from the total winning/losing results of this particular backtest and has less predictive value than the APPT. A good profit factor together with a poor APPT means you just found a chart where your system outperformed. Relying too much on the profit factor is a bit like a poker player who would think going all in with two’s against aces is optimal because he just won a hand that way.
Win Rate: Percentage of winning trades out of all trades. Taken alone, it doesn’t have much to do with strategy profitability. You can have a win rate of 99% but if that one trade in 100 ruins you because of poor risk management, 99% doesn’t look so good anymore. This number speaks more of the system’s profile than its worthiness. Still, it can be useful to gauge if the system fits your personality. It can also be useful to traders intending to sell their systems, as low win rate systems are more difficult to sell and require more handholding of worried customers.
Equity (curr): This the sum of initial capital and the P&L of your system’s trades, including fees and slippage.
Return on Capital is the equivalent of TV’s Net Profit figure, i.e. the variation on your initial capital.
Maximum drawdown is the maximal drawdown from the highest equity point until the drop . There is also a close to close (meaning it doesn’t take into account in-trade variations) maximum drawdown value commented out in the code.
The next values are self-explanatory, until:
PYR: Avg Profitability Per Entry (X): this is the APPT for all pyramided entries.
PEA: Avg Max Opp . Available (X): the average maximal opportunity found in the Post-Exit Analyses.
PEA: Avg Drawdown to Max Opp . (X): this represents the maximum drawdown (incurred from the close at the beginning of the PEA analysis) required to reach the maximal opportunity point.
Trade Information
Numbers in this section concern only the current trade under the cursor. Most of them are self-explanatory. Use the description’s prefix to determine what the values applies to.
PYR: Avg Profitability Per Entry (X): While this value includes the impact of all current pyramided entries (and only those) and updates when you move your cursor around, P&L only reflects fees at the trade’s last bar.
PEA: Max Opp . Available (X): It’s the most profitable close reached post-trade, measured from the trade’s Exit Fill, expressed in the X value of the trade the PEA follows.
PEA: Drawdown to Max Opp . (X): This is the maximum drawdown from the trade’s Exit Fill that needs to be sustained in order to reach the maximum opportunity point, also expressed in X. Note that PEA numbers do not include slippage and fees.
EXTERNAL SIGNAL PROTOCOL
Only one external indicator can be connected to a script; in order to leverage its use to the fullest, the engine provides options to use it as either an entry signal, an entry/exit signal or a filter. When used as an entry signal, you can also use the signal to provide the entry’s stop. Here’s how this works:
For filter state: supply +1 for bull (long entries allowed), -1 for bear (short entries allowed).
For entry signals: supply +2 for long, -2 for short.
For exit signals: supply +3 for exit from long, -3 for exit from short.
To send an entry stop level with an entry signal: Send positive stop level for long entry (e.g. 103.33 to enter a long with a stop at 103.33), negative stop level for short entry (e.g. -103.33 to enter a short with a stop at 103.33). If you use this feature, your indicator will have to check for exact stop levels of 1.0, 2.0 or 3.0 and their negative counterparts, and fudge them with a tick in order to avoid confusion with other signals in the protocol.
Remember that mere generation of the values by your indicator will have no effect until you explicitly allow their use in the appropriate sections of the Engine’s Settings/Inputs.
An example of a script issuing a signal for the Engine is published by PineCoders.
RECOMMENDATIONS TO ASPIRING SYSTEM DESIGNERS
Stick to higher timeframes. On progressively lower timeframes, margins decrease and fees and slippage take a proportionally larger portion of profits, to the point where they can very easily turn a profitable strategy into a losing one. Additionally, your margin for error shrinks as the equilibrium of your system’s profitability becomes more fragile with the tight numbers involved in the shorter time frames. Avoid <1H time frames.
Know and calculate fees and slippage. To avoid market shock, backtest using conservative fees and slippage parameters. Systems rarely show unexpectedly good returns when they are confronted to the markets, so put all chances on your side by being outrageously conservative—or a the very least, realistic. Test results that do not include fees and slippage are worthless. Slippage is there for a reason, and that’s because our interventions in the market change the market. It is easier to find alpha in illiquid markets such as cryptos because not many large players participate in them. If your backtesting results are based on moving large positions and you don’t also add the inevitable slippage that will occur when you enter/exit thin markets, your backtesting will produce unrealistic results. Even if you do include large slippage in your settings, the Engine can only do so much as it will not let slippage push fills past the high or low of the entry bar, but the gap may be much larger in illiquid markets.
Never test and optimize your system on the same dataset , as that is the perfect recipe for overfitting or data dredging, which is trying to find one precise set of rules/parameters that works only on one dataset. These setups are the most fragile and often get destroyed when they meet the real world.
Try to find datasets yielding more than 100 trades. Less than that and results are not as reliable.
Consider all backtesting results with suspicion. If you never entertained sceptic tendencies, now is the time to begin. If your backtest results look really good, assume they are flawed, either because of your methodology, the data you’re using or the software doing the testing. Always assume the worse and learn proper backtesting techniques such as monte carlo simulations and walk forward analysis to avoid the traps and biases that unchecked greed will set for you. If you are not familiar with concepts such as survivor bias, lookahead bias and confirmation bias, learn about them.
Stick to simple bars or candles when designing systems. Other types of bars often do not yield reliable results, whether by design (Heikin Ashi) or because of the way they are implemented on TV (Renko bars).
Know that you don’t know and use that knowledge to learn more about systems and how to properly test them, about your biases, and about yourself.
Manage risk first , then capture opportunity.
Respect the inherent uncertainty of the future. Cleanse yourself of the sad arrogance and unchecked greed common to newcomers to trading. Strive for rationality. Respect the fact that while backtest results may look promising, there is no guarantee they will repeat in the future (there is actually a high probability they won’t!), because the future is fundamentally unknowable. If you develop a system that looks promising, don’t oversell it to others whose greed may lead them to entertain unreasonable expectations.
Have a plan. Understand what king of trading system you are trying to build. Have a clear picture or where entries, exits and other important levels will be in the sort of trade you are trying to create with your system. This stated direction will help you discard more efficiently many of the inevitably useless ideas that will pop up during system design.
Be wary of complexity. Experienced systems engineers understand how rapidly complexity builds when you assemble components together—however simple each one may be. The more complex your system, the more difficult it will be to manage.
Play! . Allow yourself time to play around when you design your systems. While much comes about from working with a purpose, great ideas sometimes come out of just trying things with no set goal, when you are stuck and don’t know how to move ahead. Have fun!
@LucF
NOTES
While the engine’s code can supply multiple consecutive entries of longs or shorts in order to scale positions (pyramid), all exits currently assume the execution bot will exit the totality of the position. No partial exits are currently possible with the Engine.
Because the Engine is literally crippled by the limitations on the number of plots a script can output on TV; it can only show a fraction of all the information it calculates in the Data Window. You will find in the Plot Module vast amounts of commented out lines that you can activate if you also disable an equivalent number of other plots. This may be useful to explore certain characteristics of your system in more detail.
When backtesting using the TV backtesting feature, you will need to provide the strategy parameters you wish to use through either Settings/Properties or by changing the default values in the code’s header. These values are defined in variables and used not only in the strategy() statement, but also as defaults in the Engine’s relevant Inputs.
If you want to test using pyramiding, then both the strategy’s Setting/Properties and the Engine’s Settings/Inputs need to allow pyramiding.
If you find any bugs in the Engine, please let us know.
THANKS
To @glaz for allowing the use of his unpublished MA Squize in the filters.
To @everget for his Chandelier stop code, which is also used as a filter in the Engine.
To @RicardoSantos for his pseudo-random generator, and because it’s from him that I first read in the Pine chat about the idea of using an external indicator as input into another. In the PineCoders group, @theheirophant then mentioned the idea of using it as a buy/sell signal and @simpelyfe showed a piece of code implementing the idea. That’s the tortuous story behind the use of the external indicator in the Engine.
To @admin for the Volatility stop’s original code and for the donchian function lifted from Ichimoku .
To @BobHoward21 for the v3 version of Volatility Stop .
To @scarf and @midtownsk8rguy for the color tuning.
To many other scripters who provided encouragement and suggestions for improvement during the long process of writing and testing this piece of code.
To J. Welles Wilder Jr. for ATR, used extensively throughout the Engine.
To TradingView for graciously making an account available to PineCoders.
And finally, to all fellow PineCoders for the constant intellectual stimulation; it is a privilege to share ideas with you all. The Engine is for all TradingView PineCoders, of course—but especially for you.
Look first. Then leap.

Great Expectations [LucF]Great Expectations helps traders answer the question: What is possible? It is a powerful question, yet exploration of the unknown always entails risk. A more complete set of questions better suited to traders could be:
What opportunity exists from any given point on a chart?
What portion of this opportunity can be realistically captured?
What risk will be incurred in trying to do so, and how long will it take?
Great Expectations is the result of an exploration of these questions. It is a trade simulator that generates visual and quantitative information to help strategy modelers visually identify and analyse areas of optimal expectation on charts, whether they are designing automated or discretionary strategies.
WARNING: Great Expectations is NOT an indicator that helps determine the current state of a market. It works by looking at points in the past from which the future is already known. It uses one definition of repainting extensively (i.e. it goes back in the past to print information that could not have been know at the time). Repainting understood that way is in fact almost all the indicator does! —albeit for what I hope is a noble cause. The indicator is of no use whatsoever in analyzing markets in real-time. If you do not understand what it does, please stay away!
This is an indicator—not a strategy that uses TradingView’s backtesting engine. It works by simulating trades, not unlike a backtest, but with the crucial difference that it assumes a trade (either long or short) is entered on all bars in the historic sample. It walks forward from each bar and determines possible outcomes, gathering individual trade statistics that in turn generate precious global statistics from all outcomes tested on the chart.
Great Expectations provides numbers summarizing trade results on all simulations run from the chart. Those numbers cannot be compared to backtest-produced numbers since all non-filtered bars are examined, even if an entry was taken on the bar immediately preceding the current one, which never happens in a backtest. This peculiarity does NOT invalidate Great Expectations calculations; it just entails that results be considered under a different light. Provided they are evaluated within the indicator’s context, they can be useful—sometimes even more than backtesting results, e.g. in evaluating the impact of parameter-fitting or variations in entry, exit or filtering strats.
Traders and strategy modelers are creatures of hope often suffering from blurred vision; my hope is that Great Expectations will help them appraise the validity of their setup and strat intuitions in a realistic fashion, preventing confirmation bias from obstructing perspective—and great expectations from turning into financial great deceptions.
USE CASES
You’ve identified what looks like a promising setup on other indicators. You load Great Expectations on the chart and evaluate if its high-expectation areas match locations where your setup’s conditions occur. Unless today is your lucky day, chances are the indicator will help you realize your setup is not as promising as you had hoped.
You want to get a rough estimate of the optimal trade duration for a chart and you don’t mind using the entry and exit strategies provided with the indicator. You use the trade length readouts of the indicator.
You’re experimenting with a new stop strategy and want to know how long it will keep you in trades, on average. You integrate your stop strategy in the indicator’s code and look at the average trade length it produces and the TST ratio to evaluate its performance.
You have put together your own entry and exit criteria and are looking for a filter that will help you improve backtesting results. You visually ascertain the suitability of your filter by looking at its results on the charts with great Expectations, to see if your filter is choosing its areas correctly.
You have a strategy that shows backtested trades on your chart. Great Expectations can help you evaluate how well your strategy is benefitting from high-opportunity areas while avoiding poor expectation spots.
You want more complete statistics on your set of strategies than what backtesting will provide. You use Great Expectations, knowing that it tests all bars in the sample that correspond to your criteria, as opposed to backtesting results which are limited to a subset of all possible entries.
You want to fool your friends into thinking you’ve designed the holy grail of indicators, something that identifies optimal opportunities on any chart; you show them the P&L cloud.
FEATURES
For one trade
At any given point on the chart, assuming a trade is entered there, Great Expectations shows you information specific to that trade simulation both on the chart and in the Data Window.
The chart can display:
the P & L Cloud which shows whether the trade ended profitably or not, and by how much,
the Opportunity & Risk Cloud which the maximum opportunity and risk the simulation encountered. When superimposed over the P & L cloud, you will see what I call the managed opportunity and risk, i.e the portion of maximum opportunity that was captured and the portion of the maximum risk that was incurred,
the target and if it was reached,
a background that uses a gradient to show different levels of trade length, P&L or how frequently the target was reached during simulation.
The Data Window displays more than 40 values on individual trades and global results. For any given trade you will know:
Entry/Exit levels, including slippage impact,
It’s outcome and duration,
P/L achieved,
The fraction of the maximum opportunity/risk managed by the trade.
For all trades
After going through all the possible trades on the chart, the indicator will provide you with a rare view of all outcomes expressed with the P&L cloud, which allows us to instantly see the most/least profitable areas of a chart using trade data as support, while also showing its relationship with the opportunity/risk encountered during the simulation. The difference between the two clouds is the managed opportunity and risk.
The Data Window will present you with numbers which we will go through later. Some of them are: average stop size, P/L, win rate, % opportunity managed, trade lengths for different types of trade outcomes and the TST (Target:Stop Travel) ratio.
Let’s see Great Expectations in action… and remember to open your Data Window!
INPUTS
Trade direction : You must first choose if you wish to look at long or short trades. Because of the way the indicator works and the amount of visual information on the chart, it is only practical to look at one type of trades at a time. The default is Longs.
Maximum trade Length (MaxL) : This is the maximum walk forward distance the simulator will go in analyzing outcomes from any given point in the past. It also determines the size of the dead zone among the chart’s last bars. A red background line identifies the beginning of the dead zone for which not enough bars have elapsed to analyze outcomes for the maximum trade length defined. If an ATR-based entry stop is used, that length is added to the wait time before beginning simulations, so that the first entry starts with a clean ATR value. On a sample of around 16000 bars, my tests show that the indicator runs into server errors at lengths of around 290, i.e. having completed ~4,6M simulation loop iterations. That is way too high a length anyways; 100 will usually be amply enough to ring out all the possibilities out of a simulation, and on shorter time frames, 30 can be enough. While making it unduly small will prevent simulations of expressing the market’s potential, the less you use, the faster the indicator will run. The default is 40.
Unrealized P&L base at End of Trade (EOT) : When a simulation ends and the trade is still open, we calculate unrealized P&L from an exit order executed from either the last in-trade stop on the previous bar, or the close of the last bar. You can readily see the impact of this selection on the chart, with the P&L cloud. The default is on the close.
Display : The check box besides the title does nothing.
Show target : Shows a green line displaying the trade’s target expressed as a multiple of X, i.e. the amplitude of the entry stop. I call this value “X” and use it as a unit to express profit and loss on a trade (some call it “R”). The line is highlighted for trades where the close reached the target during the trade, whether the trade ended in profit or loss. This is also where you specify the multiple of X you wish to use in calculating targets. The multiple is used even if targets are not displayed.
Show P&L Cloud : The cloud allows traders to see right away the profitable areas of the chart. The only line printed with the cloud is the “end of trade line” (EOT). The EOT line is the only way one can see the level where a trade ended on the chart (in the Data Window you can see it as the “Exit Fill” value). The EOT level for the trade determines if the trade ended in a profit or a loss. Its value represents one of the following:
- fill from order executed at close of bar where stop is breached during trade (which produces “Realized P/L”),
- simulation of a fill pseudo-fill at the user-defined EOT level (last close or stop level) if the trade runs its course through MaxL bars without getting stopped (producing Unrealized P/L).
The EOT line and the cloud fill print in green when the trade’s outcome is profitable and in red when it is not. If the trade was closed after breaching the stop, the line appears brighter.
Show Opportunity&Risk Cloud : Displays the maximum opportunity/risk that was present during the trade, i.e. the maximum and minimum prices reached.
Background Color Scheme : Allows you to choose between 3 different color schemes for the background gradients, to accommodate different types of chart background/candles. Select “None” if you don’t want a background.
Background source : Determines what value will be used to generate the different intensities of the gradient. You can choose trade length (brighter is shorter), Trade P&L (brighter is higher) or the number of times the target was reached during simulation (brighter is higher). The default is Trade Length.
Entry strat : The check box besides the title does nothing. The default strat is All bars, meaning a trade will be simulated from all bars not excluded by the filters where a MaxL bars future exists. For fun, I’ve included a pseudo-random entry strat (an indirect way of changing the seed is to vary the starting date of the simulation).
Show Filter State : Displays areas where the combination of filters you have selected are allowing entries. Filtering occurs as per your selection(s), whether the state is displayed or not. The effect of multiple selections is additive. The filters are:
1. Bar direction: Longs will only be entered if close>open and vice versa.
2. Rising Volume: Applies to both long and shorts.
3. Rising/falling MA of the length you choose over the number of bars you choose.
4. Custom indicator: You can feed your own filtering signal through this from another indicator. It must produce a signal of 1 to allow long entries and 0 to allow shorts.
Show Entry Stops :
1. Multiple of user-defined length ATR.
2. Fixed percentage.
3. Fixed value.
All entry stops are calculated using the entry fill price as a reference. The fill price is calculated from the current bar’s open, to which slippage is added if configured. This simulates the case where the strategy issued the entry signal on the previous bar for it to be executed at the next bar’s open.
The entry stop remains active until the in-trade stop becomes the more aggressive of the two stops. From then on, the entry stop will be ignored, unless a bar close breaches the in-trade stop, in which case the stop will be reset with a new entry stop and the process repeats.
Show In-trade stops : Displays in bright red the selected in-trade stop (be sure to read the note in this section about them).
1. ATR multiple: added/subtracted from the average of the two previous bars minimum/maximum of open/close.
2. A trailing stop with a deviation expressed as a multiple of entry stop (X).
3. A fixed percentage trailing stop.
Trailing stops deviations are measured from the highest/lowest high/low reached during the trade.
Note: There is a twist with the in-trade stops. It’s that for any given bar, its in-trade stop can hold multiple values, as each successive pass of the advancing simulation loops goes over it from a different entry points. What is printed is the stop from the loop that ended on that bar, which may have nothing to do with other instances of the trade’s in-trade stop for the same bar when visited from other starting points in previous simulations. There is just no practical way to print all stop values that were used for any given bar. While the printed entry stops are the actual ones used on each bar, the in-trade stops shown are merely the last instance used among many.
Include Slippage : if checked, slippage will be added/subtracted from order price to yield the fill price. Slippage is in percentage. If you choose to include slippage in the simulations, remember to adjust it by considering the liquidity of the markets and the time frame you’ll be analyzing.
Include Fees : if checked, fees will be subtracted/added to both realized an unrealized trade profits/losses. Fees are in percentage. The default fees work well for crypto markets but will need adjusting for others—especially in Forex. Remember to modify them accordingly as they can have a major impact on results. Both fees and slippage are included to remind us of their importance, even if the global numbers produced by the indicator are not representative of a real trading scenario composed of sequential trades.
Date Range filtering : the usual. Just note that the checkbox has to be selected for date filtering to activate.
DATA WINDOW
Most of the information produced by this indicator is made available in the Data Window, which you bring up by using the icon below the Watchlist and Alerts buttons at the right of the TV UI. Here’s what’s there.
Some of the information presented in the Data Window is standard trade data; other values are not so standard; e. g. the notions of managed opportunity and risk and Target:Stop Travel ratio. The interplay between all the values provided by Great Expectations is inherently complex, even for a static set of entry/filter/exit strats. During the constant updating which the habitual process of progressive refinement in building strategies that is the lot of strategy modelers entails, another level of complexity is no doubt added to the analysis of this indicator’s values. While I don’t want to sound like Wolfram presenting A New Kind of Science , I do believe that if you are a serious strategy modeler and spend the time required to get used to using all the information this indicator makes available, you may find it useful.
Trade Information
Entry Order : This is the open of the bar where simulation starts. We suppose that an entry signal was generated at the previous bar.
Entry Fill (including slip.) : The actual entry price, including slippage. This is the base price from which other values will be calculated.
Exit Order : When a stop is breached, an exit order is executed from the close of the bar that breached the stop. While there is no “In-trade stop” value included in the Data Window (other than the End of trade Stop previously discussed), this “Exit Order” value is how we can know the level where the trade was stopped during the simulation. The “Trade Length” value will then show the bar where the stop was breached.
Exit Fill (including slip.) : When the exit order is simulated, slippage is added to the order level to create the fill.
Chart: Target : This is the target calculated at the beginning of the simulation. This value also appear on the chart in teal. It is controlled by the multiple of X defined under the “Show Target” checkbox in the Inputs.
Chart: Entry Stop : This value also appears on the chart (the red dots under points where a trade was simulated). Its value is controlled by the Entry Strat chosen in the Inputs.
X (% Fill, including Fees) and X (currency) : This is the stop’s amplitude (Entry Fill – Entry Stop) + Fees. It represents the risk incurred upon entry and will be used to express P&L. We will show R expressed in both a percentage of the Entry Fill level (this value), and currency (the next value). This value represents the risk in the risk:reward ratio and is considered to be a unit of 1 so that RR can be expressed as a single value (i.e. “2” actually meaning “1:2”).
Trade Length : If trade was stopped, it’s the number of bars elapsed until then. The trade is then considered “Closed”. If the trade ends without being stopped (there is no profit-taking strat implemented, so the stop is the only exit strat), then the trade is “Open”, the length is MaxL and it will show in orange. Otherwise the value will print in green/red to reflect if the trade is winning/losing.
P&L (X) : The P&L of the trade, expressed as a multiple of X, which takes into account fees paid at entry and exit. Given our default target setting at 2 units of “X”, a trade that closes at its target will have produced a P&L of +2.0, i.e. twice the value of X (not counting fees paid at exit ). A trade that gets stopped late 50% further that the entry stop’s level will produce a P&L of -1.5X.
P&L (currency, including Fees) : same value as above, but expressed in currency.
Target first reached at bar : If price closed above the target during the trade (even if it occurs after the trade was stopped), this will show when. This value will be used in calculating our TST ratio.
Times Stop/Target reached in sim. : Includes all occurrences during the complete simulation loop.
Opportunity (X) : The highest/lowest price reached during a simulation, i.e. the maximum opportunity encountered, whether the trade was previously stopped or not, expressed as a multiple of X.
Risk (X) : The lowest/highest price reached during a simulation, i.e. the maximum risk encountered, whether the trade was previously stopped or not, expressed as a multiple of X.
Risk:Opportunity : The greater this ratio, the greater Opportunity is, compared to Risk.
Managed Opportunity (%) : The portion of Opportunity that was captured by the highest/low stop position, even if it occurred after a previous stop closed the trade.
Managed Risk (%) : The portion of risk that was protected by the lowest/highest stop position, even if it occurred after a previous stop closed the trade. When this value is greater than 100%, it means the trade’s stop is protecting more than the maximum risk, which is frequent. You will, however, never see close to those values for the Managed Opportunity value, since the stop would have to be higher than the Maximum opportunity. It is much easier to alleviate the risk than it is to lock in profits.
Managed Risk:Opportunity : The ratio of the two preceding values.
Managed Opp. vs. Risk : The Managed Opportunity minus the Managed Risk. When it is negative, which is most often is, it means your strat is protecting a greater portion of the risk than it captures opportunity.
Global Numbers
Win Rate(%) : Percentage of winning trades over all entries. Open trades are considered winning if their last stop/close (as per user selection) locks in profits.
Avg X%, Avg X (currency) : Averages of previously described values:.
Avg Profitability/Trade (APPT) : This measures expectation using: Average Profitability Per Trade = (Probability of Win × Average Win) − (Probability of Loss × Average Loss) . It quantifies the average expectation/trade, which RR alone can’t do, as the probabilities of each outcome (win/lose) must also be used to calculate expectancy. The APPT combine the RR with the win rate to yield the true expectancy of a strategy. In my usual way of expressing risk with X, APPT is the equivalent of the average P&L per trade expressed in X. An APPT of -1.5 means that we lose on average 1.5X/trade.
Equity (X), Equity (currency) : The cumulative result of all trade outcomes, expressed as a multiple of X. Multiplied by the Average X in currency, this yields the Equity in currency.
Risk:Opportunity, Managed Risk:Opportunity, Managed Opp. vs. Risk : The global values of the ones previously described.
Avg Trade Length (TL) : One of the most important values derived by going through all the simulations. Again, it is composed of either the length of stopped trades, or MaxL when the trade isn’t stopped (open). This value can help systems modelers shape the characteristics of the components they use to build their strategies.
Avg Closed Win TL and Avg Closed Lose TL : The average lengths of winning/losing trades that were stopped.
Target reached? Avg bars to Stop and Target reached? Avg bars to Target : For the trades where the target was reached at some point in the simulation, the number of bars to the first point where the stop was breached and where the target was reached, respectively. These two values are used to calculate the next value.
TST (Target:Stop Travel Ratio) : This tracks the ratio between the two preceding values (Bars to first stop/Bars to first target), but only for trades where the target was reached somewhere in the loop. A ratio of 2 means targets are reached twice as fast as stops.
The next values of this section are counts or percentages and are self-explanatory.
Chart Plots
Contains chart plots of values already describes.
NOTES
Optimization/Overfitting: There is a fine line between optimizing and overfitting. Tools like this indicator can lead unsuspecting modelers down a path of overfitting that often turns strategies into over-specialized beasts that do not perform elegantly when confronted to the real-world. Proven testing strategies like walk forward analysis will go a long way in helping modelers alleviate this risk.
Input tuning: Because the results generated by the indicator will vary with the parameters used in the active entry, filtering and exit strats, it’s important to realize that although it may be fun at first, just slapping the default settings on a chart and time frame will not yield optimal nor reliable results. While using ATR as often as possible (as I do in this indicator) is a good way to make strat parametrization adaptable, it is not a foolproof solution.
There is no data for the last MaxL bars of the chart, since not enough trade future has elapsed to run a simulation from MaxL bars back.
Modifying the code: I have tried to structure the code modularly, even if that entails a larger code base, so that you can adapt it to your needs. I’ve included a few token components in each of the placeholders designed for entry strategies, filters, entry stops and in-trade stops. This will hopefully make it easier to add your own. In the same spirit, I have also commented liberally.
You will find in the code many instances of standard trade management tasks that can be lifted to code TV strategies where, as I do in mine, you manage everything yourself and don’t rely on built-in Pine strategy functions to act on your trades.
Enjoy!
THANKS
To @scarf who showed me how plotchar() could be used to plot values without ruining scale.
To @glaz for the suggestion to include a Chandelier stop strat; I will.
To @simpelyfe for the idea of using an indicator input for the filters (if some day TV lets us use more than one, it will be useful in other modules of the indicator).
To @RicardoSantos for the random generator used in the random entry strat.
To all scripters publishing open source on TradingView; their code is the best way to learn.
To my trading buddies Irving and Bruno; who showed me way back how pro traders get it done.

Hellenic EMA Matrix - PremiumHellenic EMA Matrix - Alpha Omega Premium
Complete User Guide
Table of Contents
Introduction
Indicator Philosophy
Mathematical Constants
EMA Types
Settings
Trading Signals
Visualization
Usage Strategies
FAQ
Introduction
Hellenic EMA Matrix is a premium indicator based on mathematical constants of nature: Phi (Phi - Golden Ratio), Pi (Pi), e (Euler's number). The indicator uses these universal constants to create dynamic EMAs that adapt to the natural rhythms of the market.
Key Features:
6 EMA types based on mathematical constants
Premium visualization with Neon Glow and Gradient Clouds
Automatic Fast/Mid/Slow EMA sorting
STRONG signals for powerful trends
Pulsing Ribbon Bar for instant trend assessment
Works on all timeframes (M1 - MN)
Indicator Philosophy
Why Mathematical Constants?
Traditional EMAs use arbitrary periods (9, 21, 50, 200). Hellenic Matrix goes further, using universal mathematical constants found in nature:
Phi (1.618) - Golden Ratio: galaxy spirals, seashells, human body proportions
Pi (3.14159) - Pi: circles, waves, cycles
e (2.71828) - Natural logarithm base: exponential growth, radioactive decay
Markets are also a natural system composed of millions of participants. Using mathematical constants allows tuning into the natural rhythms of market cycles.
Mathematical Constants
Phi (Phi) - Golden Ratio
Phi = 1.618033988749895
Properties:
Phi² = Phi + 1 = 2.618
Phi³ = 4.236
Phi⁴ = 6.854
Application: Ideal for trending movements and Fibonacci corrections
Pi (Pi) - Pi Number
Pi = 3.141592653589793
Properties:
2Pi = 6.283 (full circle)
3Pi = 9.425
4Pi = 12.566
Application: Excellent for cyclical markets and wave structures
e (Euler) - Euler's Number
e = 2.718281828459045
Properties:
e² = 7.389
e³ = 20.085
e⁴ = 54.598
Application: Suitable for exponential movements and volatile markets
EMA Types
1. Phi (Phi) - Golden Ratio EMA
Description: EMA based on the golden ratio
Period Formula:
Period = Phi^n × Base Multiplier
Parameters:
Phi Power Level (1-8): Power of Phi
Phi¹ = 1.618 → ~16 period (with Base=10)
Phi² = 2.618 → ~26 period
Phi³ = 4.236 → ~42 period (recommended)
Phi⁴ = 6.854 → ~69 period
Recommendations:
Phi² or Phi³ for day trading
Phi⁴ or Phi⁵ for swing trading
Works excellently as Fast EMA
2. Pi (Pi) - Circular EMA
Description: EMA based on Pi for cyclical movements
Period Formula:
Period = Pi × Multiple × Base Multiplier
Parameters:
Pi Multiple (1-10): Pi multiplier
1Pi = 3.14 → ~31 period (with Base=10)
2Pi = 6.28 → ~63 period (recommended)
3Pi = 9.42 → ~94 period
Recommendations:
2Pi ideal as Mid or Slow EMA
Excellently identifies cycles and waves
Use on volatile markets (crypto, forex)
3. e (Euler) - Natural EMA
Description: EMA based on natural logarithm
Period Formula:
Period = e^n × Base Multiplier
Parameters:
e Power Level (1-6): Power of e
e¹ = 2.718 → ~27 period (with Base=10)
e² = 7.389 → ~74 period (recommended)
e³ = 20.085 → ~201 period
Recommendations:
e² works excellently as Slow EMA
Ideal for stocks and indices
Filters noise well on lower timeframes
4. Delta (Delta) - Adaptive EMA
Description: Adaptive EMA that changes period based on volatility
Period Formula:
Period = Base Period × (1 + (Volatility - 1) × Factor)
Parameters:
Delta Base Period (5-200): Base period (default 20)
Delta Volatility Sensitivity (0.5-5.0): Volatility sensitivity (default 2.0)
How it works:
During low volatility → period decreases → EMA reacts faster
During high volatility → period increases → EMA smooths noise
Recommendations:
Works excellently on news and sharp movements
Use as Fast EMA for quick adaptation
Sensitivity 2.0-3.0 for crypto, 1.0-2.0 for stocks
5. Sigma (Sigma) - Composite EMA
Description: Composite EMA combining multiple active EMAs
Composition Methods:
Weighted Average (default):
Sigma = (Phi + Pi + e + Delta) / 4
Simple average of all active EMAs
Geometric Mean:
Sigma = fourth_root(Phi × Pi × e × Delta)
Geometric mean (more conservative)
Harmonic Mean:
Sigma = 4 / (1/Phi + 1/Pi + 1/e + 1/Delta)
Harmonic mean (more weight to smaller values)
Recommendations:
Enable for additional confirmation
Use as Mid EMA
Weighted Average - most universal method
6. Lambda (Lambda) - Wave EMA
Description: Wave EMA with sinusoidal period modulation
Period Formula:
Period = Base Period × (1 + Amplitude × sin(2Pi × bar / Frequency))
Parameters:
Lambda Base Period (10-200): Base period
Lambda Wave Amplitude (0.1-2.0): Wave amplitude
Lambda Wave Frequency (10-200): Wave frequency in bars
How it works:
Period pulsates sinusoidally
Creates wave effect following market cycles
Recommendations:
Experimental EMA for advanced users
Works well on cyclical markets
Frequency = 50 for day trading, 100+ for swing
Settings
Matrix Core Settings
Base Multiplier (1-100)
Multiplies all EMA periods
Base = 1: Very fast EMAs (Phi³ = 4, 2Pi = 6, e² = 7)
Base = 10: Standard (Phi³ = 42, 2Pi = 63, e² = 74)
Base = 20: Slow EMAs (Phi³ = 85, 2Pi = 126, e² = 148)
Recommendations by timeframe:
M1-M5: Base = 5-10
M15-H1: Base = 10-15 (recommended)
H4-D1: Base = 15-25
W1-MN: Base = 25-50
Matrix Source
Data source selection for EMA calculation:
close - closing price (standard)
open - opening price
high - high
low - low
hl2 - (high + low) / 2
hlc3 - (high + low + close) / 3
ohlc4 - (open + high + low + close) / 4
When to change:
hlc3 or ohlc4 for smoother signals
high for aggressive longs
low for aggressive shorts
Manual EMA Selection
Critically important setting! Determines which EMAs are used for signal generation.
Use Manual Fast/Slow/Mid Selection
Enabled (default): You select EMAs manually
Disabled: Automatic selection by periods
Fast EMA
Fast EMA - reacts first to price changes
Recommendations:
Phi Golden (recommended) - universal choice
Delta Adaptive - for volatile markets
Must be fastest (smallest period)
Slow EMA
Slow EMA - determines main trend
Recommendations:
Pi Circular (recommended) - excellent trend filter
e Natural - for smoother trend
Must be slowest (largest period)
Mid EMA
Mid EMA - additional signal filter
Recommendations:
e Natural (recommended) - excellent middle level
Pi Circular - alternative
None - for more frequent signals (only 2 EMAs)
IMPORTANT: The indicator automatically sorts selected EMAs by their actual periods:
Fast = EMA with smallest period
Mid = EMA with middle period
Slow = EMA with largest period
Therefore, you can select any combination - the indicator will arrange them correctly!
Premium Visualization
Neon Glow
Enable Neon Glow for EMAs - adds glowing effect around EMA lines
Glow Strength:
Light - subtle glow
Medium (recommended) - optimal balance
Strong - bright glow (may be too bright)
Effect: 2 glow layers around each EMA for 3D effect
Gradient Clouds
Enable Gradient Clouds - fills space between EMAs with gradient
Parameters:
Cloud Transparency (85-98): Cloud transparency
95-97 (recommended)
Higher = more transparent
Dynamic Cloud Intensity - automatically changes transparency based on EMA distance
Cloud Colors:
Phi-Pi Cloud:
Blue - when Pi above Phi (bullish)
Gold - when Phi above Pi (bearish)
Pi-e Cloud:
Green - when e above Pi (bullish)
Blue - when Pi above e (bearish)
2 layers for volumetric effect
Pulsing Ribbon Bar
Enable Pulsing Indicator Bar - pulsing strip at bottom/top of chart
Parameters:
Ribbon Position: Top / Bottom (recommended)
Pulse Speed: Slow / Medium (recommended) / Fast
Symbols and colors:
Green filled square - STRONG BULLISH
Pink filled square - STRONG BEARISH
Blue hollow square - Bullish (regular)
Red hollow square - Bearish (regular)
Purple rectangle - Neutral
Effect: Pulsation with sinusoid for living market feel
Signal Bar Highlights
Enable Signal Bar Highlights - highlights bars with signals
Parameters:
Highlight Transparency (88-96): Highlight transparency
Highlight Style:
Light Fill (recommended) - bar background fill
Thin Line - bar outline only
Highlights:
Golden Cross - green
Death Cross - pink
STRONG BUY - green
STRONG SELL - pink
Show Greek Labels
Shows Greek alphabet letters on last bar:
Phi - Phi EMA (gold)
Pi - Pi EMA (blue)
e - Euler EMA (green)
Delta - Delta EMA (purple)
Sigma - Sigma EMA (pink)
When to use: For education or presentations
Show Old Background
Old background style (not recommended):
Green background - STRONG BULLISH
Pink background - STRONG BEARISH
Blue background - Bullish
Red background - Bearish
Not recommended - use new Gradient Clouds and Pulsing Bar
Info Table
Show Info Table - table with indicator information
Parameters:
Position: Top Left / Top Right (recommended) / Bottom Left / Bottom Right
Size: Tiny / Small (recommended) / Normal / Large
Table contents:
EMA list - periods and current values of all active EMAs
Effects - active visual effects
TREND - current trend state:
STRONG UP - strong bullish
STRONG DOWN - strong bearish
Bullish - regular bullish
Bearish - regular bearish
Neutral - neutral
Momentum % - percentage deviation of price from Fast EMA
Setup - current Fast/Slow/Mid configuration
Trading Signals
Show Golden/Death Cross
Golden Cross - Fast EMA crosses Slow EMA from below (bullish signal) Death Cross - Fast EMA crosses Slow EMA from above (bearish signal)
Symbols:
Yellow dot "GC" below - Golden Cross
Dark red dot "DC" above - Death Cross
Show STRONG Signals
STRONG BUY and STRONG SELL - the most powerful indicator signals
Conditions for STRONG BULLISH:
EMA Alignment: Fast > Mid > Slow (all EMAs aligned)
Trend: Fast > Slow (clear uptrend)
Distance: EMAs separated by minimum 0.15%
Price Position: Price above Fast EMA
Fast Slope: Fast EMA rising
Slow Slope: Slow EMA rising
Mid Trending: Mid EMA also rising (if enabled)
Conditions for STRONG BEARISH:
Same but in reverse
Visual display:
Green label "STRONG BUY" below bar
Pink label "STRONG SELL" above bar
Difference from Golden/Death Cross:
Golden/Death Cross = crossing moment (1 bar)
STRONG signal = sustained trend (lasts several bars)
IMPORTANT: After fixes, STRONG signals now:
Work on all timeframes (M1 to MN)
Don't break on small retracements
Work with any Fast/Mid/Slow combination
Automatically adapt thanks to EMA sorting
Show Stop Loss/Take Profit
Automatic SL/TP level calculation on STRONG signal
Parameters:
Stop Loss (ATR) (0.5-5.0): ATR multiplier for stop loss
1.5 (recommended) - standard
1.0 - tight stop
2.0-3.0 - wide stop
Take Profit R:R (1.0-5.0): Risk/reward ratio
2.0 (recommended) - standard (risk 1.5 ATR, profit 3.0 ATR)
1.5 - conservative
3.0-5.0 - aggressive
Formulas:
LONG:
Stop Loss = Entry - (ATR × Stop Loss ATR)
Take Profit = Entry + (ATR × Stop Loss ATR × Take Profit R:R)
SHORT:
Stop Loss = Entry + (ATR × Stop Loss ATR)
Take Profit = Entry - (ATR × Stop Loss ATR × Take Profit R:R)
Visualization:
Red X - Stop Loss
Green X - Take Profit
Levels remain active while STRONG signal persists
Trading Signals
Signal Types
1. Golden Cross
Description: Fast EMA crosses Slow EMA from below
Signal: Beginning of bullish trend
How to trade:
ENTRY: On bar close with Golden Cross
STOP: Below local low or below Slow EMA
TARGET: Next resistance level or 2:1 R:R
Strengths:
Simple and clear
Works well on trending markets
Clear entry point
Weaknesses:
Lags (signal after movement starts)
Many false signals in ranging markets
May be late on fast moves
Optimal timeframes: H1, H4, D1
2. Death Cross
Description: Fast EMA crosses Slow EMA from above
Signal: Beginning of bearish trend
How to trade:
ENTRY: On bar close with Death Cross
STOP: Above local high or above Slow EMA
TARGET: Next support level or 2:1 R:R
Application: Mirror of Golden Cross
3. STRONG BUY
Description: All EMAs aligned + trend + all EMAs rising
Signal: Powerful bullish trend
How to trade:
ENTRY: On bar close with STRONG BUY or on pullback to Fast EMA
STOP: Below Fast EMA or automatic SL (if enabled)
TARGET: Automatic TP (if enabled) or by levels
TRAILING: Follow Fast EMA
Entry strategies:
Aggressive: Enter immediately on signal
Conservative: Wait for pullback to Fast EMA, then enter on bounce
Pyramiding: Add positions on pullbacks to Mid EMA
Position management:
Hold while STRONG signal active
Exit on STRONG SELL or Death Cross appearance
Move stop behind Fast EMA
Strengths:
Most reliable indicator signal
Doesn't break on pullbacks
Catches large moves
Works on all timeframes
Weaknesses:
Appears less frequently than other signals
Requires confirmation (multiple conditions)
Optimal timeframes: All (M5 - D1)
4. STRONG SELL
Description: All EMAs aligned down + downtrend + all EMAs falling
Signal: Powerful bearish trend
How to trade: Mirror of STRONG BUY
Visual Signals
Pulsing Ribbon Bar
Quick market assessment at a glance:
Symbol Color State
Filled square Green STRONG BULLISH
Filled square Pink STRONG BEARISH
Hollow square Blue Bullish
Hollow square Red Bearish
Rectangle Purple Neutral
Pulsation: Sinusoidal, creates living effect
Signal Bar Highlights
Bars with signals are highlighted:
Green highlight: STRONG BUY or Golden Cross
Pink highlight: STRONG SELL or Death Cross
Gradient Clouds
Colored space between EMAs shows trend strength:
Wide clouds - strong trend
Narrow clouds - weak trend or consolidation
Color change - trend change
Info Table
Quick reference in corner:
TREND: Current state (STRONG UP, Bullish, Neutral, Bearish, STRONG DOWN)
Momentum %: Movement strength
Effects: Active visual effects
Setup: Fast/Slow/Mid configuration
Usage Strategies
Strategy 1: "Golden Trailing"
Idea: Follow STRONG signals using Fast EMA as trailing stop
Settings:
Fast: Phi Golden (Phi³)
Mid: Pi Circular (2Pi)
Slow: e Natural (e²)
Base Multiplier: 10
Timeframe: H1, H4
Entry rules:
Wait for STRONG BUY
Enter on bar close or on pullback to Fast EMA
Stop below Fast EMA
Management:
Hold position while STRONG signal active
Move stop behind Fast EMA daily
Exit on STRONG SELL or Death Cross
Take Profit:
Partially close at +2R
Trail remainder until exit signal
For whom: Swing traders, trend followers
Pros:
Catches large moves
Simple rules
Emotionally comfortable
Cons:
Requires patience
Possible extended drawdowns on pullbacks
Strategy 2: "Scalping Bounces"
Idea: Scalp bounces from Fast EMA during STRONG trend
Settings:
Fast: Delta Adaptive (Base 15, Sensitivity 2.0)
Mid: Phi Golden (Phi²)
Slow: Pi Circular (2Pi)
Base Multiplier: 5
Timeframe: M5, M15
Entry rules:
STRONG signal must be active
Wait for price pullback to Fast EMA
Enter on bounce (candle closes above/below Fast EMA)
Stop behind local extreme (15-20 pips)
Take Profit:
+1.5R or to Mid EMA
Or to next level
For whom: Active day traders
Pros:
Many signals
Clear entry point
Quick profits
Cons:
Requires constant monitoring
Not all bounces work
Requires discipline for frequent trading
Strategy 3: "Triple Filter"
Idea: Enter only when all 3 EMAs and price perfectly aligned
Settings:
Fast: Phi Golden (Phi³)
Mid: e Natural (e²)
Slow: Pi Circular (3Pi)
Base Multiplier: 15
Timeframe: H4, D1
Entry rules (LONG):
STRONG BUY active
Price above all three EMAs
Fast > Mid > Slow (all aligned)
All EMAs rising (slope up)
Gradient Clouds wide and bright
Entry:
On bar close meeting all conditions
Or on next pullback to Fast EMA
Stop:
Below Mid EMA or -1.5 ATR
Take Profit:
First target: +3R
Second target: next major level
Trailing: Mid EMA
For whom: Conservative swing traders, investors
Pros:
Very reliable signals
Minimum false entries
Large profit potential
Cons:
Rare signals (2-5 per month)
Requires patience
Strategy 4: "Adaptive Scalper"
Idea: Use only Delta Adaptive EMA for quick volatility reaction
Settings:
Fast: Delta Adaptive (Base 10, Sensitivity 3.0)
Mid: None
Slow: Delta Adaptive (Base 30, Sensitivity 2.0)
Base Multiplier: 3
Timeframe: M1, M5
Feature: Two different Delta EMAs with different settings
Entry rules:
Golden Cross between two Delta EMAs
Both Delta EMAs must be rising/falling
Enter on next bar
Stop:
10-15 pips or below Slow Delta EMA
Take Profit:
+1R to +2R
Or Death Cross
For whom: Scalpers on cryptocurrencies and forex
Pros:
Instant volatility adaptation
Many signals on volatile markets
Quick results
Cons:
Much noise on calm markets
Requires fast execution
High commissions may eat profits
Strategy 5: "Cyclical Trader"
Idea: Use Pi and Lambda for trading cyclical markets
Settings:
Fast: Pi Circular (1Pi)
Mid: Lambda Wave (Base 30, Amplitude 0.5, Frequency 50)
Slow: Pi Circular (3Pi)
Base Multiplier: 10
Timeframe: H1, H4
Entry rules:
STRONG signal active
Lambda Wave EMA synchronized with trend
Enter on bounce from Lambda Wave
For whom: Traders of cyclical assets (some altcoins, commodities)
Pros:
Catches cyclical movements
Lambda Wave provides additional entry points
Cons:
More complex to configure
Not for all markets
Lambda Wave may give false signals
Strategy 6: "Multi-Timeframe Confirmation"
Idea: Use multiple timeframes for confirmation
Scheme:
Higher TF (D1): Determine trend direction (STRONG signal)
Middle TF (H4): Wait for STRONG signal in same direction
Lower TF (M15): Look for entry point (Golden Cross or bounce from Fast EMA)
Settings for all TFs:
Fast: Phi Golden (Phi³)
Mid: e Natural (e²)
Slow: Pi Circular (2Pi)
Base Multiplier: 10
Rules:
All 3 TFs must show one trend
Entry on lower TF
Stop by lower TF
Target by higher TF
For whom: Serious traders and investors
Pros:
Maximum reliability
Large profit targets
Minimum false signals
Cons:
Rare setups
Requires analysis of multiple charts
Experience needed
Practical Tips
DOs
Use STRONG signals as primary - they're most reliable
Let signals develop - don't exit on first pullback
Use trailing stop - follow Fast EMA
Combine with levels - S/R, Fibonacci, volumes
Test on demo before real
Adjust Base Multiplier for your timeframe
Enable visual effects - they help see the picture
Use Info Table - quick situation assessment
Watch Pulsing Bar - instant state indicator
Trust auto-sorting of Fast/Mid/Slow
DON'Ts
Don't trade against STRONG signal - trend is your friend
Don't ignore Mid EMA - it adds reliability
Don't use too small Base Multiplier on higher TFs
Don't enter on Golden Cross in range - check for trend
Don't change settings during open position
Don't forget risk management - 1-2% per trade
Don't trade all signals in row - choose best ones
Don't use indicator in isolation - combine with Price Action
Don't set too tight stops - let trade breathe
Don't over-optimize - simplicity = reliability
Optimal Settings by Asset
US Stocks (SPY, AAPL, TSLA)
Recommendation:
Fast: Phi Golden (Phi³)
Mid: e Natural (e²)
Slow: Pi Circular (2Pi)
Base: 10-15
Timeframe: H4, D1
Features:
Use on daily for swing
STRONG signals very reliable
Works well on trending stocks
Forex (EUR/USD, GBP/USD)
Recommendation:
Fast: Delta Adaptive (Base 15, Sens 2.0)
Mid: Phi Golden (Phi²)
Slow: Pi Circular (2Pi)
Base: 8-12
Timeframe: M15, H1, H4
Features:
Delta Adaptive works excellently on news
Many signals on M15-H1
Consider spreads
Cryptocurrencies (BTC, ETH, altcoins)
Recommendation:
Fast: Delta Adaptive (Base 10, Sens 3.0)
Mid: Pi Circular (2Pi)
Slow: e Natural (e²)
Base: 5-10
Timeframe: M5, M15, H1
Features:
High volatility - adaptation needed
STRONG signals can last days
Be careful with scalping on M1-M5
Commodities (Gold, Oil)
Recommendation:
Fast: Pi Circular (1Pi)
Mid: Phi Golden (Phi³)
Slow: Pi Circular (3Pi)
Base: 12-18
Timeframe: H4, D1
Features:
Pi works excellently on cyclical commodities
Gold responds especially well to Phi
Oil volatile - use wide stops
Indices (S&P500, Nasdaq, DAX)
Recommendation:
Fast: Phi Golden (Phi³)
Mid: e Natural (e²)
Slow: Pi Circular (2Pi)
Base: 15-20
Timeframe: H4, D1, W1
Features:
Very trending instruments
STRONG signals last weeks
Good for position trading
Alerts
The indicator supports 6 alert types:
1. Golden Cross
Message: "Hellenic Matrix: GOLDEN CROSS - Fast EMA crossed above Slow EMA - Bullish trend starting!"
When: Fast EMA crosses Slow EMA from below
2. Death Cross
Message: "Hellenic Matrix: DEATH CROSS - Fast EMA crossed below Slow EMA - Bearish trend starting!"
When: Fast EMA crosses Slow EMA from above
3. STRONG BULLISH
Message: "Hellenic Matrix: STRONG BULLISH SIGNAL - All EMAs aligned for powerful uptrend!"
When: All conditions for STRONG BUY met (first bar)
4. STRONG BEARISH
Message: "Hellenic Matrix: STRONG BEARISH SIGNAL - All EMAs aligned for powerful downtrend!"
When: All conditions for STRONG SELL met (first bar)
5. Bullish Ribbon
Message: "Hellenic Matrix: BULLISH RIBBON - EMAs aligned for uptrend"
When: EMAs aligned bullish + price above Fast EMA (less strict condition)
6. Bearish Ribbon
Message: "Hellenic Matrix: BEARISH RIBBON - EMAs aligned for downtrend"
When: EMAs aligned bearish + price below Fast EMA (less strict condition)
How to Set Up Alerts:
Open indicator on chart
Click on three dots next to indicator name
Select "Create Alert"
In "Condition" field select needed alert:
Golden Cross
Death Cross
STRONG BULLISH
STRONG BEARISH
Bullish Ribbon
Bearish Ribbon
Configure notification method:
Pop-up in browser
Email
SMS (in Premium accounts)
Push notifications in mobile app
Webhook (for automation)
Select frequency:
Once Per Bar Close (recommended) - once on bar close
Once Per Bar - during bar formation
Only Once - only first time
Click "Create"
Tip: Create separate alerts for different timeframes and instruments
FAQ
1. Why don't STRONG signals appear?
Possible reasons:
Incorrect Fast/Mid/Slow order
Solution: Indicator automatically sorts EMAs by periods, but ensure selected EMAs have different periods
Base Multiplier too large
Solution: Reduce Base to 5-10 on lower timeframes
Market in range
Solution: STRONG signals appear only in trends - this is normal
Too strict EMA settings
Solution: Try classic combination: Phi³ / Pi×2 / e² with Base=10
Mid EMA too close to Fast or Slow
Solution: Select Mid EMA with period between Fast and Slow
2. How often should STRONG signals appear?
Normal frequency:
M1-M5: 5-15 signals per day (very active markets)
M15-H1: 2-8 signals per day
H4: 3-10 signals per week
D1: 2-5 signals per month
W1: 2-6 signals per year
If too many signals - market very volatile or Base too small
If too few signals - market in range or Base too large
4. What are the best settings for beginners?
Universal "out of the box" settings:
Matrix Core:
Base Multiplier: 10
Source: close
Phi Golden: Enabled, Power = 3
Pi Circular: Enabled, Multiple = 2
e Natural: Enabled, Power = 2
Delta Adaptive: Enabled, Base = 20, Sensitivity = 2.0
Manual Selection:
Fast: Phi Golden
Mid: e Natural
Slow: Pi Circular
Visualization:
Gradient Clouds: ON
Neon Glow: ON (Medium)
Pulsing Bar: ON (Medium)
Signal Highlights: ON (Light Fill)
Table: ON (Top Right, Small)
Signals:
Golden/Death Cross: ON
STRONG Signals: ON
Stop Loss: OFF (while learning)
Timeframe for learning: H1 or H4
5. Can I use only one EMA?
No, minimum 2 EMAs (Fast and Slow) for signal generation.
Mid EMA is optional:
With Mid EMA = more reliable but rarer signals
Without Mid EMA = more signals but less strict filtering
Recommendation: Start with 3 EMAs (Fast/Mid/Slow), then experiment
6. Does the indicator work on cryptocurrencies?
Yes, works excellently! Especially good on:
Bitcoin (BTC)
Ethereum (ETH)
Major altcoins (SOL, BNB, XRP)
Recommended settings for crypto:
Fast: Delta Adaptive (Base 10-15, Sensitivity 2.5-3.0)
Mid: Pi Circular (2Pi)
Slow: e Natural (e²)
Base: 5-10
Timeframe: M15, H1, H4
Crypto market features:
High volatility → use Delta Adaptive
24/7 trading → set alerts
Sharp movements → wide stops
7. Can I trade only with this indicator?
Technically yes, but NOT recommended.
Best approach - combine with:
Price Action - support/resistance levels, candle patterns
Volume - movement strength confirmation
Fibonacci - retracement and extension levels
RSI/MACD - divergences and overbought/oversold
Fundamental analysis - news, company reports
Hellenic Matrix:
Excellently determines trend and its strength
Provides clear entry/exit points
Doesn't consider fundamentals
Doesn't see major levels
8. Why do Gradient Clouds change color?
Color depends on EMA order:
Phi-Pi Cloud:
Blue - Pi EMA above Phi EMA (bullish alignment)
Gold - Phi EMA above Pi EMA (bearish alignment)
Pi-e Cloud:
Green - e EMA above Pi EMA (bullish alignment)
Blue - Pi EMA above e EMA (bearish alignment)
Color change = EMA order change = possible trend change
9. What is Momentum % in the table?
Momentum % = percentage deviation of price from Fast EMA
Formula:
Momentum = ((Close - Fast EMA) / Fast EMA) × 100
Interpretation:
+0.5% to +2% - normal bullish momentum
+2% to +5% - strong bullish momentum
+5% and above - overheating (correction possible)
-0.5% to -2% - normal bearish momentum
-2% to -5% - strong bearish momentum
-5% and below - oversold (bounce possible)
Usage:
Monitor momentum during STRONG signals
Large momentum = don't enter (wait for pullback)
Small momentum = good entry point
10. How to configure for scalping?
Settings for scalping (M1-M5):
Base Multiplier: 3-5
Source: close or hlc3 (smoother)
Fast: Delta Adaptive (Base 8-12, Sensitivity 3.0)
Mid: None (for more signals)
Slow: Phi Golden (Phi²) or Pi Circular (1Pi)
Visualization:
- Gradient Clouds: ON (helps see strength)
- Neon Glow: OFF (doesn't clutter chart)
- Pulsing Bar: ON (quick assessment)
- Signal Highlights: ON
Signals:
- Golden/Death Cross: ON
- STRONG Signals: ON
- Stop Loss: ON (1.0-1.5 ATR, R:R 1.5-2.0)
Scalping rules:
Trade only STRONG signals
Enter on bounce from Fast EMA
Tight stops (10-20 pips)
Quick take profit (+1R to +2R)
Don't hold through news
11. How to configure for long-term investing?
Settings for investing (D1-W1):
Base Multiplier: 20-30
Source: close
Fast: Phi Golden (Phi³ or Phi⁴)
Mid: e Natural (e²)
Slow: Pi Circular (3Pi or 4Pi)
Visualization:
- Gradient Clouds: ON
- Neon Glow: ON (Medium)
- Everything else - to taste
Signals:
- Golden/Death Cross: ON
- STRONG Signals: ON
- Stop Loss: OFF (use percentage stop)
Investing rules:
Enter only on STRONG signals
Hold while STRONG active (weeks/months)
Stop below Slow EMA or -10%
Take profit: by company targets or +50-100%
Ignore short-term pullbacks
12. What if indicator slows down chart?
Indicator is optimized, but if it slows:
Disable unnecessary visual effects:
Neon Glow: OFF (saves 8 plots)
Gradient Clouds: ON but low quality
Lambda Wave EMA: OFF (if not using)
Reduce number of active EMAs:
Sigma Composite: OFF
Lambda Wave: OFF
Leave only Phi, Pi, e, Delta
Simplify settings:
Pulsing Bar: OFF
Greek Labels: OFF
Info Table: smaller size
13. Can I use on different timeframes simultaneously?
Yes! Multi-timeframe analysis is very powerful:
Classic scheme:
Higher TF (D1, W1) - determine global trend
Wait for STRONG signal
This is our trading direction
Middle TF (H4, H1) - look for confirmation
STRONG signal in same direction
Precise entry zone
Lower TF (M15, M5) - entry point
Golden Cross or bounce from Fast EMA
Precise stop loss
Example:
W1: STRONG BUY active (global uptrend)
H4: STRONG BUY appeared (confirmation)
M15: Wait for Golden Cross or bounce from Fast EMA → ENTRY
Advantages:
Maximum reliability
Clear timeframe hierarchy
Large targets
14. How does indicator work on news?
Delta Adaptive EMA adapts excellently to news:
Before news:
Low volatility → Delta EMA becomes fast → pulls to price
During news:
Sharp volatility spike → Delta EMA slows → filters noise
After news:
Volatility normalizes → Delta EMA returns to normal
Recommendations:
Don't trade at news release moment (spreads widen)
Wait for STRONG signal after news (2-5 bars)
Use Delta Adaptive as Fast EMA for quick reaction
Widen stops by 50-100% during important news
Advanced Techniques
Technique 1: "Divergences with EMA"
Idea: Look for discrepancies between price and Fast EMA
Bullish divergence:
Price makes lower low
Fast EMA makes higher low
= Possible reversal up
Bearish divergence:
Price makes higher high
Fast EMA makes lower high
= Possible reversal down
How to trade:
Find divergence
Wait for STRONG signal in divergence direction
Enter on confirmation
Technique 2: "EMA Tunnel"
Idea: Use space between Fast and Slow EMA as "tunnel"
Rules:
Wide tunnel - strong trend, hold position
Narrow tunnel - weak trend or consolidation, caution
Tunnel narrowing - trend weakening, prepare to exit
Tunnel widening - trend strengthening, can add
Visually: Gradient Clouds show this automatically!
Trading:
Enter on STRONG signal (tunnel starts widening)
Hold while tunnel wide
Exit when tunnel starts narrowing
Technique 3: "Wave Analysis with Lambda"
Idea: Lambda Wave EMA creates sinusoid matching market cycles
Setup:
Lambda Base Period: 30
Lambda Wave Amplitude: 0.5
Lambda Wave Frequency: 50 (adjusted to asset cycle)
How to find correct Frequency:
Look at historical cycles (distance between local highs)
Average distance = your Frequency
Example: if highs every 40-60 bars, set Frequency = 50
Trading:
Enter when Lambda Wave at bottom of sinusoid (growth potential)
Exit when Lambda Wave at top (fall potential)
Combine with STRONG signals
Technique 4: "Cluster Analysis"
Idea: When all EMAs gather in narrow cluster = powerful breakout soon
Cluster signs:
All EMAs (Phi, Pi, e, Delta) within 0.5-1% of each other
Gradient Clouds almost invisible
Price jumping around all EMAs
Trading:
Identify cluster (all EMAs close)
Determine breakout direction (where more volume, higher TFs direction)
Wait for breakout and STRONG signal
Enter on confirmation
Target = cluster size × 3-5
This is very powerful technique for big moves!
Technique 5: "Sigma as Dynamic Level"
Idea: Sigma Composite EMA = average of all EMAs = magnetic level
Usage:
Enable Sigma Composite (Weighted Average)
Sigma works as dynamic support/resistance
Price often returns to Sigma before trend continuation
Trading:
In trend: Enter on bounces from Sigma
In range: Fade moves from Sigma (trade return to Sigma)
On breakout: Sigma becomes support/resistance
Risk Management
Basic Rules
1. Position Size
Conservative: 1% of capital per trade
Moderate: 2% of capital per trade (recommended)
Aggressive: 3-5% (only for experienced)
Calculation formula:
Lot Size = (Capital × Risk%) / (Stop in pips × Pip value)
2. Risk/Reward Ratio
Minimum: 1:1.5
Standard: 1:2 (recommended)
Optimal: 1:3
Aggressive: 1:5+
3. Maximum Drawdown
Daily: -3% to -5%
Weekly: -7% to -10%
Monthly: -15% to -20%
Upon reaching limit → STOP trading until end of period
Position Management Strategies
1. Fixed Stop
Method:
Stop below/above Fast EMA or local extreme
DON'T move stop against position
Can move to breakeven
For whom: Beginners, conservative traders
2. Trailing by Fast EMA
Method:
Each day (or bar) move stop to Fast EMA level
Position closes when price breaks Fast EMA
Advantages:
Stay in trend as long as possible
Automatically exit on reversal
For whom: Trend followers, swing traders
3. Partial Exit
Method:
50% of position close at +2R
50% hold with trailing by Mid EMA or Slow EMA
Advantages:
Lock profit
Leave position for big move
Psychologically comfortable
For whom: Universal method (recommended)
4. Pyramiding
Method:
First entry on STRONG signal (50% of planned position)
Add 25% on pullback to Fast EMA
Add another 25% on pullback to Mid EMA
Overall stop below Slow EMA
Advantages:
Average entry price
Reduce risk
Increase profit in strong trends
Caution:
Works only in trends
In range leads to losses
For whom: Experienced traders
Trading Psychology
Correct Mindset
1. Indicator is a tool, not holy grail
Indicator shows probability, not guarantee
There will be losing trades - this is normal
Important is series statistics, not one trade
2. Trust the system
If STRONG signal appeared - enter
Don't search for "perfect" moment
Follow trading plan
3. Patience
STRONG signals don't appear every day
Better miss signal than enter against trend
Quality over quantity
4. Discipline
Always set stop loss
Don't move stop against position
Don't increase risk after losses
Beginner Mistakes
1. "I know better than indicator"
Indicator says STRONG BUY, but you think "too high, will wait for pullback"
Result: miss profitable move
Solution: Trust signals or don't use indicator
2. "Will reverse now for sure"
Trading against STRONG trend
Result: stops, stops, stops
Solution: Trend is your friend, trade with trend
3. "Will hold a bit more"
Don't exit when STRONG signal disappears
Greed eats profit
Solution: If signal gone - exit!
4. "I'll recover"
After losses double risk
Result: huge losses
Solution: Fixed % risk ALWAYS
5. "I don't like this signal"
Skip signals because of "feeling"
Result: inconsistency, no statistics
Solution: Trade ALL signals or clearly define filters
Trading Journal
What to Record
For each trade:
1. Entry/exit date and time
2. Instrument and timeframe
3. Signal type
Golden Cross
STRONG BUY
STRONG SELL
Death Cross
4. Indicator settings
Fast/Mid/Slow EMA
Base Multiplier
Other parameters
5. Chart screenshot
Entry moment
Exit moment
6. Trade parameters
Position size
Stop loss
Take Profit
R:R
7. Result
Profit/Loss in $
Profit/Loss in %
Profit/Loss in R
8. Notes
What was right
What was wrong
Emotions during trade
Lessons
Journal Analysis
Analyze weekly:
1. Win Rate
Win Rate = (Profitable trades / All trades) × 100%
Good: 50-60%
Excellent: 60-70%
Exceptional: 70%+
2. Average R
Average R = Sum of all R / Number of trades
Good: +0.5R
Excellent: +1.0R
Exceptional: +1.5R+
3. Profit Factor
Profit Factor = Total profit / Total losses
Good: 1.5+
Excellent: 2.0+
Exceptional: 3.0+
4. Maximum Drawdown
Track consecutive losses
If more than 5 in row - stop, check system
5. Best/Worst Trades
What was common in best trades? (do more)
What was common in worst trades? (avoid)
Pre-Trade Checklist
Technical Analysis
STRONG signal active (BUY or SELL)
All EMAs properly aligned (Fast > Mid > Slow or reverse)
Price on correct side of Fast EMA
Gradient Clouds confirm trend
Pulsing Bar shows STRONG state
Momentum % in normal range (not overheated)
No close strong levels against direction
Higher timeframe doesn't contradict
Risk Management
Position size calculated (1-2% risk)
Stop loss set
Take profit calculated (minimum 1:2)
R:R satisfactory
Daily/weekly risk limit not exceeded
No other open correlated positions
Fundamental Analysis
No important news in coming hours
Market session appropriate (liquidity)
No contradicting fundamentals
Understand why asset is moving
Psychology
Calm and thinking clearly
No emotions from previous trades
Ready to accept loss at stop
Following trading plan
Not revenging market for past losses
If at least one point is NO - think twice before entering!
Learning Roadmap
Week 1: Familiarization
Goals:
Install and configure indicator
Study all EMA types
Understand visualization
Tasks:
Add indicator to chart
Test all Fast/Mid/Slow settings
Play with Base Multiplier on different timeframes
Observe Gradient Clouds and Pulsing Bar
Study Info Table
Result: Comfort with indicator interface
Week 2: Signals
Goals:
Learn to recognize all signal types
Understand difference between Golden Cross and STRONG
Tasks:
Find 10 Golden Cross examples in history
Find 10 STRONG BUY examples in history
Compare their results (which worked better)
Set up alerts
Get 5 real alerts
Result: Understanding signals
Week 3: Demo Trading
Goals:
Start trading signals on demo account
Gather statistics
Tasks:
Open demo account
Trade ONLY STRONG signals
Keep journal (minimum 20 trades)
Don't change indicator settings
Strictly follow stop losses
Result: 20+ documented trades
Week 4: Analysis
Goals:
Analyze demo trading results
Optimize approach
Tasks:
Calculate win rate and average R
Find patterns in profitable trades
Find patterns in losing trades
Adjust approach (not indicator!)
Write trading plan
Result: Trading plan on 1 page
Month 2: Improvement
Goals:
Deepen understanding
Add additional techniques
Tasks:
Study multi-timeframe analysis
Test combinations with Price Action
Try advanced techniques (divergences, tunnels)
Continue demo trading (minimum 50 trades)
Achieve stable profitability on demo
Result: Win rate 55%+ and Profit Factor 1.5+
Month 3: Real Trading
Goals:
Transition to real account
Maintain discipline
Tasks:
Open small real account
Trade minimum lots
Strictly follow trading plan
DON'T increase risk
Focus on process, not profit
Result: Psychological comfort on real
Month 4+: Scaling
Goals:
Increase account
Become consistently profitable
Tasks:
With 60%+ win rate can increase risk to 2%
Upon doubling account can add capital
Continue keeping journal
Periodically review and improve strategy
Share experience with community
Result: Stable profitability month after month
Additional Resources
Recommended Reading
Technical Analysis:
"Technical Analysis of Financial Markets" - John Murphy
"Trading in the Zone" - Mark Douglas (psychology)
"Market Wizards" - Jack Schwager (trader interviews)
EMA and Moving Averages:
"Moving Averages 101" - Steve Burns
Articles on Investopedia about EMA
Risk Management:
"The Mathematics of Money Management" - Ralph Vince
"Trade Your Way to Financial Freedom" - Van K. Tharp
Trading Journals:
Edgewonk (paid, very powerful)
Tradervue (free version + premium)
Excel/Google Sheets (free)
Screeners:
TradingView Stock Screener
Finviz (stocks)
CoinMarketCap (crypto)
Conclusion
Hellenic EMA Matrix is a powerful tool based on universal mathematical constants of nature. The indicator combines:
Mathematical elegance - Phi, Pi, e instead of arbitrary numbers
Premium visualization - Neon Glow, Gradient Clouds, Pulsing Bar
Reliable signals - STRONG BUY/SELL work on all timeframes
Flexibility - 6 EMA types, adaptation to any trading style
Automation - auto-sorting EMAs, SL/TP calculation, alerts
Key Success Principles:
Simplicity - start with basic settings (Phi/Pi/e, Base=10)
Discipline - follow STRONG signals strictly
Patience - wait for quality setups
Risk Management - 1-2% per trade, ALWAYS
Journal - document every trade
Learning - constantly improve skills
Remember:
Indicator shows probability, not guarantee
Important is series statistics, not one trade
Psychology more important than technique
Quality more important than quantity
Process more important than result
Acknowledgments
Thank you for using Hellenic EMA Matrix - Alpha Omega Premium!
The indicator was created with love for mathematics, markets, and beautiful visualization.
Wishing you profitable trading!
Guide Version: 1.0
Date: 2025
Compatibility: Pine Script v6, TradingView
"In the simplicity of mathematical constants lies the complexity of market movements"

Buffett Quality Score [Consumer Discretionary]Evaluating Consumer Discretionary Companies with the Buffett Quality Score
The consumer discretionary sector, characterized by its sensitivity to economic cycles and consumer spending patterns, demands a robust framework for financial evaluation. The Buffett Quality Score offers a comprehensive assessment of financial health and performance specifically tailored to this dynamic industry. This scoring system combines critical financial ratios uniquely relevant to consumer discretionary companies, providing investors and analysts with a reliable tool for evaluation.
Selected Financial Metrics and Criteria
1. Altman Z-Score > 2.0
Relevance: The Altman Z-Score assesses bankruptcy risk, combining profitability, leverage, liquidity, solvency, and activity ratios. For consumer discretionary companies, which often face volatile market conditions, a score above 2.0 indicates financial stability and the ability to withstand economic downturns. This metric is particularly important in this sector due to the high variability in consumer spending.
2. Piotroski F-Score > 6.0
Relevance: The Piotroski F-Score evaluates fundamental strength based on profitability, leverage, liquidity, and operating efficiency. In the consumer discretionary sector, where rapid changes in consumer preferences can impact performance, a score above 6.0 highlights strong fundamental performance and resilience. This score is crucial for identifying companies with robust financial foundations in a highly competitive environment.
3. Asset Turnover > 1.0
Relevance: Asset Turnover measures the efficiency of asset use in generating sales. For consumer discretionary companies, a ratio above 1.0 signifies effective utilization of assets to drive revenue growth. Given the sector's reliance on high sales volumes and rapid inventory turnover, this metric is key to assessing operational efficiency.
4. Current Ratio > 1.5
Relevance: The Current Ratio assesses liquidity by comparing current assets to current liabilities. A ratio above 1.5 ensures that consumer discretionary companies can meet short-term obligations. This liquidity is essential for maintaining operational stability and flexibility to adapt to market changes, especially during economic fluctuations.
5. Debt to Equity Ratio < 1.0
Relevance: A lower Debt to Equity Ratio indicates prudent financial management and reduced reliance on debt. This is particularly important for consumer discretionary companies, which need to maintain financial flexibility to invest in new trends and innovations without overleveraging. Lower debt levels also reduce risk during economic downturns.
6. EBITDA Margin > 15.0%
Relevance: The EBITDA Margin measures operating profitability. A margin above 15.0% indicates efficient operations and the ability to generate sufficient earnings before interest, taxes, depreciation, and amortization. This is crucial for sustaining profitability in a competitive and fluctuating market, ensuring the company can reinvest in growth and innovation.
7. EPS One-Year Growth > 5.0%
Relevance: EPS growth reflects the company’s ability to increase earnings per share over the past year. For consumer discretionary companies, growth exceeding 5.0% signals positive earnings momentum, which is vital for investor confidence and the ability to fund future growth initiatives. This metric highlights companies that are successfully increasing profitability.
8. Gross Margin > 25.0%
Relevance: Gross Margin represents the profitability of sales after production costs. A margin exceeding 25.0% indicates strong pricing power and effective cost management, crucial for maintaining profitability while adapting to changing consumer demands. High gross margins are indicative of a company’s ability to control costs and price products competitively.
9. Net Margin > 10.0%
Relevance: Net Margin measures overall profitability after all expenses. A margin above 10.0% highlights the company’s ability to maintain strong profit levels, ensuring financial health and stability. This is essential for sustaining operations and investing in new opportunities, reflecting the company's efficiency in converting revenue into actual profit.
10.Return on Equity (ROE) > 15.0%
Relevance: ROE indicates how effectively a company uses equity to generate profits. An ROE above 15.0% signifies strong shareholder value creation. This metric is key for evaluating long-term performance in the consumer discretionary sector, where investor returns are closely tied to the company’s ability to innovate and grow. High ROE demonstrates effective management and profitable use of equity capital.
Interpreting the Buffett Quality Score
0-4 Points: Indicates potential weaknesses across multiple financial areas, warranting further investigation and risk assessment.
5 Points: Suggests average performance based on sector-specific criteria, indicating a need for cautious optimism.
6-10 Points: Signifies strong financial health and quality, meeting or exceeding most performance thresholds, making the company a potentially attractive investment.
Conclusion
The Buffett Quality Score provides a structured approach to evaluating financial health and performance. By focusing on these essential financial metrics, stakeholders can make informed decisions, identifying companies that are well-positioned to thrive in the competitive and economically sensitive consumer discretionary sector.
Disclaimer: The Buffett Quality Score serves as a tool for financial evaluation and analysis. It is not a substitute for professional financial advice or investment recommendations. Investors should conduct thorough research and seek personalized guidance based on individual circumstances.

Kinetic Elasticity Reversion System - Adaptive Genesis Engine🧬 KERS-AGE - EVOLVED KINETIC ELASTICITY REVERSION SYSTEM
EDUCATIONAL GUIDE & THEORETICAL FOUNDATION
⚠️ IMPORTANT DISCLAIMER
This indicator and guide are provided for educational and informational purposes only. This is NOT financial advice, investment advice, or a recommendation to buy or sell any security.
Trading involves substantial risk of loss. Past performance does not guarantee future results. The performance metrics, win rates, and examples shown are from historical backtesting and do not represent actual trading results. Always conduct your own research, paper trade extensively, and never risk capital you cannot afford to lose.
The developers assume no responsibility for any trading losses incurred through use of this indicator.
INTRODUCTION
KERS-AGE (Kinetic Elasticity Reversion System - Adaptive Genetic Evolution) represents an educational exploration of adaptive trading systems. Unlike traditional indicators with fixed parameters, KERS-AGE demonstrates a dynamic, evolving approach that adjusts to market conditions through genetic algorithms and machine learning techniques.
This guide explains the theoretical concepts, technical implementation, and educational examples of how the system operates.
CONCEPTUAL FRAMEWORK
Traditional Indicators vs. Adaptive Systems:
Traditional Indicators:
Fixed parameters
Single strategy approach
Static behavior
Designed for specific conditions
Require manual optimization
Adaptive System Approach (KERS-AGE):
Dynamic parameters (adjust based on conditions)
Multiple strategies tested simultaneously
Pattern recognition (cluster analysis)
Regime-aware (speciation)
Automated optimization (genetic algorithms)
Transparent operation (detailed dashboard)
CORE CONCEPTS EXPLAINED
1. THE ELASTICITY ANALOGY 🎯
The indicator models price behavior as if connected to a moving average by an elastic band:
Price extends away → Elastic tension builds → Potential reversion point identified
Key Measurements:
STRETCH: Distance from price to equilibrium (MA)
TENSION: Normalized force calculation
THRESHOLD: Point where multiple factors align
Theoretical Foundation:
Markets have historically shown mean-reverting tendencies around fair value. This concept quantifies the deviation and identifies potential reversal zones based on multiple confluence factors.
Mathematical Approach:
text
Tension Score = (Price Distance from MA) / (Band Width) × Volatility Scaling
Signal Threshold = Multiple of ATR × Dynamic Volatility Ratio
Confluence = Tension Score + Additional Factors
2. THE 6 SIGNAL TYPES 📊
The system recognizes 6 distinct pattern categories:
A. ELASTIC SIGNALS
Pattern: Price reaches statistical band extremes
Theory: Maximum deviation from mean suggests potential reversion
Detection: Price touches outer zones (typically 2-3× ATR from MA)
Component: Mathematical band extension measurement
Historical Context: Often observed in markets with clear swing patterns
B. WICK SIGNALS
Pattern: Extended rejection wicks on candles
Theory: Failed breakout attempts may indicate directional exhaustion
Detection: Upper/lower wick exceeding 2× body size
Component: Real-time price rejection measurement
Historical Context: Common in volatile conditions with rapid reversals
C. EXHAUSTION SIGNALS
Pattern: Decelerating momentum despite price extension
Theory: Velocity and acceleration divergence may precede reversals
Detection: Decreasing velocity with negative acceleration
Component: Momentum derivative analysis
Historical Context: Often seen at trend maturity points
D. CLIMAX SIGNALS
Pattern: Volume spike at price extreme
Theory: Unusual volume at extremes historically correlates with turning points
Detection: Volume 1.5-2.5× average at band extreme
Component: Volume-price relationship analysis
Historical Context: Associated with institutional activity or capitulation
E. STRUCTURE SIGNALS
Pattern: Fractal pivot formations (swing highs/lows)
Theory: Market structure points have historically acted as support/resistance
Detection: 2-4 bar pivot patterns
Component: Classical technical analysis
Historical Context: Universal across timeframes and markets
F. DIVERGENCE SIGNALS
Pattern: RSI divergence versus price
Theory: Momentum divergence has historically preceded price reversals
Detection: Price makes new extreme but RSI does not
Component: Oscillator divergence detection
Historical Context: Considered a leading indicator in technical analysis
Pattern Confluence:
Historical testing suggests stronger signals when multiple types align:
Elastic + Wick + Volume = Higher confluence score
Elastic + Exhaustion + Divergence = Multiple confirmation factors
Any 3+ types = Increased pattern strength
Note: Past pattern performance does not guarantee future occurrence.
3. REGIME DETECTION 🌍
The system attempts to classify market conditions into three behavioral regimes:
📈 TREND REGIME
Detection Methodology:
text
Efficiency Ratio = Net Movement / Total Movement
Classification: Efficiency > 0.5 AND Volatility < 1.3 → TREND
Characteristics Observed:
Directional price movement
Relatively lower volatility
Defined higher highs/lower lows
Persistent directional momentum
System Response:
Reduces signal frequency
Prioritizes trend-specialist strategies
Applies additional filtering to counter-trend signals
Increases confluence requirements
Educational Note:
In trending conditions, counter-trend mean reversion signals historically have shown reduced reliability. Users may consider additional confirmation when trend regime is detected.
↔️ RANGE REGIME
Detection Methodology:
text
Classification: Efficiency < 0.5 AND Volatility 0.9-1.4 → RANGE
Characteristics Observed:
Oscillating price action
Defined support/resistance zones
Mean-reverting behavior patterns
Relatively balanced directional flow
System Response:
Increases signal frequency
Activates range-specialist strategies
Adjusts bands relative to volatility
Reduces confluence threshold
Educational Note:
Historical backtesting suggests mean reversion systems have performed better in ranging conditions. This does not guarantee future performance.
🌊 VOLATILE REGIME
Detection Methodology:
text
Classification: DVS (Dynamic Volatility Scaling) > 1.5 → VOLATILE
Characteristics Observed:
Erratic price swings
Expanded ranges
Elevated ATR readings
Often news or event-driven
System Response:
Activates volatility-specialist strategies
Widens bands automatically
Prioritizes wick rejection signals
Emphasizes volume confirmation
Educational Note:
Volatile conditions historically present both opportunity and increased risk. Wider stops may be appropriate for risk management.
4. GENETIC EVOLUTION EXPLAINED 🧬
The system employs genetic algorithms to optimize parameters - an approach used in computational finance research.
The Evolution Process:
STEP 1: INITIALIZATION
text
Initial State: System creates 4 starter strategies
- Strategy 0: Range-optimized parameters
- Strategy 1: Trend-optimized parameters
- Strategy 2: Volatility-optimized parameters
- Strategy 3: Balanced parameters
Each contains 14 adjustable parameters (genes):
- Band sensitivity
- Extension multiplier
- Wick threshold
- Momentum threshold
- Volume multiplier
- Component weights (elastic, wick, momentum, volume, fractal)
- Target percentage
STEP 2: COMPETITION (Shadow Trading)
text
Early Bars: All strategies generate signals in parallel
- Each tracks hypothetical performance independently
- Simulated P&L, win rate, Sharpe ratio calculated
- No actual trades executed (educational simulation)
- Performance metrics recorded for analysis
STEP 3: FITNESS EVALUATION
text
Fitness Calculation =
0.25 × Win Rate +
0.25 × PnL Score +
0.15 × Drawdown Score +
0.30 × Sharpe Ratio Score +
0.05 × Trade Count Score
With Walk-Forward enabled:
Fitness = 0.60 × Test Score + 0.40 × Train Score
With Speciation enabled:
Fitness adjusted by Diversity Penalty
STEP 4: SELECTION (Tournament)
text
Periodically (default every 50 bars):
- Randomly select 4 active strategies
- Compare fitness scores
- Top 2 selected as "parents"
STEP 5: CROSSOVER (Breeding)
text
Parent 1 Fitness: 0.65
Parent 2 Fitness: 0.55
Weight calculation: 0.65/(0.65+0.55) = 54%
For each parameter:
Child Parameter = (0.54 × Parent1) + (0.46 × Parent2)
Example:
Band Sensitivity: (0.54 × 1.5) + (0.46 × 2.0) = 1.73
STEP 6: MUTATION
text
For each parameter:
if random(0-1) < Mutation Rate (default 0.15):
Add random variation: -12% to +12%
Purpose: Prevents premature convergence
Enables: Discovery of novel parameter combinations
ADAPTIVE MUTATION:
If population fitness converges → Mutation rate × 1.5
(Encourages exploration when diversity decreases)
STEP 7: INSERTION
text
New strategy added to population:
- Assigned unique ID number
- Generation counter incremented
- Begins shadow trading
- Competes with existing strategies
STEP 8: CULLING (Selection Pressure)
text
Periodically (default every 100 bars):
- Identify lowest fitness strategy
- Verify not elite (protected top performers)
- Verify not last of species
- Remove from population
Result: Maintains selection pressure
Effect: Prevents weak strategies from diluting signals
STEP 9: SIGNAL GENERATION LOGIC
text
When determining signals to display:
If Ensemble enabled:
- All strategies cast weighted votes
- Weights based on fitness scores
- Specialists receive boost in matching regime
- Signal generated if consensus threshold reached
If Ensemble disabled:
- Single highest-fitness strategy used
STEP 10: ADAPTATION OBSERVATION
text
Over time: Population characteristics may shift
- Lower-performing strategies removed
- Higher-performing strategies replicated
- Parameters adjust toward observed optima
- Fitness scores generally trend upward
Long-term: Population reaches maturity
- Strategies become specialized
- Parameters optimized for recent conditions
- Performance stabilizes
Educational Context:
Genetic algorithms are a recognized computational method for optimization problems. This implementation applies those concepts to trading parameter optimization. Past optimization results do not guarantee future performance.
5. SPECIATION (Niche Specialization) 🐟🦎🦅
Inspired by biological speciation theory applied to algorithmic trading.
The Three Species:
RANGE SPECIALISTS 📊
text
Optimized for: Sideways market conditions
Parameter tendencies:
- Tighter bands (1.0-1.5× ATR)
- Higher sensitivity to elastic stretch
- Emphasis on fractal structure
- More frequent signal generation
Typically emerge when:
- Range regime detected
- Clear support/resistance present
- Mean reversion showing historical success
Historical backtesting observations:
- Win rates often in 55-65% range
- Smaller reward/risk ratios (0.5-1.5R)
- Higher trade frequency
TREND SPECIALISTS 📈
text
Optimized for: Directional market conditions
Parameter tendencies:
- Wider bands (2.0-2.5× ATR)
- Focus on momentum exhaustion
- Emphasis on divergence patterns
- More selective signal generation
Typically emerge when:
- Trend regime detected
- Strong directional movement observed
- Counter-trend exhaustion signals sought
Historical backtesting observations:
- Win rates often in 40-55% range
- Larger reward/risk ratios (1.5-3.0R)
- Lower trade frequency
VOLATILITY SPECIALISTS 🌊
text
Optimized for: High-volatility conditions
Parameter tendencies:
- Expanded bands (1.5-2.0× ATR)
- Priority on wick rejection patterns
- Strong volume confirmation requirement
- Very selective signals
Typically emerge when:
- Volatile regime detected
- High DVS ratio (>1.5)
- News-driven or event-driven conditions
Historical backtesting observations:
- Win rates often in 50-60% range
- Variable reward/risk ratios (1.0-2.5R)
- Opportunistic trade timing
Species Protection Mechanism:
text
Minimum Per Species: Configurable (default 2)
If Range specialists = 1:
→ Preferential spawning of Range type
→ Protection from culling process
Purpose: Ensures coverage across regime types
Theory: Markets cycle between behavioral states
Goal: Prevent extinction of specialized approaches
Fitness Sharing:
text
If Species has 4 members:
Individual Fitness × 1 / (4 ^ 0.3)
Individual Fitness × 0.72
Purpose: Creates pressure toward species diversity
Effect: Prevents single approach from dominating population
Educational Note: Speciation is a theoretical framework for maintaining strategy diversity. Past specialization performance does not guarantee future regime classification accuracy or signal quality.
6. WALK-FORWARD VALIDATION 📈
An out-of-sample testing methodology used in quantitative research to reduce overfitting risk.
The Overfitting Problem:
text
Hypothetical Example:
In-Sample Backtest: 85% win rate
Out-of-Sample Results: 35% win rate
Explanation: Strategy may have optimized to historical noise
rather than repeatable patterns
Walk-Forward Methodology:
Timeline Structure:
text
┌──────────────────────────────────────────────────────┐
│ Train Window │ Test Window │ Train │ Test │
│ (200 bars) │ (50 bars) │ (200) │ (50) │
└──────────────────────────────────────────────────────┘
In-Sample Out-of-Sample IS OOS
(Optimize) (Validate) Cycle 2...
TRAIN PHASE (In-Sample):
text
Example Bars 1-200: Strategies optimize parameters
- Performance tracked
- Not yet used for primary fitness
- Learning period
TEST PHASE (Out-of-Sample):
text
Example Bars 201-250: Strategies use optimized parameters
- Performance tracked separately
- Validation period
- Out-of-sample evaluation
FITNESS CALCULATION EXAMPLE:
text
Train Win Rate: 65%
Test Win Rate: 58%
Composite Fitness:
= (0.40 × 0.65) + (0.60 × 0.58)
= 0.26 + 0.35
= 0.61
Note: Test results weighted 60%, Train 40%
Theory: Out-of-sample may better indicate forward performance
OVERFIT DETECTION MECHANISM:
text
Gap = Train WR - Test WR = 65% - 58% = 7%
If Gap > Overfit Threshold (default 25%):
Fitness Penalty = Gap × 2
Example with 30% gap:
Strategy shows: Train 70%, Test 40%
Gap: 30% → Potential overfit flagged
Penalty: 30% × 2 = 60% fitness reduction
Result: Strategy likely to be culled
WINDOW ROLLING:
text
Example Bar 250: Test window complete
→ Reset both windows
→ Start new cycle
→ Previous results retained for analysis
Cycle Count increments
Historical performance tracked across multiple cycles
Educational Context:
Walk-forward analysis is a recognized approach in quantitative finance research for evaluating strategy robustness. However, past out-of-sample performance does not guarantee future results. Market conditions can change in ways not represented in historical data.
7. CLUSTER ANALYSIS 🔬
An unsupervised machine learning approach for pattern recognition.
The Concept:
text
Scenario: System identifies a price pivot that wasn't signaled
→ Extract pattern characteristics
→ Store features for analysis
→ Adjust detection for similar future patterns
Implementation:
STEP 1: FEATURE EXTRACTION
text
When significant move occurs without signal:
Extract 5-dimensional feature vector:
Feature Vector =
Example:
Observed Pattern:
STEP 2: CLUSTER ASSIGNMENT
text
Compare to existing cluster centroids using distance metric:
Cluster 0:
Cluster 1: ← Minimum distance
Cluster 2:
...
Assign to nearest cluster
STEP 3: CENTROID UPDATE
text
Old Centroid 1:
New Pattern:
Decay Rate: 0.95
Updated Centroid:
= 0.95 × Old + 0.05 × New
= Exponential moving average update
=
STEP 4: PROFIT TRACKING
text
Cluster Average Profit (hypothetical):
Old Average: 2.5R
New Observation: 3.2R
Updated: 0.95 × 2.5 + 0.05 × 3.2 = 2.535R
STEP 5: LEARNING ADJUSTMENT
text
If Cluster Average Profit > Threshold (e.g., 2.0R):
Cluster Learning Boost += increment (e.g., 0.1)
(Maximum cap: 2.0)
Effect: Future signals resembling this cluster receive adjustment
STEP 6: SCORE MODIFICATION
text
For signals matching cluster characteristics:
Base Score × Cluster Learning Boost
Example:
Base Score: 5.2
Cluster Boost: 1.3
Adjusted Score: 5.2 × 1.3 = 6.76
Result: Pattern more likely to generate signal
Cluster Interpretation Example:
text
CLUSTER 0: "High elastic, low volume"
Centroid:
Avg Profit: 3.5R (historical backtest)
Interpretation: Pure elastic signals in ranges historically favorable
CLUSTER 1: "Wick rejection, volatile"
Centroid:
Avg Profit: 2.8R (historical backtest)
Interpretation: Wick signals in volatility showed positive results
CLUSTER 2: "Exhaustion divergence"
Centroid:
Avg Profit: 4.2R (historical backtest)
Interpretation: Momentum exhaustion in trends performed well
Learning Progress Metrics:
text
Missed Total: 47
Clusters Updated: 142
Patterns Learned: 28
Interpretation:
- System identified 47 significant moves without signals
- Clusters updated 142 times (incremental refinement)
- Made 28 parameter adjustments
- Theoretically improving pattern recognition
Educational Note: Cluster analysis is a recognized machine learning technique. This implementation applies it to trading pattern recognition. Past cluster performance does not guarantee future pattern profitability or accurate classification.
8. ENSEMBLE VOTING 🗳️
A collective decision-making approach common in machine learning.
The Wisdom of Crowds Concept:
text
Single Model:
- May have blind spots
- Subject to individual bias
- Limited perspective
Ensemble of Models:
- Blind spots may offset
- Biases may average out
- Multiple perspectives considered
Implementation:
STEP 1: INDIVIDUAL VOTES
text
Example Bar 247:
Strategy 0 (Range): LONG (fitness: 0.65)
Strategy 1 (Trend): FLAT (fitness: 0.58)
Strategy 2 (Volatile): LONG (fitness: 0.52)
Strategy 3 (Balanced): SHORT (fitness: 0.48)
Strategy 4 (Range): LONG (fitness: 0.71)
Strategy 5 (Trend): FLAT (fitness: 0.55)
STEP 2: WEIGHT CALCULATION
text
Base Weight = Fitness Score
If strategy's species matches current regime:
Weight × Specialist Boost (configurable, default 1.5)
If strategy has recent positive performance:
Weight × Recent Performance Factor
Example for Strategy 0:
Base: 0.65
Range specialist in Range regime: 0.65 × 1.5 = 0.975
Recent performance adjustment: 0.975 × 1.13 = 1.10
STEP 3: WEIGHTED TALLYING
text
LONG votes:
S0: 1.10 + S2: 0.52 + S4: 0.71 = 2.33
SHORT votes:
S3: 0.48 = 0.48
FLAT votes:
S1: 0.58 + S5: 0.55 = 1.13
Total Weight: 2.33 + 0.48 + 1.13 = 3.94
STEP 4: CONSENSUS CALCULATION
text
LONG %: 2.33 / 3.94 = 59.1%
SHORT %: 0.48 / 3.94 = 12.2%
FLAT %: 1.13 / 3.94 = 28.7%
Minimum Consensus Setting: 60%
Result: NO SIGNAL (59.1% < 60%)
STEP 5: SIGNAL DETERMINATION
text
If LONG % >= Min Consensus:
→ Display LONG signal
→ Show consensus percentage in dashboard
If SHORT % >= Min Consensus:
→ Display SHORT signal
If neither threshold reached:
→ No signal displayed
Practical Examples:
text
Strong Consensus (85%):
5 strategies LONG, 0 SHORT, 1 FLAT
→ High agreement among models
Moderate Consensus (62%):
3 LONG, 2 SHORT, 1 FLAT
→ Borderline agreement
No Consensus (48%):
3 LONG, 2 SHORT, 1 FLAT
→ Insufficient agreement, no signal shown
Educational Note: Ensemble methods are widely used in machine learning to improve model robustness. This implementation applies ensemble concepts to trading signals. Past ensemble performance does not guarantee future signal quality or profitability.
9. THOMPSON SAMPLING 🎲
A Bayesian reinforcement learning technique for balancing exploration and exploitation.
The Exploration-Exploitation Dilemma:
text
EXPLOITATION: Use what appears to work
Benefit: Leverages observed success patterns
Risk: May miss better alternatives
EXPLORATION: Try less-tested approaches
Benefit: May discover superior methods
Risk: May waste resources on inferior options
Thompson Sampling Solution:
STEP 1: BETA DISTRIBUTIONS
text
For each signal type, maintain:
Alpha = Successes + 1
Beta = Failures + 1
Example for Elastic signals:
15 wins, 10 losses
Alpha = 16, Beta = 11
STEP 2: PROBABILITY SAMPLING
text
Rather than using simple Win Rate = 15/25 = 60%
Sample from Beta(16, 11) distribution:
Possible samples: 0.55, 0.62, 0.58, 0.64, 0.59...
Rationale: Incorporates uncertainty
- Type with 5 trades: High uncertainty, wide sample variation
- Type with 50 trades: Lower uncertainty, narrow sample range
STEP 3: TYPE PRIORITIZATION
text
Example Bar 248:
Elastic sampled: 0.62
Wick sampled: 0.58
Exhaustion sampled: 0.71 ← Highest this sample
Climax sampled: 0.52
Structure sampled: 0.63
Divergence sampled: 0.45
Exhaustion type receives temporary boost
STEP 4: SIGNAL ADJUSTMENT
text
If current signal is Exhaustion type:
Score × (0.7 + 0.71 × 0.6)
Score × 1.126
If current signal is other type with lower sample:
Score × (0.7 + sample × 0.6)
(smaller adjustment)
STEP 5: OUTCOME FEEDBACK
text
When trade completes:
If WIN:
Alpha += 1
(Beta unchanged)
If LOSS:
Beta += 1
(Alpha unchanged)
Effect: Shifts probability distribution for future samples
Educational Context:
Thompson Sampling is a recognized Bayesian approach to the multi-armed bandit problem. This implementation applies it to signal type selection. The mathematical optimality assumes stationary distributions, which may not hold in financial markets. Past sampling performance does not guarantee future type selection accuracy.
10. DYNAMIC VOLATILITY SCALING (DVS) 📉
An adaptive approach where parameters adjust based on current vs. baseline volatility.
The Adaptation Problem:
text
Fixed bands (e.g., always 1.5 ATR):
In low volatility environment (vol = 0.5):
Bands may be too wide → fewer signals
In high volatility environment (vol = 2.0):
Bands may be too tight → excessive signals
The DVS Approach:
STEP 1: BASELINE ESTABLISHMENT
text
Calculate volatility over baseline period (default 100 bars):
Method options: ATR / Close, Parkinson, or Garman-Klass
Example average volatility = 1.2%
This represents "normal" for recent conditions
STEP 2: CURRENT VOLATILITY
text
Current bar volatility = 1.8%
STEP 3: DVS RATIO
text
DVS Ratio = Current / Baseline
= 1.8 / 1.2
= 1.5
Interpretation: Volatility currently 50% above baseline
STEP 4: BAND ADJUSTMENT
text
Base Band Width: 1.5 ATR
Adjusted Band Width:
Upper: 1.5 × DVS = 1.5 × 1.5 = 2.25 ATR
Lower: Same
Result: Bands expand 50% to accommodate higher volatility
STEP 5: THRESHOLD ADJUSTMENT
text
Base Thresholds:
Wick: 0.15
Momentum: 0.6
Adjusted:
Wick: 0.15 / DVS = 0.10 (easier to trigger in high vol)
Momentum: 0.6 × DVS = 0.90 (harder to trigger in high vol)
DVS Calculation Methods:
text
ATR RATIO (Simplest):
DVS = (ATR / Close) / SMA(ATR / Close, 100)
PARKINSON (Range-based):
σ = √(∑(ln(H/L))² / (4×n×ln(2)))
DVS = Current σ / Baseline σ
GARMAN-KLASS (Comprehensive):
σ = √(0.5×(ln(H/L))² - (2×ln(2)-1)×(ln(C/O))²)
DVS = Current σ / Baseline σ
ENSEMBLE (Robust):
DVS = Median(ATR_Ratio, Parkinson, Garman_Klass)
Educational Note: Dynamic volatility scaling is an approach to normalize indicators across varying market conditions. The effectiveness depends on the assumption that recent volatility patterns continue, which is not guaranteed. Past volatility adjustment performance does not guarantee future normalization accuracy.
11. PRESSURE KERNEL 💪
A composite measurement attempting to quantify directional force beyond simple price movement.
Components:
1. CLOSE LOCATION VALUE (CLV)
text
CLV = ((Close - Low) - (High - Close)) / Range
Examples:
Close at top of range: CLV = +1.0 (bullish position)
Close at midpoint: CLV = 0.0 (neutral)
Close at bottom: CLV = -1.0 (bearish position)
2. WICK ASYMMETRY
text
Wick Pressure = (Lower Wick - Upper Wick) / Range
Additional factors:
If Lower Wick > Body × 2: +0.3 (rejection boost)
If Upper Wick > Body × 2: -0.3 (rejection penalty)
3. BODY MOMENTUM
text
Body Ratio = Body Size / Range
Body Momentum = Close > Open ? +Body Ratio : -Body Ratio
Strong bullish candle: +0.9
Weak bullish candle: +0.2
Doji: 0.0
4. PATH ESTIMATE
text
Close Position = (Close - Low) / Range
Open Position = (Open - Low) / Range
Path = Close Position - Open Position
Additional adjustments:
If closed high with lower wick: +0.2
If closed low with upper wick: -0.2
5. MOMENTUM CONFIRMATION
text
Price Change / ATR
Examples:
+1.5 ATR move: +1.0 (capped)
+0.5 ATR move: +0.5
-0.8 ATR move: -0.8
COMPOSITE CALCULATION:
text
Pressure =
CLV × 0.25 +
Wick Pressure × 0.25 +
Body Momentum × 0.20 +
Path Estimate × 0.15 +
Momentum Confirm × 0.15
Volume context applied:
If Volume > 1.5× avg: × 1.3
If Volume < 0.5× avg: × 0.7
Final smoothing: 3-period EMA
Pressure Interpretation:
text
Pressure > 0.3: Suggests buying pressure
→ May support LONG signals
→ May reduce SHORT signal strength
Pressure < -0.3: Suggests selling pressure
→ May support SHORT signals
→ May reduce LONG signal strength
-0.3 to +0.3: Neutral range
→ Minimal directional bias
Educational Note: The Pressure Kernel is a custom composite indicator combining multiple price action metrics. These weightings are theoretical constructs. Past pressure readings do not guarantee future directional movement or signal quality.
USAGE GUIDE - EDUCATIONAL EXAMPLES
Getting Started:
STEP 1: Add Indicator
Open TradingView
Add KERS-AGE to chart
Allow minimum 100 bars for initialization
Verify dashboard displays Gen: 1+
STEP 2: Initial Observation Period
text
First 200 bars:
- System is in learning phase
- Signal frequency typically low
- Population evolution occurring
- Fitness scores generally increasing
Recommendation: Observe without trading during initialization
STEP 3: Signal Evaluation Criteria
text
Consider evaluating signals based on:
- Confidence percentage
- Grade assignment (A+, A, B+, B, C)
- Position within bands
- Historical win rate shown in dashboard
- Train vs. Test performance gap
Example Signal Evaluation Checklist:
Educational Criteria to Consider:
Signal appeared (⚡ arrow displayed)
Confidence level meets personal threshold
Grade meets personal quality standard
Ensemble consensus (if enabled) meets threshold
Historical win rate acceptable
Test performance reasonable vs. Train
Price location at band extreme
Regime classification appropriate for strategy
If trending: Signal direction aligns with personal analysis
Stop loss distance acceptable for risk tolerance
Position size appropriate (example: 1-2% account risk)
Note: This is an educational checklist, not trading advice. Users should develop their own criteria based on personal risk tolerance and strategy.
Risk Management Educational Examples:
POSITION SIZING EXAMPLE:
text
Hypothetical scenario:
Account: $10,000
Risk tolerance: 1.5% per trade = $150
Indicated stop distance: 1.5 ATR = $300 per contract
Calculation: $150 / $300 = 0.5 contracts
This is an educational example only, not a recommendation.
STOP LOSS EXAMPLES:
text
System provides stop level (red line)
Typically calculated as 1.5 ATR from entry
Alternative approaches users might consider:
LONG: Below recent swing low
SHORT: Above recent swing high
Users should determine stops based on personal risk management.
TAKE PROFIT EXAMPLES:
text
System provides target level (green line)
Typically calculated as price stretch × 60%
Alternative approaches users might consider:
Scale out: Partial exit at 1R, remainder at 2R
Trailing stop: Adjust stop after profit threshold
Users should determine targets based on personal strategy.
Educational Note: These are theoretical examples for educational purposes. Actual position sizing and risk management should be determined by each user based on their individual risk tolerance, account size, and trading plan.
OPTIMIZATION BY MARKET TYPE - EDUCATIONAL SUGGESTIONS
RANGE-BOUND MARKETS
Suggested Settings for Testing:
Population Size: 6-8
Min Confluence: 5.0-6.0
Min Consensus: 70%
Enable Speciation: Consider enabling
Min Per Species: 2
Theoretical Rationale:
More strategies may provide better coverage
Moderate confluence may generate more signals
Higher consensus may filter quality
Speciation may encourage range specialist emergence
Historical Backtest Observations:
Win rates in testing: Varied, often 50-65% range
Reward/risk ratios observed: 0.5-1.5R
Signal frequency: Relatively frequent
Disclaimer: Past backtesting results do not guarantee future performance.
TRENDING MARKETS
Suggested Settings for Testing:
Population Size: 4-5
Min Confluence: 6.0-7.0
Consider enabling MTF filter
MTF Timeframe: 3-5× current timeframe
Specialist Boost: 1.8-2.0
Theoretical Rationale:
Fewer strategies may adapt faster
Higher confluence may filter counter-trend noise
MTF may reduce counter-trend signals
Specialist boost may prioritize trend specialists
Historical Backtest Observations:
Win rates in testing: Varied, often 40-55% range
Reward/risk ratios observed: 1.5-3.0R
Signal frequency: Less frequent
Disclaimer: Past backtesting results do not guarantee future performance.
VOLATILE MARKETS (e.g., Cryptocurrency)
Suggested Settings for Testing:
Base Length: 25-30
Band Multiplier: 1.8-2.0
DVS: Consider enabling (Ensemble method)
Consider enabling Volume Filter
Volume Multiplier: 1.5-2.0
Theoretical Rationale:
Longer base may smooth noise
Wider bands may accommodate larger swings
DVS may be critical for adaptation
Volume filter may confirm genuine moves
Historical Backtest Observations:
Win rates in testing: Varied, often 45-60% range
Reward/risk ratios observed: 1.0-2.5R
Signal frequency: Moderate
Disclaimer: Cryptocurrency markets are highly volatile and risky. Past backtesting results do not guarantee future performance.
SCALPING (1-5min timeframes)
Suggested Settings for Testing:
Base Length: 15-20
Train Window: 150
Test Window: 30
Spawn Interval: 30
Min Confluence: 5.5-6.5
Consider enabling Ensemble
Min Consensus: 75%
Theoretical Rationale:
Shorter base may increase responsiveness
Shorter windows may speed evolution cycles
Quick spawning may enable rapid adaptation
Higher confluence may filter noise
Ensemble may reduce false signals
Historical Backtest Observations:
Win rates in testing: Varied, often 50-65% range
Reward/risk ratios observed: 0.5-1.0R
Signal frequency: Frequent but filtered
Disclaimer: Scalping involves high frequency trading with increased transaction costs and slippage risk. Past backtesting results do not guarantee future performance.
SWING TRADING (4H-Daily timeframes)
Suggested Settings for Testing:
Base Length: 25-35
Train Window: 300
Test Window: 100
Population Size: 7-8
Consider enabling Walk-Forward
Cooldown: 8-10 bars
Theoretical Rationale:
Longer timeframe may benefit from longer lookbacks
Larger windows may improve robustness testing
More population may increase stability
Walk-forward may be valuable for multi-day holds
Longer cooldown may reduce overtrading
Historical Backtest Observations:
Win rates in testing: Varied, often 45-60% range
Reward/risk ratios observed: 2.0-4.0R
Signal frequency: Infrequent but potentially higher quality
Disclaimer: Swing trading involves overnight and weekend risk. Past backtesting results do not guarantee future performance.
DASHBOARD GUIDE - INTERPRETATION EXAMPLES
Reading Each Section:
HEADER:
text
🧬 KERS-AGE EVOLVED 📈 TREND
Regime indication:
Color coding suggests current classification
(Green = Range, Orange = Trend, Purple = Volatile)
POPULATION:
text
Pop: 6/6
Gen: 42
Interpretation:
- Population at target size
- System at generation 42
- May indicate mature evolution
SPECIES (if enabled):
text
R:2 T:3 V:1
Interpretation:
- 2 Range specialists
- 3 Trend specialists
- 1 Volatility specialist
In TREND regime this distribution may be expected
WALK-FORWARD (if enabled):
text
Phase: 🧪 TEST
Cycles: 5
Train: 65%
Test: 58%
Considerations:
- Currently in test phase
- Completed 5 full cycles
- 7% performance gap between train and test
- Gap under default 25% overfit threshold
ENSEMBLE (if enabled):
text
Vote: 🟢 LONG
Consensus: 72%
Interpretation:
- Weighted majority voting LONG
- 72% agreement level
- Exceeds default 60% consensus threshold
SELECTED STRATEGY:
text
ID:23
Trades: 47
Win%: 58%
P&L: +8.3R
Fitness: 0.62
Information displayed:
- Strategy ID 23, Trend specialist
- 47 historical simulated trades
- 58% historical win rate
- +8.3R historical cumulative reward/risk
- 0.62 fitness score
Note: These are historical simulation metrics
SIGNAL QUALITY:
text
Conf: 78%
Grade: B+
Elastic: ████████░░
Wick: ██████░░░░
Momentum: ███████░░░
Pressure: ███████░░░
Information displayed:
- 78% confluence score
- B+ grade assignment
- Elastic component strongest
- Visual representation of component strengths
LEARNING (if enabled):
text
Missed: 47
Learned: 28
Interpretation:
- System identified 47 moves without signals
- 28 pattern adjustments made
- Suggests ongoing learning process
POSITION:
text
POS: 🟢 LONG
Score: 7.2
Current state:
- Simulated long position active
- 7.2 confluence score
- Monitor for potential exit signal
Educational Note: Dashboard displays are for informational and educational purposes. All performance metrics are historical simulations and do not represent actual trading results or future expectations.
FREQUENTLY ASKED QUESTIONS - EDUCATIONAL RESPONSES
Q: Why aren't signals showing?
A: Several factors may affect signal generation:
System may still be initializing (check Gen: counter)
Confluence score may be below threshold
Ensemble consensus (if enabled) may be below requirement
Current regime may naturally produce fewer signals
Filters may be active (volume, noise reduction)
Consider adjusting settings or allowing more time for evolution.
Q: The win rate seems low compared to backtesting?
A: Consider these factors:
First 200 bars typically represent learning period
Focus on TEST % rather than TRAIN % for realistic expectations
Trend regime historically shows 40-55% win rates in backtesting
Different market conditions may affect performance
System emphasizes reward/risk ratio alongside win rate
Past performance does not guarantee future results
Q: Should I take all signals?
A: This is a personal decision. Some users may consider:
Taking higher grades (A+, A) in any regime
Being more selective in trend regimes
Requiring higher ensemble consensus
Only trading during specific regimes
Paper trading extensively before live trading
Each user should develop their own signal selection criteria.
Q: Signals appear then disappear?
A: This may be expected behavior:
Default requires 2-bar persistence
Designed to filter brief spikes
Confirmation delay intended to reduce false signals
Wait for persistence requirement to be met
This is an intentional feature, not a malfunction.
Q: Test % much lower than Train %?
A: This may indicate:
Overfit detection system functioning
Gap exceeding threshold triggers penalty
Strategy may be optimizing to in-sample noise
System designed to cull such strategies
Walk-forward protection working as intended
This is a safety feature to reduce overfitting risk.
Q: The population keeps culling strategies?
A: This is part of normal evolution:
Lower-performing strategies removed periodically
Higher-performing strategies replicate
Population quality theoretically improves over time
Total culled count shows selection pressure
This is expected evolutionary behavior.
Q: Which timeframe works best?
A: Backtesting suggests 15min to 4H may be suitable ranges:
Lower timeframes may be noisier, may need more filtering
Higher timeframes may produce fewer signals
Extensive historical testing recommended for chosen asset
Each asset may behave differently
Consider paper trading across multiple timeframes
Personal testing is recommended for your specific use case.
Q: Does it work on all asset types?
A: Historical testing suggests:
Cryptocurrency: Consider longer Base Length (25-30) due to volatility
Forex: Standard settings may be appropriate starting point
Stocks: Standard settings, possibly smaller population (4-5)
Indices: Trend-focused settings may be worth testing
Each asset class has unique characteristics. Extensive testing recommended.
Q: Can settings be changed after initialization?
A: Yes, but considerations:
Population will reset
Strategies restart evolution
Learning progress resets
Consider testing new settings on separate chart first
May want to compare performance before committing
Settings changes restart the evolutionary process.
Q: Walk-Forward enabled or disabled?
A: Educational perspective:
Walk-Forward adds out-of-sample validation
May reduce overfitting risk
Results may be more conservative
Considered best practice in quantitative research
Requires more bars for meaningful data
Recommended for those concerned about robustness
Individual users should assess based on their needs.
Q: Ensemble mode or single strategy?
A: Trade-offs to consider:
Ensemble approach:
Requires consensus threshold
May have higher consistency
Typically fewer signals
Multiple perspectives considered
Single strategy approach:
More signals (varying quality)
Faster response to conditions
Higher variability
More active signal generation
Personal preference and risk tolerance should guide this choice.
ADVANCED CONSIDERATIONS
Evolution Time: Consider allowing 200+ bars for population maturity
Regime Awareness: Historical performance varies by regime classification
Confluence Range: Testing suggests 70-85% may be informative range
Ensemble Levels: 80%+ consensus historically associated with stronger agreement
Out-of-Sample Focus: Test performance may be more indicative than train performance
Learning Metrics: "Learned" count shows pattern adjustment over time
Pressure Levels: >0.4 pressure historically added confirmation
DVS Monitoring: >1.5 DVS typically widens bands and affects frequency
Species Balance: Healthy distribution might be 2-2-2 or 3-2-1, avoid 6-0-0
Timeframe Testing: Match to personal trading style, test thoroughly
Volume Importance: May be more critical for stocks/crypto than forex
MTF Utility: Historically more impactful in trending conditions
Grade Significance: A+ in trend regime historically rare and potentially significant
Risk Parameters: Standard risk management suggests 1-2% per trade maximum
Stop Levels: System stops are pre-calculated, widening may affect reward/risk
THEORETICAL FOUNDATIONS
Genetic Algorithms in Finance:
Traditional Optimization Approaches:
Grid search: Exhaustive but computationally expensive
Gradient descent: Efficient but prone to local optima
Random search: Simple but inefficient
Genetic Algorithm Characteristics:
Explores parameter space through evolutionary process
Balances exploration (mutation) and exploitation (selection)
Mitigates local optima through population diversity
Parallel evaluation via population approach
Inspired by biological evolution principles
Academic Context: Genetic algorithms are studied in computational finance literature for parameter optimization. Effectiveness varies based on problem characteristics and implementation.
Ensemble Methods in Machine Learning:
Single Model Limitations:
May overfit to specific patterns
Can have blind spots in certain conditions
May be brittle to distribution shifts
Ensemble Theoretical Benefits:
Variance reduction through averaging
Robustness through diversity
Improved generalization potential
Widely used (Random Forests, Gradient Boosting, etc.)
Academic Context: Ensemble methods are well-studied in machine learning literature. Performance benefits depend on base model diversity and correlation structure.
Walk-Forward Analysis:
Alternative Approaches:
Simple backtest: Risk of overfitting to full dataset
Single train/test split: Limited validation
Cross-validation: May violate time-series properties
Walk-Forward Characteristics:
Continuous out-of-sample validation
Respects temporal ordering
Attempts to detect strategy degradation
Used in quantitative trading research
Academic Context: Walk-forward analysis is discussed in quantitative finance literature as a robustness check. However, it assumes future regimes will resemble recent test periods, which is not guaranteed.
FINAL EDUCATIONAL SUMMARY
KERS-AGE demonstrates an adaptive systems approach to technical analysis. Rather than fixed rules, it implements:
✓ Evolutionary Optimization: Parameter adaptation through genetic algorithms
✓ Regime Classification: Attempted market condition categorization
✓ Out-of-Sample Testing: Walk-forward validation methodology
✓ Pattern Recognition: Cluster analysis and learning systems
✓ Ensemble Methodology: Collective decision-making framework
✓ Full Transparency: Comprehensive dashboard and metrics
This indicator is an educational tool demonstrating advanced algorithmic concepts.
Critical Reminders:
The system:
✓ Attempts to identify potential reversal patterns
✓ Adapts parameters to changing conditions
✓ Provides multiple filtering mechanisms
✓ Offers detailed performance metrics
Users must understand:
✓ No system guarantees profitable results
✓ Past performance does not predict future results
✓ Extensive testing and validation recommended
✓ Risk management is user's responsibility
✓ Market conditions can change unpredictably
✓ This is educational software, not financial advice
Success in trading requires: Proper education, risk management, discipline, realistic expectations, and personal responsibility for all trading decisions.
For Educational Use
🧬 KERS-AGE Development Team
⚠️ FINAL DISCLAIMER
This indicator and documentation are provided strictly for educational and informational purposes.
NOT FINANCIAL ADVICE: Nothing in this guide constitutes financial advice, investment advice, trading advice, or any recommendation to buy, sell, or hold any security or to engage in any trading strategy.
NO GUARANTEES: No representation is made that any account will or is likely to achieve profits or losses similar to those shown in backtests, examples, or historical data. Past performance is not indicative of future results.
SUBSTANTIAL RISK: Trading stocks, forex, futures, options, and cryptocurrencies involves substantial risk of loss and is not suitable for every investor. The high degree of leverage can work against you as well as for you.
YOUR RESPONSIBILITY: You are solely responsible for your own investment and trading decisions. You should conduct your own research, perform your own analysis, and consult with qualified financial advisors before making any trading decisions.
NO LIABILITY: The developers, contributors, and distributors of this indicator disclaim all liability for any losses or damages, direct or indirect, that may result from use of this indicator or reliance on any information provided.
PAPER TRADE FIRST: Users are strongly encouraged to thoroughly test this indicator in a paper trading environment before risking any real capital.
By using this indicator, you acknowledge that you have read this disclaimer, understand the risks involved in trading, and agree that you are solely responsible for your own trading decisions and their outcomes.
Educational Software Only | Trade at Your Own Risk | Not Financial Advice
Taking you to school. — Dskyz , Trade with insight. Trade with anticipation.

Autoback Grid Lab [trade_lexx]Autoback Grid Lab: Your personal laboratory for optimizing grid strategies.
Introduction
First of all, it is important to understand that Autoback Grid Lab is a powerful professional tool for backtesting and optimization, created specifically for traders using both grid strategies and regular take profit with stop loss.
The main purpose of this script is to save you weeks and months of manual testing and parameter selection. Instead of manually testing one combination of settings after another, Autoback Grid Lab automatically tests thousands of unique strategies on historical data, providing you with a comprehensive report on the most profitable and, more importantly, sustainable ones.
If you want to find mathematically sound, most effective settings for your grid strategy on a specific asset and timeframe, then this tool was created for you.
Key Features
My tool has functionality that transforms the process of finding the perfect strategy from a routine into an exciting exploration.
🧪 Mass testing of thousands of combinations
The script is able to systematically generate and run a huge number of unique combinations of parameters through the built-in simulator. You set the ranges, and the indicator does all the work, testing all possible options for the following grid settings:
* Number of safety orders (SO Count)
* Grid step (SO Step)
* Step Multiplier (SO Multiplier) for building nonlinear grids
* Martingale for controlling the volume of subsequent orders
* Take Profit (%)
* Stop Loss (%), with the possibility of calculating both from the entry point and from the dynamic breakeven line
* The volume of the base order (Volume BO) as a percentage of the deposit
🏆 Unique `FinalScore` rating system
Sorting strategies by net profit alone is a direct path to self—deception and choosing strategies that are "tailored" to history and will inevitably fail in real trading. To solve this problem, we have developed FinalScore, a comprehensive assessment of the sustainability and quality of the strategy.
How does it work?
FinalScore analyzes each combination not one by one, but by nine key performance metrics at once, including Net Profit, Drawdown, Profit Factor, WinRate, Sharpe coefficients, Sortino, Squid and Omega. Each of these indicators is normalized, that is, reduced to a single scale. Then, to test the strategy for strength, the system performs 30 iterations, each time assigning random weights to these 9 metrics. A strategy gets a high FinalScore only if it shows consistently high results under different evaluation criteria. This proves her reliability and reduces the likelihood that her success was an accident.
📈 Realistic backtesting engine
The test results are meaningless if they do not take into account the actual trading conditions. Our simulator simulates real trading as accurately as possible, taking into account:
* Leverage: Calculation of the required margin to open and hold positions.
* Commission: A percentage commission is charged each time an order is opened and closed.
* Slippage: The order execution price is adjusted by a set percentage to simulate real market conditions.
* Liquidation model: This is one of the most important functions. The script continuously monitors the equity of the account (capital + unrealized P&L). If equity falls below the level of the supporting margin (calculated from the current value of the position), the simulator forcibly closes the position, as it would happen on a real exchange. This eliminates unrealistic scenarios where the strategy survives after a huge drawdown.
🔌 Integration with external signals
The indicator operates in two modes:
1. `No Signal': Standard mode. The trading cycle starts immediately as soon as the previous one has been closed. Ideal for testing the "pure" mechanics of the grid.
2. `External Signal`: In this mode, a new trading cycle will start only when a signal is received from an external source. You can connect any other indicator (such as the RSI, MACD, or your own strategy) to the script and use it as a trigger to log in. This allows you to combine the power of a grid strategy with your own entry points.
📊 Interactive and informative results panel
Upon completion of the calculations, a detailed table with the TOP N best strategies appears on the screen, sorted according to your chosen criterion. For each strategy in the rating, you will see not only the key metrics (Profit, Drawdown, duration of transactions), but also all the parameters that led to this result. You can immediately take these settings and apply them in your trading.
Application Options: How To Solve Your Problems
Autoback Grid Lab is a flexible tool that can be adapted to solve various tasks, from complete grid optimization to fine—tuning existing strategies. Here are some key scenarios for its use:
1. Complete Optimization Of The Grid Strategy
This is the basic and most powerful mode of use. You can find the most efficient grid configuration for any asset from scratch.
* How to use: Set wide ranges for all key grid parameters ('SO Count`, SO Step, SO Multiplier, Martingale, TP, etc.).
* In the `No Signal` mode: You will find the most stable grid configuration that works as an independent, constantly active strategy, regardless of which-or entrance indicators.
* In the `External Signal` mode: You can connect your favorite indicator for input (for example, RSI, MACD or a complex author's script) and find the optimal grid parameters that best complement your input signals. This allows you to turn a simple signaling strategy into a full-fledged grid system.
2. Selecting the Optimal Take Profit and Stop Loss for Your Strategy
Do you already have an entry strategy, but you are not sure where it is best to put Take Profit and Stop Loss? Autoback Grid Lab can solve this problem as well.
* How to use:
1. Disable optimization of all grid parameters (uncheck SO Count, SO Step, Martingale, etc.). Set the Min value for SO Count to 0.
2. Set the ranges for iteration only for 'Take Profit` and `Stop Loss'.
3. Turn on the External Signal mode and connect your indicator with input signals.
* Result: The script will run your historical entry signals with hundreds of different TP and SL combinations and show you which stop order levels bring maximum profit with minimal risk specifically for your entry points.
3. Building a Secure Network with Risk Management
Many traders are afraid of grid strategies because of the risk of large drawdowns. With the help of the optimizer, you can purposefully find the parameters for such a grid, which includes mandatory risk management through Stop Loss.
* How to use: Enable and set the range for Stop Loss, along with other grid parameters. Don't forget to test both types of SL calculations (`From entry point` and `From breakeven line`) to determine which one works more efficiently.
* Result: You will find balanced strategies in which the grid parameters (number of orders, martingale) and the Stop Loss level are selected in such a way as to maximize profits without going beyond the acceptable risk level for you.
How To Use The Indicator (Step-By-Step Guide)
Working with the Autoback Grid Lab is a sequential process consisting of four main steps: from initial setup to analysis of the finished results. Follow this guide to get the most out of the tool.
Step 1: Initial Setup
1. Add the indicator to the chart of your chosen asset and timeframe.
2. Open the script settings. The first thing you should pay attention to is the ⚙️ Optimization Settings ⚙️ group.
3. Set the `Bars Count'. This parameter determines how much historical data will be used for testing.
* Important: The more bars you specify, the more statistically reliable the backtest results will be. We recommend using the maximum available value (25,000) to test strategies at different market phases.
* Consider: The indicator performs all calculations on the last historical bar. After applying the TradingView settings, it will take some time to load all the specified bars. The results table will appear only after the data is fully loaded. Don't worry if it doesn't appear instantly. And if an error occurs, simply switch the number of combinations to 990 and back to 1000 until the table appears.
Step 2: Optimization Configuration
At this stage, you define the "universe" of parameters that our algorithm will explore.
1. Set the search ranges (🛠 Optimization Parameters 🛠 group).
For each grid parameter that you want to optimize (for example, SO Count or `Take Profit'), you must specify three values:
* Min: The minimum value of the range.
* Max: The maximum value of the range.
* Step: The step with which the values from Min to Max will be traversed.
*Example:* If you set Min=5, Max=10, and Step=1 for SO Count, the script will test strategies with 5, 6, 7, 8, 9, and 10 safety orders.
* Tip for users: To get the first results quickly, start with a larger step (for example, TP from 0.5% to 2.5% in 0.5 increments instead of 0.1). After you identify the most promising areas, you can perform a deeper analysis by expanding the ranges around these values.
2. Set Up Money Management (Group `💰 Money Management Settings 💰`).
Fill in these fields with the values that best match your actual trading conditions. This is critically important for obtaining reliable results.
* Capital: Your initial deposit.
* Leverage: Leverage.
* Commission (%): Your trading commission as a percentage.
* Slippage (%): Expected slippage.
* Liquidation Level (%): The level of the supporting margin (MMR in %). For example, for Binance Futures, this value is usually between 0.4% and 2.5%, depending on the asset and position size. Specify this value for your exchange.
3. Select the Sorting Criterion and the Direction (Group `⚙️ Optimization Settings ⚙️').
* `Sort by': Specify the main criteria by which the best strategies will be selected and sorted. I strongly recommend using finalScore to find the most balanced and sustainable strategies.
* `Direction': Choose which trades to test: Long, Short or Both.
Step 3: Start Testing and Work with "Parts"
The total number of unique combinations generated based on your ranges can reach tens of millions. TradingView has technical limitations on the number of calculations that the script can perform at a time. To get around this, I implemented a "Parts" system.
1. What are `Part` and `Combinations in Part'?
* `Combinations in Part': This is the number of backtests that the script performs in one run (1000 by default).
* `Part`: This is the number of the "portion" of combinations that you want to test.
2. How does it work in practice?
* After you have everything set up, leave Part:1 and wait for the results table to appear. You will see the TOP N best strategies from the first thousand tested.
* Analyze them. Then, to check the next thousand combinations, just change the Part to 2 in the settings and click OK. The script will run a test for the next batch.
* Repeat this process by increasing the Part number (`3`, 4, 5...), until you reach the last available part.
* Where can I see the total number of parts? In the information row below the results table, you will find Total parts. This will help you figure out how many more tests are left to run.
Step 4: Analyze the Results in the Table
The results table is your main decision—making tool. It displays the best strategies found, sorted by the criteria you have chosen.
1. Study the performance metrics:
* Rating: Position in the rating.
* Profit %: Net profit as a percentage of the initial capital.
* Drawdown%: The maximum drawdown of the deposit for the entire test period.
* Max Length: The maximum duration of one transaction in days, hours and minutes.
* Trades: The total number of completed trades.
2. Examine the winning parameters:
* To the right of the performance metrics are columns showing the exact settings that led to this result ('SO Count`, SO Step, TP (%), etc.).
3. How to choose the best strategy?
* Don't chase after the maximum profit! The strategy with the highest profit often has the highest drawdown, which makes it extremely risky.
* Seek a balance. The ideal strategy is a compromise between high profitability, low drawdown (Drawdown) and the maximum length of trades acceptable to you (Max Length).
* finalScore was created to find this balance. Trust him — he often highlights not the most profitable, but the most stable and reliable options.
Detailed Description Of The Settings
This section serves as a complete reference for each parameter available in the script settings. The parameters are grouped in the same way as in the indicator interface for your convenience.
Group: ⚙️ Optimization Settings ⚙️
The main parameters governing the testing process are collected here.
* `Enable Optimizer': The main switch. Activates or deactivates all backtesting functionality.
* `Direction': Determines which way trades will be opened during the simulation.
* Long: Shopping only.
* Short: Sales only.
* Both: Testing in both directions. Important: This mode only works in conjunction with an External Signal, as the script needs an external signal to determine the direction for each specific transaction.
* `Signal Mode`: Controls the conditions for starting a new trading cycle (opening a base order).
* No Signal: A new cycle starts immediately after the previous one is completed. This mode is used to test "pure" grid mechanics without reference to market conditions.
* External Signal: A new cycle begins only when a signal is received from an external indicator connected via the Signal field.
* `Signal': A field for connecting an external signal source (works only in the `External Signal` mode). You can select any other indicator on the chart.
* For Long** trades, the signal is considered received if the value of the external indicator ** is greater than 0.
* For Short** trades, the signal is considered received if the value of the external indicator ** is less than 0.
* `Bars Count': Sets the depth of the history in the bars for the backtest. The maximum value (25000) provides the most reliable results.
* `Sort by`: A key criterion for selecting and ranking the best strategies in the final table.
* FinalScore: Recommended mode. A comprehensive assessment that takes into account 9 metrics to find the most balanced and sustainable strategies.
* Profit: Sort by net profit.
* Drawdown: Sort by minimum drawdown.
* Max Length: Sort by the minimum length of the longest transaction.
* `Combinations Count': Indicates how many of the best strategies (from 1 to 50) will be displayed in the results table.
* `Close last trade`: If this option is enabled, any active trade will be forcibly closed at the closing price of the last historical bar. For grid strategies, it is recommended to always enable this option in order to get the correct calculation of the final profit and eliminate grid strategies that have been stuck for a long time.
Group: 💰 Money Management Settings 💰
The parameters in this group determine the financial conditions of the simulation. Specify values that are as close as possible to your actual values in order to get reliable results.
* `Capital': The initial deposit amount for the simulation.
* `Leverage`: The leverage used to calculate the margin.
* `Slippage` (%): Simulates the difference between the expected and actual order execution price. The specified percentage will be applied to each transaction.
* `Commission` (%): The trading commission of your exchange as a percentage. It is charged at the execution of each order (both at opening and closing).
* `Liquidation Level' (%): Maintenance Margin Ratio. This is a critical parameter for a realistic test. Liquidation in the simulator occurs if the Equity of the account (Capital + Unrealized P&L) falls below the level of the supporting margin.
Group: 🛠 Optimization Parameters 🛠
This is the "heart" of the optimizer, where you set ranges for iterating through the grid parameters.
* `Part`: The portion number of the combinations to be tested. Start with 1, and then increment (`2`, 3, ...) sequentially to check all generated strategies.
* `Combinations in Part': The number of backtests performed at a time (in one "Part"). Increasing the value may speed up the process, but it may cause the script to error due to platform limitations. If an error occurs, it is recommended to switch to the step below and back.
Three fields are available for each of the following parameters (`SO Count`, SO Step, SO Multiplier, etc.):
* `Min`: Minimum value for testing.
* `Max': The maximum value for testing.
* `Step`: The step with which the values in the range from Min to Max will be iterated over.
There is also a checkbox for each parameter. If it is enabled, the parameter will be optimized in the specified range. If disabled, only one value specified in the Min field will be used for all tests.
* 'Stop Loss': In addition to the standard settings Min, Max, Step, it has an additional parameter:
* `Type`: Defines how the stop loss price is calculated.
* From entry point: The SL level is calculated once from the entry price (base order price).
* From breakeven line: The SL level is dynamically recalculated from the average position price after each new safety order is executed.
Group: ⚡️Filters⚡️
Filters allow you to filter out those results from the final table that do not meet your minimum requirements.
For each filter (`Max Profit`, Min Drawdown, `Min Trade Length`), you can:
1. Turn it on or off using the checkbox.
2. Select the comparison condition: Greater (More) or Less (Less).
3. Set a threshold value.
*Example:* If you set Less and 20 for the Min Drawdown filter, only those strategies with a maximum drawdown of less than 20% will be included in the final table.
Group: 🎨 Visual Settings 🎨
Here you can customize the appearance of the results table.
* `Position': Selects the position of the table on the screen (for example, Bottom Left — bottom left).
* `Font Size': The size of the text in the table.
* `Header Background / Data Background`: Background colors for the header and data cells.
* `Header Font Color / Data Font Color`: Text colors for the header and data cells.
Important Notes and Limitations
So that you can use the Autoback Grid Lab as efficiently and consciously as possible, please familiarize yourself with the following key features of its work.
1. It is a Tool for Analysis, not for Signals
It is extremely important to understand that this script does not generate trading signals in real time. Its sole purpose is to conduct in—depth research (**backtesting**) on historical data.
* The results you see in the table are a report on how a particular strategy would have worked in the past.
* The script does not provide alerts and does not draw entry/exit points on the chart for the current market situation.
* Your task is to take the best sets of parameters found during optimization and use them in your real trading, for example, when setting up a trading bot or in a manual trading system.
2. Features Of Calculations (This is not a "Repainting")
You will notice that the results table appears and is updated only once — when all historical bars on the chart are loaded. It does not change in real time with each tick of the price.
This is correct and intentional behavior.:
* To test thousands, and sometimes millions of combinations, the script needs to perform a huge amount of calculations. In the Pine Script™ environment, it is technically possible to do this only once, at the very last bar in history.
* The script does not show false historical signals, which then disappear or change. It provides a static report on the results of the simulation, which remains unchanged for a specific historical period.
3. Past Results do not Guarantee Future Results.
This is the golden rule of trading, and it fully applies to the results of backtesting. Successful strategy performance in the past is not a guarantee that it will be as profitable in the future. Market conditions, volatility and trends are constantly changing.
My tool, especially when sorting by finalScore, is aimed at finding statistically stable and reliable strategies to increase the likelihood of their success in the future. However, it is a tool for managing probabilities, not a crystal ball for predicting the future. Always use proper risk management.
4. Dependence on the Quality and Depth of the Story
The reliability of the results directly depends on the quantity and quality of the historical data on which the test was conducted.
* Always strive to use the maximum number of bars available (`Bars Count: 25,000`) so that your strategy is tested on different market cycles (rise, fall, flat).
* The results obtained on data for one month may differ dramatically from the results obtained on data for two years. The longer the testing period, the higher the confidence in the parameters found.
Conclusion
The Autoback Grid Lab is your personal research laboratory, designed to replace intuitive guesses and endless manual selection of settings with a systematic, data—driven approach. Experiment with different assets, timeframes, and settings ranges to find the unique combinations that best suit your trading style.
