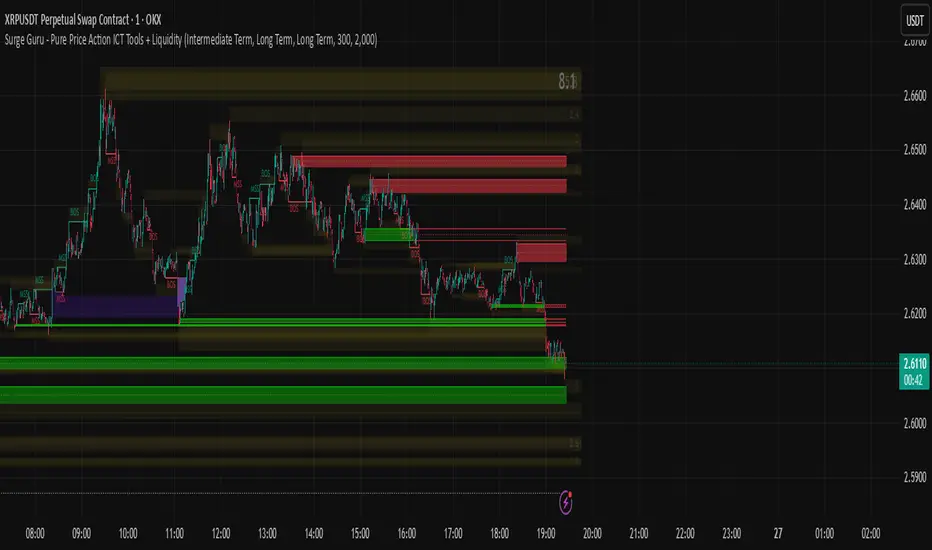
Pure Price Action ICT Tools + Liquidity (iFVG+OB) [SurgeGuru]Pure Price Action ICT Tools + Liquidity Dashboard
A comprehensive Institutional Concepts & Techniques (ICT) trading toolkit that identifies key market structure elements, liquidity zones, and order blocks to help traders spot institutional trading opportunities.
📊 MAIN FEATURES:
🎯 Market Structure Analysis
Identifies swing highs/lows across multiple timeframes (Short/Intermediate/Long Term)
Detects Break of Structure (BOS) and Change of Character (CHoCH)
Customizable line styles and colors for bullish/bearish structures
💧 Liquidity Detection
Buyside & Sellside Liquidity Zones: Identifies areas where stops are likely clustered
Liquidity Voids: Detects price gaps where minimal trading occurred
Enhanced Liquidity Zones: Volume-based liquidity areas with dynamic coloring
Adjustable visibility levels and margin settings
🔄 Order Blocks & Breaker Blocks
Automatically identifies institutional order blocks
Tracks breaker blocks that invalidate previous order blocks
Configurable lookback periods for bull/bear blocks
Option to use candle body or wicks for detection
⚡ SWING POINTS
Clear marking of significant highs and lows
Multiple timeframe analysis
Customizable label sizes and colors
🛠️ CUSTOMIZATION OPTIONS:
Multiple Timeframe Detection: Short, Intermediate, and Long Term analysis
Visual Customization: Adjust colors, line styles, and label sizes
Performance Optimized: Limited historical calculations for smooth operation
Selective Display: Toggle individual components on/off as needed
🎯 TRADING APPLICATIONS:
Identify institutional order flow and liquidity grabs
Spot market structure shifts and potential reversal zones
Locate optimal entry points using order blocks
Manage risk using liquidity zones as natural targets/stops
⚙️ TECHNICAL SPECS:
Version: Pine Script v5
Max Labels: 500 | Max Boxes: 500 | Max Lines: 500
Calculation Bars: 2000
Credits:
BigBeluga for liquidity formula
LuxAlgo for amazing iFVG code.
스크립트에서 "price action"에 대해 찾기
HPAS – Historical Price Action StatisticsHPAS – Historical Price Action Statistics (v7)
A data-driven overview of weekday behavior: price, volatility, and volume.
1) OVERVIEW
HPAS analyzes how each weekday behaves across your selected history. It aggregates daily returns, intraday ranges, and volumes into a compact heatmap table and optionally plots daily range bands (historical & today) on the chart.
Note: All weekday statistics are calculated using UTC-based daily candles for consistent results across markets (especially 24/7 assets like crypto).
The goal is context and probabilities — not signals.
2) HOW IT WORKS
Collects daily bar stats: % gain/loss (close vs open), intraday range ((High−Low) ÷ Open × 100), and contracts (volume).
Groups data by weekday (Sun–Sat) and computes: win/loss frequencies, average and max moves, average intraday ranges, and average volume.
Note: “Weekday” refers to the calendar day in UTC time . This ensures consistency across all assets and exchanges, particularly for 24/7 markets like crypto.
Compares average weekday volume to the current 20-day average (% of 20D).
Displays results in a color-shaded table; optionally draws historical daily range bands plus today’s projection with optional smoothing.
3) INCLUDED FEATURES
Core metrics
Total → Gain / Loss (% of Days): How often the day closes above/below open.
Closing → Avg / Max: Average and largest daily % moves up/down.
Intrabar (optional) → Avg / Max: Typical and extreme intraday % ranges.
Contracts → Avg (K): Average daily volume (shown in thousands).
Contracts → %20D: Weekday’s average volume as % of the current 20-day average.
Visualization & UX
Heatmap coloring: lower values appear darker; higher values lighter.
Current weekday highlight with a left-side triangle.
Tooltips on headers explain what/why/how.
Dark/Light theme support; Colorblind-safe palette toggle (Okabe–Ito).
Projection Bands
Plots historical daily range bands and today’s projected band.
Optional smoothing (SMA) for cleaner band movement.
Band Smoothing Explained: Applies a simple moving average over recent projection values to reduce sudden jumps in the upper/lower bands.
Higher values make the range lines steadier but slower to react; lower values show more real-time variability.
4) USAGE TIPS
Context, not prediction: Use stats to frame expectations, not to force trades.
Cycle awareness: Compare long vs short date windows; behavior can shift across regimes.
Volume tells a story: Elevated %20D can hint at increased participation or attention on certain weekdays.
Targets & risk: Range bands provide realistic context for sizing stops/targets.
Accessibility: Enable Colorblind-safe mode if red/green contrast is hard to read.
5) INTERPRETATION GUIDE
% Gain / % Loss — Frequency of up/down closes. Higher % Gain suggests a bullish weekday bias.
Avg Gain / Avg Loss — Mean daily % move on green/red days. Gauges typical magnitude.
Max Gain / Max Loss — Largest observed daily % change. Sets an upper bound of past extremes.
Hi-Lo Avg / Max — Typical and extreme intraday % ranges. Context for expected volatility.
Contracts Avg (K) — Average daily volume in thousands. Participation proxy.
%20D — Volume vs current 20-day average. 100% = typical, >100% = above-normal, <100% = lighter-than-normal.
6) CREDITS
Inspired by the HPAS concept popularized by Krown Trading and The Caretaker.
Rebuilt and extended for clarity, accessibility, and practical context.
Version: v7 (October 2025)
License: Educational, non-commercial use
Key Inputs (snippet)
// Projection Bands
grpBands = “Projection Bands”
showBands = input.bool(true, “Show daily range bands (historical & today)”, group=grpBands)
smoothLen = input.int(1, “Band smoothing (days)”, minval=1, maxval=20, group=grpBands)

ES/NQ Price Action Sync See when ES & NQ move in syncSee when ES & NQ move in sync — revealing real market momentum at a glance.”
⚖️ ES/NQ Price Action Sync
Discover when the market moves as one.
This indicator tracks when S&P 500 Futures (ES1!) and Nasdaq Futures (NQ1!) align in momentum — helping you spot broad-market confirmation or early divergence in real time.
🧠 Concept
The ES/NQ relationship often reveals the market’s underlying strength or hesitation. When both indices turn bullish or bearish together with meaningful movement, that’s a sign of true market alignment.
When they disagree — expect mixed momentum and possible reversals.
⚙️ Features
✅ Highlights new bullish and bearish syncs on chart
✅ Dynamic info table showing % change and direction for each index
✅ Optional triangle markers for clean visual cues
✅ Alert conditions for new sync events
✅ Adjustable lookback and minimum-move filters
💡 How to Use
Use this as a market-context tool, not a direct buy/sell signal.
When both indices sync, intraday trends often hold better; when they diverge, momentum may fade.
Combine it with your own system or higher-time-frame analysis for confirmation.
📊 Why Traders Love It
Simple idea — powerful insight.
This tool helps traders instantly see when “the market machine” is running in harmony… or pulling in opposite directions.
⚠️ Disclaimer:
This script is for educational and analytical purposes only.
It does not provide financial advice or trading signals. Always perform your own research before making trading decisions.

Trend Compass (Manual)## Trend Compass (Manual) - A Discretionary Trader's Dashboard
### Summary
Trend Compass is a simple yet powerful dashboard designed for discretionary traders who want a constant, visual reminder of their market analysis directly on their chart. Instead of relying on automated indicators, this tool gives you **full manual control** to define the market state across different timeframes or conditions.
It helps you stay aligned with your higher-level analysis (e.g., HTF bias, current market structure) and avoid making impulsive decisions that go against your plan.
### Key Features
- **Fully Manual Control:** You decide the trend. No lagging indicators, no confusing signals. Just your own analysis, displayed clearly.
- **Multiple Market States:** Define each row as an `Uptrend`, `Downtrend`, `Pullback`, or `Neutral` market.
- **Customizable Rows:** Display up to 8 rows. You can label each one however you like (e.g., "D1", "H4", "Market Structure", "Liquidity Bias").
- **Flexible Panel:** Change all colors, text sizes, and place the panel in any of the 9 positions on your chart.
- **Clean & Minimalist:** Designed to provide essential information at a glance without cluttering your chart.
### How to Use
1. **Add to Chart:** Add the indicator to your chart.
2. **Open Settings:** Go into the indicator settings.
3. **Configure Rows:**
- In the "Rows (Manual Control)" section, set the "Number of rows" you want to display.
- For each row, give it a custom **Label** (e.g., "m15").
- Select its current state from the dropdown menu (`Uptrend`, `Downtrend`, etc.).
- To remove a row, simply set its state to `Hidden`.
4. **Customize Style:**
- In the "Panel & Visual Style" section, adjust colors, text sizes, and the panel's position to match your chart's theme.
This tool is perfect for price action traders, ICT/SMC traders, or anyone who values a clean chart and a disciplined approach to their analysis.

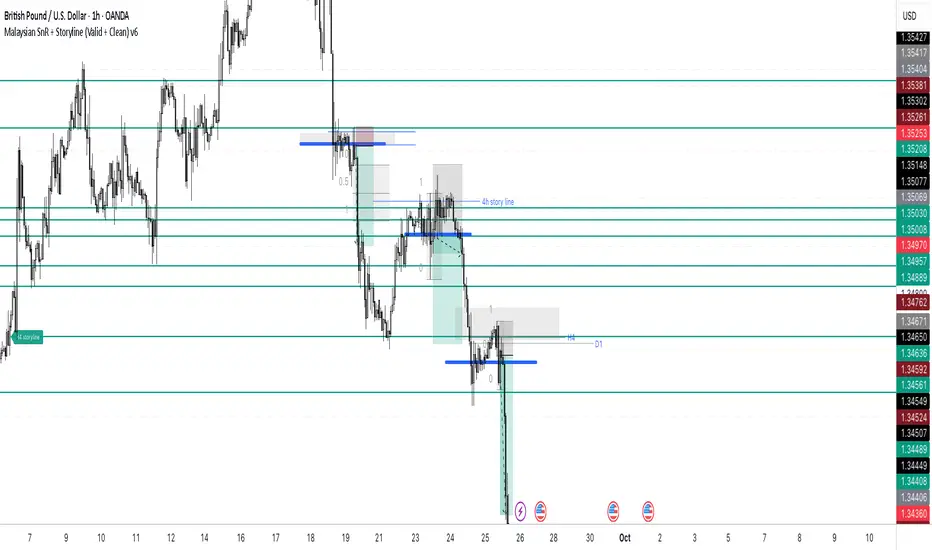
Malaysian SnR + Storyline This indicator combines the Malaysian Support & Resistance (SnR) method with a Multi-Timeframe Storyline view.
🔹 Malaysian SnR (A/V levels)
Plots Support & Resistance using candlestick bodies only (close → open).
“A” shape = Resistance (bullish close → bearish open).
“V” shape = Support (bearish close → bullish open).
Supports Fresh/Unfresh logic with wick-touch validation.
🔹 Storyline (W/D/H4/H1 bias lines)
Weekly = Big map / macro bias.
Daily = Medium trend / retracement.
H4 = Intraday bias confirmation.
H1 = Execution bias (entry filter).
Lines extend forward and only update when a new pivot confirms.
🔹 Extra Features
Alignment Rule: option to hide A/V levels when TF biases don’t align (e.g. W=D=H4=H1).
Story Labels: optional text labels describing each TF storyline.
History filter: show storyline for the last X days only, for cleaner charts.
This script is designed for price action traders who want to combine body-based SnR levels with a clear multi-timeframe bias storyline, making it easier to align intraday execution with higher timeframe context.
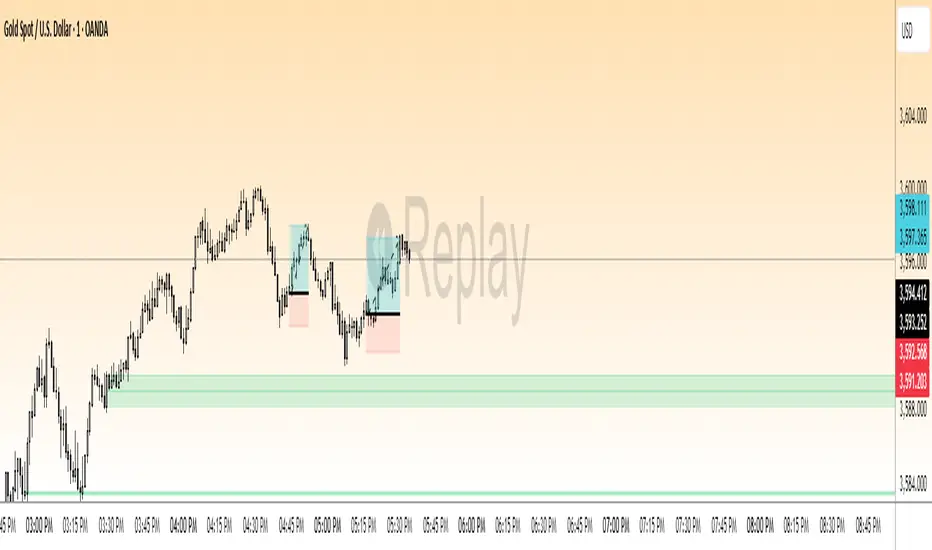
EWC Zone Matrix📌 EWC Precision Blocks
🔎 Overview
EWC Precision Blocks is a professional market analysis tool designed to highlight high-probability trading zones on the chart. Instead of relying on lagging signals, this indicator maps out Alpha Zones (bullish) and Beta Zones (bearish), allowing traders to identify potential market reaction areas with clarity.
The algorithm is built to adapt across Scalp, Swing, and Position trading modes, making it flexible for short-term intraday traders as well as long-term investors.
⚡ Key Features
Multi-Mode Detection – Switch between Scalp, Swing, or Position modes depending on your trading style.
EWC Alpha Zone (Bullish Detection) – Highlights areas where the market may find strong upward momentum.
EWC Beta Zone (Bearish Detection) – Highlights areas where the market may face downward pressure.
Zone Break Tracking – Visualizes when a zone has been invalidated or broken.
Body-Based Detection – Option to base calculations on candle bodies instead of wicks for precision.
Zone Flips – Displays polarity shifts when zones transition from supportive to resistive behavior (and vice versa).
Custom Styling – Full control of zone and break colors for clear chart visualization.
🎯 How to Use
Select Your Mode
Scalp → Designed for fast intraday moves.
Swing → Medium-term setups, ideal for session trading.
Position → Long-term outlook, suitable for investors.
Watch the Alpha Zones
Highlighted bullish areas can serve as potential support or accumulation zones.
Watch the Beta Zones
Highlighted bearish areas may act as resistance or distribution zones.
Monitor Breaks & Flips
Alpha Breaks → Bullish zones failing.
Beta Breaks → Bearish zones failing.
Zone Flips → Polarity changes, often powerful signals.
🛠 Inputs & Customization
EWC Mode → Choose Scalp, Swing, or Position.
Show Last Alpha Zone → Set how many bullish zones to display.
Show Last Beta Zone → Set how many bearish zones to display.
Body-Based Detection → Toggle candle body vs. wick calculation.
EWC Alpha Zone / Beta Zone Styling → Customize zone colors.
Alpha Break / Beta Break Colors → Adjust break visuals.
Show Zone Flips → Enable/disable historical polarity labels.
Status Bar → Display inputs directly in the chart status line.
📈 Best Practices
Works across all timeframes and markets (forex, crypto, indices, stocks).
Combine with your existing strategy for confirmation.
Use in alignment with higher timeframe structure for maximum accuracy.
⚠ Disclaimer
EWC Precision Blocks is a market visualization tool provided for educational purposes only. It does not provide financial advice, signals, or guaranteed results. Always do your own research and manage risk responsibly.
🔹 About EWC
EWC (EastWave Capital) is dedicated to developing professional-grade trading tools and strategies for traders across forex, crypto, commodities, and indices. With over a decade of combined market experience, our mission is to empower traders with precision, clarity, and confidence in their decision-making.
EWC Precision Blocks is one of our flagship tools, reflecting our commitment to innovation, transparency, and trader-focused solutions.
📌 Published by Usama Manzoor — Founder of EastWave Capital (EWC)
1 minute ago
Release Notes
EWC Precision Blocks
The EWC Alpha-Beta Zone Detector is designed for traders who value clarity, precision, and flexibility in their chart analysis.
By mapping out Alpha (strength) and Beta (weakness) zones, this script provides a structured way to understand how price reacts to key levels in the market.
This indicator is built on price action principles and market structure analysis, avoiding clutter and focusing on the essentials traders need. Whether you are scalping on lower timeframes or analyzing swing opportunities, the Alpha-Beta Zone Detector adapts to your style.
🔹 Core Features
Alpha & Beta Zones → Detects bullish and bearish strength zones in real time.
Highlight Last Zone → Focus on the most recent Alpha/Beta zone for clarity.
Zone Flip Detection → Identifies polarity changes when zones shift from support to resistance or vice versa.
Body-Based Detection → Option to base calculations on candle bodies instead of wicks for more accuracy.
Flexible Timeframe Sensitivity → Switch between short, intermediate, and long-term detection modes.
Custom Zone Styling → Adjust colors, opacity, and line thickness for both Alpha and Beta zones.
Break Visualization → Display breaks of Alpha and Beta zones for additional confirmation.
Market Versatility → Works seamlessly on Forex, Crypto, Indices, Commodities, and Stocks.
🔹 Why Traders Use It
Provides a clear visual guide to market decision zones.
Helps traders refine entries, stop-loss placement, and take-profit levels.
Adapts to multiple trading styles → scalpers, intraday traders, and swing traders.
Keeps charts clean and professional without overloading with unnecessary signals.
⚠️ Disclaimer:
This script is created for educational and informational purposes only. It does not provide financial advice. Trading involves risk; always manage your risk responsibly and conduct your own analysis before entering any position.
RB — Rejection Blocks (Price Structure)This indicator detects and visualizes Rejection Blocks (RBs) using pure price action logic.
A bullish RB occurs when a down candle forms a lower low than both its neighbors. A bearish RB occurs when an up candle forms a higher high than both its neighbors.
Validated RBs are displayed as boxes, optional lines, or labels. Blocks are automatically removed when invalidated (price closes through them), keeping the chart uncluttered and focused.
How to use
• Apply on any timeframe, from intraday to higher timeframes.
• Watch how price reacts when revisiting RB zones.
• Treat these zones as contextual areas, not entry signals.
• Combine with your own trading methods for confirmation.
Originality
Unlike generic support/resistance tools, this indicator isolates a specific structural pattern (rejection blocks) and renders it visually on the chart. This selective focus allows traders to study structural reactions with more clarity and precision.
⚠️ Disclaimer: This is not a trading system or a signal provider. It is a visual analysis tool designed for structural and educational purposes.

CHoCH + BOS + LQ Sweep v6.3.8 PRO+The CHoCH + BOS + LQ Sweep PRO indicator is a comprehensive Smart Money Concepts (SMC) tool designed to identify market structure shifts, liquidity sweeps, and key supply-demand zones across multiple timeframes. It helps traders visualize crucial price action patterns like Change of Character (CHoCH), Break of Structure (BOS), and liquidity grabs that often precede significant market reversals or continuations.
This tool is especially suited for traders applying multi-timeframe analysis and liquidity-based trading strategies on Forex, crypto, indices, or commodities.
1. Liquidity Sweeps (LQ Sweeps)
Identifies when price sweeps previous highs/lows (stop hunts/liquidity grabs).
Configurable strength setting to filter minor vs. major sweeps.
Optional stop at wick or stop at close logic for more precise entries.
Old sweeps can be displayed or hidden, with user-defined limits for historical sweeps.
2. Multi-Timeframe (HTF) Sweeps
Displays liquidity sweeps from higher timeframes (M15, H1, H4, D1, W1).
Individual checkboxes allow flexible combinations (e.g., show only H1 & H4 sweeps).
Unique colors for each timeframe to differentiate visually on the chart.
3. Supply/Demand Zones
Automatically plots zones around swing highs and lows.
Zones are dynamically updated and locked once price interacts with them.
Configurable view: Show both bullish/bearish zones or filter for one side only.
Option to display/hide old zones and limit the number of zones shown.
4. Historical Sweep Management
Stores up to 5000 sweeps internally, while adhering to TradingView’s rendering limits (max 500 drawn).
Ensures chart clarity by prioritizing the most recent sweeps.

MTF Fractals [RunRox]🔽 MTF Fractals is a powerful indicator designed to visualize fractals from multiple timeframes directly on your chart, highlight liquidity sweeps at these fractal levels, and provide several additional features we’ll cover in detail below.
We created this indicator because we couldn’t find a suitable tool that met our specific needs on TradingView. Therefore, we decided to develop a valuable indicator for the entire TradingView community, combining simplicity and versatility.
⁉️ WHAT IS A FRACTALS?
In trading, a fractal is a technical analysis pattern composed of five consecutive candles, typically highlighting local market turning points. Specifically, a fractal high is formed when a candle’s high is higher than the highs of the two candles on either side, whereas a fractal low occurs when a candle’s low is lower than the lows of the two adjacent candles on both sides.
Traders use fractals as reference points for identifying significant support and resistance levels, potential reversal areas, and liquidity zones within price action analysis. Below is a screenshot illustrating clearly formed fractals on the chart.
📙 FRACTAL FORMATION
Here’s how fractals form depending on your chosen setting (3, 5, 7, or 9):
▶️ 3-bar fractal – forms when the central candle is higher (for highs) or lower (for lows) than one candle on each side.
▶️ 5-bar fractal – forms when the central candle is higher or lower than two candles on both sides.
▶️ 7-bar fractal – forms when the central candle is higher or lower compared to the three candles on each side.
▶️ 9-bar fractal – forms similarly but requires four candles on each side, making the fractal significantly more reliable and robust.
A higher number of bars ensures stronger fractal levels, highlighting more significant potential reversal points on the chart.
Now that we’ve covered the theory behind fractal formation, let’s explore the indicator’s functionality in more detail.
Below, I’ll explain each feature clearly and illustrate how you can effectively utilize this indicator in your trading.
🕐 MULTI-TIMEFRAME FRACTALS
We realized that displaying fractals only from the current timeframe isn’t always convenient, so we’ve introduced Multi-Timeframe Fractals into this indicator.
Now you can easily display fractals from higher timeframes directly on your current chart, providing you with broader market context and clearer trading signals.
Fractals from Current Timeframe – Fractals identified directly on the chart’s current timeframe.
Fractals from Higher Timeframes – Fractals sourced from higher timeframes and displayed clearly on your current chart for enhanced market perspective.
📈 FRACTAL LINES
Since fractals represent areas of high liquidity, we’ve added an option to extend fractal levels horizontally as Fractal Lines across your chart.
This feature allows you to clearly visualize critical liquidity areas from higher timeframes, directly on your current timeframe chart, as demonstrated in the screenshot below.
With this approach, you can clearly visualize significant fractal levels from higher timeframes directly on your current chart - for example, projecting fractals from the 1-hour (1H) timeframe onto a 3-minute (3m) chart. ✅ This helps you easily identify critical liquidity areas and potential reversal zones without the need to switch between multiple timeframes.
💰 LIQUDITY SWEEP (LIQUDITY GRAB)
To enhance your trading experience, we’ve introduced a feature that clearly identifies liquidity sweeps of fractal levels.
A Liquidity Sweep occurs when a candle closes beyond a fractal line, leaving a wick that pierces through it, signaling that liquidity has been collected at this level.
Below, you’ll find two examples illustrating this functionality:
▶️ Fractal lines from the current timeframe
▶️ Fractal lines projected from higher timeframes
The first example illustrates liquidity being swept from fractals on the current timeframe .
Here, the candle clearly closes beyond the fractal line, leaving a wick through it. This indicates a liquidity sweep at the fractal level, visually highlighting a potential reversal or continuation opportunity directly on your chart.
In the second example, fractals from the higher timeframe are projected onto your current chart.
When a candle on your current timeframe closes beyond an HTF fractal line - leaving a wick through this level - the indicator highlights it clearly. This signals to traders a potential reversal zone, indicating that liquidity has been swept, and price may reverse or significantly react from this area.
You can also enable the display of additional labels on the chart. These labels clearly mark liquidity sweeps at fractal levels, making it easier to visually identify potential reversal points directly on your chart.
⚙️ SETTINGS
Below are the indicator settings with detailed explanations for each parameter.
🔷 Bars in Fractal – Number of candles to the right and left required to form a fractal.
🔷 Fractal Timeframe – Select the timeframe from which you want to display fractals on the current chart.
🔷 Max Age, bars – Number of bars during which the fractal will remain active.
🔷 Show Fractal Line – Display or hide fractal lines.
🔷 Line Style – Choose the style of the line displayed on the chart.
🔷 Line Width – Thickness of the fractal line.
🔷 High Fractal – Style and color of bearish fractals.
🔷 Low Fractal – Style and color of bullish fractals.
🔷 Fractal Label Size – Select the size of fractal labels.
🔷 Show Sweep Labels – Option to display labels when a liquidity sweep occurs.
🔷 Label Color – Color and transparency of the area marked on the chart during a sweep.
🔷 Shade Sweep Area – Show or hide the sweep area shading.
🔷 Area Color – Color and transparency settings for the sweep area.
🔶 We’d love to hear your feedback and any suggestions for additional features you’d like to see in this indicator. We’ll be happy to consider your ideas and continue improving the indicator!

1H/3m Concept [RunRox]🕘 1H/3m Concept is a versatile trading methodology based on liquidity sweeps from fractal points identified on higher timeframes, followed by price reversals at these key moments.
Below, I will explain this concept in detail and provide clear examples demonstrating its practical application.
⁉️ WHAT IS A FRACTALS?
In trading, a fractal is a technical analysis pattern composed of five consecutive candles, typically highlighting local market turning points. Specifically, a fractal high is formed when a candle’s high is higher than the highs of the two candles on either side, whereas a fractal low occurs when a candle’s low is lower than the lows of the two adjacent candles on both sides.
Traders use fractals as reference points for identifying significant support and resistance levels, potential reversal areas, and liquidity zones within price action analysis. Below is a screenshot illustrating clearly formed fractals on the chart.
📌 ABOUT THE CONCEPT
The 1H/3m Concept involves marking Higher Timeframe (HTF) fractals directly onto a Lower Timeframe (LTF) chart. When a liquidity sweep occurs at an HTF fractal level, we remain on the same LTF chart (since all HTF fractals are already plotted on this lower timeframe) and wait for a clear Market Structure Shift (MSS) to identify our potential entry point.
Below is a schematic illustration clearly demonstrating how this concept works in practice.
Below is another 💡 real-chart example , showing liquidity in the form of a 1H fractal, swept by a rapid impulse move. Immediately afterward, a clear Market Structure Shift (MSS) occurs, signaling a potential entry point into the trade.
Another example is shown below, where we see our hourly fractal, from which price clearly reacts, providing an opportunity to search for an entry point.
As illustrated on the chart, the fractal levels from the higher timeframe are clearly displayed, but we’re working directly on the 5-minute chart. This allows us to remain on one timeframe without needing to switch back and forth between charts to spot such trading setups.
🔍 MTF FRACTALS
This concept can be applied across various HTF-LTF timeframe combinations. Although our examples illustrate 1H fractals used on a 5-minute chart, you can effectively utilize many other timeframe combinations, such as:
30m HTF fractals on 1m chart
1H HTF fractals on 3m chart
4H HTF fractals on 15m chart
1D HTF fractals on 1H chart
The key idea behind this concept is always the same: identify liquidity at fractal levels on the higher timeframe (HTF), then wait for a clear Market Structure Shift (MSS) on the lower timeframe (LTF) to enter trades.
⚙️ SETTINGS
🔷 Trade Direction – Select the preferred trading direction (Long, Short, or Both).
🔷 HTF – Choose the higher timeframe from which fractals will be displayed on the current chart.
🔷 HTF Period – Number of candles required on both sides of a fractal candle (before and after) to confirm fractal formation on the HTF.
🔷 Current TF Period – Sensitivity to the impulse that sweeps liquidity, used for identifying and forming the MSS line.
🔷 Show HTF – Enable or disable displaying HTF fractal lines on your chart. You can also customize line style and color.
🔷 Max Age (Bars) – Number of recent bars within which fractals from the selected HTF will be displayed.
🔷 Show Entry – Enable or disable displaying the MSS line on the chart.
🔷 Enable Alert – Activates TradingView alerts whenever the MSS line is crossed.
You can also enable 🔔 alerts, which notify you whenever price crosses the MSS line. This significantly simplifies the process of identifying these setups on your charts. Simply configure your preferred timeframes and wait for notifications when the MSS line is crossed.
🔶 We greatly appreciate your feedback and suggestions for improving the indicator!

Displacement (Two FVGs)A simple indicator that attempts to identify displacement in price by alerting you when two simultaneous Fair Value Gaps (FVGs) occur.
When two fair value gaps occur, the indicator will print a green bar (if bullish) or a red bar (if bearish). If you right click on the indicator you can turn on alerts that will pop up every time a dual FVG occurs.
Fair Value Gaps are most commonly used amongst price action traders and are defined as instances in which there are inefficiencies, or imbalances, in the market.
The concept for this indicator is very simple. Apply it to your chart and enable alerts on the instruments and timeframe you trade. When you get an alert, it could indicate larger players getting involved.
This is NOT a trading strategy. Its intention is to save time by alerting you to large imbalances in price on the instruments you trade.

HorseShoe - At NalıHorseShoe - At Nalı
English
HORSEHOE FORMATION
It is actually a kind of bobbin. As with the bobbin, the needles of the candles are not taken into account much.The difference is that there are only four candlesticks in this formation. There is no limit to this in the bobbin.In addition, it is important which of the bars forming the bobbin is longer or shorter than which.is not. This is very important in a horseshoe. There is a rule for the length and shortness of the bars.Candlesticks in a horseshoe showing the bearish sequentially rising, falling, rising and repeatingin the form of falling bars. Also the lengths of the first and fourth bars, i.e. price opening andThe differences between the closing must be longer than the second and third bar. So those on the sideshould be clearly larger than the middle ones. For the rise, the bars are falling-rising-falling in order.The rising candle should be in the form of a bar. Likewise the first and last barsshould be longer than the middle ones.Of the first and fourth bars, it is better if the fourth bar is longer than the first.was the signal. But the fact that they are equal or the first one is long does not mean this formation. Attentionthe first and last bars that need to be beat are clearly longer than the middle onesrequired. A millimeter long means a very weak signal.
It is valid for every price and parity. But this is not a magic wand, so every horseshoemay not be the correct signal. Trend, Supdem, Correlation and other similar components are alsois involved, a highly efficient signal is formed. Well reviewed onexperience must be gained. More like an indicator to show the direction of the price rather than a signalshould be used.
Turkish
AT NALI FORMASYONU
Aslında bir tür bobindir. Bobinde olduğu gibi mumların iğneleri çok dikkate alınmaz. Farkı, bu oluşumda sadece dört mum çubuk vardır. Bobinde bunun sınırı yoktur. Ayrıca bobini oluşturan barların hangisinin hangisinden uzun ya da kısa olduğu önemli değildir. At nalında bu çok önemlidir. Barların uzunluğu kısalığı ve sırasında bir kural vardır. Düşüşü gösteren at nalında mum çubuklar sırayla yükselen düşen yükselen ve tekrar düşen barlar şeklindedir. Ayrıca birinci ve dördüncü barların uzunlukları, yani fiyat açılış ve kapanışı arasındaki farkları, ikinci ve üçüncü bardan daha uzun olmalıdır. Yani kenardakiler ortadakilerden net bir şekilde büyük olmalı. Yükseliş için ise barlar sırayla düşen-yükselen düşen-yükselen mum çubuk şeklinde olmalıdır. Aynı şekilde ilk ve son barlar ortadakilerden uzun olmalıdır. Birinci ve dördüncü barlardan dördüncü barın birinciden uzun olması daha güze bir sinyaldi. Fakat eşit olmaları ya da birincinin uzun olması da bu oluşumu bozmaz. Dikkat edilmesi gereken ilk ve son barların açık bir şekilde ortadakilerden uzun olması gerekmektedir. Milim farkla uzun olması çok zayıf bir sinyal olması anlamına gelir.
kaynak:
Price Action TR

MTF Market Structure Highs and LowsThe indicator marks the last fractal highs and lows (W,D,4H and 1H options) to help determine current market structure. The script was created to help with directional bias but also as a MTF visual aid for stop hunts/liquidity raids.
Liquidity areas are where we assume trader's stop losses would be when buying or selling. Liquidity lies above and below swing points and institutions need liquidity to fill large orders.
Monitor price action as it hits these areas for a potential reversal trade.

[H] Multi Coin Compare
Use a focal point to compare multiple coins price action to one another in real time
View the price of up to 5 coins in an easy to view table
Fully Customizable

FX Sessions - All in OneFX Sessions - All In One
This Script offer a wide variety of goodies
SESSION OPEN
it will draw a line for the TOP, MID and LOW of the asian session (you can adjust the hours of the session)
It will draw a line for the TOP and LOW of the London Session (you can adjust the hours of the session)
It will draw a line for the TOP and LOW of the NY Session (you can adjust the hours of the session)
SEPARATORS
while on lower timeframe, you will have a separator for days that occurs at midnight NY time
While on Daily timeframe, you will have a separator that will separate every month, on the 1st trading day of that given month
IMBALANCE
The candle leaving imbalance (a candle where there is a portion that is not matched with a price action left or right)
NY Midnight opening price
a dotted line will be drawn (up to 500 bar limitation) from NY open until it reaches either the 500 bar or the end of the day.
on lower timeframe (below 3 minutes) the bar will not reach the end of the day

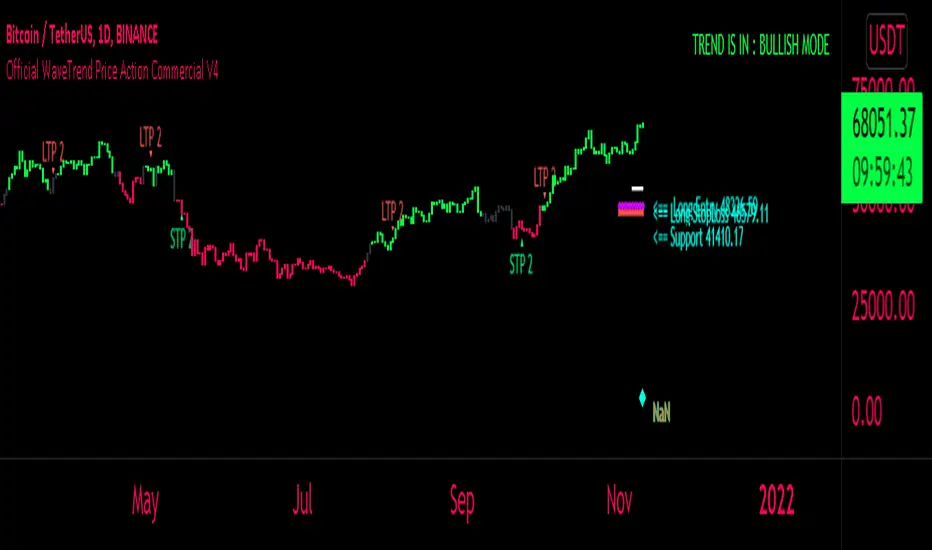
FaizanN Official WaveTrend Price Action Commercial PINEV4Hello Traders,
Here i bring you my first Price Action WaveTrend based Indictor combined with fib entry and exit trailing levels with minimum risk and maximum profit , as we must have seen at times as we enter the trend reverse and hits our stoploss . Keeping that in mind as i too struggled and made losses so i decided and focused more on minimizing the loss and only on confirmation Long or Short trade is been initiated along with Stoploss as explaned in the images below , why should we give market our money ;) as we are here to make money :D .. There is no holy grail as Stop loss wont be hit but yes it will be way less and all alerts are based on candle close ... One can use this on any chart and any timeframe and its very good for scalping too . Better results are on 15m and above . Hope you guys will like it and comment if you have any doubts..
-----------------
Disclaimer
Copyright by FaizanNawazz.
The information contained in my scripts/indicators/strategies/ideas does not constitute financial advice or a solicitation to buy or sell any securities of any type. I will not accept liability for any loss or damage, including without limitation any loss of profit, which may arise directly or indirectly from the use of or reliance on such information.
All investments involve risk, and the past performance of a security, industry, sector, market, financial product, trading strategy, or individual’s trading does not guarantee future results or returns. Investors are fully responsible for any investment decisions they make. Such decisions should be based solely on an evaluation of their financial circumstances, investment objectives, risk tolerance, and liquidity needs.
My scripts/indicators are only for educational purposes!
Happy Trading!
V1=PRICE ACTION (INVITE ONLY SCRIPT)
Hello Traders,
Here i bring you my first Price Action Atr based Indictor combined with fib entry and exit trailing levels with minimum risk and maximum profit , as we must have seen at times as we enter the trend reverse and hits our stoploss . Keeping that in mind as i too stuggled and made losses so i decided and focused more on minimizing the stoploss and only on confirmation Long or Short trade is been initiated along with trailing Stoploss as explaned in the images below , why should we give market our money ;) as we are here to make money :D .. There is no holy grail as Stoploss wont be hit but yes it will be way less and all alerts are based on candle close ... Trend Screener is added too which will tell you about the trend .. One can use this on any chart and any timeframe and its very good for scalping too . Vwap and Baseline is added too just incase you want to enter trend manually ... Better results are on 15m and above . Hope you guys will like it and comment if you have any doubts..
-----------------
Disclaimer
Copyright by FaizanNawazz.
The information contained in my scripts/indicators/strategies/ideas does not constitute financial advice or a solicitation to buy or sell any securities of any type. I will not accept liability for any loss or damage, including without limitation any loss of profit, which may arise directly or indirectly from the use of or reliance on such information.
All investments involve risk, and the past performance of a security, industry, sector, market, financial product, trading strategy, or individual’s trading does not guarantee future results or returns. Investors are fully responsible for any investment decisions they make. Such decisions should be based solely on an evaluation of their financial circumstances, investment objectives, risk tolerance, and liquidity needs.
My scripts/indicators are only for educational purposes!
Happy Trading!

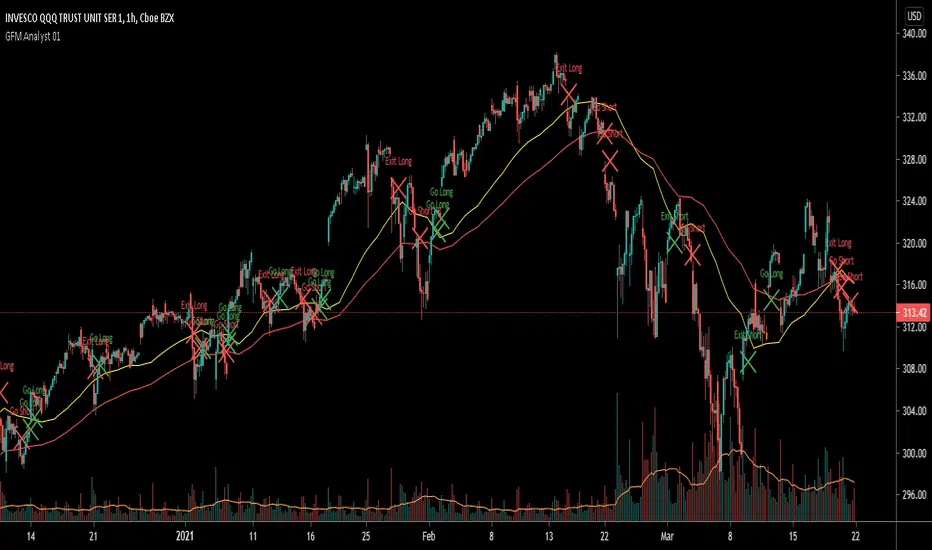
GFM Analyst 01 - Price Action & EMAsThis indicator will help in identifying trends. It is using the historic price action to determine the Buy and Sell signals.
Also we have used the Exponential Moving Averages on a daily timeframe (resolution/period). This will help is eradicate any false signals.
Yellow Line = Fast Exponential Moving Average
Red Line = Slow Exponential Moving Average
On a shorter timeframe, one should ignore short signals, if the price is moving above these two EMA's and similarly ignore long signals, if the price is moving below these two EMA's.
Renko MTF - Traditional and ATRSomehow there aren't too many renko bars that have the traditional setting built-in so I put one up. This one has the option to choose between Traditional and ATR, the size number corresponds to the option that was chosen. And just in case if anyone wanted, I put up a multi-time frame option to choose the time frame the bars take place. D is for day, W is for week, flat numbers are in minutes, and leaving it blank looks at the current time frame the chart is in. The calculation comes from how Tradingview handles renko bars.
Renko bars don't paint a color unless the market moves a certain amount based on its settings. When the market moves up it turns green, if it moves down it turns red, simple color changes alone can say a lot. They're a good way to try to find trends somewhat objectively and seem to be a good way to eliminate time and can replace other time-based indicators that can whipsaw or lag. The bars have a tendency to repeat themselves so it's a good way to find trends. There aren't too many settings for the box size, most people either just choose 5, 10, 14, etc where as other indicators have many options that differ on different markets. The numbers can be chosen easily enough to pick a sweet spot with just a single input where other indicators such as MACD have multiple inputs to pick the right number that can make it difficult to choose from(although it won't be as precise as a MACD would sometimes but can be worth the objectiveness and consistency and same setting repeatability in different markets in my opinion). Some example strategies could be to use them as an alternative trailing stop, finding trends, a simple color change for entry and exit on top of other strategies, etc. It can do the job of many in an all in one price action type indicator(although not better all the time, it can come close enough). Despite all this, it does seem to depend on which time-frame it's being looked at, how TV does the calculation for it, and how one can use this with the lack of practical information on it out there.

ATR TRex [ipooya]To appreciate dear Mr.Khakestar efforts I have converted his mt4 ATR formula to pine script. All credits go to him.
you can view the ATR result of each candle in the past:
The first black number is the ATR of the M1 chart.
The second black number is the ATR of the M5chart.
The third black number is the ATR of the M15 chart.
The fourth black number is the ATR of the H1 chart.
The fifth black number is the ATR of the H4 chart.
The sixth black number is the ATR of the Daily chart.
The seventh black number is the ATR of the Weekly chart.
**and the second number of every line is live ATR ( current ATR candle)
What makes this ATR formula so different?
This formula invented by Mr.Khakestar and it shows the power of the price to move in each cycle of the chart. We can use it in RTM strategy and Price Action trading. To learn how to use it you need to learn TRex strategy (Presented by Mr.Khakestart for free in Persian).

Moving Average of Upper and Lower Wicks with optional smoothingIn the book, The New Technical Trader by Tushar Chande and Stanley Kroll there is a part that talks about candlestick analysis and how the wicks play a role on how the price will behave. When wick lengths increase then there could be uncertainty. Weakening of support and resistance levels can also be seen by the size of the candlestick wicks or shadows. Shoutouts to Mango2Juice from Tradingview and the The Academy of Forex for helping me out in making this and providing the moving averages function.
When combined with other indicators or strategies, I find that this increases their accuracy when used correctly. For those that believe in price action, this might be worth a try. The book has only a brief section on candlestick wicks but it is one of the most interesting ideas I found. The book likes to include a simple moving average in its indicators with a certain length to provide a smoothing type of effect or a sort of extra indicator for the other to be above to give off quicker signals at the cost of accuracy. For this indicator it acts as a smoothing type effect which I put in because it is hard to see the slope and direction of where the moving averages of the wicks are going. The type of moving averages to use and the correct lengths are questionable and are not explained well in the book. If anyone can figure out a good use for this or know better settings or tips, please let me know.

ATR & Price Action IndicatorHello there.
This Script prints multiple Entries based on Price Action and ATR.
Can be used on all timeframes.
Kind regrads
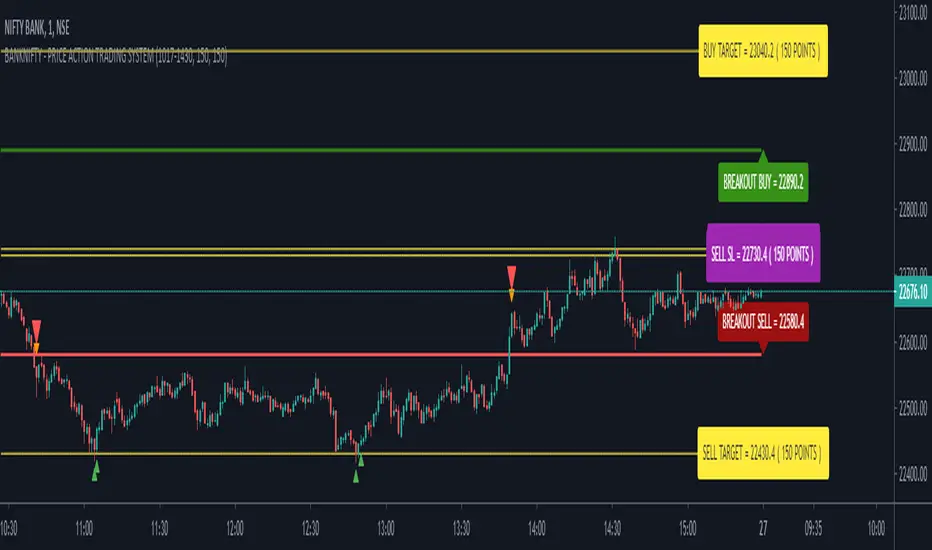
BANKNIFTY - PRICE ACTION TRADING SYSTEMThis study is based on several Price Action parameters of :-
• Candle Pattern,
• Supply Demands,
• Support and Resistance,
• Breakouts.
► How To Use This Study ?
• Suitable Trade Session for this study 09:45 AM to 02:30 PM ( UTC +05:30)
• Buy Whenever a Green Up Triangle Appears on Chart.
• Sell Whenever a Red Down Triangle Appears on Chart.
• Exit Buy Whenever a tiny Down Triangle Appears After A Buy call and Exit Sell Whenever a tiny up Arrow Appears After A Sell Call.
• Take Only 1 trade Per Trading Session.
Test Yourself and give feedback.
PM us to obtain access.