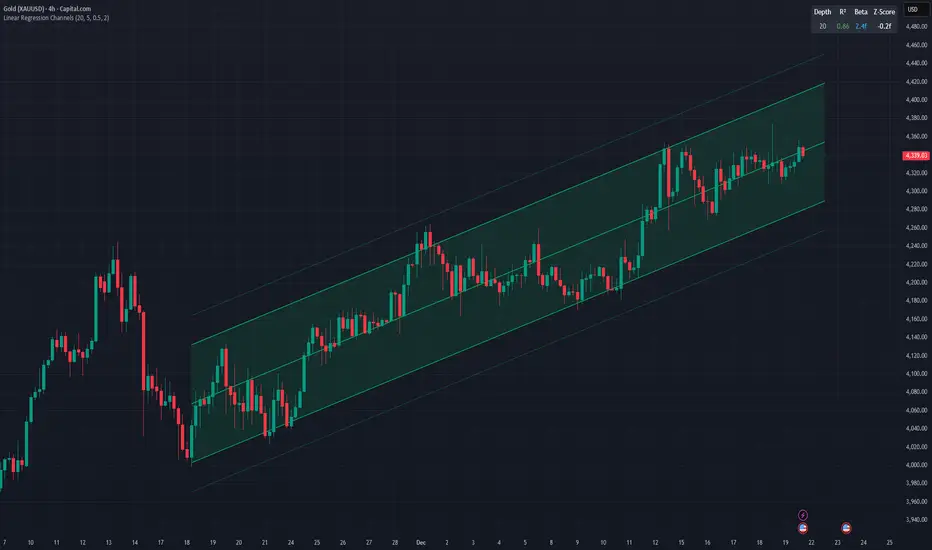
Linear Regression ChannelsThis indicator dynamically identifies and plots the best-fit linear regression channels based on recent pivot points, optimizing for statistical strength across user-defined depths.
How It Works (Technical Methodology)
1. Pivot Point Detection
The indicator uses Pine Script's ta.pivothigh() and ta.pivotlow() functions with a configurable sensitivity length to detect swing highs and lows. All recent pivot indices are stored in an array (limited to avoid performance issues), providing potential starting points for regression calculations.
2. Multi-Depth Evaluation
Users input comma-separated "Pivot History Depths" (e.g., "5,20,50"). For each depth:
- The script evaluates regression fits starting from the most recent pivots, up to the specified depth count.
- It calculates linear regression statistics for each possible channel originating from those pivot bars backward to the current bar.
3. Linear Regression Calculation
For each candidate channel:
- Slope (m) and intercept (b) are computed using least-squares method.
- R-squared (R²) measures goodness of fit (how well price follows the trend line).
- Standard error of the estimate is calculated to quantify volatility around the regression line.
- A composite score = R² × log(length) prioritizes stronger fits on longer periods.
4. Best-Fit Selection and Validation
- Only channels with R² ≥ user-defined minimum (default 0.5) are considered valid.
- The channel with the highest score for each depth is selected and drawn.
- This ensures the most statistically significant and relevant channels are displayed, avoiding weak or short-term noise.
5. Channel Construction
- Mean Line: The regression trend line extended slightly into the future.
- Inner Channels: ± user-configurable standard deviation multiplier (default 2.0σ) around the mean.
- Outer Bands: ±1.5× the inner deviation for additional visual context.
- Filled areas between mean and inner channels for better visibility.
- Color: Green shades for upward slopes (bullish trend), red shades for downward slopes (bearish trend).
6. Dashboard and Statistics
- Optional table in the top-right corner displays for each depth:
- Depth value
- R² (colored green if >0.7, orange otherwise)
- Slope (Beta) – positive blue for uptrend, red for downtrend
- Current Z-Score: How many standard deviations the latest close is from the expected regression value (yellow if |Z| > 2)
How to Use
Regression channels help identify trending markets, potential mean reversion, and overextension.
- Upward Channels (Green): Price above the mean may indicate strength; pullbacks to the mean or lower band offer long opportunities. Overextension above upper band could signal exhaustion.
- Downward Channels (Red): Price below the mean may indicate weakness; rallies to the mean or upper band offer short opportunities. Overextension below lower band could signal capitulation.
- High R² (>0.7): Strong trending channel – trade in direction of slope.
- Low R²: Choppy/range-bound market – avoid trend-following trades.
- Z-Score: |Z| > 2 suggests price is statistically overextended from the trend (potential reversion setup).
- Multi-Depth: Smaller depths catch short-term trends; larger depths capture major trends. Use multiple for confluence across timeframes.
Combine with volume, support/resistance, or other indicators for confirmation.
Disclaimer
This indicator is a technical analysis tool and should be used in conjunction with other forms of analysis. Past performance does not guarantee future results. Always use proper risk management.
스크립트에서 "pivot points"에 대해 찾기
TRZigZagLibLibrary "TRZigZagLib"
method directionName(this)
Gets pivot direction as string
Namespace types: Pivot
Parameters:
this (Pivot) : Pivot instance
Returns: "HIGH" or "LOW"
method isHigh(this)
Checks if pivot is a high
Namespace types: Pivot
Parameters:
this (Pivot) : Pivot instance
Returns: true if pivot is a high
method isLow(this)
Checks if pivot is a low
Namespace types: Pivot
Parameters:
this (Pivot) : Pivot instance
Returns: true if pivot is a low
method newSettings(minLength, minBarSize, maxBarSize)
Creates default ZigZag settings
Namespace types: series int, simple int, input int, const int
Parameters:
minLength (int) : Minimum pivot length (default: 10)
minBarSize (int) : Minimum bars between pivots (default: 5)
maxBarSize (int) : Maximum bars to lookback (default: 300)
Returns: New ZigZagSettings instance
method setLineStyle(this, lineColor, lineWidth, lineStyle)
Sets line appearance
Namespace types: ZigZagSettings
Parameters:
this (ZigZagSettings) : Settings instance
lineColor (color)
lineWidth (int)
lineStyle (string)
Returns: Modified settings instance
method newZigZag(settings, depth)
Creates a new ZigZag instance
Namespace types: ZigZagSettings
Parameters:
settings (ZigZagSettings) : ZigZag settings
depth (int) : Depth value for this ZigZag
Returns: New ZigZag instance
method calculate(this)
Calculates ZigZag using LuxAlgo-style pivot detection
Namespace types: ZigZag
Parameters:
this (ZigZag) : ZigZag instance
method getLastPivots(this, count)
Gets the last N pivots
Namespace types: ZigZag
Parameters:
this (ZigZag) : ZigZag instance
count (int) : Number of pivots to get (default: 5)
Returns: Array of pivots
method getPivot(this, index)
Gets pivot at index
Namespace types: ZigZag
Parameters:
this (ZigZag) : ZigZag instance
index (int) : Index (0 = most recent)
Returns: Pivot or na
method truncate(this, maxBars)
Truncates old pivots beyond lookback window
Namespace types: ZigZag
Parameters:
this (ZigZag) : ZigZag instance
maxBars (int) : Maximum bars to keep
method newMultiZigZag(settings, minDepth, maxDepth, count)
Creates a new MultiZigZag manager
Namespace types: ZigZagSettings
Parameters:
settings (ZigZagSettings) : Base settings for all ZigZags
minDepth (int) : Minimum depth value
maxDepth (int) : Maximum depth value
count (int) : Number of ZigZag instances (max 11)
Returns: New MultiZigZag instance
method calculateAll(this)
Updates all ZigZag instances
Namespace types: MultiZigZag
Parameters:
this (MultiZigZag) : MultiZigZag instance
method getZigZag(this, index)
Gets ZigZag at index
Namespace types: MultiZigZag
Parameters:
this (MultiZigZag) : MultiZigZag instance
index (int) : Index (0 to count-1)
Returns: ZigZag instance or na
method getDepth(this, index)
Gets depth value at index
Namespace types: MultiZigZag
Parameters:
this (MultiZigZag) : MultiZigZag instance
index (int) : Index (0 to count-1)
Returns: Depth value
method size(this)
Gets total number of ZigZag instances
Namespace types: MultiZigZag
Parameters:
this (MultiZigZag) : MultiZigZag instance
Returns: Count of ZigZag instances
method truncateAll(this, maxBars)
Truncates all ZigZag instances
Namespace types: MultiZigZag
Parameters:
this (MultiZigZag) : MultiZigZag instance
maxBars (int) : Maximum bars to keep
method distance(p1, p2)
Calculates distance between two pivots
Namespace types: Pivot
Parameters:
p1 (Pivot) : First pivot
p2 (Pivot) : Second pivot
Returns: Price distance (absolute)
method barSpan(p1, p2)
Calculates bar span between two pivots
Namespace types: Pivot
Parameters:
p1 (Pivot) : First pivot
p2 (Pivot) : Second pivot
Returns: Bar span (absolute)
method isAlternating(pivots)
Checks if pivots are alternating (high-low-high or low-high-low)
Namespace types: array
Parameters:
pivots (array) : Array of pivots
Returns: true if alternating pattern exists
Pivot
Pivot point in the chart
Fields:
d (series int) : Direction: 1=high, -1=low
x (series int) : Bar index
y (series float) : Price
confirmed (series bool) : Pivot confirmation flag
ZigZagSettings
ZigZag configuration settings
Fields:
minLength (series int) : Minimum pivot detection length
minBarSize (series int) : Minimum bars between pivots
maxBarSize (series int) : Maximum bars to lookback
lineColor (series color) : ZigZag line color
lineWidth (series int) : ZigZag line width
lineStyle (series string) : ZigZag line style
ZigZag
Single ZigZag instance
Fields:
settings (ZigZagSettings) : Configuration settings
pivots (array) : Array of pivot points (max 25 for patterns)
lastUpdateBar (series int) : Last bar index when updated
depth (series int) : Current depth value
MultiZigZag
Multi-depth ZigZag manager
Fields:
zigzags (array) : Array of ZigZag instances (max 11)
depthValues (array) : Array of depth values being used
currentBar (series int) : Current bar index being processed

LibPvotLibrary "LibPvot"
This is a library for advanced technical analysis, specializing
in two core areas: the detection of price-oscillator
divergences and the analysis of market structure. It provides
a back-end engine for signal detection and a toolkit for
indicator plotting.
Key Features:
1. **Complete Divergence Suite (Class A, B, C):** The engine detects
all three major types of divergences, providing a full spectrum of
analytical signals:
- **Regular (A):** For potential trend reversals.
- **Hidden (B):** For potential trend continuations.
- **Exaggerated (C):** For identifying weakness at double tops/bottoms.
2. **Advanced Signal Filtering:** The detection logic uses a
percentage-based price tolerance (`prcTol`). This feature
enables the practical detection of Exaggerated divergences
(which rarely occur at the exact same price) and creates a
"dead zone" to filter insignificant noise from triggering
Regular divergences.
3. **Pivot Synchronization:** A bar tolerance (`barTol`) is used
to reliably match price and oscillator pivots that do not
align perfectly on the same bar, preventing missed signals.
4. **Signal Invalidation Logic:** Features two built-in invalidation
rules:
- An optional `invalidate` parameter automatically terminates
active divergences if the price or the oscillator breaks
the level of the confirming pivot.
- The engine also discards 'half-pivots' (e.g., a price pivot)
if a corresponding oscillator pivot does not appear within
the `barTol` window.
5. **Stateful Plotting Helpers:** Provides helper functions
(`bullDivPos` and `bearDivPos`) that abstract away the
state management issues of visualizing persistent signals.
They generate gap-free, accurately anchored data series
ready to be used in `plotshape` functions, simplifying
indicator-side code.
6. **Rich Data Output:** The core detection functions (`bullDiv`, `bearDiv`)
return a comprehensive 9-field data tuple. This includes the
boolean flags for each divergence type and the precise
coordinates (price, oscillator value, bar index) of both the
starting and the confirming pivots.
7. **Market Structure & Trend Analysis:** Includes a
`marketStructure` function to automatically identify pivot
highs/lows, classify their relationship (HH, LH, LL, HL),
detect structure breaks, and determine the current trend
state (Up, Down, Neutral) based on pivot sequences.
---
**DISCLAIMER**
This library is provided "AS IS" and for informational and
educational purposes only. It does not constitute financial,
investment, or trading advice.
The author assumes no liability for any errors, inaccuracies,
or omissions in the code. Using this library to build
trading indicators or strategies is entirely at your own risk.
As a developer using this library, you are solely responsible
for the rigorous testing, validation, and performance of any
scripts you create based on these functions. The author shall
not be held liable for any financial losses incurred directly
or indirectly from the use of this library or any scripts
derived from it.
bullDiv(priceSrc, oscSrc, leftLen, rightLen, depth, barTol, prcTol, persist, invalidate)
Detects bullish divergences (Regular, Hidden, Exaggerated) based on pivot lows.
Parameters:
priceSrc (float) : series float Price series to check for pivots (e.g., `low`).
oscSrc (float) : series float Oscillator series to check for pivots.
leftLen (int) : series int Number of bars to the left of a pivot (default 5).
rightLen (int) : series int Number of bars to the right of a pivot (default 5).
depth (int) : series int Maximum number of stored pivot pairs to check against (default 2).
barTol (int) : series int Maximum bar distance allowed between the price pivot and the oscillator pivot (default 3).
prcTol (float) : series float The percentage tolerance for comparing pivot prices. Used to detect Exaggerated
divergences and filter out market noise (default 0.05%).
persist (bool) : series bool If `true` (default), the divergence flag stays active for the entire duration of the signal.
If `false`, it returns a single-bar pulse on detection.
invalidate (bool) : series bool If `true` (default), terminates an active divergence if price or oscillator break
below the confirming pivot low.
Returns: A tuple containing comprehensive data for a detected bullish divergence.
regBull series bool `true` if a Regular bullish divergence (Class A) is active.
hidBull series bool `true` if a Hidden bullish divergence (Class B) is active.
exgBull series bool `true` if an Exaggerated bullish divergence (Class C) is active.
initPivotPrc series float Price value of the initial (older) pivot low.
initPivotOsz series float Oscillator value of the initial pivot low.
initPivotBar series int Bar index of the initial pivot low.
lastPivotPrc series float Price value of the last (confirming) pivot low.
lastPivotOsz series float Oscillator value of the last pivot low.
lastPivotBar series int Bar index of the last pivot low.
bearDiv(priceSrc, oscSrc, leftLen, rightLen, depth, barTol, prcTol, persist, invalidate)
Detects bearish divergences (Regular, Hidden, Exaggerated) based on pivot highs.
Parameters:
priceSrc (float) : series float Price series to check for pivots (e.g., `high`).
oscSrc (float) : series float Oscillator series to check for pivots.
leftLen (int) : series int Number of bars to the left of a pivot (default 5).
rightLen (int) : series int Number of bars to the right of a pivot (default 5).
depth (int) : series int Maximum number of stored pivot pairs to check against (default 2).
barTol (int) : series int Maximum bar distance allowed between the price pivot and the oscillator pivot (default 3).
prcTol (float) : series float The percentage tolerance for comparing pivot prices. Used to detect Exaggerated
divergences and filter out market noise (default 0.05%).
persist (bool) : series bool If `true` (default), the divergence flag stays active for the entire duration of the signal.
If `false`, it returns a single-bar pulse on detection.
invalidate (bool) : series bool If `true` (default), terminates an active divergence if price or oscillator break
above the confirming pivot high.
Returns: A tuple containing comprehensive data for a detected bearish divergence.
regBear series bool `true` if a Regular bearish divergence (Class A) is active.
hidBear series bool `true` if a Hidden bearish divergence (Class B) is active.
exgBear series bool `true` if an Exaggerated bearish divergence (Class C) is active.
initPivotPrc series float Price value of the initial (older) pivot high.
initPivotOsz series float Oscillator value of the initial pivot high.
initPivotBar series int Bar index of the initial pivot high.
lastPivotPrc series float Price value of the last (confirming) pivot high.
lastPivotOsz series float Oscillator value of the last pivot high.
lastPivotBar series int Bar index of the last pivot high.
bullDivPos(regBull, hidBull, exgBull, rightLen, yPos)
Calculates the plottable data series for bullish divergences. It manages
the complex state of a persistent signal's plotting window to ensure
gap-free and accurately anchored visualization.
Parameters:
regBull (bool) : series bool The regular bullish divergence flag from `bullDiv`.
hidBull (bool) : series bool The hidden bullish divergence flag from `bullDiv`.
exgBull (bool) : series bool The exaggerated bullish divergence flag from `bullDiv`.
rightLen (int) : series int The same `rightLen` value used in `bullDiv` for correct timing.
yPos (float) : series float The series providing the base Y-coordinate for the shapes (e.g., `low`).
Returns: A tuple of three `series float` for plotting bullish divergences.
regBullPosY series float Contains the static anchor Y-value for Regular divergences where a shape should be plotted; `na` otherwise.
hidBullPosY series float Contains the static anchor Y-value for Hidden divergences where a shape should be plotted; `na` otherwise.
exgBullPosY series float Contains the static anchor Y-value for Exaggerated divergences where a shape should be plotted; `na` otherwise.
bearDivPos(regBear, hidBear, exgBear, rightLen, yPos)
Calculates the plottable data series for bearish divergences. It manages
the complex state of a persistent signal's plotting window to ensure
gap-free and accurately anchored visualization.
Parameters:
regBear (bool) : series bool The regular bearish divergence flag from `bearDiv`.
hidBear (bool) : series bool The hidden bearish divergence flag from `bearDiv`.
exgBear (bool) : series bool The exaggerated bearish divergence flag from `bearDiv`.
rightLen (int) : series int The same `rightLen` value used in `bearDiv` for correct timing.
yPos (float) : series float The series providing the base Y-coordinate for the shapes (e.g., `high`).
Returns: A tuple of three `series float` for plotting bearish divergences.
regBearPosY series float Contains the static anchor Y-value for Regular divergences where a shape should be plotted; `na` otherwise.
hidBearPosY series float Contains the static anchor Y-value for Hidden divergences where a shape should be plotted; `na` otherwise.
exgBearPosY series float Contains the static anchor Y-value for Exaggerated divergences where a shape should be plotted; `na` otherwise.
marketStructure(highSrc, lowSrc, leftLen, rightLen, srcTol)
Analyzes the market structure by identifying pivot points, classifying
their sequence (e.g., Higher Highs, Lower Lows), and determining the
prevailing trend state.
Parameters:
highSrc (float) : series float Price series for pivot high detection (e.g., `high`).
lowSrc (float) : series float Price series for pivot low detection (e.g., `low`).
leftLen (int) : series int Number of bars to the left of a pivot (default 5).
rightLen (int) : series int Number of bars to the right of a pivot (default 5).
srcTol (float) : series float Percentage tolerance to consider two pivots as 'equal' (default 0.05%).
Returns: A tuple containing detailed market structure information.
pivType series PivType The type of the most recently formed pivot (e.g., `hh`, `ll`).
lastPivHi series float The price level of the last confirmed pivot high.
lastPivLo series float The price level of the last confirmed pivot low.
lastPiv series float The price level of the last confirmed pivot (either high or low).
pivHiBroken series bool `true` if the price has broken above the last pivot high.
pivLoBroken series bool `true` if the price has broken below the last pivot low.
trendState series TrendState The current trend state (`up`, `down`, or `neutral`).

Pivots High Low Live DetectionPivots High Low Live Detection
Identifies and visualizes swing highs and lows on the chart in real time.
Helps to observe evolving market structure by connecting confirmed or developing pivot points with lines and labels.
Using a configurable lookback, minimum deviation, and confirmation bar system, the indicator highlights new Higher Highs (HH), Higher Lows (HL), Lower Highs (LH), and Lower Lows (LL) as they form.
When “Live (repainting)” mode is enabled, the current swing leg updates dynamically with each candle, giving immediate feedback as price develops.
When disabled, only confirmed pivots are plotted, ideal for historical validation and backtesting.
+ Key Features
Detects and labels major swing points (HH, HL, LH, LL).
Works in live or confirmed (non-repainting) mode.
Adjustable parameters for lookback, deviation (in ticks), and confirmation bars.
Lightweight and compatible with any timeframe or symbol.
Includes runtime alerts for new structural pivots and direction shifts.
+ How to Use
Adjust the inputs under the “Pivots” group to control sensitivity.
Enable “Live (repainting)” to see developing swing legs, or disable it for confirmed structure only.
Use alerts to track structural changes or potential trend reversals.

TwistedHWAY Oracle - Intelligent Level Detection System═════════════════════════════════════════════════════════════════════════
🎯 TwistedHWAY Oracle™ - Intelligent Level Detection System
═════════════════════════════════════════════════════════════════════════
OVERVIEW
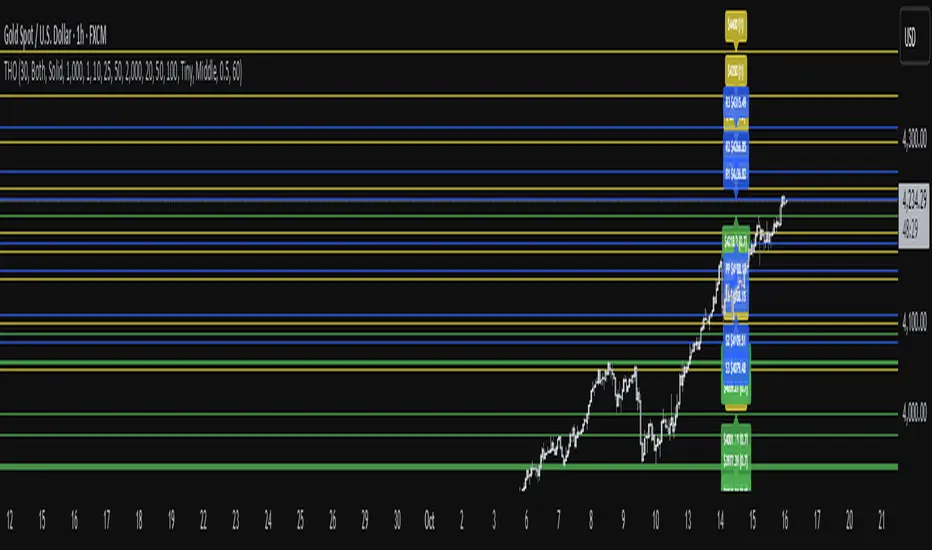
TwistedHWAY Oracle™ combines six independent calculation engines to identify high-probability support and resistance levels. The indicator uses adaptive market regime detection and confluence analysis to automatically rank levels by confidence score, helping traders identify key reaction zones where price is likely to find support or resistance.
KEY FEATURES
The indicator provides comprehensive level detection through:
Six Detection Engines — Each engine operates independently with its own alert system
Confluence Analysis — Automatically awards bonus confidence when multiple engines identify the same level
Adaptive Intelligence — Market volatility detection adjusts parameters in real-time
Confidence Scoring — Every level is ranked and displayed with a numerical confidence score
Individual Alerts — Separate alert controls for each detection method
DETECTION ENGINES
1 — Pivot Points Engine
Calculates daily pivot levels including PP, R1-R3, and S1-S3 using previous day's high, low, and close.
2 — Swing Detector
Identifies significant swing highs and lows using prominence filtering to eliminate noise.
3 — Psychological Matrix
Detects round number levels at three configurable increments (default: 10, 25, 50).
4 — Fibonacci Engine
Calculates retracement levels (23.6%, 38.2%, 50%, 61.8%, 78.6%) from major swings.
5 — VWAP System
Generates volume-weighted average price levels at three different periods.
6 — Confluence Analyzer
Awards bonus confidence points when multiple engines identify the same level.
HOW TO USE
Reading the Levels
Levels above current price = Resistance (red by default)
Levels below current price = Support (green by default)
Numbers in brackets show confidence score
Higher confidence = stronger level
Levels with score > 2.0 indicate extreme confluences
Trading Strategies
Bounce Trading — Enter positions when price approaches high-confidence levels expecting reversal
Breakout Trading — Trade breakouts through levels, using broken level as stop-loss
Confluence Zones — Focus on areas where multiple engines agree
SETTINGS GUIDE
Oracle Settings
Validation Mode — Conservative parameters for more reliable signals
Max Levels — Number of levels to display (10-50)
Level Extension — Line extension direction (None/Left/Right/Both)
Individual Engine Controls
Each engine can be toggled on/off with separate alert controls:
Pivot Engine (daily pivots)
Swing Detector (historical swings)
Psychological Matrix (round numbers)
Fibonacci Engine (retracements)
VWAP System (volume-weighted levels)
Visual Settings
Individual color selection for each level type
Label display toggle with size options
Line style preferences (Solid/Dashed/Dotted)
Alert Configuration
Alert Distance % — Proximity threshold (default: 0.5%)
Alert Cooldown — Minimum bars between alerts (default: 60)
Individual alert toggles for each engine
ADAPTIVE PARAMETERS
The indicator automatically adjusts to market conditions:
High Volatility Mode — Wider swing detection, stricter prominence filters
Normal Mode — Balanced parameters for typical market conditions
Validation Mode — Most conservative settings for reliable signals
Market regime is detected using 100-period volatility measurement with automatic threshold adjustment.
ALERTS
Five alert types plus special confluence alerts:
🎯 Pivot Alerts — Daily pivot level approaches
🌊 Swing Alerts — Historical swing level tests
🧠 Psychological Alerts — Round number approaches
🌀 Fibonacci Alerts — Retracement level tests
📉 VWAP Alerts — Volume-weighted level approaches
⚡ Critical Alerts — Ultra-high confidence levels (score ≥ 2.0)
Alerts include price level, confidence score, and source information.
BEST PRACTICES
Timeframe Selection
Works on all timeframes (optimized for 5min to Daily)
Higher timeframes = more reliable levels
Use multi-timeframe analysis for confirmation
Optimization by Instrument
Forex:
Psychological increments: 0.0010, 0.0050, 0.0100
Stocks (Low-priced):
Psychological increments: 1, 5, 10
Stocks (High-priced):
Psychological increments: 10, 25, 50
Crypto:
Adjust based on price range and volatility
LIMITATIONS
Calculation intensive on last bar (may cause slight delays)
Maximum 50 levels can be displayed simultaneously
Swing detection requires minimum 25 bars of history
VWAP calculations use price range as volume proxy when volume unavailable
NOTES
Levels are recalculated on each bar close
Confidence scores update dynamically with market conditions
Colors automatically adjust based on price position
All settings are saved with chart layout
═════════════════════════════════════════════════════════════════════════
Version: 3.0 | Build 2025.10
License: GNU GPL v3.0
© 2025 TwistedHWAY
═════════════════════════════════════════════════════════════════════════
Multi-Timeframe PivotDescription:
This script provides an advanced tool for multi-timeframe pivot point
analysis. It identifies swing points based on a candle's relationship to
its neighbors. The default strength settings of 1 align with the Inner
Circle Trader (ICT) concept of market structure.
The ICT concept defines a swing point based on a simple 3-candle pattern:
- A swing high is a candle where the candles to the immediate left and right
both have lower highs.
- A swing low is a candle where the candles to the immediate left and right
both have higher lows.
A key feature is its ability to accurately calculate and translate pivot
points from up to five higher timeframes (HTFs) and display them
precisely on a lower timeframe (LTF) chart.
NOTE: This indicator is designed to show HTF data on an LTF chart.
If you select a timeframe in the settings that is lower than your
current chart's timeframe, it will show pivots for the chart's
timeframe instead.
Core Features:
- Up to five independent higher timeframes.
- Per-timeframe customization for pivot strength (left/right bars) and color.
- Optional "Watchlines" that project the price of each pivot forward,
complete with a text label identifying the timeframe.
- An optional "Alignment Model" that colors the background when price is
aligned across all active timeframes (requires at least 2 TFs to be enabled).
Default State:
For a clean initial application, the Watchlines and Alignment Model features
are disabled by default but can be enabled in the settings.

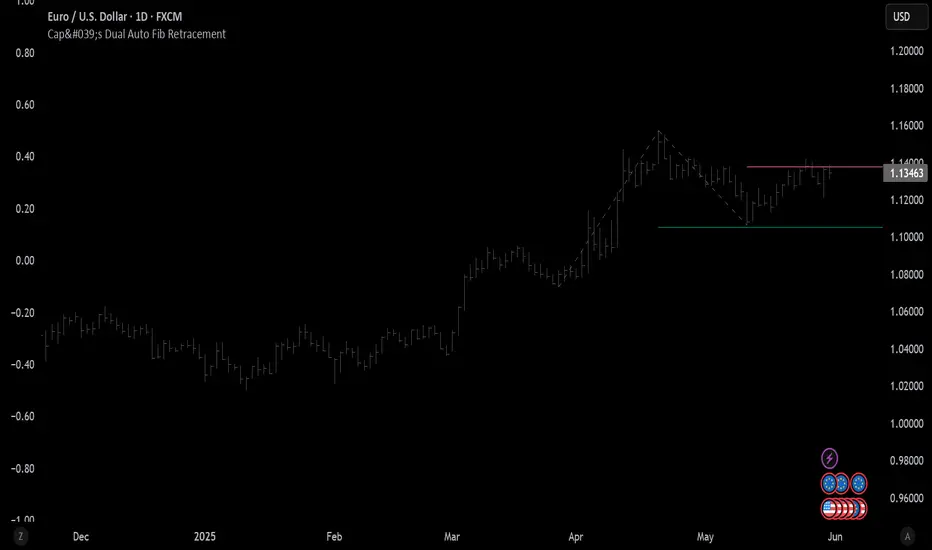
Cap's Dual Auto Fib RetracementThis will draw both a bullish retracement and a bearish retracement. It's defaulted to just show the 0.618 level as I feel like this is the "make or break" level.
- A close below the bullish 0.618 retracement would be considered very bearish.
- A close above the bearish 0.618 would be considered very bullish.
(You can still configure whichever levels you want, however.)
This script was removed by TradingView last time it was published. I couldn't find another script that would provide both bearish/bullish retracements, so I'm assuming this is "original" enough. Maybe it was removed because the description wasn't long enough, so...
Detailed Description:
This indicator automatically plots Fibonacci retracement levels based on zigzag pivot points for both bullish (low-to-high) and bearish (high-to-low) price movements. It identifies key pivot points using a customizable deviation multiplier and depth setting, then draws Fibonacci levels (0, 0.236, 0.382, 0.5, 0.618, 0.786, 1) with user-defined visibility and colors for each level.
Features:
Deviation: Adjusts sensitivity for detecting pivots (default: 2).
Depth: Sets minimum bars for pivot calculation (default: 10).
Extend Lines: Option to extend lines left, right, or both.
Show Prices/Levels: Toggle price and level labels, with options for value or percentage display.
Labels Position: Choose left or right label placement.
Background Transparency: Customize fill transparency between levels.
Alerts: Triggers when price crosses any Fibonacci level.
Usage: Apply to any chart to visualize potential support/resistance zones. Adjust settings to suit your trading style. Requires sufficient data; use lower timeframes or reduce depth if pivots are not detected.
Note: This is a technical analysis tool and does not provide trading signals or financial advice. Always conduct your own research.
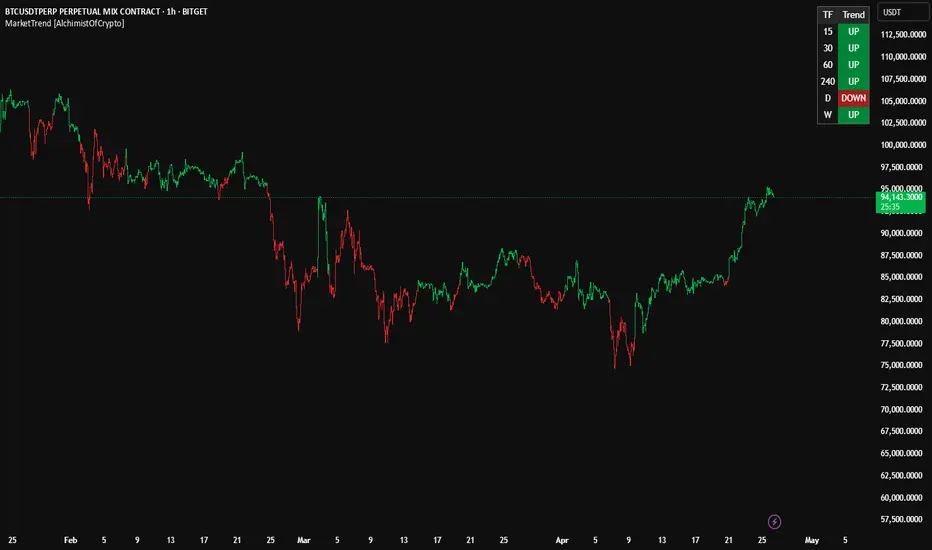
MarketTrend [AlchimistOfCrypto]🌌 MarketTrend – Unveil the Cosmic Harmony of Markets 🌌
"What we call 'trend' is merely an illusion of our limited perception of the space-time continuum of markets. Pivots are points of singularity where potential energy ⚡️ transforms into kinetic energy 🚀. The fourth dimension isn’t just time—it’s the simultaneous awareness of all temporal states. By observing mathematical laws across time scales, we unlock the secrets of the cosmic harmony of markets."
📊 Technical Overview
MarketTrend is a multi-timeframe trend analysis powerhouse 🔥 that tracks market direction across six timeframes simultaneously. It pinpoints pivot points 📍 to classify trends as bullish 🐂, bearish 🐻, or neutral ⚖️, presenting results in a sleek, easy-to-read table.
⚙️ How It Works
- The algorithm scans for pivot highs and pivot lows using a 20-bar lookback period 🔍.
- Bullish Trend 🟢: Price breaks above a previous pivot high.
- Bearish Trend 🔴: Price drops below a previous pivot low.
- Neutral Zone 🟡: Price consolidates until a breakout sparks a new trend.
🚀 How to Use This Indicator
1. Master Multi-Timeframe Analysis 🌍: Spot trend alignment across timeframes for a holistic view.
2. Seek Confluence ✅: Stronger signals emerge when multiple timeframes align.
3. Time Your Entries ⏰: Enter trades when shorter timeframes sync with larger ones for maximum precision.
4. Manage Risk 🛡️: Avoid countertrend trades when timeframes show unified direction.
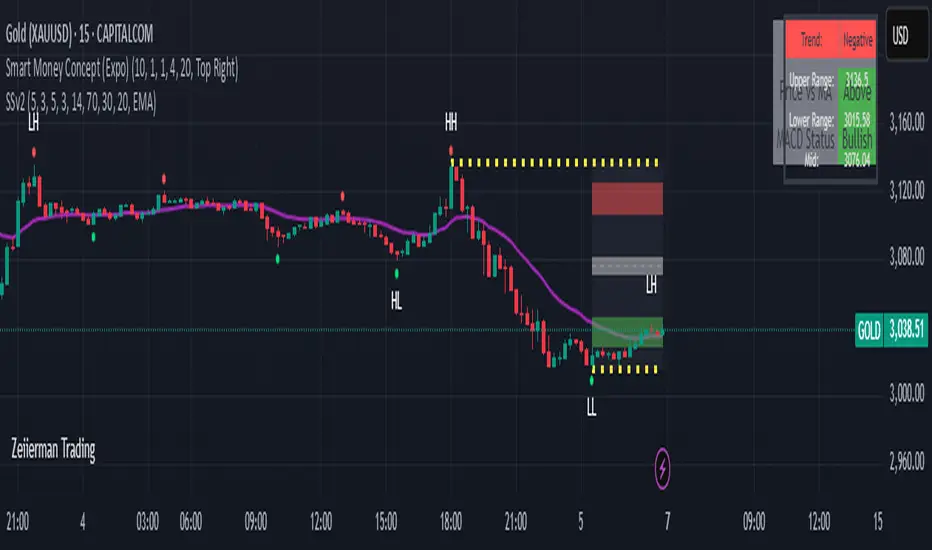
Sahid Strategy v2This script identifies potential buy/sell signals using:
Pivot Points - Detects swing highs/lows (price reversals)
Confirmation Filters - Reduces false signals using:
RSI (momentum)
Moving Average (trend direction)
Optional MACD (trend confirmation)
Key Features
Signal Type Trigger Conditions
BUY - Price makes a swing low (pivot)
Copy
- RSI ≤ 30 (oversold)
- Price above trend MA
- MACD bullish (optional) |
| SELL | - Price makes a swing high (pivot)
- RSI ≥ 70 (overbought)
- Price below trend MA
- MACD bearish (optional) |
Visual Signals
Green "BUY" labels below price bars
Red "SELL" labels above price bars
Purple trend line (20-period EMA/SMA)
Orange/blue circles showing raw pivot points
Optional Tools
Debug Table (top-right): Shows real-time:
RSI value
Price vs MA position
MACD status
Alerts - Triggers audible/visual notifications
Customization
Adjust in settings:
Pivot sensitivity (left/right bars)
RSI levels (30/70 by default)
MA type/length (20-period EMA/SMA)
Toggle MACD filter on/off
Best For: Swing trading in trending markets (1H-4H timeframes). Signals appear faster than classic pivot strategies but still require confirmation from other analysis tools.
Rally Base Drop SND Pivots Strategy [LuxAlgo X PineIndicators]This strategy is based on the Rally Base Drop (RBD) SND Pivots indicator developed by LuxAlgo. Full credit for the concept and original indicator goes to LuxAlgo.
The Rally Base Drop SND Pivots Strategy is a non-repainting supply and demand trading system that detects pivot points based on Rally, Base, and Drop (RBD) candles. This strategy automatically identifies key market structure levels, allowing traders to:
Identify pivot-based supply and demand (SND) zones.
Use fixed criteria for trend continuation or reversals.
Filter out market noise by requiring structured price formations.
Enter trades based on breakouts of key SND pivot levels.
How the Rally Base Drop SND Pivots Strategy Works
1. Pivot Point Detection Using RBD Candles
The strategy follows a rigid market structure methodology, where pivots are detected only when:
A Rally (R) consists of multiple consecutive bullish candles.
A Drop (D) consists of multiple consecutive bearish candles.
A Base (B) is identified as a transition between Rallies and Drops, acting as a pivot point.
The pivot level is confirmed when the formation is complete.
Unlike traditional fractal-based pivots, RBD Pivots enforce stricter structural rules, ensuring that each pivot:
Has a well-defined bullish or bearish price movement.
Reduces false signals caused by single-bar fluctuations.
Provides clear supply and demand levels based on structured price movements.
These pivot levels are drawn on the chart using color-coded boxes:
Green zones represent bullish pivot levels (Rally Base formations).
Red zones represent bearish pivot levels (Drop Base formations).
Once a pivot is confirmed, the high or low of the base candle is used as the reference level for future trades.
2. Trade Entry Conditions
The strategy allows traders to select from three trading modes:
Long Only – Only takes long trades when bullish pivot breakouts occur.
Short Only – Only takes short trades when bearish pivot breakouts occur.
Long & Short – Trades in both directions based on pivot breakouts.
Trade entry signals are triggered when price breaks through a confirmed pivot level:
Long Entry:
A bullish pivot level is formed.
Price breaks above the bullish pivot level.
The strategy enters a long position.
Short Entry:
A bearish pivot level is formed.
Price breaks below the bearish pivot level.
The strategy enters a short position.
The strategy includes an optional mode to reverse long and short conditions, allowing traders to experiment with contrarian entries.
3. Exit Conditions Using ATR-Based Risk Management
This strategy uses the Average True Range (ATR) to calculate dynamic stop-loss and take-profit levels:
Stop-Loss (SL): Placed 1 ATR below entry for long trades and 1 ATR above entry for short trades.
Take-Profit (TP): Set using a Risk-Reward Ratio (RR) multiplier (default = 6x ATR).
When a trade is opened:
The entry price is recorded.
ATR is calculated at the time of entry to determine stop-loss and take-profit levels.
Trades exit automatically when either SL or TP is reached.
If reverse conditions mode is enabled, stop-loss and take-profit placements are flipped.
Visualization & Dynamic Support/Resistance Levels
1. Pivot Boxes for Market Structure
Each pivot is marked with a colored box:
Green boxes indicate bullish demand zones.
Red boxes indicate bearish supply zones.
These boxes remain on the chart to act as dynamic support and resistance levels, helping traders identify key price reaction zones.
2. Horizontal Entry, Stop-Loss, and Take-Profit Lines
When a trade is active, the strategy plots:
White line → Entry price.
Red line → Stop-loss level.
Green line → Take-profit level.
Labels display the exact entry, SL, and TP values, updating dynamically as price moves.
Customization Options
This strategy offers multiple adjustable settings to optimize performance for different market conditions:
Trade Mode Selection → Choose between Long Only, Short Only, or Long & Short.
Pivot Length → Defines the number of required Rally & Drop candles for a pivot.
ATR Exit Multiplier → Adjusts stop-loss distance based on ATR.
Risk-Reward Ratio (RR) → Modifies take-profit level relative to risk.
Historical Lookback → Limits how far back pivot zones are displayed.
Color Settings → Customize pivot box colors for bullish and bearish setups.
Considerations & Limitations
Pivot Breakouts Do Not Guarantee Reversals. Some pivot breaks may lead to continuation moves instead of trend reversals.
Not Optimized for Low Volatility Conditions. This strategy works best in trending markets with strong momentum.
ATR-Based Stop-Loss & Take-Profit May Require Optimization. Different assets may require different ATR multipliers and RR settings.
Market Noise May Still Influence Pivots. While this method filters some noise, fake breakouts can still occur.
Conclusion
The Rally Base Drop SND Pivots Strategy is a non-repainting supply and demand system that combines:
Pivot-based market structure analysis (using Rally, Base, and Drop candles).
Breakout-based trade entries at confirmed SND levels.
ATR-based dynamic risk management for stop-loss and take-profit calculation.
This strategy helps traders:
Identify high-probability supply and demand levels.
Trade based on structured market pivots.
Use a systematic approach to price action analysis.
Automatically manage risk with ATR-based exits.
The strict pivot detection rules and built-in breakout validation make this strategy ideal for traders looking to:
Trade based on market structure.
Use defined support & resistance levels.
Reduce noise compared to traditional fractals.
Implement a structured supply & demand trading model.
This strategy is fully customizable, allowing traders to adjust parameters to fit their market and trading style.
Full credit for the original concept and indicator goes to LuxAlgo.

Trendchange Zones Indicator | iSolani
Spotting Reversals Before They Happen: The iSolani Trendshift System
Where RSI Meets Smart Volume Analysis - Your Visual Guide to Market Turns
Core Methodology
RSI-Powered Zones
Identifies critical levels using:
14-period RSI (default) with 70/30 thresholds
Semi-transparent boxes marking overbought (red) and oversold (green) territories
Zone persistence until RSI returns to neutral range
Dynamic Level Tracking
Plots evolving support/resistance using:
Pivot highs/lows with 15-bar lookback (default)
Auto-extending lines that adapt to new price extremes
Volume-Confirmed Breakouts
Flags significant moves with:
5/10 EMA volume oscillator
20% volume threshold (default) for confirmation
Technical Innovation
Three-Layer Confirmation
Unique combination of:
Classic RSI extremes
Price structure through pivot points
Volume-fueled momentum shifts
Adaptive Visualization
Zones maintain historical context at 33% transparency
Dynamic lines extend indefinitely until invalidated
Discreet labels for breakout events
System Workflow
Calculates RSI values in real-time
Draws colored zones when RSI crosses 70/30
Marks pivot points every 15 bars (default)
Updates support/resistance lines on new pivots
Triggers alerts when price breaks levels with volume confirmation
Standard Configuration
RSI Settings : 14-period length
Pivot Detection : 15-bar left/right lookback
Visuals : 33% transparency zones with thin borders
Volume Threshold : 20% oscillator difference
Alerts : Breakout signals with "B" labels
This system transforms the classic RSI into a spatial analysis tool - not just showing when markets are overextended, but where they're likely to reverse. The dynamic lines act as moving barriers that adapt to market structure, while the volume filter ensures only high-conviction breaks get flagged. By layering momentum, price action, and volume dynamics, it creates a multi-spectrum view of potential trend changes.

Smart Money Breakout Signals [AlgoAlpha]Introducing the Smart Money Breakout Signals, a cutting-edge trading indicator designed to identify key structural shifts and breakout opportunities in the market. This tool leverages a blend of smart money concepts like Break of Structure (BOS) and Change of Character (CHoCH) to provide traders with actionable insights into market direction and potential entry or exit points.
Key Features :
✨ Market Structure Analysis : Automatically detects and labels BOS and CHoCH for trend confirmation and reversals.
🎨 Customizable Visualization : Tailor bullish and bearish colors for breakout lines and signals to suit your preferences.
📊 Dynamic Take-Profit Targets : Displays three tiered take-profit levels based on breakout volatility.
🔔 Real-Time Alerts : Stay ahead of the game with notifications for bullish and bearish breakouts.
📋 Performance Dashboard : Monitor signal statistics, including win rates and total signals, directly on your chart.
How to Use :
Add the Indicator : Add the script to your favourites ⭐ and customize settings like market structure horizon and confirmation type.
Monitor Breakouts : Observe BOS and CHoCH labels to identify potential trend shifts. Use the breakout lines and tiered take-profit levels to plan trades effectively.
Set Alerts : Enable alerts for bullish or bearish breakouts to act on opportunities without constant monitoring.
How It Works :
The indicator identifies market structure by analyzing pivot highs and lows over a user-defined time horizon. A breakout is confirmed based on either candle closes or wicks surpassing previous pivot points. Upon detection, the script generates signals with breakout lines and calculates take-profit targets based on the distance from the breakout level. A built-in dashboard tracks performance metrics like total signals and win rates, giving traders real-time feedback on strategy effectiveness.

OBV TSI IndicatorThe OBV TSI Indicator combines two powerful technical analysis tools: the On-Balance Volume (OBV) and the True Strength Index (TSI). This hybrid approach provides insights into both volume dynamics and momentum, helping traders identify potential trend reversals, breakouts, or continuations with greater accuracy.
The OBV TSI Indicator tracks cumulative volume shifts via OBV and integrates the TSI for momentum analysis. It offers customizable moving average options for further smoothing. Visual trendlines, pivot points, and signal markers enhance clarity.
The OBV tracks volume flow by summing volumes based on price changes. Positive volume is added when prices rise, and negative volume is subtracted when prices fall. The result is smoothed to detect meaningful trends in volume. A volume spread is derived from the difference between the smoothed OBV and cumulative volume. This is then adjusted by the price deviation to generate the shadow spread, which highlights critical volume-driven price levels.
The shadow spread is added to either the high or low price, depending on its sign, producing a refined OBV output. This serves as the main source for the subsequent TSI calculation. The TSI is a momentum oscillator calculated using double-smoothed price changes. It provides an accurate measure of trend strength and direction.
Various moving average options, such as EMA, DEMA, or TEMA, are applied to the smoothed OBV for additional trend filtering. Users can select their preferred type and length to suit their trading strategy. Trendlines are plotted to visualize the overall direction. When a significant change in trend is detected, up or down arrows indicate potential buy or sell signals. The script identifies key pivot points based on the highest and lowest levels within a defined period. These pivots help pinpoint reversal zones.
The indicator offers customization options, allowing users to adjust the OBV length for smoothing, choose from various moving average types, and fine-tune the short, long, and signal periods for TSI. Additionally, users can toggle visibility for trendlines, signals, and pivots to suit their preferences.
This indicator is ideal for practical use cases such as spotting potential trend reversals by observing TSI crossovers and pivot levels, anticipating breakouts from key price levels using the shadow spread, and validating trends by aligning TSI signals with OBV and moving averages.
The OBV TSI Indicator is a versatile tool designed to enhance decision-making in trading by combining volume and momentum analysis. Its flexibility and visual aids make it suitable for traders of all experience levels. By leveraging its insights, you can confidently navigate market trends and improve your trading outcomes.

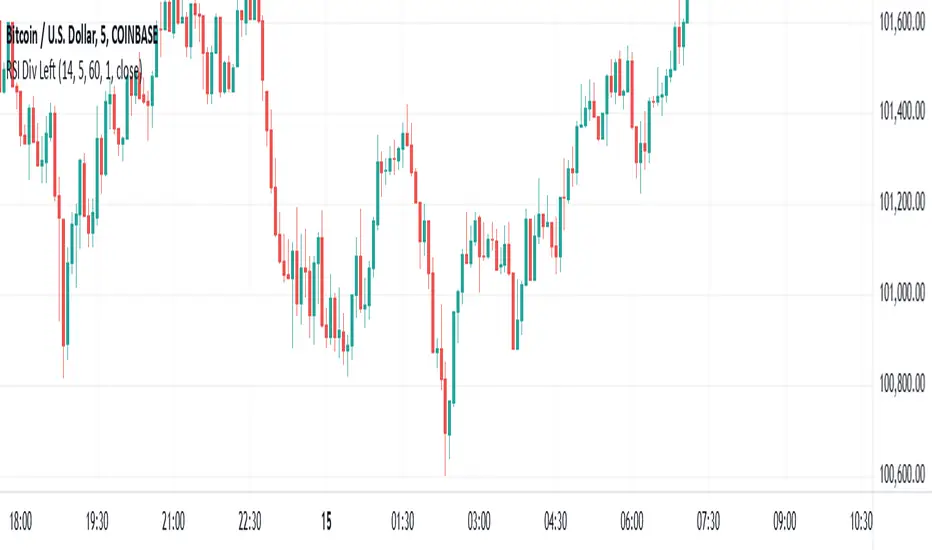
RSI Divergence - Left Candles Onlyrsi
The **RSI Divergence** indicator in this script is designed to highlight **divergence** between the **Relative Strength Index (RSI)** and **price action** on a chart. Divergence can be a key signal for potential trend reversals or continuation in technical analysis.
### **Key Components of the Indicator:**
1. **RSI Calculation:**
- The **Relative Strength Index (RSI)** is calculated using a typical 14-period length, but the user can customize this input.
- RSI is a momentum oscillator that measures the speed and change of price movements, oscillating between 0 and 100. Values above 70 indicate overbought conditions, and values below 30 indicate oversold conditions.
2. **Divergence Logic:**
- **Bullish Divergence:** Occurs when the price forms a **lower low**, but the RSI forms a **higher low**. This suggests that despite price continuing to drop, momentum (RSI) is strengthening, which may indicate a potential price reversal to the upside.
- **Bearish Divergence:** Occurs when the price forms a **higher high**, but the RSI forms a **lower high**. This indicates that even though price is rising, the momentum (RSI) is weakening, which could signal a price reversal to the downside.
3. **Pivot Identification:**
- The script identifies **pivot points** (local highs and lows) on both price and RSI.
- **Bullish Divergence:** A lower price low with a higher RSI low.
- **Bearish Divergence:** A higher price high with a lower RSI high.
4. **Lookback Periods:**
- **Lookback Left (lookbackLeft):** Defines the number of bars to look back for pivot confirmation. This allows for adjusting the sensitivity of the divergence.
- The **divergence range** is constrained by two parameters:
- **Minimum range (rangeLower):** The minimum number of bars for divergence to be considered.
- **Maximum range (rangeUpper):** The maximum number of bars for divergence to be considered.
5. **Signal Generation and Plotting:**
- When a **bullish divergence** is detected, a **green label** is plotted below the bar where the divergence occurs.
- When a **bearish divergence** is detected, a **red label** is plotted above the bar.
- The script uses **`plotshape()`** to plot these labels on the chart.
6. **Alerts:**
- Alerts are configured for both **bullish** and **bearish divergences** so that you can be notified when a divergence signal occurs.
---
### **How the Indicator Works:**
- The RSI and price action are compared using **pivots**: The script checks whether the price and RSI are forming new highs or lows within the specified **lookback period**.
- If the conditions for divergence (higher/lower RSI pivot vs price pivot) are met, a signal is plotted on the chart.
- The script helps to visually identify potential reversal points and allows users to set alerts for these divergence signals.
---
### **Use Case:**
- This script is useful for traders looking to trade potential trend reversals based on **divergence** between price and RSI.
- **Bullish divergence** can indicate a **buy** opportunity, while **bearish divergence** can suggest a **sell** opportunity.
- The indicator works best in **volatile markets** and when combined with other technical analysis tools for confirmatio
RSI BandsOverview
The RSI Bands indicator is a tool designed to calculate and display overbought, oversold, and middle bands based on the Relative Strength Index (RSI).
Its primary purpose is to provide traders with a clue on whether to place limit buy or limit sell orders, or to set stop-loss orders effectively. The bands represent the price levels the asset must reach for the RSI to align with specific thresholds:
Overbought Band: Displays the upper band representing the price level the asset must reach for the RSI to become overbought.
Oversold Band: Displays the lower band representing the price level the asset must reach for the RSI to become oversold.
Middle Band: Displays the middle band representing the price level the asset must reach for the RSI to hit the middle level. It uses both traditional RSI calculations and a dynamic period adjustment mechanism for improved adaptability to market conditions. The script also offers smoothing options for the bands.
Features
Calculates overbought, oversold, and middle bands using RSI values.
Dynamically adjusts the RSI period based on pivot points if enabled.
Offers smoothing options for the bands: EMA, SMA, or None.
Customizable input parameters for flexibility.
Inputs
Source Value: Selects the data source (e.g., close price) for RSI calculation.
Period: Sets the static RSI calculation period. Used if dynamic period is disabled.
Use Dynamic Period?: Toggles the use of a dynamic RSI period.
Pivot Left/Right Length: Determines the range of bars for pivot detection when using dynamic periods.
Dynamic Period Multiplier: Scales the dynamically calculated RSI period.
Overbought Level: RSI level that marks the overbought threshold.
Oversold Level: RSI level that marks the oversold threshold.
Middle Level: RSI level used as a midpoint reference.
Smoothing Type: Specifies the smoothing method for the bands (EMA, SMA, or None).
Smoothing Length: Length used for the selected smoothing method.
Key Calculations
RSI Calculation:
Computes RSI using gains and losses over the specified period (dynamic or static).
Incorporates a custom function for calculating RSI with dynamic periods.
Dynamic Period Adjustment:
Uses pivot points to determine an adaptive RSI period.
Multiplies the base dynamic period by the Dynamic Period Multiplier.
Band Calculation:
Calculates price changes (deltas) required to achieve the overbought, oversold, and middle RSI levels.
The price changes (deltas) are determined using an iterative approximation technique. For each target RSI level (overbought, oversold, or middle), the script estimates the required change in price by adjusting a hypothetical delta value until the calculated RSI aligns with the target RSI. This approximation ensures precise calculation of the price levels necessary for the RSI to reach the specified thresholds.
Computes the upper (overbought), lower (oversold), and middle bands by adding these deltas to the source price.
Smoothing:
Applies the selected smoothing method (EMA or SMA) to the calculated bands.
Plots
Overbought Band: Displays the upper band representing the price level the asset must reach for the RSI to become overbought.
Oversold Band: Displays the lower band representing the price level the asset must reach for the RSI to become oversold.
Middle Band: Displays the middle band representing the price level the asset must reach for the RSI to hit the middle level.
Usage
Choose the source value (e.g., close price).
Select whether to use a dynamic RSI period or a static one.
Adjust pivot lengths and multipliers for dynamic period calculation as needed.
Set the overbought, oversold, and middle RSI levels based on your analysis.
Configure smoothing options for the bands.
Observe the plotted bands and use them to identify potential overbought and oversold market conditions.

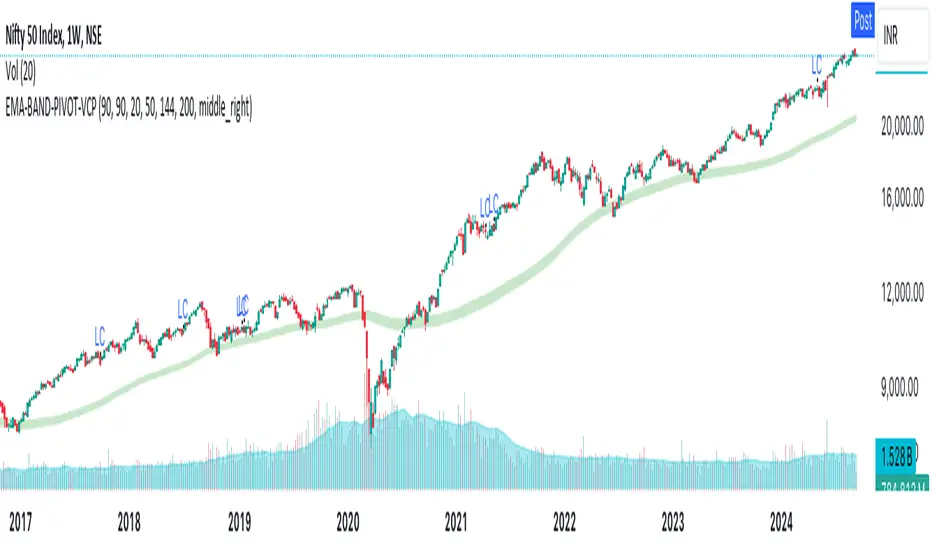
EMA-BAND-PIVOT-VCPThis indicator is named "EMA-BAND-PIVOT-VCP" and integrates multiple elements such as moving averages, volume, volatility contraction patterns (VCP), pivot points, and a table to display key market metrics.
Key Features:
Moving Averages: ( 4 - EMA) default settings 20 , 50 ,144 , 200 . Can be changed in settings.
Pivot Highs and Lows:
The script detects pivot highs and pivot lows using customizable left and right lengths and plots labels to mark these points on the chart.
TIG BAND : This is setting of 2 sma - with the high and low of 90 day average which forms like a band . Its a very strong indicator of trend . Buying is suggestable above this .This has to be tested on your own to knowhow it works wonders ( price magnet). Works on all timeframes . (credit : Bhushan Sir from TIG ) .These are the best buy areas.
Volatility Contraction :
It identifies specific price contraction pattern .
vc marked - used 4 candles - first candle is the mother bar ., 2,3 and 4th candles complete range ( high to low ) is within the range of mother candle.
lc marked -here the closing is considered not the wicks. used 8 candles., the 7 candles closing is within the range of motherbar. Crosses are plotted on the last candle
Table Display:
A table is displayed on the chart with data such as EMA values, relative volume (RVol), Average Daily Range (ADR), and volume ratios. This gives a comprehensive overview of current market conditions.(RVol) compared to the 50-period volume SMA, percentage volume change, and other metrics is also displayed.
Liquidity Sweeps [UAlgo]
🔶 Description:
This script, "Liquidity Sweeps by UAlgo" aims to identify and visualize potential liquidity sweeps in the market, assisting traders in spotting significant price levels where liquidity may be targeted by large orders. The script highlights pivot points and draws support and resistance lines based on user-defined parameters. When a liquidity sweep occurs, the script dynamically adjusts the displayed lines and provides annotations, signaling potential buying or selling opportunities.
🔶 Key Features:
Pivot Analysis: Utilizes pivot points to identify potential support and resistance levels.
Liquidity Sweep Detection: Dynamically adjusts support and resistance lines based on price action, highlighting liquidity sweep events.
Buy Side Liquidity Sweep Example :
Sell Side Liquidity Sweep Example :
Liquidity areas waiting to be swept are shown as "pivot high" in red and "pivot low" in green.
Customizable Parameters: Allows users to adjust parameters such as pivot length, maximum lines to draw, colors, and line width to suit their trading preferences.
Real-time Annotations: Provides real-time annotations on the chart when liquidity sweep events are detected, aiding traders in decision-making.
Disclaimer:
This script is provided for educational and informational purposes only. Trading involves risks, and it is essential to conduct thorough research and exercise caution when making financial decisions. The author does not guarantee the accuracy or completeness of the information provided by this script, and any actions taken based on this information are at the user's own risk.

Equal Highs & Lows [UAlgo]
🔶 Description:
The "Equal Highs/Lows " indicator is designed to identify equal highs and lows within price action. These levels are significant as they often indicate potential reversal points or areas of consolidation in the market. The indicator is based on specific settings and utilizes the concept of Average True Range (ATR) to determine thresholds for identifying these key price levels.
The indicator plots lines and labels to mark equal highs and lows on the price chart.
It dynamically adjusts to changes in market volatility by utilizing ATR-based thresholds.
🔶 Settings:
Pivot Length: Determines the number of bars used to identify pivot highs and lows.
ATR Length to calculate threshold: Specifies the length of the ATR used to calculate the threshold for determining equal highs and lows.
Threshold: Sets the percentage threshold used in conjunction with ATR to identify equal highs and lows.
Wait For Confirmation: When enabled, the indicator waits for confirmation by considering pivots beyond (considers right length bars while calcuation pivot points) the specified length.
While "Wait For Confirmation" is enabled, EQH / EQL Lines will appear after "Pivot Length" after for confirmation
While "Wait For Confirmation" is disabled, EQH / EQL Lines will appear immediately if it meets the requirements to create EQH or EQL as soon as the candle closes.
🔶 Disclaimer:
"Equal Highs/Lows " is provided for informational and educational purposes only. Trading involves risks, and users should exercise caution and perform their own analysis before making any trading decisions based on this indicator. The creator of the indicator, UAlgo, does not guarantee the accuracy or reliability of the indicator, and usage of this indicator is at the user's own risk.

ZigzagLiteLibrary "ZigzagLite"
Lighter version of the Zigzag Library. Without indicators and sub-component divisions
method getPrices(pivots)
Gets the array of prices from array of Pivots
Namespace types: Pivot
Parameters:
pivots (Pivot ) : array array of Pivot objects
Returns: array array of pivot prices
method getBars(pivots)
Gets the array of bars from array of Pivots
Namespace types: Pivot
Parameters:
pivots (Pivot ) : array array of Pivot objects
Returns: array array of pivot bar indices
method getPoints(pivots)
Gets the array of chart.point from array of Pivots
Namespace types: Pivot
Parameters:
pivots (Pivot ) : array array of Pivot objects
Returns: array array of pivot points
method getPoints(this)
Namespace types: Zigzag
Parameters:
this (Zigzag)
method calculate(this, ohlc, ltfHighTime, ltfLowTime)
Calculate zigzag based on input values and indicator values
Namespace types: Zigzag
Parameters:
this (Zigzag) : Zigzag object
ohlc (float ) : Array containing OHLC values. Can also have custom values for which zigzag to be calculated
ltfHighTime (int) : Used for multi timeframe zigzags when called within request.security. Default value is current timeframe open time.
ltfLowTime (int) : Used for multi timeframe zigzags when called within request.security. Default value is current timeframe open time.
Returns: current Zigzag object
method calculate(this)
Calculate zigzag based on properties embedded within Zigzag object
Namespace types: Zigzag
Parameters:
this (Zigzag) : Zigzag object
Returns: current Zigzag object
method nextlevel(this)
Namespace types: Zigzag
Parameters:
this (Zigzag)
method clear(this)
Clears zigzag drawings array
Namespace types: ZigzagDrawing
Parameters:
this (ZigzagDrawing ) : array
Returns: void
method clear(this)
Clears zigzag drawings array
Namespace types: ZigzagDrawingPL
Parameters:
this (ZigzagDrawingPL ) : array
Returns: void
method drawplain(this)
draws fresh zigzag based on properties embedded in ZigzagDrawing object without trying to calculate
Namespace types: ZigzagDrawing
Parameters:
this (ZigzagDrawing) : ZigzagDrawing object
Returns: ZigzagDrawing object
method drawplain(this)
draws fresh zigzag based on properties embedded in ZigzagDrawingPL object without trying to calculate
Namespace types: ZigzagDrawingPL
Parameters:
this (ZigzagDrawingPL) : ZigzagDrawingPL object
Returns: ZigzagDrawingPL object
method drawfresh(this, ohlc)
draws fresh zigzag based on properties embedded in ZigzagDrawing object
Namespace types: ZigzagDrawing
Parameters:
this (ZigzagDrawing) : ZigzagDrawing object
ohlc (float ) : values on which the zigzag needs to be calculated and drawn. If not set will use regular OHLC
Returns: ZigzagDrawing object
method drawcontinuous(this, ohlc)
draws zigzag based on the zigzagmatrix input
Namespace types: ZigzagDrawing
Parameters:
this (ZigzagDrawing) : ZigzagDrawing object
ohlc (float ) : values on which the zigzag needs to be calculated and drawn. If not set will use regular OHLC
Returns:
PivotCandle
PivotCandle represents data of the candle which forms either pivot High or pivot low or both
Fields:
_high (series float) : High price of candle forming the pivot
_low (series float) : Low price of candle forming the pivot
length (series int) : Pivot length
pHighBar (series int) : represents number of bar back the pivot High occurred.
pLowBar (series int) : represents number of bar back the pivot Low occurred.
pHigh (series float) : Pivot High Price
pLow (series float) : Pivot Low Price
Pivot
Pivot refers to zigzag pivot. Each pivot can contain various data
Fields:
point (chart.point) : pivot point coordinates
dir (series int) : direction of the pivot. Valid values are 1, -1, 2, -2
level (series int) : is used for multi level zigzags. For single level, it will always be 0
ratio (series float) : Price Ratio based on previous two pivots
sizeRatio (series float)
ZigzagFlags
Flags required for drawing zigzag. Only used internally in zigzag calculation. Should not set the values explicitly
Fields:
newPivot (series bool) : true if the calculation resulted in new pivot
doublePivot (series bool) : true if the calculation resulted in two pivots on same bar
updateLastPivot (series bool) : true if new pivot calculated replaces the old one.
Zigzag
Zigzag object which contains whole zigzag calculation parameters and pivots
Fields:
length (series int) : Zigzag length. Default value is 5
numberOfPivots (series int) : max number of pivots to hold in the calculation. Default value is 20
offset (series int) : Bar offset to be considered for calculation of zigzag. Default is 0 - which means calculation is done based on the latest bar.
level (series int) : Zigzag calculation level - used in multi level recursive zigzags
zigzagPivots (Pivot ) : array which holds the last n pivots calculated.
flags (ZigzagFlags) : ZigzagFlags object which is required for continuous drawing of zigzag lines.
ZigzagObject
Zigzag Drawing Object
Fields:
zigzagLine (series line) : Line joining two pivots
zigzagLabel (series label) : Label which can be used for drawing the values, ratios, directions etc.
ZigzagProperties
Object which holds properties of zigzag drawing. To be used along with ZigzagDrawing
Fields:
lineColor (series color) : Zigzag line color. Default is color.blue
lineWidth (series int) : Zigzag line width. Default is 1
lineStyle (series string) : Zigzag line style. Default is line.style_solid.
showLabel (series bool) : If set, the drawing will show labels on each pivot. Default is false
textColor (series color) : Text color of the labels. Only applicable if showLabel is set to true.
maxObjects (series int) : Max number of zigzag lines to display. Default is 300
xloc (series string) : Time/Bar reference to be used for zigzag drawing. Default is Time - xloc.bar_time.
curved (series bool) : Boolean field to print curved zigzag - used only with polyline implementation
ZigzagDrawing
Object which holds complete zigzag drawing objects and properties.
Fields:
zigzag (Zigzag) : Zigzag object which holds the calculations.
properties (ZigzagProperties) : ZigzagProperties object which is used for setting the display styles of zigzag
drawings (ZigzagObject ) : array which contains lines and labels of zigzag drawing.
ZigzagDrawingPL
Object which holds complete zigzag drawing objects and properties - polyline version
Fields:
zigzag (Zigzag) : Zigzag object which holds the calculations.
properties (ZigzagProperties) : ZigzagProperties object which is used for setting the display styles of zigzag
zigzagLabels (label )
zigzagLine (series polyline) : polyline object of zigzag lines

lib_pivotLibrary "lib_pivot"
Object oriented implementation of Pivot methods.
method tostring(this)
Converts HLData to a json string representation
Namespace types: HLData
Parameters:
this (HLData) : HLData
Returns: string representation of Pivot
method tostring(this, date_format)
Namespace types: Pivot
Parameters:
this (Pivot)
date_format (simple string)
method tostring(this, date_format)
Namespace types: Pivot
Parameters:
this (Pivot )
date_format (simple string)
method get_color(this, mode)
Namespace types: PivotColors
Parameters:
this (PivotColors)
mode (int)
method get_label_text(this)
Namespace types: Pivot
Parameters:
this (Pivot)
method direction(this)
Namespace types: Pivot
Parameters:
this (Pivot)
method same_direction_as(this, other)
Namespace types: Pivot
Parameters:
this (Pivot)
other (Pivot)
method exceeds(this, price)
Namespace types: Pivot
Parameters:
this (Pivot)
price (float)
method exceeds(this, other)
Namespace types: Pivot
Parameters:
this (Pivot)
other (Pivot)
method exceeded_by(this, price)
Namespace types: Pivot
Parameters:
this (Pivot)
price (float)
method exceeded_by(this, other)
Namespace types: Pivot
Parameters:
this (Pivot)
other (Pivot)
method retracement_ratio(this, lastPivot, sec_lastPivot)
Namespace types: Pivot
Parameters:
this (Pivot)
lastPivot (Pivot)
sec_lastPivot (Pivot)
ratio_target(sec_lastPivot, lastPivot, target_ratio)
Parameters:
sec_lastPivot (Pivot)
lastPivot (Pivot)
target_ratio (float)
method update(this, ref_highest, ref_lowest)
Namespace types: HLData
Parameters:
this (HLData)
ref_highest (float)
ref_lowest (float)
method update(this, bar_time, bar_idx, price, prev)
Namespace types: Pivot
Parameters:
this (Pivot)
bar_time (int)
bar_idx (int)
price (float)
prev (Pivot)
method create_next(this, bar_time, bar_idx, price)
Namespace types: Pivot
Parameters:
this (Pivot)
bar_time (int)
bar_idx (int)
price (float)
HLData
HLData wraps the data received from ta.highest, ta.highestbars, ta.lowest, ta.lowestbars, as well as the reference sources
Fields:
length (series int) : lookback length for pivot points
highest_offset (series int) : offset to highest value bar
lowest_offset (series int) : offset to lowest value bar
highest (series float) : highest value within lookback bars
lowest (series float) : lowest value within lookback bars
new_highest (series bool) : update() will set this true if the current candle forms a new highest high at the last (current) bar of set period (length)
new_lowest (series bool) : update() will set this true if the current candle forms a new lowest low at the last (current) bar of set period (length)
new_highest_fractal (series bool) : update() will set this true if the current candle forms a new fractal high at the center of set period (length)
new_lowest_fractal (series bool) : update() will set this true if the current candle forms a new fractal low at the center of set period (length)
PivotColors
Pivot colors for different modes
Fields:
hh (series color) : Color for Pivot mode 2 (HH)
lh (series color) : Color for Pivot mode 1 (LH)
hl (series color) : Color for Pivot mode -1 (HL)
ll (series color) : Color for Pivot mode -2 (LL)
Pivot
Pivot additional pivot data around basic Point
Fields:
point (Point type from robbatt/lib_plot_objects/5)
mode (series int) : can be -2/-1/1/2 for LL/HL/LH/HH
price_movement (series float) : The price difference between this and the previous pivot point in the opposite direction
retracement_ratio (series float) : The ratio between this price_movement and the previous
prev (Pivot)

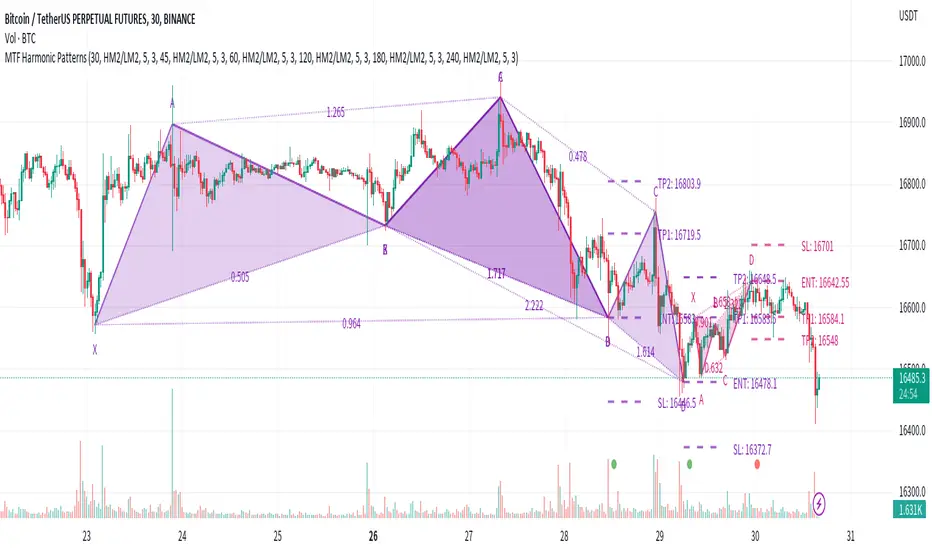
Multi-timeframe Harmonic PatternsHello friends. In recent months I have been busy with my academic research and haven't had much time to publish new scripts. To fill the gap of these months, I decided to publish the indicator Multi-timeframe Harmonic Patterns . Harmonic technical chart patterns can predict the next price trend and provide traders with clues to the price direction, which is one of the indicators widely used by professional traders.
(1) Indicator description
This indicator is built on ZigZag Multi Time Frame with Fibonacci Retracement@LonesomeTheBlue . Thanks to LonesomeTheBlue for contributing the awesome indicator
The indicator supports 6 different timeframes , and 25 different harmonic patterns
This indicator supports indicating key indicator prices: entry price, stop loss price, and two take profit prices
(2) Key parameters
timeframe resolution: The timeframe of the harmonic pattern
pivot high/low source: Calculation method of high/low pivot points
timeframe pivot period: Minimum period of high/low pivot points
delay for confirmations: Wait for N candles to confirm the chart pattern
bullish/bearish colors: Bullish/bearish pattern colors
enable harmonic patterns: Enable current harmonic patterns
show harmonic patterns: Show harmonic patterns found
show trading prices of patterns: Show key prices of harmonic patterns
(3) Supported Patterns:
Gartlay
Cypher
Bat
Deepcrab
Crab
Butterfly
Shark
0-5
AB=CD
3-Drives
Anti-Gartlay
Anti-Cypher
Anti-Bat
Anti-Crab
Anti-Butterfly
Anti-Shark
Black-Swan
White-Swan
Descending-Triangle
Ascending-Triangle
Symmetrical-Triangle
Headers&Shoulders
Inverse-Headers&Shoulders
Double-Top
Double-Bottom
————————————————————————————————————————
各位朋友大家好。最近几个月我忙于自己的学术研究没有过多时间更新脚本。为弥补这几个月的空缺,我决定发布该 多时间周期的谐波指标 。谐波技术图表形态在一定程度上可以预测下一个价格走势,为交易者提供价格方向的线索,是广大专业交易人员广泛使用的指标之一。
(1) 指标说明
该指标建立于 ZigZag Multi Time Frame with Fibonacci Retracement@LonesomeTheBlue ,感谢LonesomeTheBlue贡献的出色指标
该指标支持 6种不同的时间周期 ,以及 25种不同的谐波形态
该指标支持指示关键的指标价格:入场价格、止损价格、以及两种止盈价格
(2) 关键参数
timeframe resolution: 谐波形态的时间周期
pivot high/low source: 高/低枢纽点的计算方式
timeframe pivot period: 高/低枢纽点的最小周期
delay for confirmations: 等待N个蜡烛以确认图表形态
bullish/bearish colors: 看涨/看跌的形态颜色
enable harmonic patterns: 使能当前的谐波形态
show harmonic patterns: 显示被发现的谐波形态
show trading prices of patterns: 显示谐波形态的关键价格
(3) 支持形态:
Gartlay
Cypher
Bat
Deepcrab
Crab
Butterfly
Shark
0-5
AB=CD
3-Drives
Anti-Gartlay
Anti-Cypher
Anti-Bat
Anti-Crab
Anti-Butterfly
Anti-Shark
Black-Swan
White-Swan
Descending-Triangle
Ascending-Triangle
Symmetrical-Triangle
Headers&Shoulders
Inverse-Headers&Shoulders
Double-Top
Double-Bottom
RSI ModifiedThe RSI is an excellent indicator for determining when equities are overbought/oversold. Though I believe there is a shortcoming in using the 70/30 levels since they are static and do not adjust for when an equity is trending. It stands to reason that in a downtrend, the overbought might be less than 70 and the oversold less than 30—Vice versa for a bull trend. Using the built-in function of pivots, I have attempted to create overbought/oversold lines that adjust with the trend. Leaving the 70/30 lines on the indicator also helps visualize the equity trend. All pivot settings are adjustable in the input menu. The pivot limits serve as a filter for recording pivot points. For example, with an upper pivot limit of 60, only pivots greater than 60 will be recorded into the array used to determine overbought. The crosses represent which values are used to determine overbought/oversold and do not provide timely indications.
Unraided Liquidity and S/R PivotsThis indicator is designed to show key pivot points, also known as levels, which could provide good trade entries.
Utilising liquidity concepts, untested pivot levels can be a good place to enter a trade after the pivot is tested, liquidity is taken and the direction reverses.
Alternatively, utilising the option of viewing already tested levels, you can easily see the key support and resistance areas that price is likely to have a strong reaction to, whether it wants to go toward or bounce away from these levels.
The indicator does not give buy and sell signals, it is up to you to use the levels to form your trading plan.
Oorah.
