Advanced Order Blocks by AccountantXThe "Advanced Order Blocks by AccountantX" is tool designed to identify and visualize significant order blocks in the market.
This script goes beyond traditional order block detection by integrating advanced features such as volume threshold filtering, ATR-based sizing, and higher timeframe considerations.
How It works:
A. General data :
- Order Block Detection: Identifies bullish and bearish order blocks based on swing highs and lows, with options to filter by volume thresholds to ensure significant levels.
- Volume Threshold: Only displays order blocks where the volume exceeds a user-defined threshold, ensuring the highlighted zones are of particular significance.
- ATR-Based Sizing: Offers the option to use the Average True Range (ATR) for sizing order blocks, allowing for dynamic adjustment based on market volatility.
- Higher Timeframe Integration: Includes the ability to display order blocks from a higher timeframe, providing a broader market perspective.
- Customizable Appearance: Users can customize the colors and transparency of the order blocks, ensuring they fit seamlessly with any chart setup.
B. Code explanation :
- The script allows you to set a minimum volume threshold. Order blocks are only shown if the volume during their formation exceeds this threshold, ensuring that only significant price levels are highlighted.
- When enabled, the ATR (Average True Range) is used to size the order blocks. This means the height of the blocks adjusts dynamically with market volatility, providing a more accurate representation of significant zones.
- The script can display order blocks from a higher timeframe on your current chart. This is useful for aligning shorter-term trading decisions with broader market trends.
C. How to Use:
a) Set the volume threshold to filter out less significant order blocks. Adjust the value according to the typical volume of your trading instrument;
b) Enable the ATR-based sizing and set the period and multiplier to match your trading style. This helps in identifying order blocks relative to market volatility;
c) Choose a higher timeframe if you want to see significant order blocks from a broader market perspective. This can help in making more informed trading decisions.
Acknowledgements:
This script builds upon traditional order block concepts by integrating advanced features and customization options. Special thanks to the TradingView community( @fluxchart, @LuxAlgo_Team) for providing foundational concepts and inspiration.
Important Note
This script is provided as-is for educational purposes.
스크립트에서 "order"에 대해 찾기

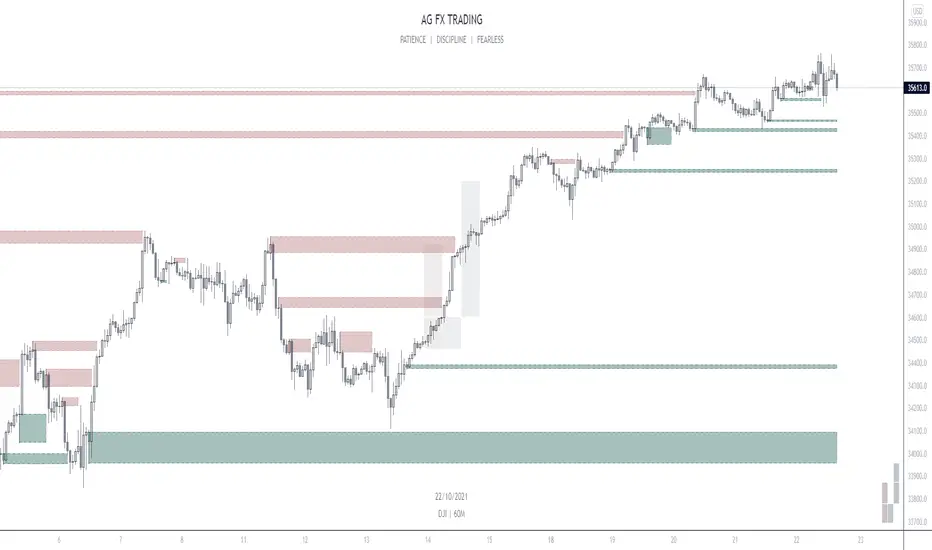
AG FX - INSTITUTIONAL ORDER BLOCKSThis Indicator will help you to find some potential bullish and bearish block.
This indicator, only provides just the the potentials ORDER BLOCKS followed by imbalances.
Forms of using this indicator:
- Plotting the ORDER BLOCKS CANDLES with the color that you prefer
- Plotting the zones given with the ORDER BLOCKS
- Both of them
Indicator Parameters:
- Customizable Candles colors
- Customizable Boxes colors
- Customizable amount of boxes displayed
PD: I just prefer the first one so i can get a clean chart, but it´s up to you.
Inner Circle Trader Institutional ORDER BLOCKS FOREX Theory
Today we are talking about the infamous ORDER BLOCKS by ICT forex trading Strategy. Order Blocks have proven to be a very effective tool in trading as they allow traders to gain high reward with low risk trades.
What is an Order Block? - The Order Block is a specific price range or candle where institutions will be buying or selling against the retail trend/dump money.
Institutions leave order blocks for themselves to trade at a later stage. They will reverse the price to a previous order and then driving the price hard in the direction of the trend (The real institutional trend).
These order blocks we can also call them specific levels of either going Long or Short. If an order block is violated or broken, it now qualifies as a Breaker, meaning Price will retest back to that order block. Sometimes we call it a failed order block.
Types of OBs:
i. Bullish Order Block (BUB)
ii. Bearish Order Block (BEB)
Automated - Fibs with Market ordersThis script was recently shared for limit only orders here:
This version does not worry about keeping orders in the books and moving them around, instead it will simply market in and out.
I am sharing this to reveal the difference between the 2 setups.

Whale Breaker — HTF Order Blocks + Market Structure HUDWhale Breaker (Debug Edition) is an advanced Smart Money Concept (SMC) tool designed to project High Timeframe (HTF) order blocks onto your Lower Timeframe (LTF) charts while tracking market structure breaks (BOS / CHoCH).
This debug build adds extra transparency: the mini-HUD not only shows HTF trend, last signal, and active order blocks, but also explains why no new block was created (e.g. no HTF BOS, body not found, ATR filter too strict, max-per-side limit). This makes it easier to fine-tune your settings and understand the logic behind the indicator.
Key features:
- HTF order blocks (e.g. 1h) projected into LTF charts (e.g. 15m)
- Automatic right-extension until mitigation (MB)
- Mitigation detection: blocks shaded once filled
- ATR filter to remove insignificant micro-zones
- Per-side cap: limit the maximum active BU/B blocks
- Lookback-based pruning for clean charts
- BOS/CHoCH arrows on chart (▲ green = bullish, ▼ red = bearish)
- Compact HUD with trend, last signal, active OBs, legend, and debug reasons
Usage:
- Define your HTF (e.g. 1h) and trade entries on the LTF (e.g. 15m).
- Wait for a BOS in HTF direction, then target the projected order block.
- Stop Loss just beyond the OB, Take Profit at next opposite OB or using a fixed RRR.
Note: This is a debugging/educational version to understand order block creation logic.
For live trading, consider using the standard Whale Breaker.

Validated Order Blocks with Fib LevelsThis indicator automatically identifies and displays Smart Money Concepts (SMC) order blocks based on market structure breaks:
How it works:
Bearish Order Blocks (Red): Marks the last bullish candle before a swing high. The OB becomes valid when price breaks below the previous swing low, indicating institutional selling zones. Drawn from the candle's close (body top) to its low (bottom wick).
Bullish Order Blocks (Green): Marks the last bearish candle before a swing low. The OB becomes valid when price breaks above the previous swing high, indicating institutional buying zones. Drawn from the candle's high (top wick) to its close (body bottom).
Features:
Three Fibonacci retracement levels (50%, 75%, 100%) for each order block
Fib 100% faces downward on bearish OBs and upward on bullish OBs
Auto-validation: OBs are removed when price closes through them
Customizable: Adjustable swing detection, timeframe selection, and OB display limits
Optional Break of Structure (BOS) markers to show when OBs activate
Works on any timeframe with HTF analysis support
Perfect for identifying key institutional support/resistance zones and potential reversal areas.

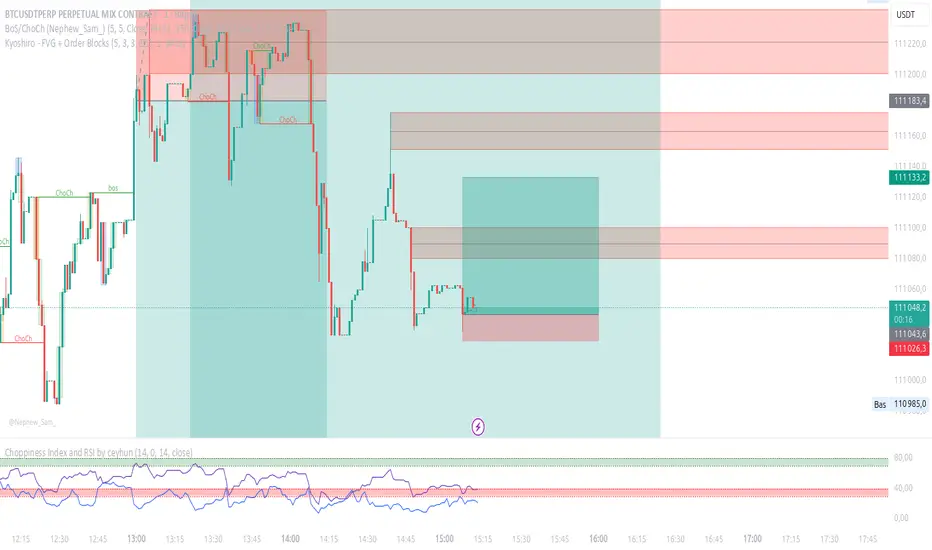
Kyoshiro - FVG + Order Blocks📌 Kyoshiro – FVG + Order Blocks
This indicator combines Order Block (OB) detection with an intelligent auto-management system and a clean visual display on the chart.
It is designed to help traders better identify institutional zones where price frequently reacts.
⚙️ Key Features:
✅ Real-time detection of bullish and bearish Order Blocks.
✅ Automatic cleanup: invalidated OBs are removed to keep the chart clean.
✅ Customizable display:
Maximum number of visible OBs (bullish / bearish).
Zone colors, outlines, and midlines.
Line styles (solid, dashed, dotted) and adjustable width.
✅ Choice of mitigation method:
Wick
Close
✅ Built-in alerts:
Formation of bullish or bearish OB.
Mitigation of an existing OB.
🔔 Available Alerts:
Bullish OB Formed → A bullish order block is detected.
Bearish OB Formed → A bearish order block is detected.
Bullish OB Mitigated → A bullish OB has been invalidated.
Bearish OB Mitigated → A bearish OB has been invalidated.
🎯 Use Cases:
Quickly identify key liquidity zones.
Track institutional activity in the market.
Improve entry and exit precision.
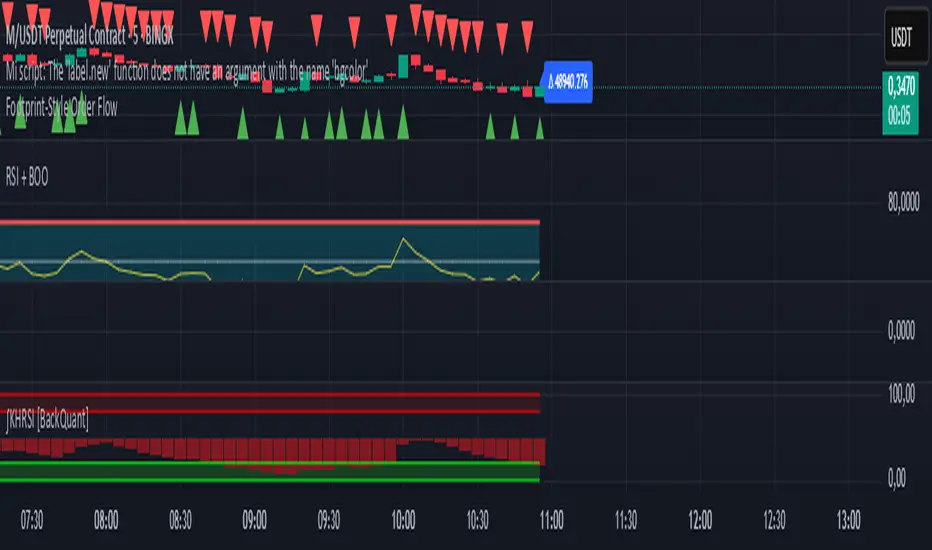
Footprint-Style Order Flow by Kalibea📊 Indicator: "Footprint-Style Order Flow by Kalibea"
Simplified Order Flow Analysis for TradingView
This indicator was created by Kalibea to bring you the power of Order Flow analysis in a clear, practical way—without technical complexity and fully compatible with TradingView.
While TradingView doesn’t support traditional footprint charts, this tool simulates institutional market reading using a smart calculation of estimated volume delta, helping you make more informed trading decisions.
🔍 What does this indicator do?
Estimated Delta: Calculates the difference between buying and selling pressure per candle, based on price movement and volume.
Smart Visual Signals:
🔼 Green Triangle: Potential buy entry (buyer dominance).
🔽 Red Triangle: Potential sell entry (seller dominance).
Delta Histogram: Displays whether each candle was driven more by buyers or sellers.
Live Labels: Shows real-time delta values above each candle for quick interpretation.
🧠 How does it help your trading?
Detects real-time market imbalances (who's in control: buyers or sellers).
Improves entry and exit timing, especially on lower timeframes.
Helps you confirm other strategies such as supply/demand zones, support/resistance, or candlestick patterns.
Provides an institutional-style reading simplified for use within TradingView.
⚙️ Fully Customizable to Your Style
Adjust the delta sensitivity to suit any market: Forex, Crypto, Indices, and more.
Turn on/off visual signals and histogram as needed.
🔑 Recommended by Kalibea for:
✅ Intraday traders and scalpers
✅ Traders looking to take the next step into institutional-style analysis
✅ Those seeking precise entries without overcomplicating their charts
💬 “Order Flow is the market’s internal voice. This indicator helps you hear it—no expensive footprint software required.”
— Kalibea
Support Resistance with Order BlocksIndicator Description
Professional Price Level Detection for Smart Trading. Master the Markets with Precision Support/Resistance and Order Block Analysis . It provides traders with clear visual cues for potential reversal and breakout areas, combining both retail and institutional trading concepts into one powerful tool.
The Support & Resistance with Order Blocks indicator is a versatile Pine Script tool designed to empower traders with clear, actionable insights into key market levels. By combining advanced pivot-based support and resistance (S/R) detection with order block (OB) filtering, this indicator delivers clean, high-probability zones for entries, exits, and reversals. With customizable display options (boxes or lines) and intuitive settings, it’s perfect for traders of all styles—whether you’re scalping, swing trading, or investing long-term. Overlay it on your TradingView chart and elevate your trading strategy today!
________________________________________
Key Features
✅ Dynamic Support/Resistance - Auto-adjusting levels based on price action
✅ Smart Order Block Detection - Identifies institutional buying/selling zones
✅ Dual Display Modes - Choose between Boxes or Clean Lines for different chart styles
✅ Customizable Sensitivity - Adjust detection parameters for different markets
✅ Broken Level Markers - Clearly shows when key levels are breached
✅ Timeframe-Adaptive - Automatically adjusts for daily/weekly charts
1. Dynamic Support & Resistance Detection
Identifies critical S/R zones using pivot high/low calculations with adjustable look back periods.
Visualizes active S/R zones with distinct colors and labels ("Support" or "Resistance" for boxes, lines for cleaner charts).
Marks broken S/R levels as "Br S" (broken support) or "Br R" (broken resistance) when historical display is enabled, aiding in breakout and reversal analysis.
2. Smart Order Block Identification
Detects bullish and bearish order blocks based on significant price movements (default: ±0.3% over 5 candles).
Highlights institutional buying/selling zones with customizable colors, displayed as boxes or lines.
Filters out overlapping OB zones to keep your chart clutter-free.
3. Dual Display Options
Boxes or Lines: Choose to display S/R and OB as boxes for detailed zones or lines for a minimalist view.
Line Width Customization: Adjust line widths for S/R and OB (1–5 pixels) for optimal visibility.
Color Customization: Tailor colors for active/broken S/R and bullish/bearish OB zones.
4. Advanced Overlap Filtering
Ensures S/R zones don’t overlap with OB zones or other S/R levels, providing only the most relevant levels.
Limits the number of active zones (default: 10) to maintain chart clarity.
5. Historical S/R Visualization
Optionally display broken S/R levels with distinct colors and labels ("Br S" or "Br R") to track historical price reactions.
Broken levels are dynamically updated and removed (or retained) based on user settings.
6. Timeframe Adaptability
Automatically adjusts pivot detection for daily/weekly timeframes (40-candle look back) versus shorter timeframes (20-candle look back).
Works seamlessly across all asset classes (stocks, forex, crypto, etc.) and timeframes.
________________________________________
How It Works
• Support & Resistance:
Uses ta.pivothigh and ta.pivotlow to detect significant price pivots, with a user-defined look back (default: 5 candles post-pivot).
Plots S/R as boxes (with labels "Support" or "Resistance") or lines, extending to the current bar for real-time relevance.
Broken S/R levels are marked with adjusted colors and labels ("S" or "R" for boxes, "Br S" or "Br R" for lines when historical display is enabled).
• Order Blocks:
Identifies OB based on strong price movements over 4 candles, plotted as boxes or lines at the candle’s midpoint.
Validates OB to prevent overlap, ensuring only significant zones are displayed.
Removes OB zones when price breaks through, keeping the chart focused on active levels.
• Customization:
Toggle S/R and OB visibility, adjust detection sensitivity, and set maximum active zones (4–50).
Fine-tune line widths and colors for a personalized chart experience.
________________________________________
Why Use This Indicator?
• Precision Trading: Pinpoint high-probability entry/exit zones with filtered S/R and OB levels.
• Clean Charts: Overlap filtering and zone limits reduce clutter, focusing on key levels.
• Versatile Display: Switch between boxes for detailed zones or lines for simplicity, with adjustable line widths.
• Institutional Edge: Leverage OB detection to align with institutional activity for smarter trades.
• User-Friendly: Intuitive settings and clear visuals make it accessible for beginners and pros alike.
________________________________________
Settings Overview________________________________________
⚙ Input Parameters
Settings Overview
Display Options:
Display Type: Choose "Boxes" or "Lines" for S/R and OB visualization.
S/R Line Width: Set line thickness for S/R lines (1–5 pixels, default: 2).
OB Line Width: Set line thickness for OB lines (1–5 pixels, default: 2).
Order Block Options:
Show Order Block: Enable/disable OB display.
Bull/Bear OB Colors: Customise border and fill colors for bullish and bearish OB zones.
Support/Resistance Options:
Show S/R: Toggle active S/R zones.
Show Historical S/R: Display broken S/R levels, marked as "Br S" or "Br R" for lines.
Detection Period: Set candle lookback for pivot detection (4–50, default: 5).
Max Active Zones: Limit active S/R and OB zones (4–50, default: 10).
Colors: Customise active and broken S/R colors for clear differentiation.
________________________________________
How to Use
1. Add to Chart: Apply the indicator to your TradingView chart.
2. Customize Settings:
o Select "Boxes" or "Lines" for your preferred display style.
o Adjust line widths, colors, and detection parameters to suit your trading style.
o Enable "Show Historical S/R" to track broken levels with "Br S" and "Br R" labels.
3. Analyze Levels:
o Use support zones (green) for buy entries and resistance zones (red) for sell entries.
o Monitor OB zones for institutional activity, signaling potential reversals or continuations.
o Watch for "Br S" or "Br R" labels to identify breakout opportunities.
4. Combine with Other Tools: Pair with trend indicators, volume analysis, or price action for a robust strategy.
5. Monitor Breakouts: Trade breakouts when price breaches S/R or OB zones, with historical labels providing context.
________________________________________
Example Use Cases
• Swing Trading: Use S/R and OB zones to identify entry/exit points, with historical broken levels for context.
• Breakout Trading: Trade price breaks through S/R or OB, using "Br S" and "Br R" labels to confirm reversals.
• Scalping: Adjust detection period for faster S/R and OB identification on lower timeframes.
________________________________________
• Performance: Optimized for all timeframes, with best results on 5M, 15M, 30M, 1H, 4H, or daily charts for swing trading.
• Compatibility: Works with any asset class and TradingView chart.
________________________________________
Get Started
Transform your trading with Support & Resistance with Order Blocks! Add it to your chart, customize it to your style, and trade with confidence. For questions or feedback, drop a comment on TradingView or message the author. Happy trading! 🚀
________________________________________
Disclaimer: This indicator is for educational and informational purposes only. Always conduct your own analysis and practice proper risk management before trading.

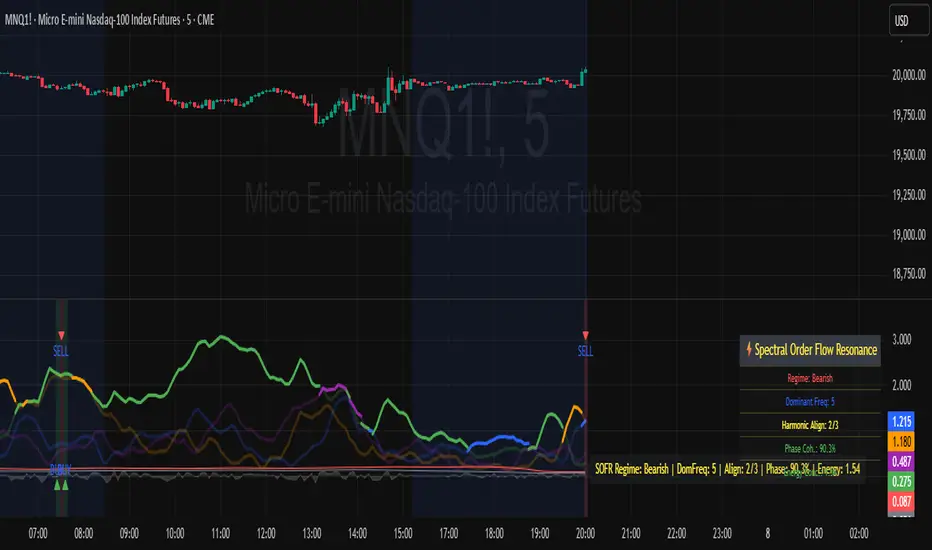
Spectral Order Flow Resonance (SOFR) Spectral Order Flow Resonance (SOFR)
See the Market’s Hidden Rhythms—Trade the Resonance, Not the Noise!
The Spectral Order Flow Resonance (SOFR) is a next-generation tool for traders who want to go beyond price and volume, tapping into the underlying “frequency signature” of order flow itself. Instead of chasing lagging signals or reacting to surface-level volatility, SOFR lets you visualize and quantify the real-time resonance of market activity—helping you spot when the crowd is in sync, and when the regime is about to shift.
What Makes SOFR Unique?
Not Just Another Oscillator:
SOFR doesn’t just measure momentum or volume. It applies spectral analysis (using Fast Fourier Transform) to normalized order flow, extracting the dominant cycles and their resonance strength. This reveals when the market is harmonizing around key frequencies—often the precursor to major moves.
Regime Detection, Not Guesswork:
By tracking harmonic alignment and phase coherence across multiple Fibonacci-based frequencies, SOFR identifies when the market is entering a bullish, bearish, or neutral resonance regime. This is visualized with a dynamic dashboard and info line, so you always know the current state at a glance.
Dynamic Dashboard:
The on-chart dashboard color-codes each key metric—regime, dominant frequency, harmonic alignment, phase coherence, and energy concentration—so you can instantly gauge the strength and direction of the current resonance. No more guesswork or clutter.
Universal Application:
Works on any asset, any timeframe, and in any market—futures, stocks, crypto, forex. If there’s order flow, SOFR can reveal its hidden structure.
How Does It Work?
Order Flow Normalization:
SOFR calculates the net buying/selling pressure and normalizes it using a rolling mean and standard deviation, making the signal robust across assets and timeframes.
Spectral Analysis:
The script applies FFT to the normalized order flow, extracting the magnitude and phase of several key frequencies (typically Fibonacci numbers). This allows you to see which cycles are currently dominating the market.
Resonance & Regime Logic:
When multiple frequencies align and exceed a dynamic resonance threshold, and phase coherence is high, SOFR detects a “resonance regime”—bullish, bearish, or neutral. This is when the market is most likely to experience a strong, sustained move.
Visual Clarity:
The indicator plots each frequency’s magnitude, highlights the dominant one, and provides a real-time dashboard with color-coded metrics for instant decision-making.
SOFR Dashboard Metrics Explained
Regime:
What it means: The current “state” of the market as detected by SOFR—Bullish, Bearish, or Neutral.
Why it matters: The regime tells you whether the market’s order flow is resonating in a way that favors upward moves (Bullish), downward moves (Bearish), or is out of sync (Neutral). This helps you align your trades with the prevailing market force, or stand aside when there’s no clear edge.
Dominant Freq:
What it means: The most powerful frequency (cycle length, in bars) currently detected in the order flow.
Why it matters: Markets often move in cycles. The dominant frequency shows which cycle is currently driving price action, helping you time entries and exits with the market’s “heartbeat.”
Harmonic Align:
What it means: The number of key frequencies (out of 3) that are currently in resonance (above threshold).
Why it matters: When multiple frequencies align, it signals that different groups of traders (with different time horizons) are acting in concert. This increases the probability of a strong, sustained move.
Phase Coh.:
What it means: A measure (0–100%) of how “in sync” the phases of the key frequencies are.
Why it matters: High phase coherence means the market’s cycles are reinforcing each other, not cancelling out. This is a classic signature of trending or explosive moves.
Energy Conc.:
What it means: The concentration of spectral energy in the dominant frequency, relative to the average.
Why it matters: High energy concentration means the market’s activity is focused in one cycle, increasing the odds of a decisive move. Low concentration means the market is scattered and less predictable.
How to Use
Bullish Regime:
When the dashboard shows a green regime and high harmonic alignment, the market is in a bullish resonance—look for long opportunities or trend continuations.
Bearish Regime:
When the regime is red and alignment is high, the market is in a bearish resonance—look for short opportunities or trend continuations.
Neutral Regime:
When the regime is gray or alignment is low, the market is out of sync—consider waiting for clearer signals or using other tools.
Combine with Your Strategy:
Use SOFR as a confirmation tool, a filter for trend/range conditions, or as a standalone regime detector. The dashboard’s color-coded metrics help you instantly spot when the market is entering or exiting resonance.
Inputs Explained
FFT Window Length :
Controls the number of bars used for spectral analysis. Higher values smooth the signal, lower values make it more sensitive.
Order Flow Period:
Sets the lookback for normalizing order flow. Shorter periods react faster, longer periods are smoother.
Fibonacci Frequencies:
Choose which cycles to analyze. Default values (5, 8, 13) capture common market rhythms.
Resonance Threshold:
Sets how strong a frequency’s signal must be to count as “in resonance.” Lower for more signals, higher for stricter filtering.
Signal Smoothing & Amplify:
Fine-tune the display for your chart and asset.
Dashboard & Info Line Toggles:
Show or hide the on-chart dashboard and info line as needed.
Why This Matters
Most indicators show you what just happened. SOFR shows you when the market is entering a state of resonance—when crowd behavior is most likely to produce powerful, sustained moves. By visualizing the hidden structure of order flow, you gain a tactical edge over traders who only see the surface.
For educational purposes only. Not financial advice. Always use proper risk management.
Use with discipline. Trade your edge.
— Dskyz, for DAFE Trading Systems
IPDA with Order Blocks [Enhanced]Summary of the Code
This script plots IPDA Standard Deviations on a price chart, helping traders visualize potential support and resistance levels based on a series of user-defined deviations. It uses swing high/low points and time-based fractal lookbacks (monthly, weekly, daily, or intraday) to define price anchors and compute deviation lines.
Key features include:
Deviations: It calculates and plots deviation levels based on the distance between swing highs and lows, which traders can use as price targets or zones of interest.
Timeframes:
Monthly (higher timeframe analysis)
Weekly (medium-term analysis)
Daily and Intraday (shorter-term precision)
Customization:
Choose which deviation levels (e.g., 0, 1, -1, -2) to display.
Hide labels or adjust their sizes for cleaner charts.
Option to remove invalidated deviation levels dynamically.
Visual Cleanliness: Automatically removes clutter by hiding or deleting invalid deviation levels and focusing on active price zones.
How to Utilize It for Intraday Trading to Make $1,000
Here’s how to effectively use the indicator to optimize intraday trading:
1. Set the Right Timeframe:
Use the 15-minute or 1-hour chart for intraday setups.
Ensure the "Intraday" lookback option is enabled to focus on shorter-term swings.
2. Interpret the Levels:
Bearish Order Blocks: Look for red lines (bearish deviation) as potential resistance zones where the price may reverse downward.
Bullish Order Blocks: Look for green lines (bullish deviation) as potential support zones where the price may bounce upward.
3. Plan Entries and Exits:
Entry: Buy near a green order block or short near a red order block, confirming the trade with additional signals (e.g., candlestick patterns, momentum indicators).
Stop Loss: Place your stop below the green line (for buys) or above the red line (for shorts).
Profit Targets: Use deviation levels as targets (e.g., from the 0 level to +1 or -1).
4. Combine with Market Context:
Use the script alongside volume profile, trend indicators, or news events for confirmation.
Avoid trading during major news events unless aligned with deviations.
5. Position Sizing for $1,000 Goal:
Trade liquid instruments like Nasdaq futures (NQ) or major forex pairs.
Risk 1-2% of your capital on each trade and scale into positions if confirmed.
Target a profit of 10-20 points per trade on Nasdaq futures, with 1-2 trades daily.
6. Monitor Key Timeframes:
Pre-market (before 9:30 AM EST): Mark deviation levels to predict market open behavior.
Midday & Power Hour (3-4 PM EST): Watch for breakouts or retests around key deviation levels.
By combining this tool with disciplined risk management and a clear trading plan, you can systematically work toward your profit target while minimizing unnecessary risks

Market Structure- ZigZag, Break of Structure & Order BlocksDescription:
This script is an all-in-one market structure tool designed for traders who follow price action, Smart Money Concepts (SMC), or institutional order flow. It combines Order Block detection , Break of Structure (BOS) , Internal Structure Shifts (CHoCH) , and a ZigZag swing framework to provide a clear and actionable view of market behavior.
Key Features:
Order Blocks (OB) :
-Detects Bullish (Green) and Bearish (Red) order blocks upon valid market structure shifts.
-Optional deletion of mitigated (touched) blocks to keep charts clean.
-Customizable block duration, fill color, and border color.
Break of Structure (BOS) :
-Marks BOS with horizontal dotted lines when price breaks previous swing highs/lows.
-Confirms new trends and structural shifts.
Internal Structure Shifts (CHoCH-like) :
-Detects early internal changes in direction before BOS.
-User-selectable logic: based on candle Open or High/Low.
-Plotted as small black triangle markers.
ZigZag Swings :
-Connects confirmed internal shifts with black zigzag lines.
-Visually simplifies trend structure and major swing points.
-Tracks last swing highs/lows for BOS validation.
Alerts :
-Bullish/Bearish Engulfments (OB signals)
-Internal Structure Shifts
-Bullish/Bearish Break of Structure
-OB Mitigation Events
Inputs & Settings :
-Show/Hide Bullish or Bearish Order Blocks
-Calculate internal shifts by: Open or High/Low
-Set order block fill and border colors
-Enable or disable automatic deletion of mitigated blocks
-Set duration for order block display
This tool is designed to support price action trading by visually mapping key structural changes and zones of interest directly on your chart. It is not intended to function as a standalone trading strategy , but rather as a supplementary tool to inform your own analysis and discretion.
Internal Market Structure + Order BlocksInternal Market Structure + Order Blocks
This indicator combines internal market structure shifts with order block detection to help traders identify key zones of institutional interest and potential trend reversals. It highlights bullish and bearish engulfing conditions that mark the formation of valid order blocks, and it plots internal structure shifts—early signals that may precede a larger move.
Key Features:
-Bullish & Bearish Order Blocks: Highlighted with shaded boxes (green for bullish, red for bearish) following engulfing price action.
-Internal Structure Shifts: Small black triangles show early signs of a potential reversal, offering a unique perspective beyond standard structure analysis.
-Engulfing Breakouts: Marks when price breaks previous opposing structure, confirming new directional intent.
-Alerts Included: Get notified on key structure breaks and internal shifts to stay ahead of potential setups.
This tool is designed to support price action trading by visually mapping key structural changes and zones of interest directly on your chart. It is not intended to function as a standalone trading strategy , but rather as a supplementary tool to inform your own analysis and discretion.
Note: The arrows, polylines, and colored trendlines shown in the chart example are not generated by the indicator. They have been added manually for illustration purposes to demonstrate how the indicator can be used to trace market structure. Likewise, the order blocks in the example are manually drawn and may differ slightly from the indicator's automatic calculations, serving only to enhance visual clarity.

Stochastic Order Flow Momentum [ScorsoneEnterprises]This indicator implements a stochastic model of order flow using the Ornstein-Uhlenbeck (OU) process, combined with a Kalman filter to smooth momentum signals. It is designed to capture the dynamic momentum of volume delta, representing the net buying or selling pressure per bar, and highlight potential shifts in market direction. The volume delta data is sourced from TradingView’s built-in functionality:
www.tradingview.com
For a deeper dive into stochastic processes like the Ornstein-Uhlenbeck model in financial contexts, see these research articles: arxiv.org and arxiv.org
The SOFM tool aims to reveal the momentum and acceleration of order flow, modeled as a mean-reverting stochastic process. In markets, order flow often oscillates around a baseline, with bursts of buying or selling pressure that eventually fade—similar to how physical systems return to equilibrium. The OU process captures this behavior, while the Kalman filter refines the signal by filtering noise. Parameters theta (mean reversion rate), mu (mean level), and sigma (volatility) are estimated by minimizing a squared-error objective function using gradient descent, ensuring adaptability to real-time market conditions.
How It Works
The script combines a stochastic model with signal processing. Here’s a breakdown of the key components, including the OU equation and supporting functions.
// Ornstein-Uhlenbeck model for volume delta
ou_model(params, v_t, lkb) =>
theta = clamp(array.get(params, 0), 0.01, 1.0)
mu = clamp(array.get(params, 1), -100.0, 100.0)
sigma = clamp(array.get(params, 2), 0.01, 100.0)
error = 0.0
v_pred = array.new(lkb, 0.0)
array.set(v_pred, 0, array.get(v_t, 0))
for i = 1 to lkb - 1
v_prev = array.get(v_pred, i - 1)
v_curr = array.get(v_t, i)
// Discretized OU: v_t = v_{t-1} + theta * (mu - v_{t-1}) + sigma * noise
v_next = v_prev + theta * (mu - v_prev)
array.set(v_pred, i, v_next)
v_curr_clean = na(v_curr) ? 0 : v_curr
v_pred_clean = na(v_next) ? 0 : v_next
error := error + math.pow(v_curr_clean - v_pred_clean, 2)
error
The ou_model function implements a discretized Ornstein-Uhlenbeck process:
v_t = v_{t-1} + theta (mu - v_{t-1})
The model predicts volume delta (v_t) based on its previous value, adjusted by the mean-reverting term theta (mu - v_{t-1}), with sigma representing the volatility of random shocks (approximated in the Kalman filter).
Parameters Explained
The parameters theta, mu, and sigma represent distinct aspects of order flow dynamics:
Theta:
Definition: The mean reversion rate, controlling how quickly volume delta returns to its mean (mu). Constrained between 0.01 and 1.0 (e.g., clamp(array.get(params, 0), 0.01, 1.0)).
Interpretation: A higher theta indicates faster reversion (short-lived momentum), while a lower theta suggests persistent trends. Initial value is 0.1 in init_params.
In the Code: In ou_model, theta scales the pull toward \mu, influencing the predicted v_t.
Mu:
Definition: The long-term mean of volume delta, representing the equilibrium level of net buying/selling pressure. Constrained between -100.0 and 100.0 (e.g., clamp(array.get(params, 1), -100.0, 100.0)).
Interpretation: A positive mu suggests a bullish bias, while a negative mu indicates bearish pressure. Initial value is 0.0 in init_params.
In the Code: In ou_model, mu is the target level that v_t reverts to over time.
Sigma:
Definition: The volatility of volume delta, capturing the magnitude of random fluctuations. Constrained between 0.01 and 100.0 (e.g., clamp(array.get(params, 2), 0.01, 100.0)).
Interpretation: A higher sigma reflects choppier, noisier order flow, while a lower sigma indicates smoother behavior. Initial value is 0.1 in init_params.
In the Code: In the Kalman filter, sigma contributes to the error term, adjusting the smoothing process.
Summary:
theta: Speed of mean reversion (how fast momentum fades).
mu: Baseline order flow level (bullish or bearish bias).
sigma: Noise level (variability in order flow).
Other Parts of the Script
Clamp
A utility function to constrain parameters, preventing extreme values that could destabilize the model.
ObjectiveFunc
Defines the objective function (sum of squared errors) to minimize during parameter optimization. It compares the OU model’s predicted volume delta to observed data, returning a float to be minimized.
How It Works: Calls ou_model to generate predictions, computes the squared error for each timestep, and sums it. Used in optimization to assess parameter fit.
FiniteDifferenceGradient
Calculates the gradient of the objective function using finite differences. Think of it as finding the "slope" of the error surface for each parameter. It nudges each parameter (theta, mu, sigma) by a small amount (epsilon) and measures the change in error, returning an array of gradients.
Minimize
Performs gradient descent to optimize parameters. It iteratively adjusts theta, mu, and sigma by stepping down the "hill" of the error surface, using the gradients from FiniteDifferenceGradient. Stops when the gradient norm falls below a tolerance (0.001) or after 20 iterations.
Kalman Filter
Smooths the OU-modeled volume delta to extract momentum. It uses the optimized theta, mu, and sigma to predict the next state, then corrects it with observed data via the Kalman gain. The result is a cleaner momentum signal.
Applied
After initializing parameters (theta = 0.1, mu = 0.0, sigma = 0.1), the script optimizes them using volume delta data over the lookback period. The optimized parameters feed into the Kalman filter, producing a smoothed momentum array. The average momentum and its rate of change (acceleration) are calculated, though only momentum is plotted by default.
A rising momentum suggests increasing buying or selling pressure, while a flattening or reversing momentum indicates fading activity. Acceleration (not plotted here) could highlight rapid shifts.
Tool Examples
The SOFM indicator provides a dynamic view of order flow momentum, useful for spotting directional shifts or consolidation.
Low Time Frame Example: On a 5-minute chart of SEED_ALEXDRAYM_SHORTINTEREST2:NQ , a rising momentum above zero with a lookback of 5 might signal building buying pressure, while a drop below zero suggests selling dominance. Crossings of the zero line can mark transitions, though the focus is on trend strength rather than frequent crossovers.
High Time Frame Example: On a daily chart of NYSE:VST , a sustained positive momentum could confirm a bullish trend, while a sharp decline might warn of exhaustion. The mean-reverting nature of the OU process helps filter out noise on longer scales. It doesn’t make the most sense to use this on a high timeframe with what our data is.
Choppy Markets: When momentum oscillates near zero, it signals indecision or low conviction, helping traders avoid whipsaws. Larger deviations from zero suggest stronger directional moves to act on, this is on $STT.
Inputs
Lookback: Users can set the lookback period (default 5) to adjust the sensitivity of the OU model and Kalman filter. Shorter lookbacks react faster but may be noisier; longer lookbacks smooth more but lag slightly.
The user can also specify the timeframe they want the volume delta from. There is a default way to lower and expand the time frame based on the one we are looking at, but users have the flexibility.
No indicator is 100% accurate, and SOFM is no exception. It’s an estimation tool, blending stochastic modeling with signal processing to provide a leading view of order flow momentum. Use it alongside price action, support/resistance, and your own discretion for best results. I encourage comments and constructive criticism.

ICT Order Blocks v2 (Debug)Josh has a very large PP xD
Understanding Order Blocks (OBs) - The ICT Perspective
This document delves into the concept of Order Blocks (OBs) from the perspective of the ICT methodology. It outlines what OBs are, their significance in trading, and how the "ICT Order Blocks v2 (Refined)" indicator functions to identify and visualize these critical price levels. By understanding OBs, traders can better navigate market movements and make informed decisions based on institutional trading behavior.
What is an Order Block (OB)?
Within ICT methodology, an Order Block represents a specific price candle where significant buying or selling interest from institutions (Smart Money) is believed to have occurred. They are potential areas where price might return and react.
Bullish Order Block: Typically the last down-closing candle before a strong, impulsive upward move (displacement). It suggests institutions may have absorbed selling pressure and initiated long positions here.
Bearish Order Block: Typically the last up-closing candle before a strong, impulsive downward move (displacement). It suggests institutions may have distributed long positions or initiated short positions here.
Why are OBs Significant (ICT View)?
Institutional Footprint: They mark potential zones of large order execution.
Support/Resistance: Unmitigated OBs can act as sensitive price levels where reactions are expected. Bullish OBs may provide support; Bearish OBs may provide resistance.
Origin of Moves: They often mark the origin point of significant price swings.
Liquidity Engineering: Institutions might drive price back to OBs to mitigate earlier positions or to engineer liquidity before continuing a move.
Common Refinements
ICT often emphasizes higher probability OBs that are associated with:
Displacement: The move away from the OB is sharp and decisive.
Fair Value Gaps (FVGs): An FVG forming immediately after the OB strengthens its validity.
OB Mitigation: This refers to price returning to the level of the Order Block after its formation. Price might react at the edge (proximal line) or the 50% level (mean threshold) of the OB. An OB is often considered fully mitigated or invalidated if price trades decisively through its entire range, especially with a candle body closing beyond it.
How the "ICT Order Blocks v2 (Refined)" Indicator Works
This indicator automates the detection and visualization of the most recent unmitigated Order Block of each type (Bullish/Bearish), incorporating optional filters.
Detection:
It looks at the relationship between the candle two bars ago ( ), the previous candle ( ), and potentially the current candle ( ).
Bullish OB: Identifies if candle was a down-close (close < open ) AND candle broke above the high of candle (high > high ).
Bearish OB: Identifies if candle was an up-close (close > open ) AND candle broke below the low of candle (low < low ).
Accuracy Filters (Optional Inputs):
These filters help identify potentially higher-probability OBs:
Require Fair Value Gap (FVG)?: If enabled, the indicator checks if an FVG formed immediately after the OB candle ( ). Specifically, it looks for a gap between candle and candle (low > high for Bullish OB confirmation, high < low for Bearish).
Require Strong Close Breakout?: If enabled, it requires the breakout candle ( ) to close beyond the range of the OB candle ( ). (close > high for Bullish, close < low for Bearish). This suggests stronger confirmation.
Storing the Most Recent OB:
When an OB is detected and passes any enabled filters, its details (high, low, formation bar index) are stored. Crucially, this indicator only tracks the single most recent valid unmitigated OB of each type (one Bullish, one Bearish) using var variables. If a newer valid OB forms, it replaces the previously stored one.
Drawing Boxes:
If a valid Bullish OB is being tracked (and Show Bullish OBs is enabled), it draws a box (box.new) using the high and low of the identified OB candle ( ). The same process applies to Bearish OBs (Show Bearish OBs enabled). The boxes automatically extend to the right (extend.right) and their right edge is updated on each new bar (box.set_right) until they are mitigated. Labels ("Bull OB" / "Bear OB") are displayed inside the boxes.
Mitigation & Box Deletion:
The indicator checks if the current closing price (close ) has moved entirely beyond the range of the tracked OB.
Mitigation Rule Used: A Bullish OB is considered mitigated if close < bull_ob_low. A Bearish OB is considered mitigated if close > bear_ob_high. Once an OB is marked as mitigated, the indicator stops tracking it and its corresponding box is automatically deleted (box.delete) from the chart.
This indicator provides a dynamic visualization of the most recent, potentially significant Order Blocks that meet the specified criteria, helping traders identify key areas of interest based on ICT principles.

Supply & Demand Zones + Order Block (Pro Fusion) - Auto Order Strategy Title:
Smart Supply & Demand Zones + Order Block Auto Strategy with ScalpPro (Buy-Focused)
📄 Strategy Description:
This strategy combines the power of Supply & Demand Zone analysis, Order Block detection, and an enhanced Scalp Pro momentum filter, specifically designed for automated decision-making based on high-volume breakouts.
✅ Key Features:
Auto Entry (Buy Only) Based on Breakouts
Automatically enters a Buy position when the price breaks out of a valid demand zone, confirmed by EMA 50 trend and volume spike.
Order Block Logic
Identifies bullish and bearish order blocks using consecutive candle structures and significant price movement.
Dynamic Stop Loss & Trailing Stop
Implements a trailing stop once price moves in profit, along with static initial stop loss for risk management.
Clear Visual Labels & Alerts
Displays BUY/SELL, Demand/Supply, and Order Block labels directly on the chart. Alerts trigger on valid breakout signals.
Scalp Pro Momentum Filter (Optimized)
Uses a modified MACD-style momentum indicator to confirm trend strength and filter out weak signals.
Enhanced Order Flow Pressure GaugeShort Description:
Estimates bullish/bearish pressure by analyzing each candle’s close position within its range, then weighting that by volume. Detects potential trend shifts and provides real-time signals.
Full Description:
1. Purpose
The Enhanced Order Flow Pressure Gauge (OFPG+) is designed to approximate buy vs. sell pressure within each bar, even if you don’t have full Level II / order flow data. By measuring the candle’s close relative to its high-low range and multiplying by volume, OFPG+ provides insights into which side of the market (bulls or bears) is more aggressive in a given interval.
2. Key Components
Pressure Score (Histogram):
Raw measure of each bar’s close position (rangePos) minus midpoint, multiplied by volume. If the bar closes near its high with decent volume, the score is positive (bullish). Conversely, a close near its low yields a negative (bearish) reading.
Cumulative Pressure:
Sum of all pressure readings over time (similar to cumulative delta), reflecting the overall market bias.
Pressure Delta:
The change in cumulative pressure from one bar to the next, plotted as a line. Rising values suggest increasing bullish momentum, while falling values show growing bearish influence.
3. Visual Cues & Signals
Histogram (Pressure Profile): A color-coded bar for each candle, indicating net bullish (blue) or bearish (gray) intrabar pressure.
Pressure Delta Line: Plotted over the histogram. Turns bullish (blue) when net buy pressure is increasing, or bearish (gray) when net selling accelerates.
Background Highlights:
Turns lightly blue if the smoothed pressure line exceeds the positive threshold, or lightly gray if it goes below the negative threshold.
Bullish / Bearish Signals:
Bullish Signal occurs when the smoothed pressure line crosses above the positive threshold, combined with a positive Delta.
Bearish Signal occurs when the smoothed pressure line crosses below the negative threshold, combined with a negative Delta.
Confirmed Signals:
After a bullish/bearish signal, OFPG+ checks the highest or lowest smoothed pressure values over a user-defined number of bars (signalLookback) to confirm momentum.
Plotshapes (diamond icons) appear on the chart to mark these confirmed reversals.
4. Usage Scenarios
Trend-Following / Momentum: Watch for transitions from negative to positive net pressure or vice versa. Helps identify potential turning points.
Reversal Confirmation: The threshold-based signals plus the “confirmed” checks can help filter choppy conditions.
Volume-Weighted Insights: By factoring in volume, strong closes near the highs or lows are weighted more heavily, capturing sentiment shifts.
5. Inputs & Parameters
Smoothing Length (length): The EMA period for smoothing the raw pressure score.
Volume Weight (volWeight): Scales the volume impact on pressure calculations.
Pressure Threshold (threshold): Defines when pressure is considered significantly bullish or bearish.
Signal Lookback (signalLookback): Number of bars to confirm momentum after a signal.
6. Alerts
Bullish Signal & Confirmed Bullish
Bearish Signal & Confirmed Bearish
These alerts can notify you in real-time about potential shifts in the market’s buying or selling pressure.
7. Disclaimer
This script provides an approximation of order flow by analyzing candle structure and volume. It does not represent actual exchange-level order data.
Past performance is not necessarily indicative of future results. Always conduct thorough analysis and use proper risk management.
Not financial advice. Use at your own discretion.

SMC Liquidity & Order Blocks🔹 1. Moving Averages for Trend Confirmation
Uses Exponential Moving Averages (EMA) to determine trend direction.
9-period EMA (blue) and 15-period EMA (red) are plotted.
🔹 2. Liquidity Zones (Swing Highs & Lows)
Identifies liquidity zones where price is likely to react.
Buy-Side Liquidity: Highest high over 20 periods (Green line).
Sell-Side Liquidity: Lowest low over 20 periods (Red line).
🔹 3. Order Block Detection
Detects bullish and bearish order blocks (key price zones of institutional activity).
Bullish Order Block (OB): Formed when the highest close over 5 bars exceeds the highest high.
Bearish Order Block (OB): Formed when the lowest close over 5 bars is lower than the lowest low.
Plotted using green (up-triangle) for bullish OB and red (down-triangle) for bearish OB.
🔹 4. Fair Value Gaps (FVG)
Detects price inefficiencies (gaps between candles).
FVG Up: When a candle's high is lower than a candle two bars ahead.
FVG Down: When a candle's low is higher than a candle two bars ahead.
Plotted using blue circles (FVG Up) and orange circles (FVG Down).

Precision Order Block FinderPrecision Order Block Finder
This advanced indicator identifies high-probability Order Block patterns with customizable confirmation parameters for increased precision and reliability. Unlike basic Order Block indicators, this tool allows you to specify the exact confirmation criteria needed before marking a pattern as valid.
Key Features:
Detects both bullish and bearish Order Block patterns
Customizable confirmation candle settings (1:3 ratio by default)
Adjustable visual properties including transparency and line styles
Optional price labels for quick reference
Filter options to display only bullish, bearish, or both pattern types
How It Works:
The indicator identifies potential Order Blocks by locating a trigger candle (bearish for bullish patterns, bullish for bearish patterns) followed by your specified number of confirmation candles in the opposite direction. This multi-candle confirmation approach helps filter out false signals and focuses on the most reliable trading opportunities.
Perfect for both swing and intraday traders looking to identify key market turning points with greater accuracy. The visual representation clearly highlights potential entry zones and price targets to streamline your trading decisions.
Adjust the settings to match your trading style and timeframe preferences for optimal results.
Crystal Order BlockThe Crystal Order Block Indicator is a powerful tool designed to help traders identify key institutional order blocks with high precision. This indicator is ideal for traders following Smart Money Concepts (SMC) and Institutional Trading Strategies, providing clear insights into potential high-probability trade setups.
🔹 Key Features:
✔ Automatic Order Block Detection: Identifies valid bullish & bearish order blocks.
✔ Unmitigated Order Blocks Highlighted: Focuses on fresh order blocks for improved trade opportunities.
✔ Trend-Focused Trading: Works best when combined with market structure analysis.
✔ Multi-Timeframe Support: Suitable for scalping, swing trading, and intraday trading.
✔ Risk Management Enhancement: Helps traders refine entries and exits based on institutional price movements.
📈 How to Use the Crystal Order Block Indicator:
🔹 Identifying Order Blocks:
➡ The indicator automatically detects order blocks formed by institutional trading activity.
➡ Unmitigated order blocks are highlighted, indicating areas where price may react.
🔹 High-Probability Trade Setups:
➡ Buy Setup: Look for a bullish order block in an uptrend, confirming strength.
➡ Sell Setup: Identify a bearish order block in a downtrend for potential short trades.
🔹 Order Block Mitigation:
➡ The updated version filters out mitigated order blocks, allowing traders to focus on fresh trading opportunities.
📊 Best Practices & Timeframes:
🔸 Works on all timeframes, but higher accuracy is observed on M30 and above.
🔸 Best suited for Smart Money Trading, Institutional Trading, and Price Action Strategies.
🔸 Should be used with liquidity concepts and market structure analysis for enhanced precision.
⚠ Important Note:
This indicator is a technical tool designed to assist traders in market analysis. It does not guarantee success and should be used alongside proper risk management and trading discipline.

Advanced Order Blocks with VolumeAdvanced Order Blocks with Volume Indicator
This professional-grade indicator combines order block detection with sophisticated volume analysis to identify high-probability trading opportunities. It automatically detects and displays bullish and bearish order blocks formed during consolidation periods, enhanced by three distinct volume calculation methods (Simple, Relative, and Weighted).
Key Features:
- Smart consolidation detection with customizable thresholds
- Volume-filtered order blocks to avoid false signals
- Automatic order block mitigation tracking
- Clear visual presentation with volume metrics
- Flexible customization options for colors and parameters
Settings:
Core Parameters:
- Consolidation Threshold %: Sets the maximum price range (0.1-1.0%) for detecting consolidation zones
- Lookback Period: Number of bars (2-10) to analyze for consolidation patterns
Volume Analysis:
- Volume Calculation Method: Choose between Simple (basic average), Relative (compared to average), or Weighted (prioritized recent volume)
- Volume Lookback Period: Historical bars (5-100) used for volume analysis
- Volume Threshold Multiplier: Minimum volume requirement (1.0-5.0x) for valid order blocks
Visual Settings:
- Bullish/Bearish OB Color: Background colors for order blocks
- Bullish/Bearish OB Text Color: Colors for volume information display
Perfect for traders focusing on institutional price levels and volume-based trading strategies. The indicator helps identify potential reversal zones with strong institutional interest, validated by significant volume conditions.
Liquidations Zones [ChartPrime]The Liquidation Zones indicator is designed to detect potential liquidation zones based on common leverage levels such as 10x, 25x, 50x, and 100x. By calculating percentage distances from recent pivot points, the indicator shows where leveraged positions are most likely to get liquidated. It also tracks buy and sell volumes in these zones, helping traders assess market pressure and predict liquidation scenarios. Additionally, the indicator features a heat map mode to highlight areas where orders and stop-losses might be clustered.
⯁ KEY FEATURES AND HOW TO USE
⯌ Leverage Zones Detection :
The indicator identifies zones where positions with leverage ratios of 100x, 50x, 25x, and 10x are at risk of liquidation. These zones are based on percentage moves from recent pivots: a 1% move can liquidate 100x positions, a 4% move affects 25x positions, and so on.
⯌ Liquidated Zones and Volume Tracking :
The indicator displays liquidated zones by plotting gray areas where the price potentually liquidate positons. It calculates the volume needed to liquidate positions in these zones, showing volume from bullish candles if short positions were liquidated and volume from bearish candles for long positions. This feature helps traders assess the risk of liquidation as the price approaches these zones.
⯌ Buy/Sell Volume Calculation :
Buy and sell volumes are calculated from the most recent pivot high or low. For buy volume, only bullish candles are considered, while for sell volume, only bearish candles are summed. This data helps traders gauge the strength of potential liquidation in different zones.
Example of buy and sell volume tracking in active zones:
⯌ Liquidity Heat Map :
In heat map mode, the indicator visualizes potential liquidity areas where orders and stop-losses may be clustered. This map highlights zones that are likely to experience liquidations based on leverage ratios. Additionally, it tracks the highest and lowest price levels for the past 100 bars, while also displaying buy and sell volumes. This feature is useful for predicting market moves driven by liquidation events.
⯁ USER INPUTS
Length : Determines the number of bars used to calculate pivots for liquidation zones.
Extend : Controls how far the liquidation zones are extended on the chart.
Leverage Options : Toggle options to display zones for different leverage levels: 10x, 25x, 50x, and 100x.
Display Heat Map : Enables or disables the liquidity heat map feature.
⯁ CONCLUSION
The Liquidation Zones indicator provides a powerful tool for identifying potential liquidation zones, tracking volume pressure, and visualizing liquidity areas on the chart. With its real-time updates and multiple features, this indicator offers valuable insights for managing risk and anticipating market moves driven by leveraged positions.

Third-order moment by TonymontanovThe "Third-order moment" indicator is designed to help traders identify asymmetries and potential turning points in a financial instrument's price distribution over a specified period. By calculating the skewness of the price distribution, this indicator provides insights into the potential future movement direction of the market.
User Parameters:
- Length: This parameter defines the number of bars (or periods) used to compute the mean and third-order moment. A longer length provides a broader historical context, which may smooth out short-term volatility.
- Source: The data input for calculations, defaulting to the closing price of each bar, although users can select alternatives like open, high, low, or any custom value to suit their analysis preferences.
Operational Algorithm:
1. Mean Calculation:
- The indicator begins by calculating the arithmetic mean of the selected data source over the specified period.
2. Third-order Moment Calculation:
- A deviation from the mean is calculated for each data point. These deviations are then cubed to capture any asymmetry in the price distribution.
- The third-order moment is determined by summing these cubed deviations over the specified length and dividing by the number of periods, providing a measure of skewness.
3. Graphical Representation:
- The indicator plots the third-order moment as a column plot. The color of the columns changes based on the sign of the moment: green for positive and red for negative, suggesting bullish and bearish skewness, respectively.
- A zero line is included to help visualize transitions between positive and negative skewness clearly.
- Additionally, the background color shifts depending on whether the third-order moment is above or below zero, further highlighting the prevailing market sentiment.
The "Third-order moment" indicator is a valuable tool for traders looking to gauge the market's skewness, helping identify potential trend continuations or reversals. By understanding the dominance of positive or negative skewness, traders can make more informed decisions.
Smart Money Setup 01 [TradingFinder]Double Order Blocks Proof🔵 Introduction
The Price Action, styled as the "Smart Money Concept" or "SMC," was introduced by Mr. David J. Crouch in 2000 and is one of the most modern technical styles in the financial world. In financial markets, Smart Money refers to capital controlled by major market players (central banks, funds, etc.), and these traders can accurately predict market trends and achieve the highest profits.
In the "Smart Money" style, various types of "order blocks" can be traded. This indicator uses a type of "order block" originating from "BoS" (Breakout of Structure). The most important feature of this indicator is the confirmation of two order blocks.
🟣 Important
For example, after the first "BoS" and the formation of the first Order Block, if a second "BoS" occurs before touching the price of the first Order Block and the formation of the second Order Block, a trading setup with 2 order blocks is formed, which confirms the dominant market trend.
For a better understanding of this subject, see the explanations in the following two images.
Bullish Setup Details :
Bearish Setup Details :
🔵 How to Use
After adding the indicator to the chart, you should wait for the formation of the trading setup. You can observe different trading positions by changing the "Time Frame" and "Pivot Period." Generally, the higher the "Time Frame" and "Pivot Period," the more valid the formed setup is.
Bullish Setup Details on Chart :
Bearish Setup Details on Chart :
You can access the "Pivot Period" input through the settings.
