Easy CotHow to Use the Commitment of Traders (COT) Report for Market Analysis
The Commitment of Traders (COT) report is a weekly publication by the Commodity Futures Trading Commission (CFTC) that breaks down the open interest in various futures markets. It categorizes traders into three main groups: Commercials, Non-Commercials, and Retail Traders (Non-Reportable positions). Understanding and analyzing the COT report can provide insights into market sentiment and potential reversals, especially in commodity, currency, and stock index futures.
Key Components of the COT Report
Commercials (Hedgers)
These are entities involved in the production or consumption of the underlying asset. For example, oil producers might hedge by selling oil futures to lock in prices, while airlines might buy futures to hedge against rising prices.
Commercials typically act as hedgers, so their positions can indicate the need for protection rather than speculative intent. Because they are less price-sensitive, their positions are usually opposite to the trend near market reversals.
Non-Commercials (Large Speculators)
This group includes hedge funds, asset managers, and large traders who take speculative positions to profit from price movements.
Non-Commercials are often trend-followers, meaning they increase long positions in an uptrend and short positions in a downtrend. When Non-Commercials become extremely bullish or bearish, it may signal a potential market reversal.
Retail Traders (Non-Reportable Positions)
These are smaller individual traders whose positions are too small to be reported individually.
Retail traders tend to be less experienced and are often on the wrong side of major market moves, so extreme positions by retail traders can sometimes signal a market turning point.
How to Interpret the COT Data
1. Identify Extreme Positions
Extreme Long or Short Positions: When a group reaches a historically extreme level of long or short positions, it often signals a potential reversal. For instance, if Non-Commercials are overwhelmingly long, it may indicate that the uptrend is overextended, and a reversal could be near.
Contrarian Indicator: Since Retail Traders are often on the wrong side, you may look for signals where they are extremely long or short, indicating a possible reversal in the opposite direction.
2. Look for Divergences
Divergence Between Groups: If Non-Commercials (speculators) and Retail Traders are moving in opposite directions, it could indicate that a trend is losing momentum and a reversal is possible.
Commercials vs. Non-Commercials: Commercials are often positioned opposite to Non-Commercials. If there’s a divergence where Non-Commercials are highly bullish, but Commercials are increasingly bearish, it might suggest a coming reversal.
3. Trend Confirmation and Reversal Signals
Trend Confirmation: If both Non-Commercials and Retail Traders are aligned in one direction, it might confirm the trend. However, keep in mind that such alignment may signal the later stages of a trend.
Reversal Signals: Look for signs when Non-Commercials are reaching a peak in one direction while Retail Traders peak in the opposite. Such situations can often indicate that the current trend is close to exhaustion.
Using the COT Report in Trading Strategies
Contrarian Trading Strategy
Extreme Positions as Reversal Signals: Use COT data to identify extreme positions. For instance, if Non-Commercials have a very high long position in a commodity, it might suggest that a bullish trend is overextended and a bearish reversal could be near.
Retail Trader Extremes: If Retail Traders are heavily long or short, consider taking the opposite position once you have additional confirmation signals (e.g., technical indicators).
Following the Trend with Large Speculators
Non-Commercials tend to be trend-followers, so if you see them increasingly long (or short) on an asset, it could be a signal to follow the trend until extreme levels are reached.
Using Divergences for Entry and Exit Points
Entry: If Non-Commercials are long, but Retail Traders are heavily short, consider entering a long position as it may confirm the trend.
Exit: If Non-Commercials begin to reduce their positions while Retail Traders increase theirs, it might be time to consider exiting, as the trend could be losing momentum.
스크립트에서 "open interest"에 대해 찾기

CoT Trend Change MomentumI discovered that whenever there's huge change in long IO or short IO there will be a momentum shift. So, I created this indicator to spot massive explosive volume changes for commercials and non commercials activity. Using standard deviation 2 and -2 as extreme point. Whatever crossing above standard deviation 2 indicating positions are added regardless whether it is long or shorts, whatever crossing below standard deviation -2 means positions are closed.
This is how I use this indicator:
1) In this example , i use only the commercials long and shorts. Whenever the longs exceed stdeviation +2, means that long volume flow in massively, for me this can be indicating potential to the upside. Whenever longs fall below stdeviation-2, for me this can be indicating that commercials are either taking profits for the short positions or accumulating for another bull price.
2) For shorts same logic applied here, when it exceeds stdeviation +2, mean commercials shorts position increase massively, when it exceeds stdeviation-2, means that commercials closed their short positions.
For this script, I use 13 weeks period as lookback, u guys may directly modify the period in the script to set the period that u want.
I've added for non-commercials as well, to ease people who emphasizes on non-commercials positioning analysis process.
I'm still trying to incorporate this with Open Interest Analysis. Hopefully u guys find this indicator useful. Feel free to modify it, to understand it more, my suggestions are u compare date by date the positions, to see the extreme points. The indicator only works in weekly chart, it is non repainted only in weekly chart, meaning that the indicator shows the histogram just as the week open.

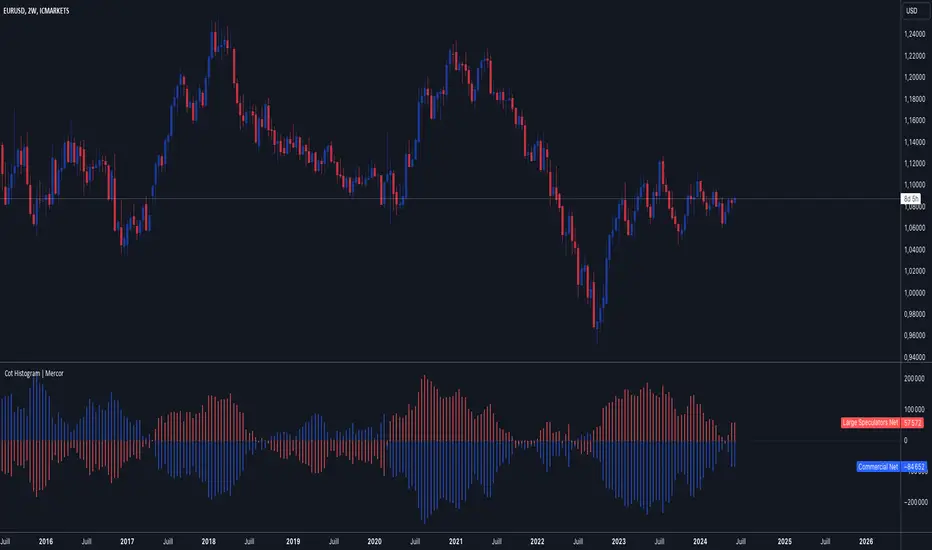
Cot Histogram | MercorCot Histogram | Mercor
Overview:
The Cot Histogram | Mercor indicator provides a comprehensive visualization of the Commitment of Traders (COT) report data using bar charts. This indicator is designed to help traders analyze the positions held by commercial traders and large speculators in various markets. By representing the data as histograms, traders can easily interpret the long and short positions, as well as the net positions of these market participants.
Originality:
What sets the Cot Histogram | Mercor indicator apart is its unique approach to visualizing COT data using bar charts instead of traditional line charts. This method offers a clearer representation of the data, making it easier for traders to spot trends and changes in market sentiment. Additionally, the indicator allows for customization of colors and bar widths, providing a tailored experience for each user.
Features:
Show Shorts as Negative Numbers: This option allows users to display short positions as negative values, providing a more intuitive visualization.
Invert Colors: Users can invert the default colors for long and short positions, enabling better contrast and visual preference.
Bar Width: Adjust the width of the histogram bars to suit personal preferences and chart aesthetics.
Concepts Underlying the Calculations:
The Commitment of Traders (COT) report is a weekly publication by the Commodity Futures Trading Commission (CFTC) that provides a breakdown of the open interest positions of market participants in futures markets. This indicator focuses on two main categories of traders:
Commercial Traders: These are entities involved in the production, processing, or merchandising of a commodity. Their positions are typically hedging-oriented.
Large Speculators: These include institutional investors, hedge funds, and other entities that take positions based on market trends and expectations, often for speculative purposes.
The indicator calculates and plots the following metrics:
Commercial Long: The number of long positions held by commercial traders.
Commercial Short: The number of short positions held by commercial traders.
Commercial Net: The difference between commercial long and short positions.
Large Speculators Long: The number of long positions held by large speculators.
Large Speculators Short: The number of short positions held by large speculators.
Large Speculators Net: The difference between long and short positions of large speculators.
How to Use:
Load the Indicator: Add the Cot Histogram | Mercor indicator to your TradingView chart.
Customize Settings: Adjust the settings according to your preferences:
Enable or disable the "Show Shorts as Negative Numbers" option.
Invert the colors if needed.
Adjust the bar width for better visual representation.
Interpret the Data: Use the histograms to analyze the market positions:
Commercial Long and Short: Observe the positions held by commercial traders. Increasing long positions may indicate hedging against potential price increases, while increasing short positions may suggest hedging against potential price decreases.
Large Speculators Long and Short: Monitor the positions of large speculators to gauge market sentiment. A rise in long positions by large speculators often indicates bullish sentiment, while a rise in short positions suggests bearish sentiment.
Net Positions: The net positions provide a clearer picture of the overall stance of commercial traders and large speculators.
Example:
If you notice that commercial traders are increasing their long positions while large speculators are increasing their short positions, it may indicate a divergence in market expectations between hedgers and speculators. This could be a signal to further investigate potential market reversals or confirm existing trends.
By leveraging the Cot Histogram | Mercor indicator, traders can gain valuable insights into market dynamics, improve their trading strategies, and make more informed decisions. Whether you are a long-term investor or a short-term trader, understanding the positions of different market participants can provide a significant edge in the markets.
Weighted Moving Range with Trend Signals (WMR-TS)Weighted Moving Range with Trend Signals (WMR-TS)
Technical analysis involves analyzing statistical trends from trading activity , such as price movement and volume, to make trading decisions. Technical indicators are mathematical calculations based on the price, volume, or open interest of a security or contract. They are used by traders to analyze price movements and predict future market behavior. The WMR-TS indicator combines weighted moving averages and range calculations to identify key trading levels and generate buy/sell signals. It dynamically adjusts to market conditions, offering traders insights into potential support, resistance, and trend reversal points. Key levels are color-coded for quick interpretation. It utilizes weighted moving averages (WMA) and range calculations to determine these levels, making it a robust tool for both trending and ranging markets.
SUMMARY
Parameters :
WMA Length : Determines the length for the primary weighted moving average.
Highest High Length : Sets the period for calculating the highest high.
Lowest Low Length : Sets the period for calculating the lowest low.
Range Corrector : Adjusts the range calculation slightly for fine-tuning.
Top Level : Multiplier for determining the top level from the calculated range.
Bottom Level : Multiplier for determining the bottom level from the calculated range.
Levels Visibility : Sets how many recent bars will display the levels.
Trading Zones :
Short Area : Highlighted zone indicating potential shorting opportunities.
Long Area : Highlighted zone indicating potential buying opportunities.
The Levels :
Wave (Yellow): Midpoint of the calculated range, adjusted by WMA.
Top Level (Red): Calculated upper boundary of the trading range.
Sell Level (Pink): Intermediate sell level.
Resistance Level (Magenta): Immediate resistance level.
Support Level (Cyan): Immediate support level.
Buy Level (Light Green): Intermediate buy level.
Bottom Level (Dark Green): Calculated lower boundary of the trading range.
Interpreting the Signals :
Hammer Signal : Red circles above bars indicate potential sell signals.
Rocket Signal : Green circles below bars indicate potential buy signals.
KEY CONCEPTS
Highest High and Lowest Low :
These values represent the highest high ( HH ) and lowest low ( LL ) over a specified number of periods.
Support Level :
This is the lower boundary of the trading range. It is a price level where demand is strong enough to prevent the price from falling further. As the price approaches the support level, it is likely to bounce back up.
Resistance Level :
This is the upper boundary of the trading range. It is a price level where supply is strong enough to prevent the price from rising further. As the price approaches the resistance level, it is likely to pull back down.
THE USE OF MULTIPLIERS :
The script uses several multipliers to adjust and fine-tune the calculated support and resistance levels, as well as to control the range and sensitivity of these levels. Here is a detailed explanation of these multipliers and their purpose:
Range Corrector : This multiplier adjusts the calculated high ( H ) and low ( L ) levels, adding flexibility to how these levels are positioned relative to the highest high and lowest low. It ranges from -1 to 1 , with a default value of 0 . The use of positive values increase the range, making the calculated levels further apart. Thus, using negative values decrease the range, bringing the calculated levels closer together.
Top Level : This multiplier adjusts the distance of the top level from the calculated high H ) level. It fluctuates from 0 to 2 , with a default value of 0.382 . Higher values will push the top level further above the high level, while lower values will bring it closer.
Bottom Level : This multiplier adjusts the distance of the bottom support level from the calculated low support level. Ranging from 0 to 2, with a default value of 0.214, the higher values will push the bottom level further below the low level, while lower values will bring it closer.
The script plots the support and resistance levels on the chart, allowing traders to visualize the trading range. Color-coded zones are used to indicate areas where buying or selling opportunities may arise based on the current price relative to the trading range. A trading range refers to the area between a price's support and resistance levels over a specific period of time. Within this range, the price of the security fluctuates up and down but does not break out above the resistance or below the support. Support and resistance levels to make trading decisions. Buying near the support level and selling near the resistance level is a common strategy. When the price moves above the resistance level, it is called a breakout . A breakout often indicates that the price may start a new upward trend . Conversely, when the price moves below the support level, it is called a breakdown . A breakdown often indicates that the price may start a new downward trend . By understanding and utilizing trading ranges, traders can make more informed decisions, optimize their trading strategies, and manage risk more effectively.
Understanding Moving Averages
A moving average (MA) is a widely used technical indicator that helps smooth out price data by creating a constantly updated average price. The main purpose of using a moving average is to identify the direction of the trend and to reduce the "noise" of random price fluctuations. The Weighted Moving Average ( WMA ) assigns different weights to each period, with more recent periods typically given more weight. A 10-day WMA might give the most recent day a weight of 10, the second most recent day a weight of 9, and so on. It is useful for traders who want to emphasize recent price data more than older data. When the price is above the moving average, it suggests an Bullish trend . A Bearish Trend is expected to take place when the price is below the moving average. Understanding the price reactions around these levels can be used to make trading decisions.
APPLYING CONCEPTS
Support and Resistance Calculations in the Script :
The script calculates dynamic support and resistance levels using weighted moving averages ( WMA s) and the highest high and lowest low over specified periods. Buy ( Rocket ) and sell ( Hammer ) signals are generated based on the crossing of the price with calculated top and bottom levels.These signals help traders identify potential entry and exit points within the trading range .
Weighted Moving Average (WMA) Application in the Script
This script calculates a special trendWMA using the close price that helps in creating a more dynamic moving average that considers both high and low price actions. This modified WMA is used in conjunction with highest high and lowest low values over specified periods to calculate dynamic support and resistance levels.
Explanation of the Levels in the Script
By understanding these levels, traders can make more informed decisions about where to enter and exit trades, manage risk, and anticipate potential market movements. The script incorporates several key levels levels that traders can use to better anticipate price movements and make more informed trading decisions. Leveraging the principles of Fibonacci retracement ratios ( 23.6%, 38.2%, 50%, 61.8%, and 100% ) to identify key support and resistance zones can also serve for gauging the overall market sentiment.
Top Level and Sell Leve l: Used to identify potential resistance zones where the price may reverse or pause.
Support Level and Buy Level : Used to identify potential support zones where the price may bounce.
Upper and Lower Pivot Values : Serve as intermediate levels for possible price retracements or extensions within the trading range.
Wave Level : Indicates the central trend direction, which can be useful for gauging the overall market sentiment.
Alerts are a crucial part of the script as they notify traders of potential buy and sell signals based on predefined conditions. There are two main alerts: one for a " Hammer " signal (sell condition) and one for a " Rocket " signal (buy condition).
Adjust the input parameters to fit your trading style and the specific asset being analyzed. Shorter lengths may be more responsive to price changes but can produce more false signals , while longer lengths provide smoother signals but may lag . Always backtest the indicator on historical data to understand its behavior and performance. Also remember that different markets may require different parameter settings for optimal performance.
Keep in mind that by nature like all moving averages, WMAs lag behind price action. This means that signals may be delayed. The indicator performs differently in various market conditions. Always consider the overall market context when interpreting signals.
Adjusting parameters like the range corrector and visibility can help tailor the indicator to specific market conditions or trading strategies, improving its effectiveness. The script uses the calculated levels to plot lines and fill zones on the chart, helping traders visualize potential support, resistance, and trend reversal points. The use of multipliers allows for dynamic adjustment of these levels, making the indicator flexible and adaptable to different market conditions.
I think traders can make more informed decisions about where to enter and exit trades, manage risk, and anticipate potential market movements following this code. Stay safe and always remember that market is always changing. Use this tool if you want, please stay informed and plan safe trades,
D.

RSI Screener / Heatmap - By LeviathanThis script allows you to quickly scan the market by displaying the RSI values of up to 280 tickers at once and visualizing them in an easy-to-understand format using labels with heatmap coloring.
📊 Source
The script can display the RSI from a custom timeframe (MTF) and custom length for the following data:
- Price
- OBV (On Balance Volume)
- Open Interest (for crypto tickers)
📋 Ticker Selection
This script uses a different approach for selecting tickers. Instead of inputting them one by one via input.symbol(), you can now copy-paste or edit a list of tickers in the text area window. This approach allows users to easily exchange ticker lists between each other and, for example, create multiple lists of tickers by sector, market cap, etc., and easily input them into the script. Full credit to @allanster for his functions for extracting tickers from the text. Users can switch between 7 groups of 40 tickers each, totaling 280 tickers.
🖥️ Display Types
- Screener with Labels: Each ticker has its own color-coded label located at its RSI value.
- Group Average RSI: A standard RSI plot that displays the average RSI of all tickers in the group.
- RSI Heatmap (coming soon): Color-coded rows displaying current and historical values of tickers.
- RSI Divergence Heatmap (coming soon): Color-coded rows displaying current and historical regular/hidden bullish/bearish divergences for tickers.
🎨 Appearance
Appearance is fully customizable via user inputs, allowing you to change heatmap/gradient colors, zone coloring, and more.

Gaussian Price Filter [BackQuant]Gaussian Price Filter
Overview and History of the Gaussian Transformation
The Gaussian transformation, often associated with the Gaussian (normal) distribution, is a mathematical function characteristically prominent in statistics and probability theory. The bell-shaped curve of the Gaussian function, expressing the normal distribution, is ubiquitously employed in various scientific and engineering disciplines, including financial market analysis. This transformation's core utility in trading and economic forecasting is derived from its efficacy in smoothing data series and highlighting underlying trends, which are pivotal for making strategic trading decisions.
The Gaussian filter, specifically, is a type of data-smoothing algorithm that mitigates the random "noise" of market price data, thus enhancing the visibility of crucial trend changes and patterns. Historically, this concept was adapted from fields such as signal processing and image editing, where precise extraction of useful information from noisy environments is critical.
1. What is a Gaussian Transformation?
A Gaussian transformation involves the application of a Gaussian function to a set of data points. The function is applied as a filter in the context of trading algorithms to smooth time series data, which helps in identifying the intrinsic trends obscured by market volatility. The transformation is characterized by its parameter, sigma (σ), representing the standard deviation, which determines the width of the Gaussian bell curve. The breadth of this curve impacts the degree of smoothing: a wider curve (higher sigma value) results in more smoothing, beneficial for longer-term trend analysis.
2. Filtering Price with Gaussian Transformation and its Benefits
In the provided Script, the Gaussian transformation is utilized to filter price data. The filtering process involves convolving the price data with Gaussian weights, which are calculated based on the chosen length (the number of data points considered) and sigma. This convolution process smooths out short-term fluctuations and highlights longer-term movements, facilitating a clearer analysis of market trends.
Benefits:
Reduces noise: It filters out minor price movements and random fluctuations, which are often misleading.
Enhances trend recognition: By smoothing the data, it becomes easier to identify significant trends and reversals.
Improves decision-making: Traders can make more informed decisions by focusing on substantive, smoothed data rather than reacting to random noise.
3. Potential Limitations and Issues
While Gaussian filters are highly effective in smoothing data, they are not without limitations:
Lag introduction: Like all moving averages, the Gaussian filter introduces a lag between the actual price movements and the output signal, which can delay decision-making.
Feature blurring: Over-smoothing might obscure significant price movements, especially if a large sigma is used.
Parameter sensitivity: The choice of length and sigma significantly affects the output, requiring optimization and backtesting to determine the best settings for specific market conditions.
4. Extending Gaussian Filters to Other Indicators
The methodology used to filter price data with a Gaussian filter can similarly be applied to other technical indicators, such as RSI (Relative Strength Index) or MACD (Moving Average Convergence Divergence). By smoothing these indicators, traders can reduce false signals and enhance the reliability of the indicators' outputs, leading to potentially more accurate signals and better timing for entering or exiting trades.
5. Application in Trading
In trading, the Gaussian Price Filter can be strategically used to:
Spot trend reversals: Smoothed price data can more clearly indicate when a trend is starting to change, which is crucial for catching reversals early.
Define entry and exit points: The filtered data points can help in setting more precise entry and exit thresholds, minimizing the risk and maximizing the potential return.
Filter other data streams: Apply the Gaussian filter on volume or open interest data to identify significant changes in market dynamics.
6. Functionality of the Script
The script is designed to:
Calculate Gaussian weights (f_gaussianWeights function): Generates the weights used for the Gaussian kernel based on the provided length and sigma.
Apply the Gaussian filter (f_applyGaussianFilter function): Uses the weights to compute the smoothed price data.
Conditional Trend Detection and Coloring: Determines the trend direction based on the filtered price and colors the price bars on the chart to visually represent the trend.
7. Specific Actions of This Code
The Pine Script provided by BackQuant executes several specific actions:
Input Handling: It allows users to specify the source data (src), kernel length, and sigma directly in the chart settings.
Weight Calculation and Normalization: Computes the Gaussian weights and normalizes them to ensure their sum equals one, which maintains the original data scale.
Filter Application: Applies the normalized Gaussian kernel to the price data to produce a smoothed output.
Trend Identification and Visualization: Identifies whether the market is trending upwards or downwards based on the smoothed data and colors the bars green (up) or red (down) to indicate the trend direction.

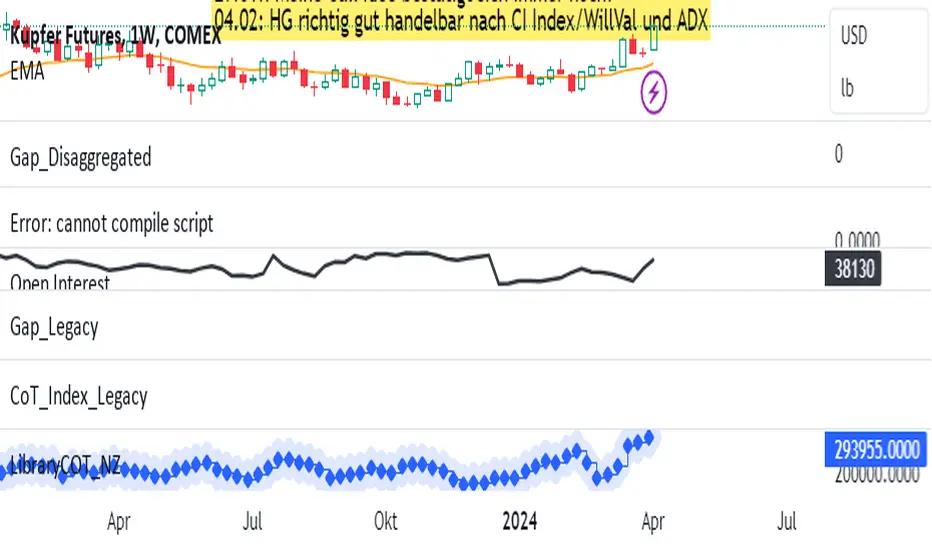
LibraryCOT_NZLibrary "LibraryCOT_NZ"
This library provides tools to help Pine programmers fetch Commitment of Traders (COT) data for futures.
rootToCFTCCode(root)
Accepts a futures root and returns the relevant CFTC code.
Parameters:
root (simple string) : Root prefix of the future's symbol, e.g. "ZC" for "ZC1!"" or "ZCU2021".
Returns: The part of a COT ticker corresponding to `root`, or "" if no CFTC code exists for the `root`.
currencyToCFTCCode(currency)
Converts a currency string to its corresponding CFTC code.
Parameters:
currency (simple string)
Returns: The corresponding to the currency, if one exists.
optionsToTicker(includeOptions)
Returns the part of a COT ticker using the `includeOptions` value supplied, which determines whether options data is to be included.
Parameters:
includeOptions (simple bool) : A "bool" value: 'true' if the symbol should include options and 'false' otherwise.
Returns: The part of a COT ticker: "FO" for data that includes options and "F" for data that doesn't.
metricNameAndDirectionToTicker(metricName, metricDirection)
Returns a string corresponding to a metric name and direction, which is one component required to build a valid COT ticker ID.
Parameters:
metricName (simple string) : One of the metric names listed in this library's chart. Invalid values will cause a runtime error.
metricDirection (simple string) : Metric direction. Possible values are: "Long", "Short", "Spreading", and "No direction". Valid values vary with metrics. Invalid values will cause a runtime error.
Returns: The part of a COT ticker ID string, e.g., "OI_OLD" for "Open Interest" and "No direction", or "TC_L" for "Traders Commercial" and "Long".
typeToTicker(metricType)
Converts a metric type into one component required to build a valid COT ticker ID. See the "Old and Other Futures" section of the CFTC's Explanatory Notes for details on types.
Parameters:
metricType (simple string) : Metric type. Accepted values are: "All", "Old", "Other".
Returns: The part of a COT ticker.
convertRootToCOTCode(mode, convertToCOT)
Depending on the `mode`, returns a CFTC code using the chart's symbol or its currency information when `convertToCOT = true`. Otherwise, returns the symbol's root or currency information. If no COT data exists, a runtime error is generated.
Parameters:
mode (simple string) : A string determining how the function will work. Valid values are:
"Root": the function extracts the futures symbol root (e.g. "ES" in "ESH2020") and looks for its CFTC code.
"Base currency": the function extracts the first currency in a pair (e.g. "EUR" in "EURUSD") and looks for its CFTC code.
"Currency": the function extracts the quote currency ("JPY" for "TSE:9984" or "USDJPY") and looks for its CFTC code.
"Auto": the function tries the first three modes (Root -> Base Currency -> Currency) until a match is found.
convertToCOT (simple bool) : "bool" value that, when `true`, causes the function to return a CFTC code. Otherwise, the root or currency information is returned. Optional. The default is `true`.
Returns: If `convertToCOT` is `true`, the part of a COT ticker ID string. If `convertToCOT` is `false`, the root or currency extracted from the current symbol.
COTTickerid(COTType, CFTCCode, includeOptions, metricName, metricDirection, metricType)
Returns a valid TradingView ticker for the COT symbol with specified parameters.
Parameters:
COTType (simple string) : A string with the type of the report requested with the ticker, one of the following: "Legacy", "Disaggregated", "Financial".
CFTCCode (simple string)
includeOptions (simple bool) : A boolean value. 'true' if the symbol should include options and 'false' otherwise.
metricName (simple string) : One of the metric names listed in this library's chart.
metricDirection (simple string) : Direction of the metric, one of the following: "Long", "Short", "Spreading", "No direction".
metricType (simple string) : Type of the metric. Possible values: "All", "Old", and "Other".
Returns: A ticker ID string usable with `request.security()` to fetch the specified Commitment of Traders data.
CVD Divergence Strategy.1.mmThis is the matching Strategy version of Indicator of the same name.
As a member of the K1m6a Lions discussion community we often use versions of the Cumulative Volume Delta indicator
as one of our primary tools along with RSI, RSI Divergences, Open interest, Volume Profile, TPO and Fibonacci levels.
We also discuss visual interpretations of CVD Divergences across multiple time frames much like RSI divergences.
RSI Divergences can be identified as possible Bullish reversal areas when the RSI is making higher low points while
the price is making lower low points.
RSI Divergences can be identified as possible Bearish reversal areas when the RSI is making lower high points while
the price is making higher high points.
CVD Divergences can also be identified the same way on any timeframe as possible reversal signals. As with RSI, these Divergences
often occur as a trend's momentum is giving way to lower volume and areas when profits are being taken signaling a possible reversal
of the current trending price movement.
Hidden Divergences are identified as calculations that may be signaling a continuation of the current trend.
Having not found any public domain versions of a CVD Divergence indicator I have combined some public code to create this
indicator and matching strategy. The calculations for the Cumulative Volume Delta keep a running total for the differences between
the positive changes in volume in relation to the negative changes in volume. A relative upward spike in CVD is created when
there is a large increase in buying vs a low amount of selling. A relative downward spike in CVD is created when
there is a large increase in selling vs a low amount of buying.
In the settings menu, the is a drop down to be used to view the results in alternate timeframes while the chart remains on current timeframe. The Lookback settings can be adjusted so that the divs show on a more local, spontaneous level if set at 1,1,60,1. For a deeper, wider view of the divs, they can be set higher like 7,7,60,7. Adjust them all to suit your view of the divs.
To create this indicator/strategy I used a portion of the code from "Cumulative Volume Delta" by @ contrerae which calculates
the CVD from aggregate volume of many top exchanges and plots the continuous changes on a non-overlay indicator.
For the identification and plotting of the Divergences, I used similar code from the Tradingview Technical "RSI Divergence Indicator"
This indicator should not be used as a stand-alone but as an additional tool to help identify Bullish and Bearish Divergences and
also Bullish and Bearish Hidden Divergences which, as opposed to regular divergences, may indicate a continuation.

CVD Divergence Indicator.1.mmAs a member of the K1m6a Lions discussion community we often use versions of the Cumulative Volume Delta indicator
as one of our primary tools along with RSI, RSI Divergences, Open interest, Volume Profile, TPO and Fibonacci levels.
We also discuss visual interpretations of CVD Divergences across multiple time frames much like RSI divergences.
RSI Divergences can be identified as possible Bullish reversal areas when the RSI is making higher low points while
the price is making lower low points.
RSI Divergences can be identified as possible Bearish reversal areas when the RSI is making lower high points while
the price is making higher high points.
CVD Divergences can also be identified the same way on any timeframe as possible reversal signals. As with RSI, these Divergences
often occur as a trend's momentum is giving way to lower volume and areas when profits are being taken signaling a possible reversal
of the current trending price movement.
Hidden Divergences are identified as calculations that may be signaling a continuation of the current trend.
Having not found any public domain versions of a CVD Divergence indicator I have combined some public code to create this
indicator and matching strategy. The calculations for the Cumulative Volume Delta keep a running total for the differences between
the positive changes in volume in relation to the negative changes in volume. A relative upward spike in CVD is created when
there is a large increase in buying vs a low amount of selling. A relative downward spike in CVD is created when
there is a large increase in selling vs a low amount of buying.
In the settings menu, the is a drop down to be used to view the results in alternate timeframes while the chart remains on current timeframe. The Lookback settings can be adjusted so that the divs show on a more local, spontaneous level if set at 1,1,60,1. For a deeper, wider view of the divs, they can be set higher like 7,7,60,7. Adjust them all to suit your view of the divs.
To create this indicator/strategy I used a portion of the code from "Cumulative Volume Delta" by @ contrerae which calculates
the CVD from aggregate volume of many top exchanges and plots the continuous changes on a non-overlay indicator.
For the identification and plotting of the Divergences, I used similar code from the Tradingview Technical "RSI Divergence Indicator"
This indicator should not be used as a stand-alone but as an additional tool to help identify Bullish and Bearish Divergences and
also Bullish and Bearish Hidden Divergences which, as opposed to regular divergences, may indicate a continuation.

Asset Rotation ApertureAsset Rotation Aperture visualizes volume accumulation momentum, of multiple assets, side by side.
It's a surgical, multi-purpose leading indicator of price, market narratives and capital rotation.
Each colored line represents the rolling cumulative volume (or open interest) of an asset, index, narrative, or symbol equation. Normalized to each other, relative to each other.
This enables Asset Rotation Aperture to visualize assets and narratives with dramatically different market caps (and therefore different volume accumulation profiles), side by side.
METRIC CONSTRUCTION
Asset Rotation Aperture is a fork of Money Flow Index, like a centered On Balance Volume.
Modified to more effectively lead price, smoothed to more clearly visualize with clarity, and recursively printed.
SYMBOL SELECTION
I highly recommend selecting symbols from exchanges that dominate volume for the asset(s) you're visualizing.
For crypto, this typically means Binance pairs.
Keep the exchange consistent across symbols whenever possible.
To construct an index / narrative, use the following formula format:
(BINANCE:UNIUSDT*BINANCE:SNXUSDT*BINANCE:AAVEUSDT*BINANCE:CRVUSDT)^(1/4)
THE Y AXIS
The Y axis represents the asset's percentage of volume accumulated, relative to its norm AND relative to other assets.
It's a made up figure, and I recommend ignoring it.
A visual scan of the data viz is more effective than studying any Y-axis output.

COT MCIThe COT MCI script is a market indicator based on the data from the Commitment of Traders Reports.
Integration of COT Report Data:
The script sources COT data from futures contracts, including:
Treasury Bonds (ZB), Dollar Index (DX), 10-Year Treasury Notes (ZN)
Commodities like Soybeans (ZS), Soy Meal (ZM), Soy Oil (ZL), Corn (ZC), Wheat (ZW), Kansas City Wheat (KE), Pork (HE), Cattle (LE)
Precious Metals such as Gold (GC), Silver (SI), Palladium (PA), Platinum (PL)
Industrial Metals like Copper (HG), Aluminum (AUP), Steel (HRC)
Energy Products like Crude Oil (CL), Heating Oil (HO), Gasoline (RB), Natural Gas (NG), Brent Crude (BB)
Currencies such as AUD (6A), GBP (6B), CAD (6C), EUR (6E), JPY (6J), CHF (6S), NZD (6N), BRL (6L), MXN (6M), RUB (6R), ZAR (6Z)
Others: Sugar (SB), Coffee (KC), Cocoa (CC), Cotton (CT), Ethanol (EH), Rice (ZR), Oats (ZO), Whey (DC), Orange Juice (OJ), Lumber (LBS), Livestock (GF), E-mini S&P 500 (ES), E-mini Russell 2000 (RTY), E-mini Dow Jones (YM), E-mini NASDAQ-100 (NQ), VIX Futures (VX), S&P 500 (SP), DJIA (DJIA)
Cryptocurrencies such as Bitcoin (BTC) and Ethereum (ETH)
Functions and Logic of the Script:
COT Calculation: Determines the net positions for commercial actors and large speculators. Also Available are short and long positions of commercials or large speculators.
Position Change Analysis: Analyzes the percentage changes in net positions and open interest data over a period of 6 weeks (Weekly Chart).
Average Value Calculation: Determines short-term and long-term trend averages.
Trend Analysis: Buy and sell signals (represented in colors) are based on linear regressions and average calculations.
Usage and Application Examples:
Ideal for traders looking for a detailed analysis of market dynamics and position changes in the futures market. Suitable for decision-making in transaction timing and assessing market sentiment.
Usage Notes:
Users should be familiar with the interpretation of COT data and basic concepts of futures trading. Particularly suitable for medium to long-term trading strategies.

Liquidation Ranges + Volume/OI Dots [Kioseff Trading]Hello!
Introducing a multi-faceted indicator "Liquidation Ranges + Volume Dots" - this indicator replicates the volume dot tools found on various charting platforms and populates a liquidation range on crypto assets!
Features
Volume/OI dots populated according to user settings
Size of volume/OI dots corresponds to degree of abnormality
Naked level volume dots
Fixed range capabilities for volume/OI dots
Visible time range capabilities for volume/OI dots
Lower timeframe data used to discover iceberg orders (estimated using 1-minute data)
S/R lines drawn at high volume/OI areas
Liquidation ranges for crypto assets (10x - 100x)
Liquidation ranges are calculated using a popular crypto exchange's method
# of violations of liquidation ranges are recorded and presented in table
Pertinent high volume/OI price areas are recorded and presented in table
Personalized coloring for volume/OI dots
Net shorts / net long for the price range recorded
Lines shows reflecting net short & net long increases/decreases
Configurable volume/OI heatmap (displayed between liquidation ranges)
And some more (:
Liquidation Range
The liquidation range component of the indicator uses a popular crypto exchange's calculation (for liquidation ranges) to populate the chart for where 10x - 100x leverage orders are stopped out.
The image above depicts features corresponding to net shorts and net longs.
The image above shows features corresponding to liquidation zones for the underlying coin.
The image above shows the option to display volume/oi delta at the time the corresponding grid was traded at.
The image above shows an instance of using the "fixed range" feature for the script.
*The average price of the range is calculated to project liquidation zones.
*Heatmap is calculated using OI (or volume) delta.
Huge thank you to Pine Wizard @DonovanWall for his range filter code!
Price ranges are automatically detected using his calculation (:
Volume / OI Dots
Similar to other charting platforms, the volume/OI dots component of the indicator distinguishes "abnormal" changes in volume/OI; the detected price area is subsequently identified on the chart.
The detection method uses percent rank and calculates on the last bar of the chart. The "agelessness" of detection is contingent on user settings.
The image above shows volume dots in action; the size of each volume dot corresponds to the amount of volume at the price area.
Smaller dots = lower volume
Larger dots = higher volume
The image above exemplifies the highest aggression setting for volume/OI dot detection.
The table oriented top-right shows the highest volume areas (discovered on the 1-minute chart) for the calculated period.
The open interest change and corresponding price level are also shown. Results are listed in descending order but can also be listed in order of occurrence (most relevant).
Additionally, you can use the visible time range feature to detect volume dots.
The feature shows and explains how the visible range feature works. You select how many levels you want to detect and the script will detect the selected number of levels.
For instance, if I select to show 20 levels, the script will find the 20 highest volume/OI change price areas and distinguish them.
The image above shows a narrower price range.
The image above shows the same price range; however, the script is detecting the highest OI change price areas instead of volume.
* You can also set a fixed range with this feature
* Naked levels can be used
Additionally, you can select for the script to show only the highest volume/ OI change price area for each bar. When active, the script will successively identify the highest volume / OI change price area for the most recent bars.
Naked Levels
The image above shows and explains how naked levels can be detected when using the script.
And that's pretty much it!
Of course, there're a few more features you can check out when you use the script that haven't been explained here (:
Thank you again to @DonovanWall
Thank you to @Trendoscope for his binary insertion sort library (:
Thank you to @PineCoders for their time library
Thank you for checking this out!

ICT Commitment of Traders° by toodegreesDescription:
The Commitment of Traders (COT) is a valuable raw data report released weekly by the Commodity Futures Trading Commission (CFTC). This report offers insights into the current long and short positions of three key market entities:
Commercial Traders ( usually represented in red )
Large Traders ( typically depicted in green )
Small Speculator Traders ( commonly shown in blue )
The concept of utilizing the COT data as a strategic trading tool was first introduced by Larry Williams, who emphasized the importance of monitoring Commercial Speculators – large corporate producers or consumers of commodities.
The Inner Circle Trader (ICT) prompts us to delve deeper into this data. While we can easily determine their Net Position (also referred to as the Main Program) by subtracting Commercial Short Positions from the Commercial Long Positions, this calculation doesn't reveal their ongoing Hedge Program .
Merely following the Main Program won't provide a trading edge. Aligning with the Hedge Program can be an invaluable weapon in your trading arsenal.
The Commercial Speculators' Hedge Program can be unveiled by examining the highest and lowest reading of their Net Position over a chosen time period and setting a new "zero line" between these extremes. This process generates a novel "COT Graph" providing a detailed understanding of the Commercial Speculators' current market activity.
When the Hedge Program, Seasonality, and Open Interest are cross-referenced with Institutional Orderflow, a trader can construct a very clear medium-to-long-term market narrative.
Features:
Access COT Data for the Commercial Speculators via Tradingview's reliable data source
Automate calculations and display the 3-month, 6-month, 12-month, 2-year, and 3-year Hedge Program
Define your own Custom Time Range for the Hedge Program
Display the Main Program and all Hedge Programs in an easy-to-understand table format
Additionally, by following the included instructions, you can augment your table with COT data from multiple markets. This extra information can help monitor correlated markets and develop a more robust market narrative:

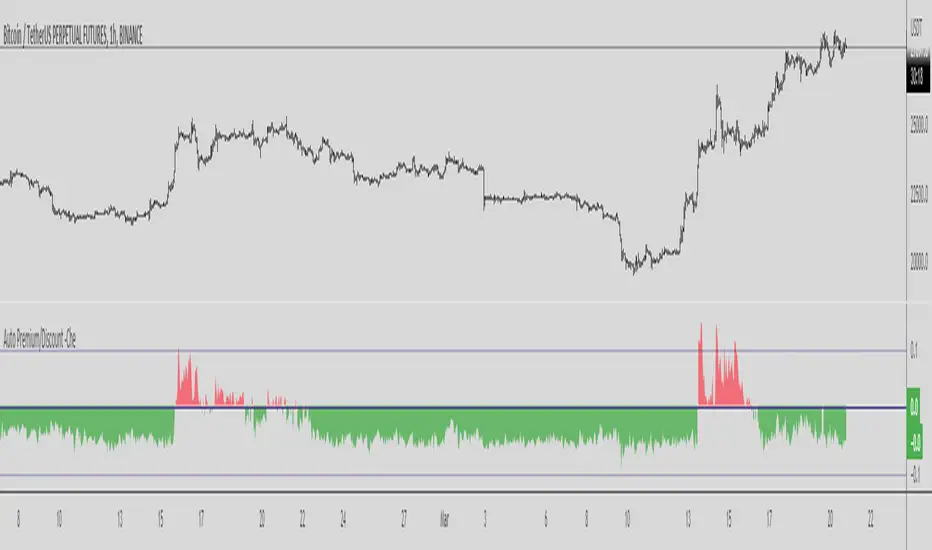
Binance Auto Spot-Futures Premium/Discount -CheThis Script is based in the 2020 @Plumptoiletduck script
Special thanks to @tartigradia for the Auto Detect code for the Binance pair.
It tells us the difference in price between Spot and Perpetual Futures.
Now I incorporated the function that automatically detects the pair we are in to show the premium/discount of that pair.
You never need to select the currency you are in the script anymore!
It is specially designed for Binance coins, it includes all perpetuals.
How to use it?
Usually if the Futures are higher than the Spot it indicates that we are in an over exposure zone of longs in futures.
If the spot is cheaper than the futures it means that the futures are more fearful.
You can use this script with an Open Interest script to get an idea of what is going on.
Other examples:
Herrick Payoff Index DailyModified to include new daily open interest from CME futures contracts versus old script that only captured weekly data from commitment of traders data. Script can now be used on monthly and continuous contract traded on CME.

LibraryCOTLibrary "LibraryCOT"
This library provides tools to help Pine programmers fetch Commitment of Traders (COT) data for futures.
rootToCFTCCode(root)
Accepts a futures root and returns the relevant CFTC code.
Parameters:
root : Root prefix of the future's symbol, e.g. "ZC" for "ZC1!"" or "ZCU2021".
Returns: The part of a COT ticker corresponding to `root`, or "" if no CFTC code exists for the `root`.
currencyToCFTCCode(curr)
Converts a currency string to its corresponding CFTC code.
Parameters:
curr : Currency code, e.g., "USD" for US Dollar.
Returns: The corresponding to the currency, if one exists.
optionsToTicker(includeOptions)
Returns the part of a COT ticker using the `includeOptions` value supplied, which determines whether options data is to be included.
Parameters:
includeOptions : A "bool" value: 'true' if the symbol should include options and 'false' otherwise.
Returns: The part of a COT ticker: "FO" for data that includes options and "F" for data that doesn't.
metricNameAndDirectionToTicker(metricName, metricDirection)
Returns a string corresponding to a metric name and direction, which is one component required to build a valid COT ticker ID.
Parameters:
metricName : One of the metric names listed in this library's chart. Invalid values will cause a runtime error.
metricDirection : Metric direction. Possible values are: "Long", "Short", "Spreading", and "No direction". Valid values vary with metrics. Invalid values will cause a runtime error.
Returns: The part of a COT ticker ID string, e.g., "OI_OLD" for "Open Interest" and "No direction", or "TC_L" for "Traders Commercial" and "Long".
typeToTicker(metricType)
Converts a metric type into one component required to build a valid COT ticker ID. See the "Old and Other Futures" section of the CFTC's Explanatory Notes for details on types.
Parameters:
metricType : Metric type. Accepted values are: "All", "Old", "Other".
Returns: The part of a COT ticker.
convertRootToCOTCode(mode, convertToCOT)
Depending on the `mode`, returns a CFTC code using the chart's symbol or its currency information when `convertToCOT = true`. Otherwise, returns the symbol's root or currency information. If no COT data exists, a runtime error is generated.
Parameters:
mode : A string determining how the function will work. Valid values are:
"Root": the function extracts the futures symbol root (e.g. "ES" in "ESH2020") and looks for its CFTC code.
"Base currency": the function extracts the first currency in a pair (e.g. "EUR" in "EURUSD") and looks for its CFTC code.
"Currency": the function extracts the quote currency ("JPY" for "TSE:9984" or "USDJPY") and looks for its CFTC code.
"Auto": the function tries the first three modes (Root -> Base Currency -> Currency) until a match is found.
convertToCOT : "bool" value that, when `true`, causes the function to return a CFTC code. Otherwise, the root or currency information is returned. Optional. The default is `true`.
Returns: If `convertToCOT` is `true`, the part of a COT ticker ID string. If `convertToCOT` is `false`, the root or currency extracted from the current symbol.
COTTickerid(COTType, CTFCCode, includeOptions, metricName, metricDirection, metricType)
Returns a valid TradingView ticker for the COT symbol with specified parameters.
Parameters:
COTType : A string with the type of the report requested with the ticker, one of the following: "Legacy", "Disaggregated", "Financial".
CTFCCode : The for the asset, e.g., wheat futures (root "ZW") have the code "001602".
includeOptions : A boolean value. 'true' if the symbol should include options and 'false' otherwise.
metricName : One of the metric names listed in this library's chart.
metricDirection : Direction of the metric, one of the following: "Long", "Short", "Spreading", "No direction".
metricType : Type of the metric. Possible values: "All", "Old", and "Other".
Returns: A ticker ID string usable with `request.security()` to fetch the specified Commitment of Traders data.

.b pin-up symbolWhen trading cryptocoins, it is necessary to check the price trend of NASDAQ, BTC.D, BTC.OI, BTC spot or other coins of similar groups.
However it is very cumbersome to put a comparison symbol in the Tradingview chart and combine individual indicators one by one.
Moreover even with such a combination, the chart is messy and visibility is not good.
This script was developed as a composite-solution to that situation, and will make you happy.
- NQ1!, USTECH100CFD | symbol fixed
- BTC.Dominance, BTC.OpenInterest, BTC symbol, others pin-up-symbol | selectable
- Pin-up-symbol | selectable
- Pin-up-symbol's candle chart
- Trending
* EMA 9,21,50,200 ribbon classic EMA
* .b price line ; .b price = unique trending price with price-action + relative-volume-action + ATR
* Dynamic S/R Cloud ; BB + donchian band + high/low + atr mixed custom-logic
* VWWMA + .b price Shadow ; Volume-weighted WMA on .b price = unique MA faster than classic VWMA
Trending shadow direction is not bad even on low-timeframe (1, 2, 3, 5m, 15m...)
- Pattern
* Harmonic Pattern ; A simplified version of the harmonic pattern indicator, simply show-up pattern complete position
for reference only - adopted from HeWhoMustNotBeNamed's script.
- Information Panel
* BTC Dominance, BTC Open Interest, Pin-Up-Symbol price
* Trend meter ; 5,15,30,1h,2h,4h Meter Calc with 1 minute-timeframe candles
5 = Green if the current price is higher than the price 5 minutes ago.
1h = Green if the current price is higher than the price 2 hours ago.
4h = Red if the current price is lower than the price 4 hours ago.
* caution ; To use real-time chart of "CME_MINI:NQ1!" you have to additional subscribe CME data,
default setting is 'NQ1!' , you can change to 'USTECH100CFD'
* When you choose symbol which is closed trading hours, the script's update stopped.
Even if the selected pin-up-symbol is on trading hours, the currently selected symbol's chart doesn't update.
* recommended | chart setting > Appearance : Top margin 0%, Bottom margin 0% for optimized screen usage :)
if you have any questions freely contact to me by message on tradingview, or telegram @sr_bt
but please understand that responses may be quite late.
------------------------------------------------------------------------------------------------------------------------------------------------------------
copyright 2022 (sr_b)
Special thanks to all of contributors of community.
The script (originaly .b) may be freely distributed under the MIT license.
The other classic script code also may be freely distributed under the MIT license.
Simplified Harmonic script part | core adopted from 'Multi ZigZag Harmonic Patterns (HeWhoMustNotBeNamed)' MPL2.0 license

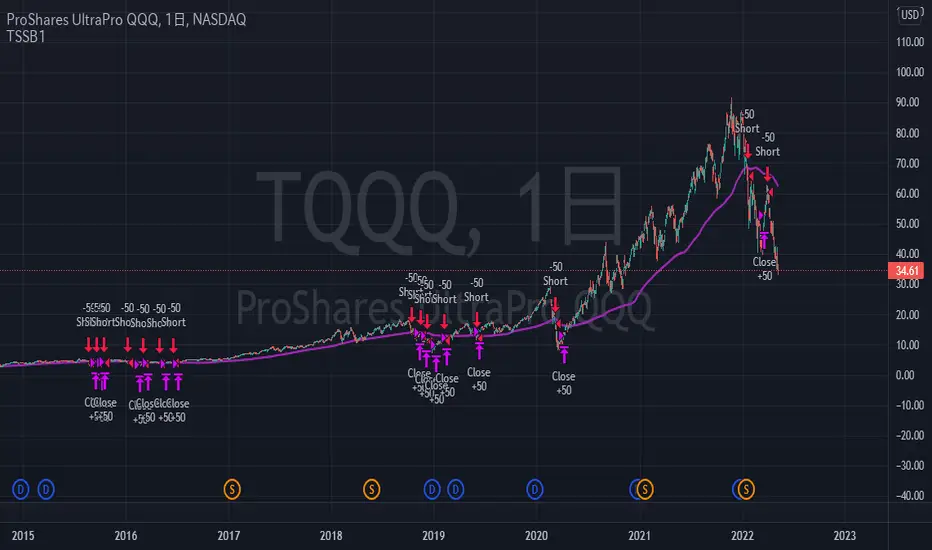
TriautoETF(TQQQ) Short Strategy B1○ Objective.
This is a strategy for the TQQQ NASDAQ:TQQQ short strategy in the TriAuto ETF .
It is used as a hedging short rather than for profit-making purposes.
Entry and close points are indicated.
○ Strategy
The strategy is to hold a short position when the price falls below the moving average line, which is a market-conscious line that is rarely broken.
The close (settlement) is determined by using the moving average.
The moving average is based on the market-conscious QQQ NASDAQ:QQQ .
This script is used on the daily chart of the TQQQ.
It works as a hedge for long positions because open interest is held even at the major bottoms of the China and Corona shocks.
The system is set up to quickly cut its losses even if the moving average is "tricked" into falling below the moving average.
COT Net Positions BTC & ETH FO_ALLWeekly Commitment of Traders Report for Futures positions, as well as futures plus options positions.
This is only for Bitcoin and Ether.
OPEN INTEREST
DEALER
ASSET MANAGER
LEVERAGED FUNDS
OTHER REPORTABLE
TOTAL REPORTABLE
NON REPORTABLE
AnyChartI changed few lines of code from TradingView's original Open Interest indicator to make this one. I wanted to compare other charts to while entering my trade like looking at BTC when trading in alts. It has option to view any chart. Add other things to improve your analysis.

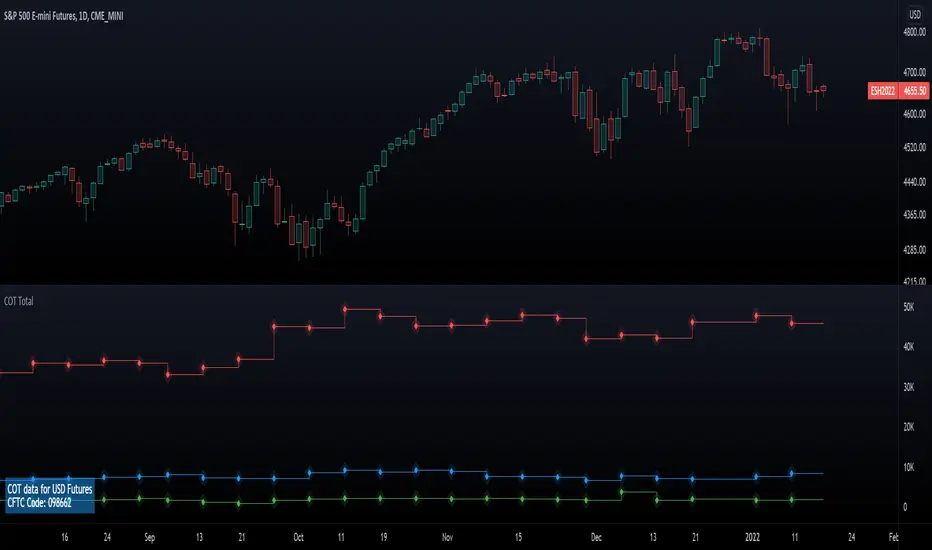
Commitment of Traders: Total█ OVERVIEW
This indicator displays the Commitment of Traders (COT) totals data for futures markets.
█ CONCEPTS
Commitment of Traders (COT) data is tallied by the Commodity Futures Trading Commission (CFTC) , a US federal agency that oversees the trading of derivative markets such as futures in the US. It is weekly data that provides traders with information about open interest for an asset. The CFTC oversees derivative markets traded on different exchanges, so COT data is available for assets that can be traded on CBOT, CME, NYMEX, COMEX, and ICEUS.
A detailed description of the COT report can be found on the CFTC's website .
COT data is separated into three notable reports: Legacy, Disaggregated, and Financial. This indicator presents specific data from the COT Legacy report. The Total data details the positions held by various traders: Commercial Hedgers (traders registered with CFTC that use futures contracts in that particular commodity for hedging), Large Traders (traders registered with CFTC that do not hedge that particular commodity) and Small Traders (not registered with CFTC).
Our other COT indicators are:
• Commitment of Traders: Legacy Metrics
• Commitment of Traders: Disaggregated Metrics
• Commitment of Traders: Financial Metrics
█ HOW TO USE IT
Load the indicator on an active chart (see here if you don't know how).
By default, the indicator uses the chart's symbol to derive the COT data it displays. You can also specify a CFTC code in the "CFTC code" field of the script's inputs to display COT data from a symbol different than the chart's.
The rest of this section documents the script's input fields.
COT Selection Mode
This field's value determines how the script determines which COT data to return from the chart's symbol:
- "Root" uses the root of a futures symbol ("ES" for "ESH2020").
- "Base currency" uses the base currency in a forex pair ("EUR" for "EURUSD").
- "Currency" uses the quote currency, i.e., the currency the symbol is traded in ("JPY" for "TSE:9984" or "USDJPY").
- "Auto" tries all modes, in turn.
If no COT data can be found, a runtime error is generated.
Note that if the "CTFC Code" input field contains a code, it will override this input.
Futures/Options
Specifies the type of Commitment of Traders data to display: data concerning only Futures, only Options, or both.
Display
Determines the direction of the metrics requested from the CTFC report.
CTFC Code
Instead of letting the script generate the CFTC COT code from the chart and the "COT Selection Mode" input when this field is empty, you can specify an unrelated CFTC COT code here, e.g., 001602 for wheat futures.
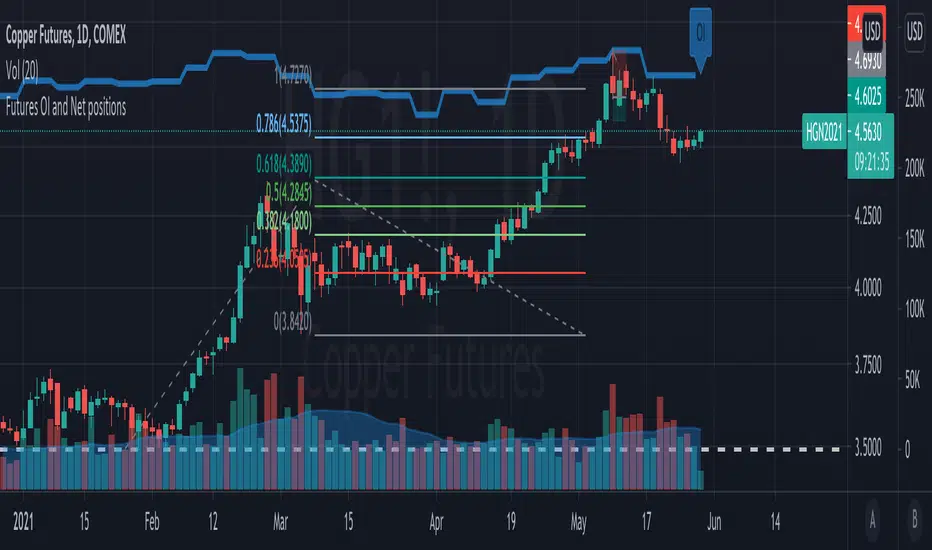
Look first. Then leap.
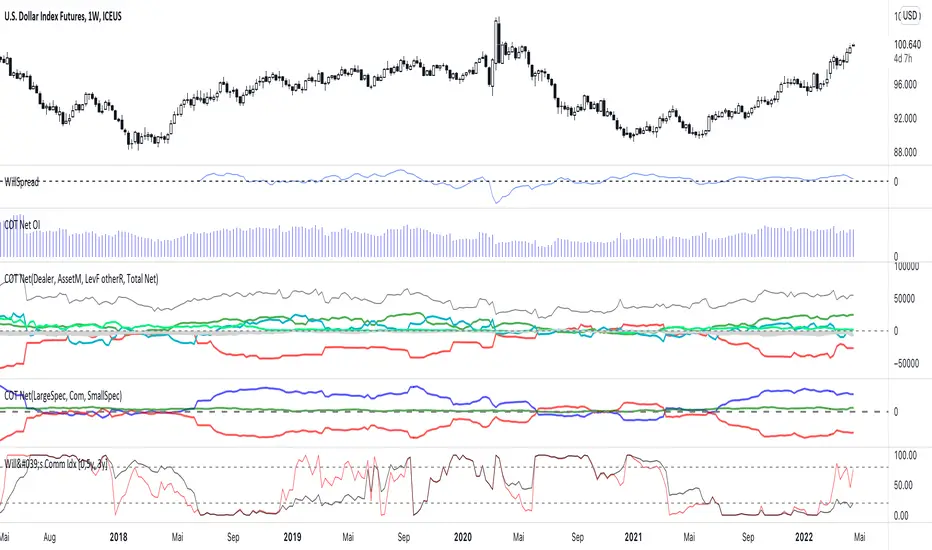
Futures OI and Net positionsThis is an indicator that gets data from Quandl and presents weekly CFTC futures data (www.cftc.gov). In this indicator, Open Interest (OI) and net noncommercial positions are presented. Net_noncommercial positions are calculated as noncommercial_long - noncommercial_short.