스크립트에서 "nifty"에 대해 찾기

Bank Nifty VolumeWhy this Script : Nifty 50 does not provide volume and some time it is really useful to understand the volume .
This is the pine script which calculate the nifty 50 volume .
Logic :
Take each stock contribute to nifty 50 and find it's volume .
Multiply the same with contribution percentage of the same on Nifty 50
Add up all of them and find the total volume .
I took the open source code from @daytraderph script called, Custom Volume
I will make sure I will update the contribution percentage of all stocks my self instead o you update using input methods. This is the difference. Some people don't know where to look at this to update the value, so for them this script might be useful. And this is the only difference comparing to Custom Volume script.
Beta 252 Days (NIFTY 50) by AkshayThe script derives the Beta Value of 252 days of a stock with Benchmark Index NIFTY 50. Note:- I have edited the script using an existing Beta script by Ricardo Santos. Thank you to him! :)
Custom VolumeIdea : Idea of script is getting the volume of index BNF and NIFTY50 ( as Tradingview don't provide the volume information of the indexes )
How it works : Script works on getting the weighted volume of underlying stocks and the plotting them by weight in volume
Benefits:
1. Can server as example how, once can plot the mixed volume of symbols
2. Will help the traders who consider volume also as decision making factor while trading BNF from tradingview chart
3. Can give volume information on any TF **in my knowledge only available for premium users
Important factor to note: Weight of stocks may change time to time depending on Exchange decision.

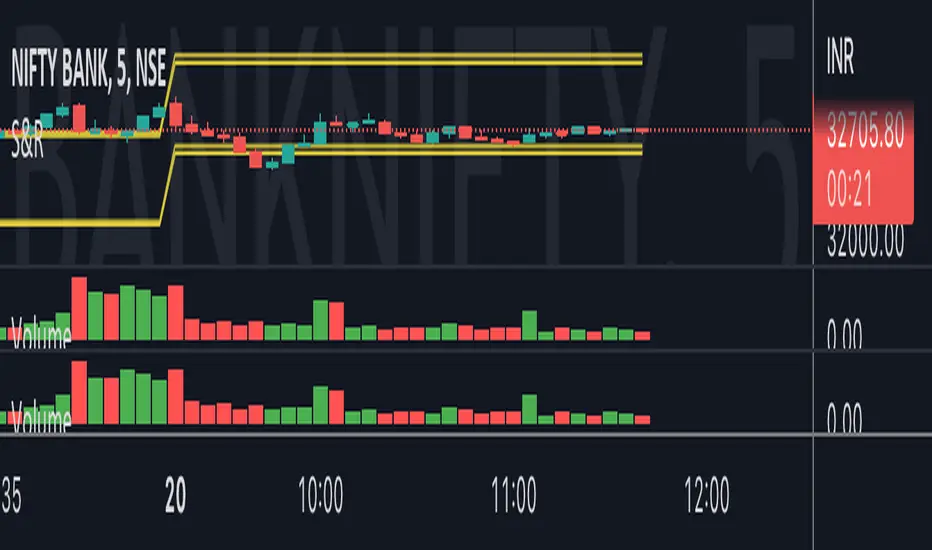
RVC-Weekly-Pivots-GANN-LevelsPurpose:
Weekly - Fibonacci pivot levels and Gann levels calculation and marking on Chart automatically.
Mainly expected to use for trading on NIFTY and BankNifty
Kindly share your comments and suggestions to improve

DeltaMause it for identifing trend of nifty and banknifty, green for long red for short. below 0 must sell ...

ACCURATE TREND LEVELS - TABLE PSv6.1Accurate Trend Level Indicator
Description:
The "Accurate Trend Level" indicator is a powerful tool designed to identify market trends and potential reversals with precision. Built on the concept (foundation) of Swing Highs and Swing Lows, this indicator easily detects uptrends and downtrends, providing traders with clear signals for trend continuation or reversal. Whether you are a swing trader or a trend follower, this indicator offers customization options to suit your trading style.
Key Features:
Trend Identification: Accurately identifies uptrends and downtrends based on Swing High and Swing Low points. This indicator provides signals for Up after Down and Down after Up.
Percentage Adjustment: Includes a customizable percentage factor that reduces false signals and helps identify accurate and strong trends.
Trend Table: Displays essential data in a table, such as:
Last and running Trend Position (Uptrend/Downtrend)
Date and Time of the last and running trend change
Reversal Level (price level for the next potential trend change)
Max. Run-up feature is also provided, which shows how much the market has moved according to the trend.
How It Works:
The indicator analyzes price action using Swing Highs and Lows to determine the current trend direction. A user-defined percentage threshold filters out minor fluctuations, ensuring only significant trends are highlighted. The table provides a quick snapshot of the latest trend data, while reversal levels help traders anticipate the next move.

NIFTY Consolidation → Breakout FinderThis indicator defines 5 day consolidation period and breakout label. This works best on a daily chart. Please back test before use.

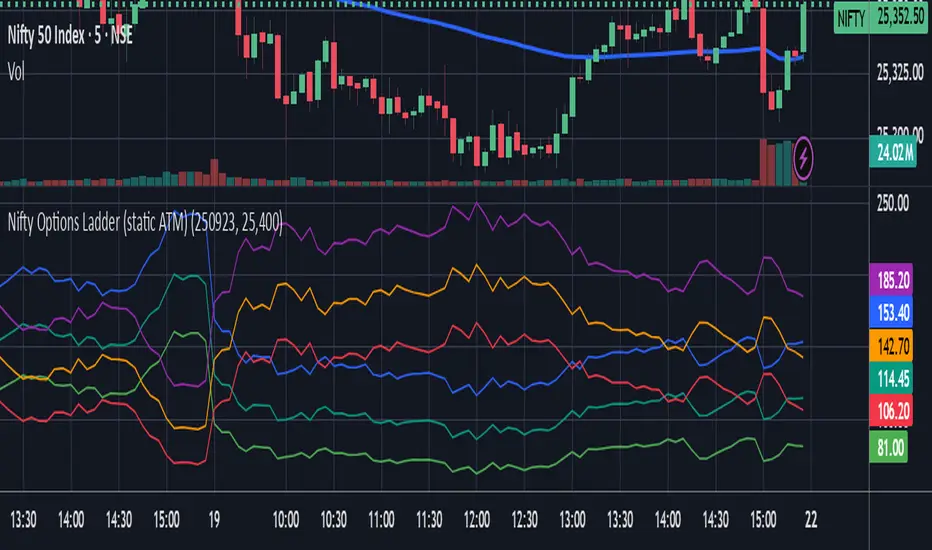
Nifty Options Ladder (static ATM)This Indicator Shows CE, PE of three near by Strike Price of the ATM you Select
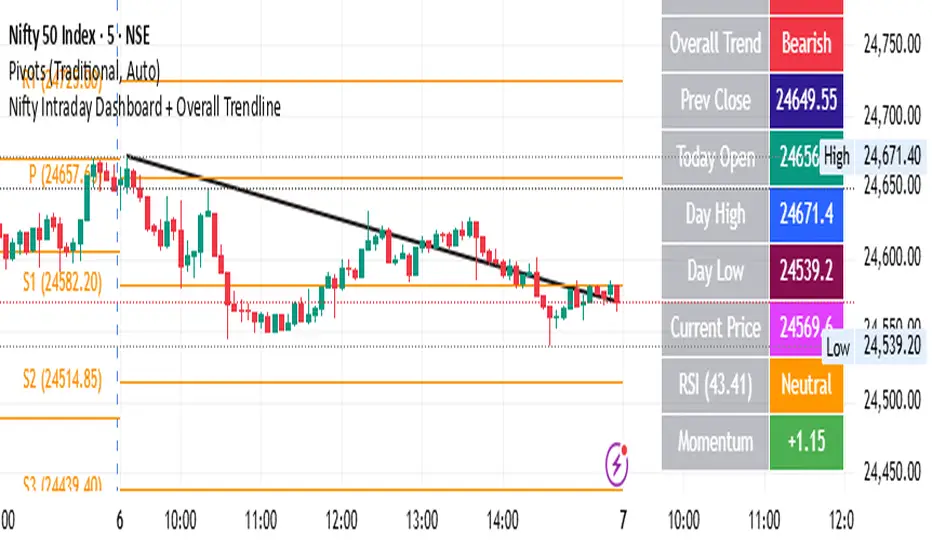
Nifty Intraday Dashboard + Overall TrendlineThis is for educational purpose only. it will show trend line with dashbord
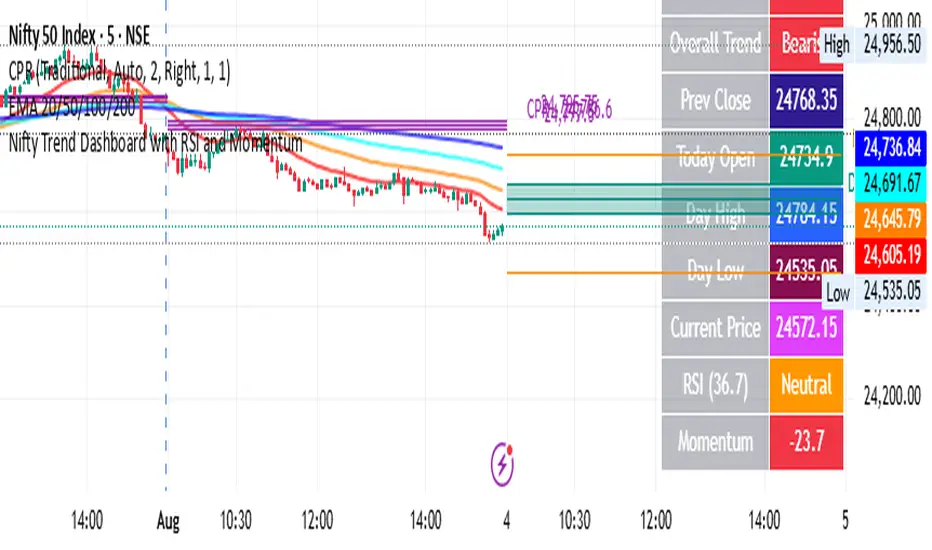
Nifty Trend Dashboard with RSIthis is for learning purpose only. it will show current trend and overall trend
Nifty Buy/Sell Signals with RSI & Fisheruy Signal when:
RSI crosses above 40 from below.
Fisher Transform crosses above its signal line (bullish crossover).
Sell Signal when:
RSI crosses below 60 from above.
Fisher Transform crosses below its signal line (bearish crossover).

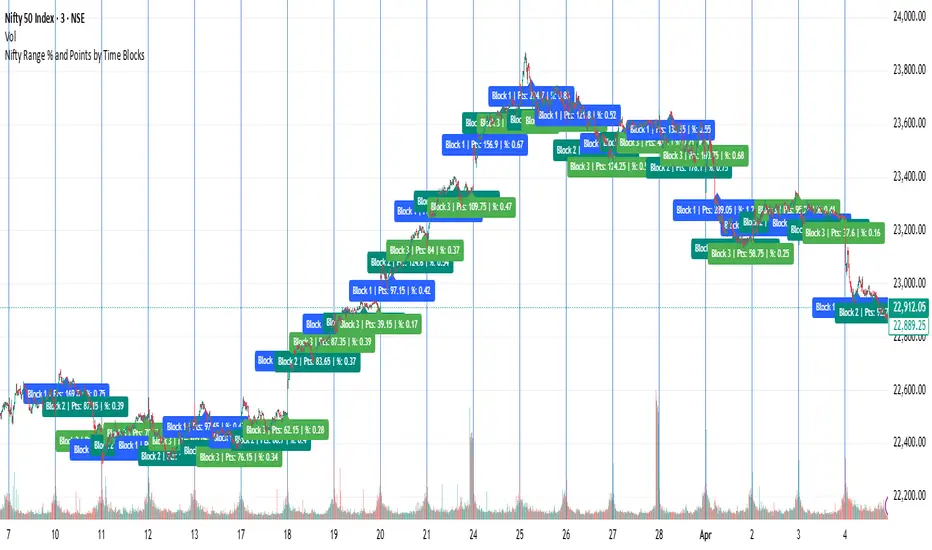
Nifty Range % and Points by Time BlocksPine Script that gives you day-wise intraday range percentage for these 3 time blocks (9:16–10:45, 10:45–1:15, 1:15–3:15), we can:
Detect time blocks during the day
Track High/Low for each block
Calculate range % for each block:
\text{Range %} = \frac{(High - Low)}{\text{Previous Day Close}} \times 100
Plot / Label it on the chart at the end of each block
NIFTY BANKNIFTY MIDCAP SENSEX FINNIFTY LEVELS)this indicator uses Gann's methods which are based on the idea that markets move in predictable geometric patterns and are influenced by time and price.
Key Concepts of Gann Levels:
Gann Angles:
Gann believed that specific angles could indicate the trend of a market. The most notable is the 45-degree angle, which he called the "1x1" or "45-degree line."
Angles are drawn from a significant price point, such as a high or low, and represent the speed or slope of the price movement.
Gann Square of 9:
A mathematical tool that calculates support and resistance levels based on the square root of numbers and their geometric relationships.
It aligns numbers in a spiral format, starting from a central point, and helps identify key price levels at certain degrees.
Gann Fan:
A series of lines drawn at specific angles from a significant high or low. Common angles include 1x1 (45°), 2x1 (26.25°), and 1x2 (63.75°).
These angles help traders identify potential areas where the trend might accelerate, decelerate, or reverse.
Gann Retracements:
Levels based on key price ratios derived from natural laws and geometric principles. Common Gann retracement levels include 12.5%, 25%, 50%, and 75%.
Time Analysis:
Gann emphasized the importance of time cycles. He believed markets move in time-based patterns, such as yearly cycles, seasonal cycles, or specific time intervals.

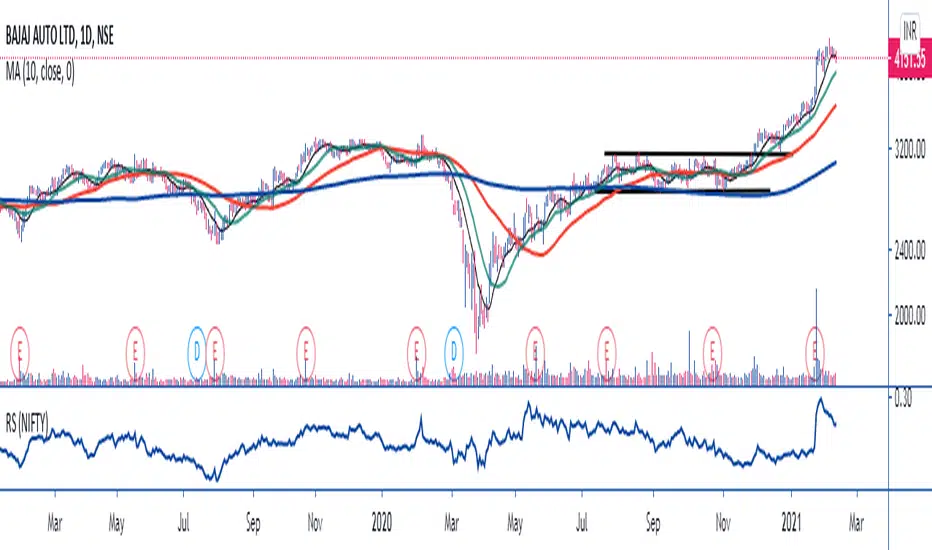
NIFTY INDEX VS STOCK Relative StrengthRelative Index is a ratio of a stock price performance to a market average performance. It is used in technical analysis. It is not confused with RSI indicator. To calculate the relative strength of a particular stock,divide the percentage change over some period by the percentage change of a particular index over the same time period.A stock with a higher relative strength than the overall index often shows a strong investment opportunity.Relative strength is a technique used in momentum investing and identify value stock.The goal of relative strength investing is to buy high and sell even higher.

Consolidation Breakout [Indian Market Timing]OK let's get started ,
A Day Trading (Intraday) Consolidation Breakout Indication Strategy that explains time condition for Indian Markets .
The commission is also included in the strategy .
The basic idea is ,
1) Price crosses above upper band , indicated by a color change (green) is the Long condition .
2) Price crosses below lower band , indicated by a color change (red) is the Short condition .
3) ATR is used for trailing after entry
// ═══════════════════════════════//
// ————————> TIME CONDITION <————————— //
// ═══════════════════════════════//
The Indian Markets open at 9:15am and closes at 3:30pm.
The time_condition specifies the time at which Entries should happen .
"Close All" function closes all the trades at 2:57pm.
All open trades get closed at 2:57pm , because some brokers dont allow you to place fresh intraday orders after 3pm.
NSE:NIFTY1!
// ═══════════════════════════════════════════════ //
// ————————> BACKTEST RESULTS ( 114 CLOSED TRADES )<————————— //
// ═══════════════════════════════════════════════ //
LENGTH , MULT (factor) and ATR can be changed for better backtest results.
The strategy applied to NIFTY (3 min Time-Frame and contract size 5) gives us 60% profitability , as shown below
It was tested for a period a 8 months with a Profit Factor of 2.2 , avg Trade of 6000Rs profit and Sharpe Ratio : 0.67
The graph has a Linear Curve with consistent profits.
NSE:NIFTY1!
Save it favorites.
Apply it to your charts Now !!
Thank me later ;)

Nifty36ScannerThis code is written for traders to be able to automatically scan 36 stocks of their choice for MACD , EMA200 + SuperTrend and Half Trend . Traders can be on any chart, and if they keep this scanner/indicator on , it will start displaying stocks meeting scanning criteria on the same window without having to go to Screener section and running it again and again. It will save time for traders and give them real time signals.
Indicators for scanning stocks are:
MACD
EMA200
Supertrend
HalfTrend - originally developed by EVERGET
Combination of EMA200 crossover/under and MACD crossover/under has worked well for me for long time, so using this combination as one of the criteria to
Scan the stocks. Using Everget's Half Trend method confirms the signal given by MACD , EMA200 and Supertrend Crossover.
I have added 36 of my favourite stocks from Nifty 50 lot. Users of this script can use the same stocks or change it by going into the settings of this scanner.
The Code is divided into 3 Sections
Section 1: Accepting input from users as boolean so that they can scan on the basis of one of the criteria or any combination of the criteria.
Section 2: "Screener function" to calculate Buy/ Sell on the basis of scanning criteria selected y the user.
screener=>
= ta.supertrend(2.5,10)
Buy/Sell on the basis of Supertrend crossing Close of the candle
//using ta.macd function to calculate MACD and Signal
= ta.macd(close, 12, 26, 9)
using HalfTrend indicator to calculate Buy/Sell signals , removed all the plotting functions from the code of Half Trend
Bringing Stock Symbols in S series variables
s1=input.symbol('NSE:NIFTY1!', title='Symbol1', group="Nifty50List", inline='0')
Assigning Bull/Bear ( Buy/Sell) signals to each stocks selected
=request.security(s1, tf, screener())
Assign BUY to all the stocks showing Buy signals using
buy_label1:= c1?buy_label1+str.tostring(s1)+'\n': buy_label1
Follow the same process for SELL Signals
Section 3: Plotting labels for the BUY/SELL result on the in terms of label for any stocks meeting the criteria with deletion of any previous signals to avoid clutter on the chart with so many signals generated in each candle
Display Buy siganaling stocks in teh form of label using Label.new function with parameters as follows:
barindex
close as series
color
textcolor
style as label_up,
yloc =price
textalign=left
Delete all the previous labels
label.delete(lab_buy )
STOCKS SELECTION
We have given range f 36 stocks from NIFTY 50 that can be selected at anytime,. User can chose their own 36 stocks using setting button.
INDICATORS SELECTION
1. MACD: It i sone of the most reliable trading strategy with 39.3% Success rate with 1.187 as profit factor for NIFTY Index on Daily time frame
2. EAM200 + Super trend : Combination of EMA200 crossover and Super trend removes any false positives and considered a very reliable way of scanning for Buy/Sell signals
3. HALF TREND: Originally developed as an indicator by Everget and modified as strategy by AlgoMojo, it generates Buy/Sell signals with 40.2% success rate with 1.469 as profit faction, on 15 minutes timeframe.

nifty_alchemistTimeframe : 5 Min
*When Indicator show Buy signal look only for buy entries at CPR and 50 EMA High and low
*When Indicator show Sell signal look only for sell entries at CPR and 50 EMA High Low
for any quieries contact on twitter @nifty_alchemist
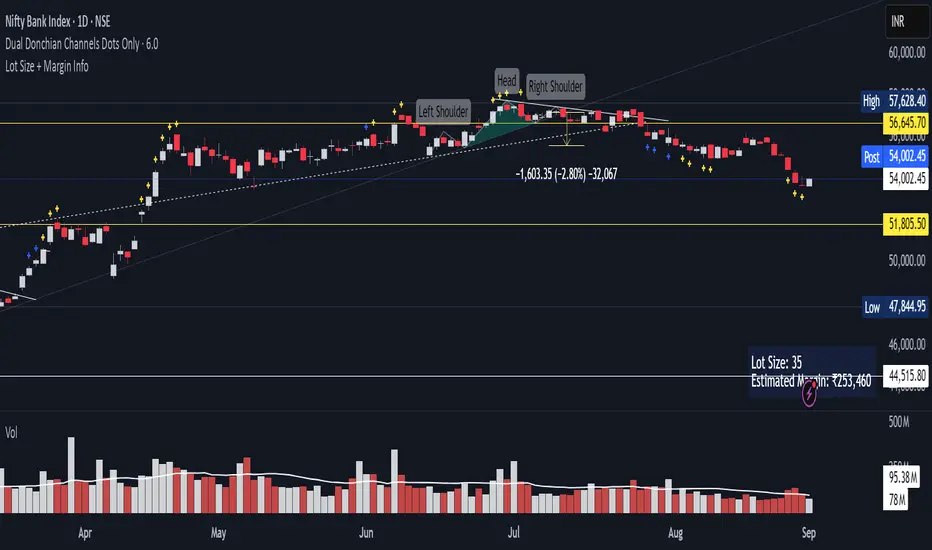
Lot Size + Margin InfoThis indicator is designed to give Futures & Options traders instant access to lot size and estimated margin requirements for the instrument they are viewing — directly on their TradingView chart. It combines real-time symbol detection with a built-in, regularly updated margin lookup table (sourced from Kotak Securities’ published margin requirements), while also handling fallback logic for unknown or unsupported symbols.
---
### What It Does
* Automatically Detects the Instrument Type
Identifies whether the current chart’s symbol is a futures contract, option, or a cash/spot instrument.
* Shows Accurate Lot Size
For supported F\&O symbols, it fetches the correct lot size directly from exchange data.
For options, it retrieves the lot size from the option’s point value.
For cash/spot symbols with linked futures, it uses the futures lot size.
* Calculates Estimated Margin
* For futures: `Lot Size × Current Price × Margin%` (Margin% sourced from the internal lookup table).
* For options: `Lot Size × Current Price` (simple multiplication, as options margin ≈ premium cost).
* For unsupported or non-FnO symbols: Displays "No FnO".
* Fallback Margin Logic
If a symbol is missing from the margin lookup table, the script applies a user-defined default margin percentage and highlights the data in orange to indicate it’s using fallback values.
* Debug Mode for Transparency
A toggle to display the exact symbol string used for fetching lot size and margin, so traders can verify the data source.
---
### How It Works
1. Symbol Normalization
The script standardizes symbol names to match the margin table format (e.g., converting `"NIFTY1!"` to `"NIFTY"`).
2. Type-Based Handling
* Futures – Uses point value for lot size, applies specific margin % from the table.
* Options – Uses option point value for lot size, margin is simply premium × lot size.
* Cash Symbols with Linked Futures – Attempts to find and use the associated futures contract for lot/margin data.
* Unsupported Symbols – Displays `"No FnO"`.
3. Margin Table Integration
The margin % table is manually updated from a reliable broker’s margin sheet (Kotak Securities) — ensuring alignment with real trading conditions.
4. Customizable Display
* Position (Top Right / Bottom Left / Bottom Right)
* Table background color, text color, font size, border width
* Editable label text for lot size and margin display
* Toggleable lot size and margin sections
---
### How to Use
1. Add the Indicator to Your Chart – Works on any NSE Futures, Options, or Cash symbol with linked F\&O.
2. Configure Display Settings – Choose whether to show lot size, margin, or both, and place the info table where you prefer.
3. Adjust Fallback Margin % – If you trade less common contracts, set your default margin % to reflect your broker’s requirement.
4. Enable Debug Mode (Optional) – To see the exact symbol source the script is using.
---
### Best For
* Intraday & Positional F\&O Traders who need instant clarity on lot size and margin before entering trades.
* Options Sellers & Buyers who want quick cost estimates.
* Traders Switching Symbols Quickly — saves time by removing the need to check the broker’s margin sheet manually.
---
💡 Pro Tip: Since margin requirements can change, keep the script updated whenever your broker revises margin data. This version’s margin table is updated as of 13-08-2025.
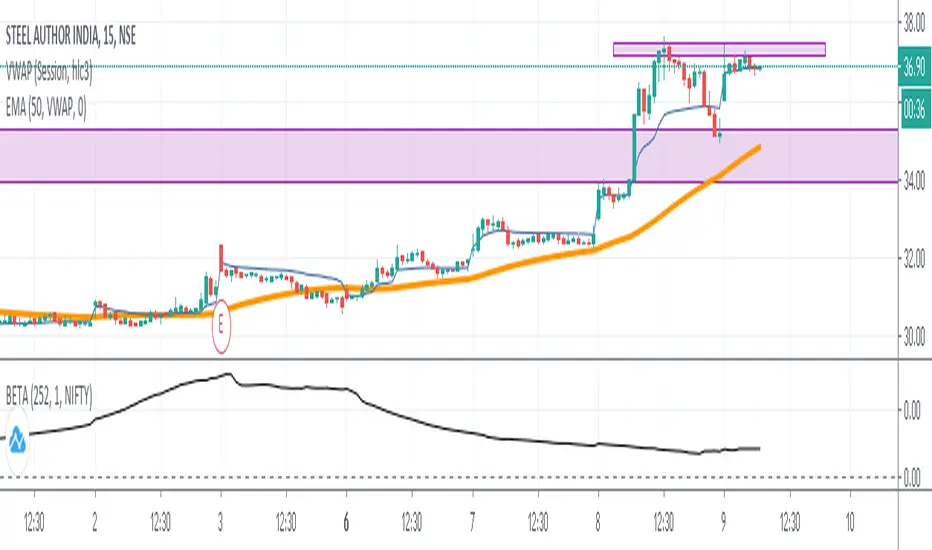
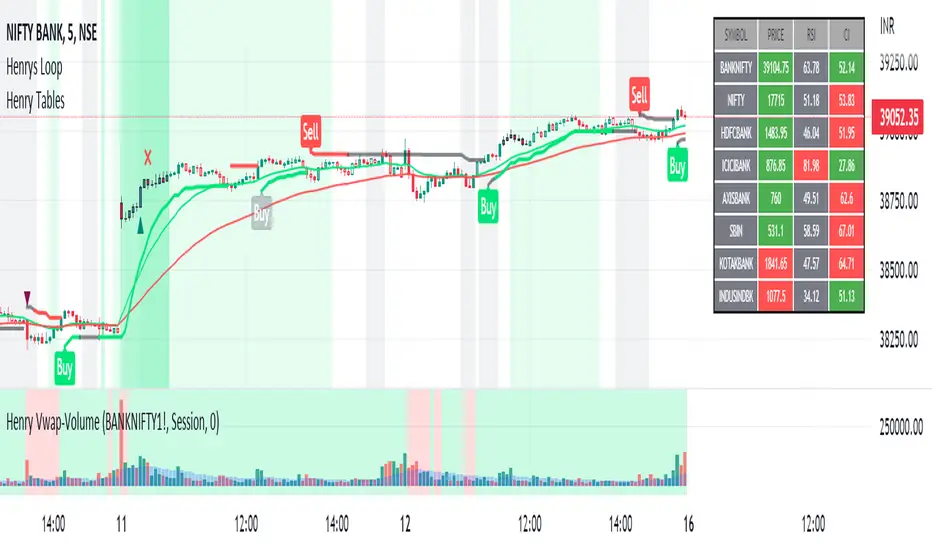
Henry's Vwap-VolumeThis Indicator is meant to provide Futures Volume and Vwap Signal in spot charts of Nifty and Banknifty Traders.
Concepts and Features of this indicators are as follows :
1) Now u don't have to select and change to futures scrip often or have both spot and futures chart in same window to watch the Futures Volume and Vwap.
2) U get Both Volume and Vwap signal as a indicator in single pane.
3) Its for Nifty and Banknifty Traders specially.
4)Volume with moving average is from the futures chart of banknifty or nifty,also may select any other futures script as per ur need.
(MOVING AVERAGE of VOLUME is plotted in Blue columns over the Volume.)
5)Vwap signal is also derived from the futures chart of banknifty or nifty,also may select any other futures script as per ur need.
(VWAP SIGNAL is plotted in GREEN or RED as background.If futures price higher than Vwap then Green , opposite for Red. )
6)The idea of this script is to give extra confirmation of a clear down or uptrend while u are in the spot chart.(nifty and banknifty)
7) U can select and change any scrip u like.But I urge to use futures chart of banknifty or nifty.
I hope this indicator will help a lot of retail investor save their hard earned money in the stock market and benefit from Mr. NK's strategy.
How to Use :
Go Long - when background is Green.
Go Short -when background is Red.
(Also take confirmation from the blue columns -moving average of volumes.volume higher or less than it.)
Limitations :
U can only use it for intraday,less than 1D timeframe.
Will not work in sideways market.
Take help of other indicators also like Rsi,adx,etc.
Best of Luck,
Henry
DMI StrategyThis strategy is based on DMI indicator. It helps me to identify base or top of the script. I mostly use this script to trade in Nifty bank options, even when the signal comes in nifty. It can be used to trade in other scripts as well. Pivot points can also be used to take entry. Long entry is taken when DI+(11) goes below 10 and DI-(11) goes above 40, whereas short entry is taken when DI-(11) goes below 10 and DI+(11) goes above 40.
For bank nifty, I take the trade in the strike price for which the current premium is nearby 300, with the SL of 20%. If premium goes below 10% I buy one more lot to average, but exit if the premium goes below 20% of the first entry. If the trade moves in the correct direction, we need to start trailing our stoploss or exit at the pre-defined target.
Please have a look at strategy tester to back test.

MAVERICKAMIT01-RELATIVE STRENGTHTHE SCRIPT SIMPLY DIVIDES THE STOCK PRICE BY NIFTY TO MEASURE UNDER PERFORMANCE AND OUT PERFORMANCE WITH NIFTY. YOU CAN CHANGE SETTINGS FROM NIFTY TO ANY OTHER SECTOR LIKE CNX FMCG TO MEASURE SECTOR PERFORMANCE AND UNDER PERFORMANCE !!!
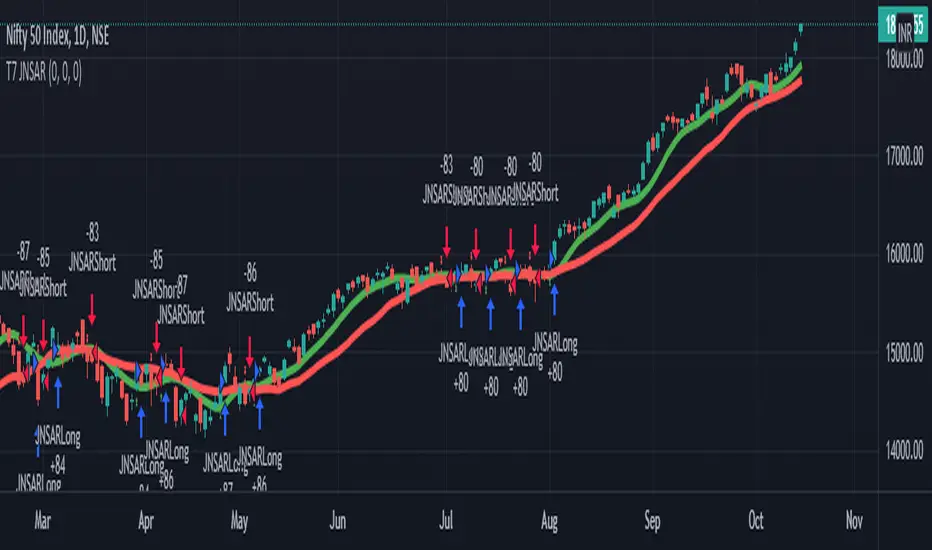
T7 JNSARJNSAR stands for Just Nifty Stop & Reverse. This is a trend following daily bar trading system for NIFTY. Original idea belongs to ILLANGO @ I coded the pine version of this system based on a request from @stocksonfire. Use it at your own risk after validation at your end. Neither me or my company is responsible for any losses you may incur using this system. Hope you like this system and enjoy trading it !!!
While trading this system you must follow these simple rules.
1. Go Long when the daily close is above the JNSAR line. Go Short when the daily close is below the JNSAR line. JNSAR line is the varying green line overlayed over the price chart. Once a signal comes at market close enter in the direction of the signal @ market price @ next day market open.
2. Trade only Nifty Index. This system was developed and backtested only for NIFTY Index. So trade in its Futures or Options, as you may deem fit. My recommendation is to choose futures for simplicity. If you want to reduce the trading cost and go with options, trade with deep in the money options, preferably 2 strikes far from the spot price.
3. Trade all signals. Markets trend only 30-35% of the time and hence the system is only accurate to that extend. But system tends to make enough money, in this small trending window, to keep the overall profitability in good health. But one never knows when a big trend may come and when it comes its absolutely imperative that you take it. To ensure that, trade all signals and don't be choosy about what signals you are going to trade. Also I wouldn't recommend using your own analysis to trade this system. Too many drivers will crash the car.
4. Like all trend following systems, this system will have many whipsaws during flat markets along with large trade and account drawdowns. Also some months and even years may not be profitable. But to trade this system profitably, it is necessary to take these in one's stride and keep trading. As the backtester results from 1990 to 2016 proves, this system is profitable overall thus far. Take confidence from that objective fact.
5. Initial capital that you need to have to trade one lot of NIFTY should be atleast - (Margin Money required to take and hold 1 lot position + maximum drawdown amount per lot)*1.2. Be prepared to add more if need be, but the above formula will give a rough idea of what you need to have to start trading and be in the game always.
6. Follow all the 5 rules above religiously as if your life depends on it. If you cant, then don't trade this system; You will certainly loose money.