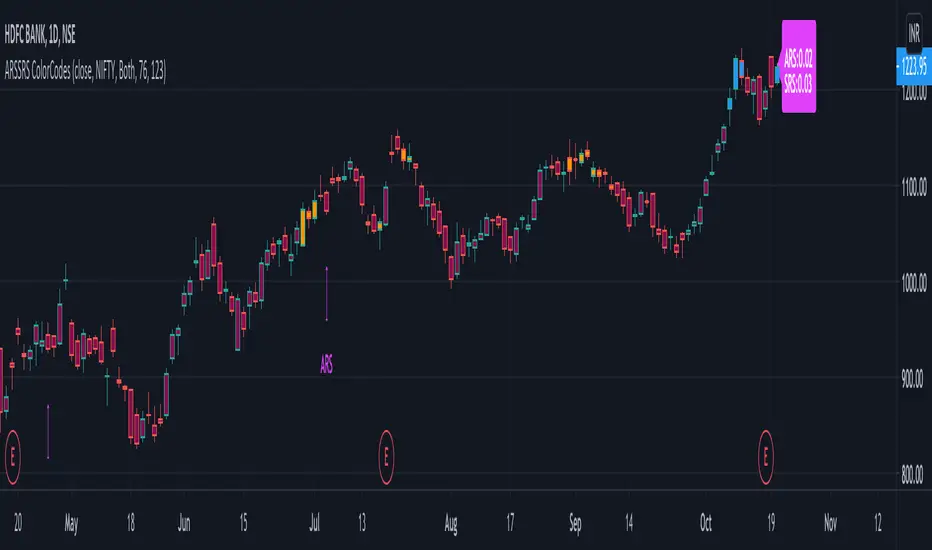
Adaptive and Static Relative Strength OverlayThis indictor combines adaptive and static relative strengths and displays the strength in a unique colour coding on the bars.
With this the one can view the performance of both the relative strengths in one indicator and overlay-ed on the price chart.
Adaptive Relative Strength - Date is identified based on market scenarios. It will change based on how the market trends in the future.
Static Relative Strength - Date is fixed (123 sessions). Roughly corresponds to 6 months.
The (default) colour coding is:
If "Both" is selected:
ars > 0 and srs > 0 = Blue
ars <=0 and srs <= 0 = Maroon
Orange otherwise (Any of ars or srs is negative)
If "Only ARS" is selected:
ars > 0 = Blue
Maroon otherwise
If "Only SRS" is selected:
srs > 0 = Blue
Maroon otherwise
Additionally the ARS and the SRS will be marked as labels on the bars corresponding to the reference dates.
The current ARS and SRS values will be market as label on the last bar.
Source can be any valid source, close is selected by default.
Default benchmark is "Nifty 50" the NSE Indian benchmark. This can be changed.
스크립트에서 "nifty"에 대해 찾기
BANKNIFTY Adv/Dec1) BANKNIFTY Index Advance-Decline count
2) Each session, it reads the number of stock are +Ve or -Ve
3) Whichever the side +Ve or -Ve side moving stock is more than count will be plotted
4) at +/- 7 drawn a dotted line if Count is > = +/-7 Nifty is moving in a strong army
Eg:-
in the current session, 7 Stock is moving in +Ve direction & 6 are in -Ve direction
7 count will be plotted in the chart


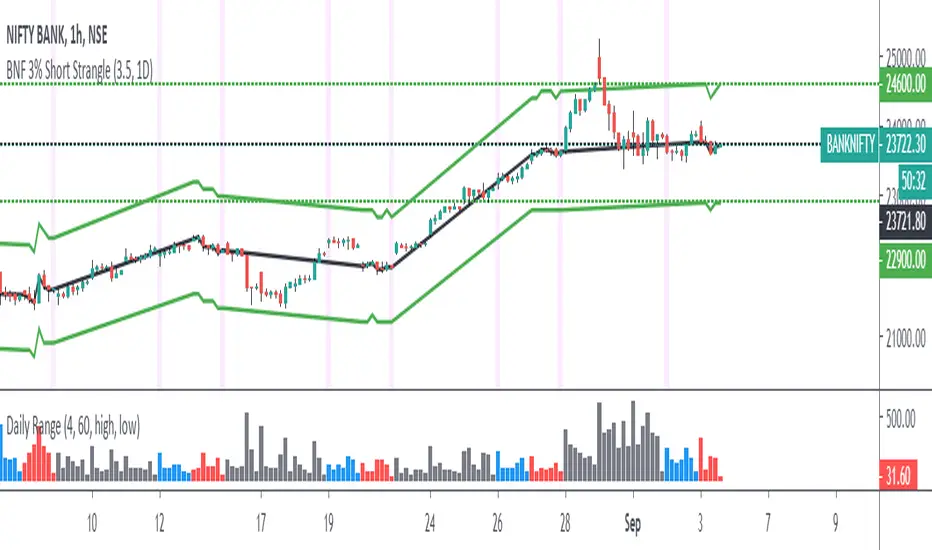
Weekly Short Strangle in % terms BandsDraw lines/band or deviation for any Script based on given input %
Generally used for Weekly options strangle/iron condor BANKNIFTY/NIFTY
1) Input % deviation required
2) for every Thursday Closing basis calculates the % distance and draws bands until next Thursday
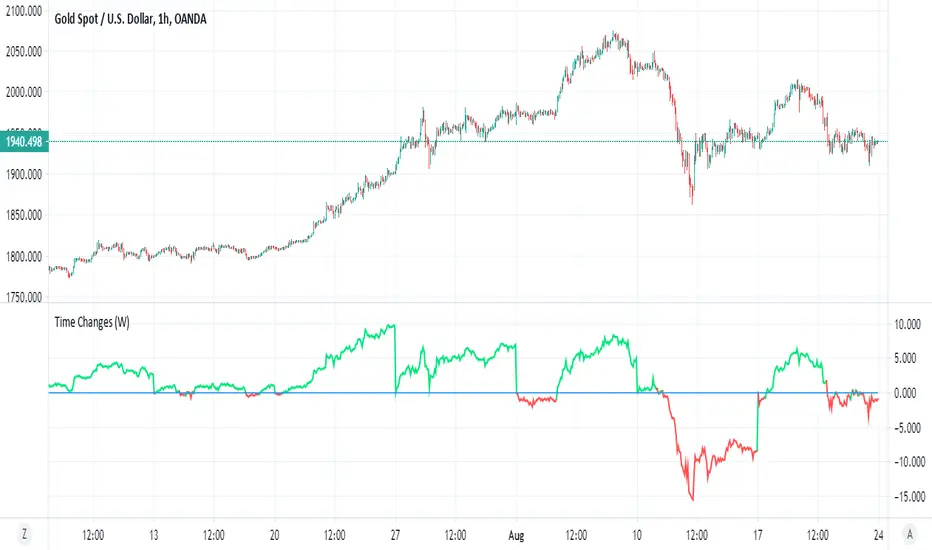
Time ChangesThis is very cool and simple script
I just play around with non security MTF and this is the end result:)
buy period is lime, sell period is red
since it based on the changes of the MTF by time it give us very nice signal of bullish or bearish period
since no security is here so no repaint fear..
if you use 1 hour candle choose either daily (better for crypto ) or weekly MTF (better for stocks ) or even higher
if you use lower TF then try to see which MTF is best suited for it
simple and nice I think :)
here on tesla
facebook
boeing
nifty
forex
etc
MARKET DYNAMICS HH LL BREAKOUTThis strategy is designed for Bank nifty and Nifty Indices on 5 min chart.This positional strategy ,go long when the long signal came and exit your buy position when sell signal generated by the strategy and again go short for next trade e g . when long signal came buy bank nifty 25 quantity ,book your profit or loss in next sell signal and again made SELL position with 25 quantity.
it is a non repainting strategy. this is just a breakout strategy and its accuracy is good. Slippages are not considered in the return.

Adaptive Relative StrengthAdaptive Relative Strength shows a line of relative strength with a moving period in relative to Nifty 500 for Indian Market,
by default its 45 days but you can change as per your need or change relative symbol as per your need.

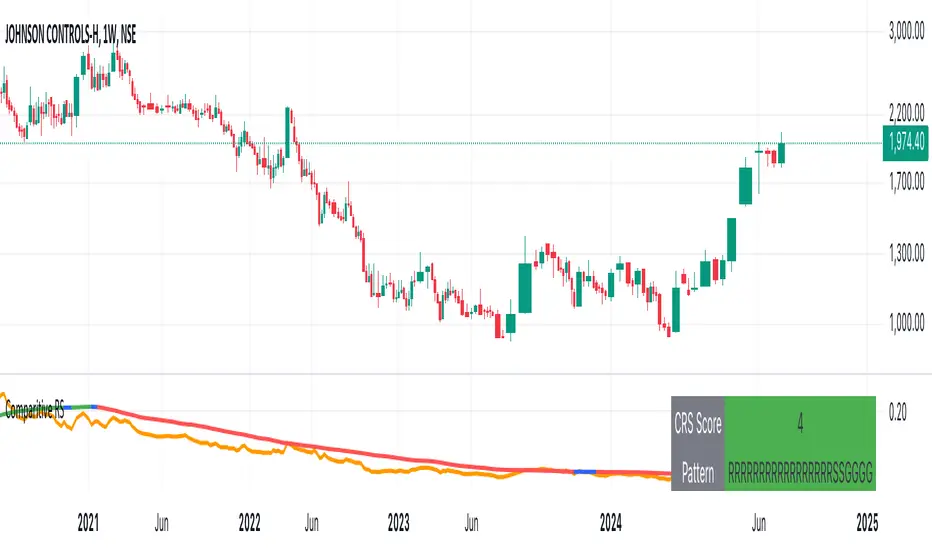
Comparative Relative StrengthPlots the relative strength between a scrip and the broader index (Nifty50 in this case) in a lower pane of the chart. Scrip shared by ST_PSI - TradeWithTrend.


Comparative Relative Strength of a stockPerform comparative relative strength of a stock. Default base is NIFTY 50.
SIMPLE MOVING AVG 10,20,50,100,200 with RESOLUTIONThis indicator is the best than all other sma indicators.Because in just one click you can change all the resolution /time frames for all the sma .
Multitime frame analysis can be done in just one click. just change the resolution to
15 min/30 min/1hr- if you intraday trader
1D- LONG TERM INVESTORS.
Multi-timeframe analysis (MTF) is a process in which traders can view the same ticker/indicator using a higher time frame than the chart’s, for example, displaying a daily moving average on a one-hour chart in just two clicks.
How to Use this to Buy Stocks ?
The technical indicator known as the Death cross occurs when the 50-day SMA crosses below the 200-day SMA => Bearish Signal.
An opposite indicator, known as the Golden cross, occurs when the 50-day SMA crosses above the 200-day SMA => Bullish Signal.
Crossovers are one of the main moving average strategies.
1st Strategy is the first type is a price crossover, which is when the price crosses above the sma => Buy signal
when the price crosses below the sma => Sell signal
2nd Strategy is to apply two moving averages to a chart: one longer and one shorter.
When the shorter-term MA (100) crosses above the longer-term MA (200), it's a buy signal, indicates trend is shifting up.
This is known as a "Golden cross."
Meanwhile, when the shorter-term MA (100) crosses below the longer-term MA (200), it's a sell signal, indicates trend is shifting down.
This is known as a "Dead/death cross."
The time frame or length you choose for a moving average, also called the "look back period," can play a big role in how effective it is.
An MA with a short time frame will react much quicker to price changes than an MA with a long look back period. In the figure below, the 20-day moving average more closely tracks the actual price than the 100-day moving average does.
A 20-day MA = more beneficial to a shorter-term trader, since it follows the price more closely.
A 100-day MA = more beneficial to a longer-term trader.
Moving averages work quite well in strong trending conditions but poorly in choppy or ranging conditions.
use this indicator along with Price action theory and not alone.
Moving average crossovers are a popular strategy for both entries and exits. MAs can also highlight areas of potential support or resistance
Happy Trading

Terminal : USD Based Stock Markets Change (%)Hello.
This script is a simple USD Based Stock Markets Change (%) Data Terminal.
You can also set the period to look back manually in the menu.
In this way, an idea can be obtained about Countries' Stock Markets.
And you can observe the stock exchanges of relatively positive and negative countries from others.
Features
Value changes on a percentage basis (%)
Stock exchange values are calculated in dollar terms.
Due to the advantage of movement, future data were chosen instead of spot values on the required instruments.
Stock Markets
Usa : S&P 500 Futures
Japan: Nikkei 225 Futures
England: United Kingdom ( FTSE ) 100
Australia: Australia 200
Canada: S&P / TSX Composite
Switzerland: Swiss Market Index
New Zealand: NZX 50 Index
China: SSE Composite (000001)
Denmark: OMX Copenhagen 25 Index
Hong-Kong: Hang Seng Index Futures
India: Nifty 50
Norway: Oslo Bors All Share Index
Russia: MOEX Russia Index
Sweden: OMX Stockholm Index
Singapore: Singapore 30
Turkey: BIST 100
South Africa: South Africa Top 40 Index
Spain: IBEX 35
France: CAC 40
Italy: FTSE MIB Index
Netherlands: Netherlands 25
Germany : DAX
Regards.

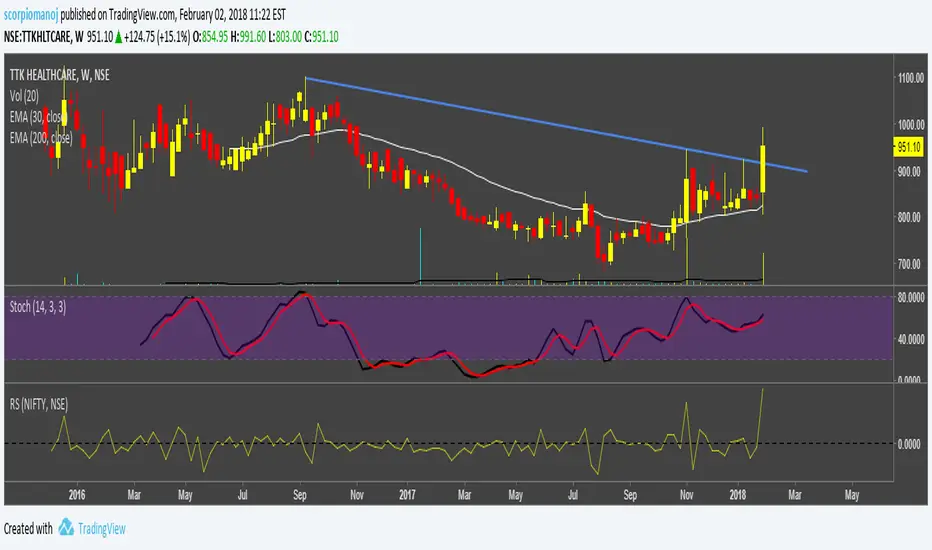
Relative StrengthThis indicator is called Relative Strength and is no way related to RSI ( Relative strength indicator).
It is simply a ratio of asset A to asset B plotted. Usually it is used to look for strength vs a particular index. Since it is a ratio, all the trendlines work on it. The default index is NIFTY. You can change it any index/script you want to compare:
1. Script vs Index
2. Index vs Index

Adam H Grimes - Keltner Channels with Day's High & LowThe indicator shows the day's high and low along with the Keltner Channels.
Keltner Channel Period - 20
Keltner Channel Multiple - 2.25

RVC-Daily_PivotsPurpose: Fibonacci Pivot levels + Gann levels calculation and display on Chart automatically.
Mainly expected to use these for intraday trading on NIFTY and BankNifty
Display R1/R2/R3 - Pivot - S1/S2/S3 levels
Also display GANN Levels of
720- / 540- / 360- / 270-/ 180- / 90- / 45-
45+ / 90+ / 180+ / 270+ / 360+ /540+ /720 +
Same pivot levels are useful for any equity - support and resistance levels.
Levels indicated are only for reference and not meant for trading purpose.

SBER HA Smooth ContainerSBER's modified Heikin Ashi Smoothed Container
Uses EMA 16 and Heikin Ashi Candles.. For NIFTY and its stocks only.


Price Action + Bollinger Strategy Simple Price Action + Bollinger Band Strategy
Buy Setup --------
- Price closes below Bollinger Band
- Last candle closes in green, confirming bulls have returned
- Buy trade is taken
Short Setup --------
- Price closes above Bollinger Band
- Last candle closes in red , confirming bears have returned
- Short trade is taken
Strategy open for suggestions and updation

STAN WEINSTEIN RS INDEX WITH NIFTYThis is an indicator for Indian markets.
It shows the relative strength of particular stock to the underlying index.
The concept of this indicator is well described in Stan Weinstein's book.
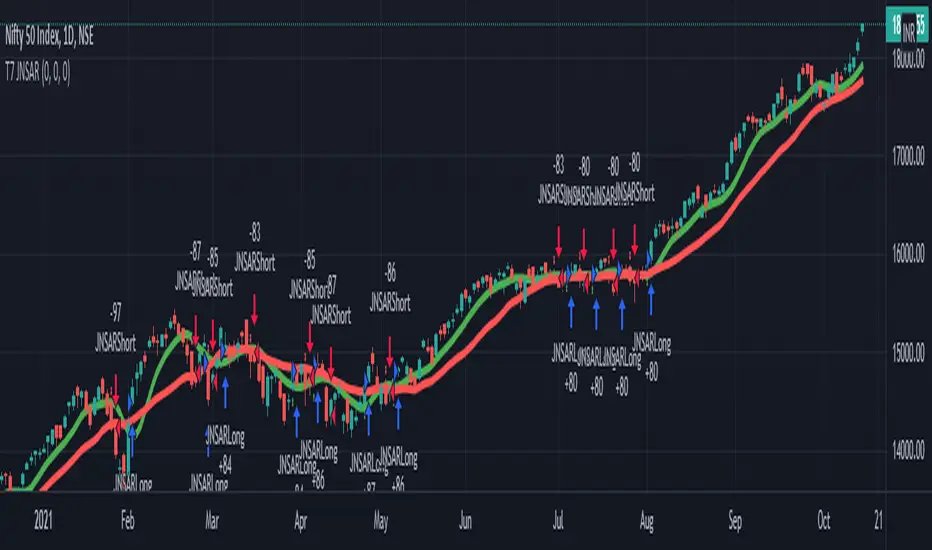
T7 JNSARJNSAR stands for Just Nifty -0.14% Stop & Reverse. This is a Trend Following Daily Bar Trading System for NIFTY -0.14% . Original idea belongs to ILLANGO @ I coded the pine version of this system based on a request from @stocksonfire. Use it at your own risk after validation at your end. Neither me or my company is responsible for any losses you may incur using this system. Hope you like this system and enjoy trading it !!!
Updated V3 code for the T7 JNSAR system earlier published here V2 and here V1
Following updates made to the code
1. Added a 22 Period Simple moving average filter over and above the standard JNSAR value for generating trading signals. This simple filter reduces the whipsaw trades drastically along with similar improvements in the max draw down and overall profitability of the system. The SMA filter is turned ON by default but can be turned OFF by user through the settings window.
2. Backtest option is now turned ON by default.
Also am republishing the trading rules here again with some modification
1. Go Long when the daily close is above the JNSAR line. Go Short when the daily close is below the JNSAR line. JNSAR line is the varying green line overlayed over the price chart. Once a signal comes at market close enter in the direction of the signal @ market price @ next day market open.
2. Trade only Nifty -0.14% Index. This system was developed and backtested only for NIFTY -0.14% Index. So trade in its Futures or Options, as you may deem fit. My recommendation is to choose futures for simplicity. If you want to reduce the trading cost and go with options, trade with deep in the money options, preferably 2 strikes far from the spot price.
3. Trade all signals. Markets trend only 30-35% of the time and hence the system is only accurate to that extend. But system tends to make enough money, in this small trending window, to keep the overall profitability in good health. But one never knows when a big trend may come and when it comes its absolutely imperative that you take it. To ensure that, trade all signals and don't be choosy about what signals you are going to trade. Also I wouldn't recommend using your own analysis to trade this system. Too many drivers will crash the car.
4. Like all trend following systems, this system will have many whipsaws during flat markets along with large trade and account drawdowns. Also some months and even years may not be profitable. But to trade this system profitably, it is necessary to take these in one's stride and keep trading. As the backtester results from 1990 to 2017 proves, this system is profitable overall thus far. Take confidence from that objective fact.
5. Trade with only that amount of money you can afford to loose. Initial capital that you need to have to trade one lot of NIFTY -0.14% should be atleast - (Margin Money required to take and hold 1 lot position + maximum drawdown amount per lot)*1.2. Be prepared to add more if need be, but the above formula will give a rough idea of what you need to have to start trading and be in the game always.
6. Place an After Market Order @ Market Price with your broker after market close so that you get to execute the trade next trading day @ Market open to capture near similar price as the daily open price seen on the chart. This execution mode will give you the best chance to minimize the slippage and mimic the backtester results as closely as practically possible.
7. Follow all the 6 rules above religiously, as if your life depends on it. If you cant, then don't trade this system; You will certainly loose money.
Happy Trading !!! As always am looking out for your valuable feedback.