Volatility Arbitrage Spread Oscillator Model (VASOM)The Volatility Arbitrage Spread Oscillator Model (VASOM) is a systematic approach to capitalizing on price inefficiencies in the VIX futures term structure. By analyzing the differential between front-month and second-month VIX futures contracts, we employ a momentum-based oscillator (Relative Strength Index, RSI) to signal potential market reversion opportunities. Our research builds upon existing financial literature on volatility risk premia and contango/backwardation dynamics in the volatility markets (Zhang & Zhu, 2006; Alexander & Korovilas, 2012).
Volatility derivatives have become essential tools for managing risk and engaging in speculative trades (Whaley, 2009). The Chicago Board Options Exchange (CBOE) Volatility Index (VIX) measures the market’s expectation of 30-day forward-looking volatility derived from S&P 500 option prices (CBOE, 2018). Term structures in VIX futures often exhibit contango or backwardation, depending on macroeconomic and market conditions (Alexander & Korovilas, 2012).
This strategy seeks to exploit the spread between the front-month and second-month VIX futures as a proxy for term structure dynamics. The spread’s momentum, quantified by the RSI, serves as a signal for entry and exit points, aligning with empirical findings on mean reversion in volatility markets (Zhang & Zhu, 2006).
• Entry Signal: When RSI_t falls below the user-defined threshold (e.g., 30), indicating a potential undervaluation in the spread.
• Exit Signal: When RSI_t exceeds a threshold (e.g., 70), suggesting mean reversion has occurred.
Empirical Justification
The strategy aligns with findings that suggest predictable patterns in volatility futures spreads (Alexander & Korovilas, 2012). Furthermore, the use of RSI leverages insights from momentum-based trading models, which have demonstrated efficacy in various asset classes, including commodities and derivatives (Jegadeesh & Titman, 1993).
References
• Alexander, C., & Korovilas, D. (2012). The Hazards of Volatility Investing. Journal of Alternative Investments, 15(2), 92-104.
• CBOE. (2018). The VIX White Paper. Chicago Board Options Exchange.
• Jegadeesh, N., & Titman, S. (1993). Returns to Buying Winners and Selling Losers: Implications for Stock Market Efficiency. The Journal of Finance, 48(1), 65-91.
• Zhang, C., & Zhu, Y. (2006). Exploiting Predictability in Volatility Futures Spreads. Financial Analysts Journal, 62(6), 62-72.
• Whaley, R. E. (2009). Understanding the VIX. The Journal of Portfolio Management, 35(3), 98-105.
스크립트에서 "momentum"에 대해 찾기

Simple Time-Based Strategy(Price Action Hypothesis)Core Theory: Trend Continuation Pattern Recognition**
1. **Price Action Hypothesis**
The strategy is built on the assumption that consecutive price movements (3-bar patterns) indicate momentum continuation:
- *Long Pattern*: Three consecutive higher closes combined with ascending highs
- *Short Pattern*: Three consecutive lower closes combined with descending lows
This reflects a belief that sustained directional price movement creates self-reinforcing trends that can be captured through simple pattern recognition.
2. **Time-Based Risk Management**
Implements a dynamic exit mechanism:
- *Training Phase*: 5-bar holding period (quick turnover)
- *Testing Phase*: 10-bar holding period (extended exposure)
This dual timeframe approach suggests the hypothesis that market conditions may require different holding durations in different market eras.
3. **Adaptive Market Hypothesis**
The structure incorporates two distinct phases:
- *Training Period (11 years)*: Pattern recognition without stop losses
- *Testing Period*: Pattern recognition with stop losses
This assumes markets may change character over time, requiring different risk parameters in different epochs.
4. **Asymmetric Risk Control**
Implements stop-losses only in the testing phase:
- Fixed 500-pip (point) stop distance
- Activated post-training period
This reflects a belief that historical patterns might need different risk constraints than real-time trading.
5. **Dual-Path Validation**
The split between training/testing phases suggests:
- Pattern validity should first be confirmed without protective stops
- Real-world implementation requires added risk constraints
6. **Market Efficiency Paradox**
The simultaneous use of both long/short entries assumes:
- Markets exhibit persistent inefficiencies
- These inefficiencies manifest differently in bullish/bearish conditions
- A symmetric approach can capture opportunities in both directions
7. **Behavioral Finance Elements**
The 3-bar pattern recognition potentially exploits:
- Herd mentality in trend formation
- Delayed reaction to price momentum
- Cognitive bias in trend confirmation
8. **Quantitative Time Segmentation**
The annual-based period division (training vs testing) implies:
- Market cycles operate on multi-year timeframes
- Strategy robustness requires validation across different market regimes
- Parameter sensitivity needs temporal validation
This strategy combines elements of technical pattern recognition, temporal adaptability, and phased risk management to create a systematic approach to trend exploitation. The theoretical framework suggests markets exhibit persistent but evolving patterns that can be systematically captured through rule-based execution.

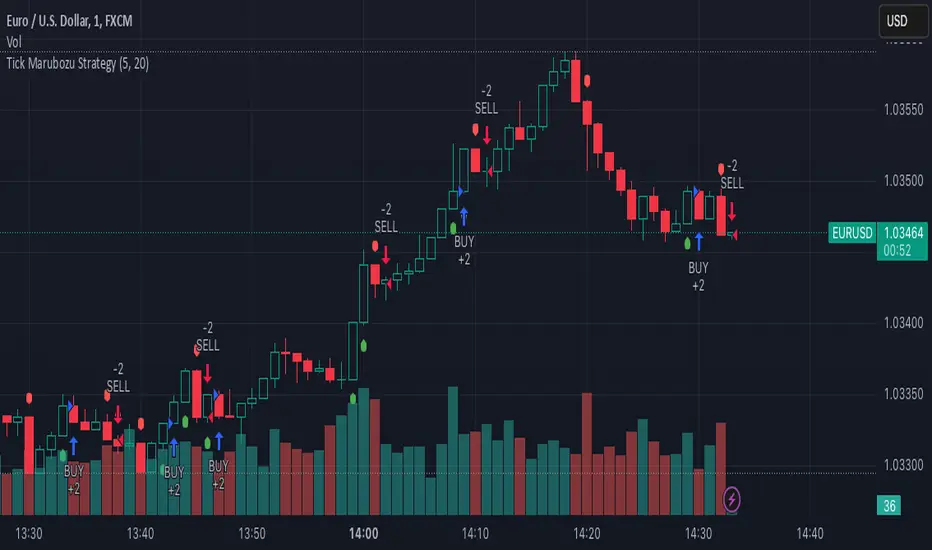
Tick Marubozu StrategyStrategy Concept:
This strategy identifies Marubozu candles on a tick chart (customizable pip size) with high volume to signal strong market momentum.
Bearish Marubozu → Strong selling pressure → Enter a SELL trade
Bullish Marubozu → Strong buying pressure → Enter a BUY trade
Entry Conditions:
Marubozu Definition:
Open price ≈ High for a bearish Marubozu (minimal wick at the top).
Open price ≈ Low for a bullish Marubozu (minimal wick at the bottom).
Customizable body size (in pips).
High Volume Confirmation:
The volume of the Marubozu candle must be above the moving average of volume (e.g., 20-period SMA).
Trade Direction:
Bearish Marubozu with High Volume → SELL
Bullish Marubozu with High Volume → BUY
Exit Conditions:
Time-Based Expiry: Since it's for binary options, the trade duration is pre-defined (e.g., 1-minute expiry).
Reversal Candle: If a strong opposite Marubozu appears, it may indicate a trend shift.
Consecutive Bearish Candle Strategy█ STRATEGY DESCRIPTION
The "Consecutive Bearish Candle Strategy" is a momentum-based strategy designed to identify potential reversals after a sustained bearish move. It enters a long position when a specific number of consecutive bearish candles occur and exits when the price shows strength by exceeding the previous bar's high. This strategy is optimized for use on various timeframes and instruments.
█ SIGNAL GENERATION
1. LONG ENTRY
A Buy Signal is triggered when:
The close price has been lower than the previous close for at least `Lookback` consecutive bars. This indicates a sustained bearish move, suggesting a potential reversal.
The signal occurs within the specified time window (between `Start Time` and `End Time`).
2. EXIT CONDITION
A Sell Signal is generated when the current closing price exceeds the high of the previous bar (`close > high `). This indicates that the price has shown strength, potentially confirming the reversal and prompting the strategy to exit the position.
█ ADDITIONAL SETTINGS
Lookback: The number of consecutive bearish bars required to trigger a Buy Signal. Default is 3.
Start Time and End Time: The time window during which the strategy is allowed to execute trades.
█ PERFORMANCE OVERVIEW
This strategy is designed for markets with frequent momentum shifts.
It performs best in volatile conditions where price movements are significant.
Backtesting results should be analysed to optimize the `Lookback` parameter for specific instruments.

Systematic Risk Aggregation ModelThe “Systematic Risk Aggregation Model” is a quantitative trading strategy implemented in Pine Script™ designed to assess and visualize market risk by aggregating multiple financial risk factors. This model uses a multi-dimensional scoring approach to quantify systemic risk, incorporating volatility, drawdowns, put/call ratios, tail risk, volume spikes, and the Sharpe ratio. It derives a composite risk score, which is dynamically smoothed and plotted alongside adaptive Bollinger Bands to identify trading opportunities. The strategy’s theoretical framework aligns with modern portfolio theory and risk management literature (Markowitz, 1952; Taleb, 2007).
-----------------------------------------------------------------------------------------------
Key Components of the Model
1. Volatility as a Risk Proxy
The model calculates the standard deviation of the closing price over a specified period (volatility_length) to quantify market uncertainty. Volatility is normalized to a score between 0 and 100, using its historical minimum and maximum values.
Reference: Volatility has long been regarded as a critical measure of financial risk and uncertainty in capital markets (Hull, 2008).
2. Drawdown Assessment
The drawdown metric captures the relative distance of the current price from the highest price over the specified period (drawdown_length). This is converted into a normalized score to reflect the magnitude of recent losses.
Reference: Drawdown is a key metric in risk management, often used to measure potential downside risk in portfolios (Maginn et al., 2007).
3. Put/Call Ratio as a Sentiment Indicator
The strategy integrates the put/call ratio, sourced from an external symbol, to assess market sentiment. High values often indicate bearish sentiment, while low values suggest bullish sentiment (Whaley, 2000). The score is normalized similarly to other metrics.
4. Tail Risk via Modified Z-Score
Tail risk is approximated using the modified Z-score, which measures the deviation of the closing price from its moving average relative to its standard deviation. This approach captures extreme price movements and potential “black swan” events.
Reference: Taleb (2007) discusses the importance of considering tail risks in financial systems.
5. Volume Spikes as a Proxy for Market Activity
A volume spike is defined as the ratio of current volume to its moving average. This ratio is normalized into a score, reflecting unusual trading activity, which may signal market turning points.
Reference: Volume analysis is a foundational tool in technical analysis and is often linked to price momentum (Murphy, 1999).
6. Sharpe Ratio for Risk-Adjusted Returns
The Sharpe ratio measures the risk-adjusted return of the asset, using the mean log return divided by its standard deviation over the same period. This ratio is transformed into a score, reflecting the attractiveness of returns relative to risk.
Reference: Sharpe (1966) introduced the Sharpe ratio as a standard measure of portfolio performance.
----------------------------------------------------------------------------------------------
Composite Risk Score
The composite risk score is calculated as a weighted average of the individual risk factors:
• Volatility: 30%
• Drawdown: 20%
• Put/Call Ratio: 20%
• Tail Risk (Z-Score): 15%
• Volume Spike: 10%
• Sharpe Ratio: 5%
This aggregation captures the multi-dimensional nature of systemic risk and provides a unified measure of market conditions.
----------------------------------------------------------------------------------------------
Dynamic Bands with Bollinger Bands
The composite risk score is smoothed using a moving average and bounded by Bollinger Bands (basis ± 2 standard deviations). These bands provide dynamic thresholds for identifying overbought and oversold market conditions:
• Upper Band: Signals overbought conditions, where risk is elevated.
• Lower Band: Indicates oversold conditions, where risk subsides.
----------------------------------------------------------------------------------------------
Trading Strategy
The strategy operates on the following rules:
1. Entry Condition: Enter a long position when the risk score crosses above the upper Bollinger Band, indicating elevated market activity.
2. Exit Condition: Close the long position when the risk score drops below the lower Bollinger Band, signaling a reduction in risk.
These conditions are consistent with momentum-based strategies and adaptive risk control.
----------------------------------------------------------------------------------------------
Conclusion
This script exemplifies a systematic approach to risk aggregation, leveraging multiple dimensions of financial risk to create a robust trading strategy. By incorporating well-established risk metrics and sentiment indicators, the model offers a comprehensive view of market dynamics. Its adaptive framework makes it versatile for various market conditions, aligning with contemporary advancements in quantitative finance.
----------------------------------------------------------------------------------------------
References
1. Hull, J. C. (2008). Options, Futures, and Other Derivatives. Pearson Education.
2. Maginn, J. L., Tuttle, D. L., McLeavey, D. W., & Pinto, J. E. (2007). Managing Investment Portfolios: A Dynamic Process. Wiley.
3. Markowitz, H. (1952). Portfolio Selection. The Journal of Finance, 7(1), 77–91.
4. Murphy, J. J. (1999). Technical Analysis of the Financial Markets. New York Institute of Finance.
5. Sharpe, W. F. (1966). Mutual Fund Performance. The Journal of Business, 39(1), 119–138.
6. Taleb, N. N. (2007). The Black Swan: The Impact of the Highly Improbable. Random House.
7. Whaley, R. E. (2000). The Investor Fear Gauge. The Journal of Portfolio Management, 26(3), 12–17.

FON60DK by leventsahThe strategy generates buy and sell signals using the Tillson T3 and TOTT (Twin Optimized Trend Tracker) indicators. Additionally, the Williams %R indicator is used to filter the signals. Below is an explanation of the main components of the code:
1. Input Parameters:
Tillson T3 and TOTT parameters: Separate parameters are defined for both buy (AL) and sell (SAT) conditions. These parameters control the sensitivity and behavior of the indicators.
Williams %R period: The period for the Williams %R indicator is set to determine overbought and oversold levels.
2. Tillson T3 Calculation:
The Tillson T3 indicator is a smoothed moving average that uses an exponential moving average (EMA) with additional smoothing. The formula calculates a weighted average of multiple EMAs to produce a smoother line.
The t3 function computes the Tillson T3 value based on the close price and the input parameters.
3. TOTT Calculation (Twin Optimized Trend Tracker):
The TOTT indicator is a trend-following tool that adjusts its sensitivity based on market conditions. It uses a combination of price action and a volatility coefficient to determine trend direction.
The Var_Func function calculates the TOTT value, which is then used to derive the OTT (Optimized Trend Tracker) levels for both buy and sell conditions.
4. Williams %R Calculation:
Williams %R is a momentum oscillator that measures overbought and oversold levels. It is calculated using the highest high and lowest low over a specified period.
5. Buy and Sell Conditions:
Buy Condition: A buy signal is generated when the Tillson T3 value crosses above the TOTT upper band (OTTup) and the Williams %R is above -20 (indicating an oversold condition).
Sell Condition: A sell signal is generated when the Tillson T3 value crosses below the TOTT lower band (OTTdnS) and the Williams %R is above -70 (used to close long positions).
6. Strategy Execution:
The strategy.entry function is used to open a long position when the buy condition is met.
The strategy.close function is used to close the long position when the sell condition is met.
7. Visualization:
The bars on the chart are colored green when a long position is open.
The Tillson T3, TOTT upper band (OTTup), and TOTT lower band (OTTdn) are plotted on the chart for both buy and sell conditions.
8. Plots:
The Tillson T3 values for buy and sell conditions are plotted in blue.
The TOTT upper and lower bands are plotted in green and red, respectively, for both buy and sell conditions.
Summary:
This strategy combines trend-following indicators (Tillson T3 and TOTT) with a momentum oscillator (Williams %R) to generate buy and sell signals. The use of separate parameters for buy and sell conditions allows for fine-tuning the strategy based on market behavior. The visual elements, such as colored bars and plotted indicators, help traders quickly identify signals and trends on the chart.

DCA Buy v1Key Features
1. Selective Entry Filters
Trend Filter
Enabled through "Enable Trend Filter?" using the "EMA Length" setting to ensure entries align with prevailing trends.
Momentum Filter
Configured using "Enable Momentum Filter?" combined with "RSI Length" and "RSI Source" to detect oversold conditions.
Bollinger Filter
Activated via "Enable Bollinger Filter?" along with "BB Length" and "BB Multiplier" to focus entries on deeper price dips below Bollinger Bands.
2. DCA Configuration
Base Order Settings
Choose between a percentage ("Base Order % of Equity/Initial Capital") or fixed value ("Base Order Value ($)").
Safety Order Settings
Fine-tune "Initial Deviation (%)" and "Price Deviation Multiplier" to control the spacing of safety orders.
Use "Volume Scaling Factor (Qty)" to scale the size of each subsequent safety order.
Customize the "First Safety Order Type" as either value-based or a multiplier of the base order using "1st Safety Order Value ($)" or "1st Safety Order Multiplier (Qty)".
Set the maximum number of safety orders through "Max Safety Orders".
3. Profit and Risk Management
Take Profit Settings
"Take Profit (%)" triggers a sell when a specific profit percentage above the average entry is reached.
Use "Trailing Take Profit (%)" to lock in profits while capturing additional upside if prices continue to rise.
Stop Loss Settings
Configure "Stop Loss (%)" to prevent excessive drawdowns by closing all positions when prices drop below a defined percentage.
4. Time Control & Visualization
Time Filters
Define trading windows with "Start Time" and "End Time".
Use "Cooldown (Seconds)" to avoid frequent entries during rapid price movements.
Visualization
Enable "Show Average Entry Price", "Show Take Profit Level", and "Show Stop Loss Level" to plot key levels on the chart for better monitoring.
5. Performance Metrics
Built-in performance tracking includes:
Net Profit (%): Measures overall profitability.
Win Rate (%): Displays the ratio of winning trades.
Max Drawdown (%): Tracks the largest equity decline.
Trading Days: Calculates the duration of active trades.
Profit/Day (%): Evaluates daily returns.
The performance table also shows average cycle duration and utilization of available capital.

EMA Crossover with RSI and DistanceEMA Crossover with RSI and Distance Strategy
This strategy combines Exponential Moving Averages (EMA) with Relative Strength Index (RSI) and distance-based conditions to generate buy, sell, and neutral signals. It is designed to help traders identify entry and exit points based on multiple technical indicators.
Key Components:
Exponential Moving Averages (EMA):
The strategy uses four EMAs: EMA 5, EMA 13, EMA 40, and EMA 55.
A buy signal (long) is triggered when EMA 5 crosses above EMA 13 and EMA 40 crosses above EMA 55.
A sell signal (short) is generated when EMA 55 crosses above EMA 40.
The distance between EMAs (5 and 13) is also important. If the current distance between EMA 5 and EMA 13 is smaller than the average distance over the last 5 candles, a neutral condition is triggered, preventing a signal even if all other conditions are met.
Relative Strength Index (RSI):
The 14-period RSI is used to determine market strength and direction.
The strategy requires RSI to be above 50 and greater than the average RSI (over the past 14 periods) for a buy signal.
If the RSI is above 60, a green signal is given, indicating a strong bullish condition, even if the EMA conditions are not fully met.
If the RSI is below 40, a red signal is given, indicating a strong bearish condition, regardless of the EMA crossover.
Distance Conditions:
The strategy calculates the distance between EMA 5 and EMA 13 on each candle and compares it to the average distance of the last 5 candles.
If the current distance between EMA 5 and EMA 13 is lower than the average of the last 5 candles, a neutral signal is triggered. This helps avoid entering a trade when the market is losing momentum.
Additionally, if the distance between EMA 40 and EMA 13 is greater than the previous distance, the previous signal is kept intact, ensuring that the trend is still strong enough for the signal to remain valid.
Signal Persistence:
Once a buy (green) or sell (red) signal is triggered, it remains intact as long as the price is closing above EMA 5 for long trades or below EMA 55 for short trades.
If the price moves below EMA 5 for long trades or above EMA 55 for short trades, the signal is recalculated based on the most recent conditions.
Signal Display:
Green Signals: Represent a strong buy signal and are shown below the candle when the RSI is above 60.
Red Signals: Represent a strong sell signal and are shown above the candle when the RSI is below 40.
Neutral Signals: Displayed when the conditions for entry are not met, specifically when the EMA distance condition is violated.
Long and Short Signals: Additional signals are shown based on the EMA crossovers and RSI conditions. These signals are plotted below the candle for long positions and above the candle for short positions.
Trade Logic:
Long Entry: Enter a long trade when EMA 5 crosses above EMA 13, EMA 40 crosses above EMA 55, and the RSI is above 50 and greater than the average RSI. Additionally, the current distance between EMA 5 and EMA 13 should be larger than the average distance of the last 5 candles.
Short Entry: Enter a short trade when EMA 55 crosses above EMA 40 and the RSI is below 40.
Neutral Condition: If the distance between EMA 5 and EMA 13 is smaller than the average distance over the last 5 candles, the strategy will not trigger a signal, even if other conditions are met.

IU 4 Bar UP StrategyIU 4 Bar UP Strategy
The IU 4 Bar UP Strategy is a trend-following strategy designed to identify and execute long trades during strong bullish momentum, combined with confirmation from the SuperTrend indicator. This strategy is suitable for traders aiming to capitalize on sustained upward market movements.
Features :
1. SuperTrend Confirmation: Incorporates the SuperTrend indicator as a dynamic support/resistance line to filter trades in the direction of the trend.
2. 4 Consecutive Bullish Bars: Detects a series of 4 bullish candles as a signal for strong upward momentum, ensuring robust trade setups.
3. Dynamic Alerts: Sends alerts for trade entries and exits to keep traders informed.
4. Visual Enhancements:
- Plots the SuperTrend indicator on the chart.
- Changes the background color while a trade is active for easy visualization.
Inputs :
- SuperTrend ATR Period: The period used to calculate the Average True Range (ATR) for the SuperTrend indicator.
- SuperTrend ATR Factor: The multiplier for the ATR in the SuperTrend calculation.
Entry Conditions :
A long entry is triggered when:
1. The last 4 consecutive candles are bullish (closing prices are higher than opening prices).
2. The current price is above the SuperTrend line.
3. The strategy is not already in a position.
4. The bar is confirmed (not a partially formed bar).
When all these conditions are met, the strategy enters a long position and provides an alert:
"Long Entry triggered"
Exit Conditions :
The strategy exits the long position when:
1. The closing price drops below the SuperTrend line.
2. An alert is generated: "Close the long Trade"
Visualization :
- The SuperTrend line is plotted, dynamically colored:
- Green when the trend is bullish.
- Red when the trend is bearish.
- The background color turns semi-transparent green while a trade is active, indicating a long position.
Do use proper risk management while using this strategy.

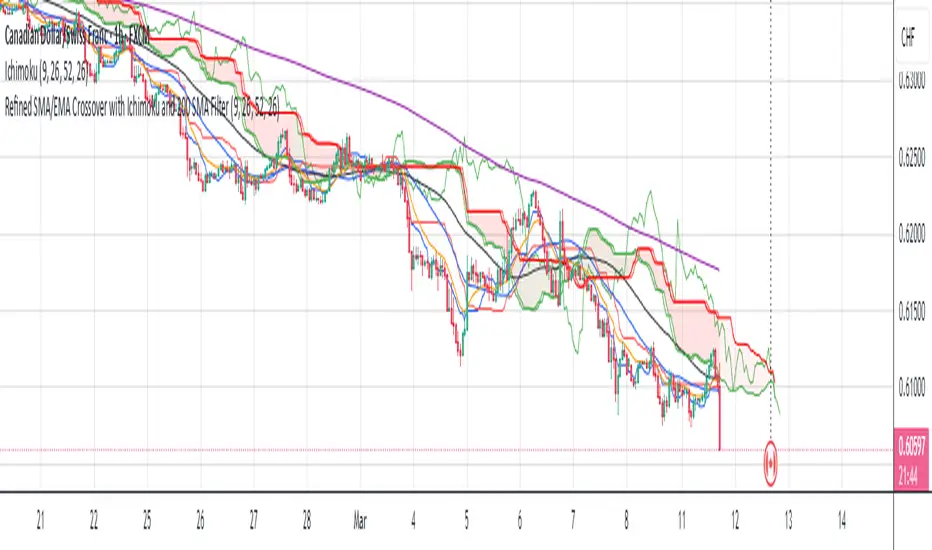
Refined SMA/EMA Crossover with Ichimoku and 200 SMA FilterYour **Refined SMA/EMA Crossover with Ichimoku and 200 SMA Filter** strategy is a multi-faceted technical trading strategy that combines several key technical indicators to refine entry and exit points for trades. Here's a breakdown of the components and how they work together:
### 1. **SMA/EMA Crossover**
- **Simple Moving Average (SMA) & Exponential Moving Average (EMA) Crossover**:
- The core idea behind the crossover strategy is to use the relationship between two moving averages to generate buy or sell signals.
- **SMA** (Simple Moving Average) gives an average of past prices over a set period.
- **EMA** (Exponential Moving Average) places more weight on recent prices, making it more responsive to price movements.
- A **bullish crossover** occurs when a shorter period moving average (such as a 50-period EMA) crosses above a longer period moving average (such as a 200-period SMA), signaling a potential buy.
- A **bearish crossover** occurs when a shorter period moving average crosses below the longer period moving average, signaling a potential sell.
### 2. **Ichimoku Cloud**
- The **Ichimoku Cloud** is a versatile indicator that provides insight into trend direction, support and resistance levels, and momentum.
- **Cloud (Kumo)**: The space between the Senkou Span A and Senkou Span B lines. It helps identify whether the market is in an uptrend, downtrend, or consolidation.
- **Tenkan-sen** (Conversion Line) and **Kijun-sen** (Base Line): These lines are used for additional confirmation of trend direction.
- **Chikou Span**: A lagging line that is used to confirm the trend.
- The general trading rules based on the Ichimoku Cloud are:
- **Bullish Signal**: When the price is above the cloud and the Tenkan-sen crosses above the Kijun-sen.
- **Bearish Signal**: When the price is below the cloud and the Tenkan-sen crosses below the Kijun-sen.
### 3. **200 SMA Filter**
- The **200 SMA Filter** serves as a long-term trend filter.
- When the price is **above the 200 SMA**, it signals a long-term bullish trend, and you only look for buying opportunities.
- When the price is **below the 200 SMA**, it signals a long-term bearish trend, and you only look for selling opportunities.
- This filter helps to avoid counter-trend trades, aligning your positions with the broader market trend.
### **How the Strategy Works Together**
- **Trade Setup (Long Position)**
1. The **200 SMA Filter** must confirm an **uptrend** by ensuring that the price is above the 200 SMA.
2. A **bullish crossover** (e.g., the 50 EMA crossing above the 200 SMA) occurs.
3. **Ichimoku Cloud** confirms a bullish trend, with the price above the cloud and the Tenkan-sen crossing above the Kijun-sen.
4. You enter a **long trade** with this confluence of signals.
- **Trade Setup (Short Position)**
1. The **200 SMA Filter** must confirm a **downtrend** by ensuring the price is below the 200 SMA.
2. A **bearish crossover** (e.g., the 50 EMA crossing below the 200 SMA) occurs.
3. **Ichimoku Cloud** confirms a bearish trend, with the price below the cloud and the Tenkan-sen crossing below the Kijun-sen.
4. You enter a **short trade** with this confluence of signals.
### **Exit Strategy**
- Exits can be determined based on any of the following:
- **SMA/EMA crossover reversal**: Exit when the shorter-term moving average crosses back below the longer-term moving average for a long position or crosses above for a short position.
- **Ichimoku Cloud reversal**: If the price breaks through the cloud or the Tenkan-sen and Kijun-sen lines cross in the opposite direction.
- **Profit target or stop loss**: Setting predefined profit targets or using a trailing stop to lock in profits as the trade moves in your favor.
Summary of the Strategy
This strategy is designed to identify strong trends and avoid false signals by combining:
SMA/EMA crossovers for immediate market direction signals.
Ichimoku Cloud for confirming the strength and trend direction.
A 200
SMA filter to ensure trades align with the long-term trend.
By using these multiple indicators together, the strategy aims to refine entry and exit points, minimize risk, and increase the likelihood of successful trades.
IU EMA Channel StrategyIU EMA Channel Strategy
Overview:
The IU EMA Channel Strategy is a simple yet effective trend-following strategy that uses two Exponential Moving Averages (EMAs) based on the high and low prices. It provides clear entry and exit signals by identifying price crossovers relative to the EMAs while incorporating a built-in Risk-to-Reward Ratio (RTR) for effective risk management.
Inputs ( Settings ):
- RTR (Risk-to-Reward Ratio): Define the ratio for risk-to-reward (default = 2).
- EMA Length: Adjust the length of the EMA channels (default = 100).
How the Strategy Works
1. EMA Channels:
- High-based EMA: EMA calculated on the high price.
- Low-based EMA: EMA calculated on the low price.
The area between these two EMAs creates a "channel" that visually highlights potential support and resistance zones.
2. Entry Rules:
- Long Entry: When the price closes above the high-based EMA (crossover).
- Short Entry: When the price closes below the low-based EMA (crossunder).
These entries ensure trades are taken in the direction of momentum.
3. Stop Loss (SL) and Take Profit (TP):
- Stop Loss:
- For long positions, the SL is set at the previous bar's low.
- For short positions, the SL is set at the previous bar's high.
- Take Profit:
- TP is automatically calculated using the Risk-to-Reward Ratio (RTR) you define.
- Example: If RTR = 2, the TP will be 2x the risk distance.
4. Exit Rules:
- Positions are closed at either the stop loss or the take profit level.
- The strategy manages exits automatically to enforce disciplined risk management.
Visual Features
1. EMA Channels:
- The high and low EMAs are dynamically color-coded:
- Green: Price is above the EMA (bullish condition).
- Red: Price is below the EMA (bearish condition).
- The area between the EMAs is shaded for better visual clarity.
2. Stop Loss and Take Profit Zones:
- SL and TP levels are plotted for both long and short positions.
- Zones are filled with:
- Red: Stop Loss area.
- Green: Take Profit area.
Be sure to manage your risk and position size properly.

ROBO STB GainCraft strategyPure Price Action Candlestick Strategy by ROBO STB
Overview
This strategy is built entirely on the principles of price action and candlestick analysis, designed for traders who prefer raw market data over traditional indicators. By focusing solely on candlestick patterns and their context within recent price movements, the strategy identifies high-probability entry and exit points in liquid markets.
Entry signals are generated based on these patterns appearing at significant market locations, such as after consolidations, pullbacks, or at key support/resistance levels.
Price Action Integration:
Instead of relying on oscillators or moving averages, the script leverages the inherent market structure provided by candlesticks to interpret potential trend reversals or continuations.
This approach provides a clearer view of market sentiment.
No External Indicators:
This script avoids the use of traditional indicators like RSI, MACD, or Bollinger Bands, offering a clean, uncluttered chart.
Risk Management (Optional):
Fixed-percentage risk management options can also be enabled, ensuring trades remain within acceptable risk parameters.
How the Strategy Works
Entry Conditions:
Buy Entry: A bullish candlestick pattern (e.g., bullish engulfing) forms after a period of consolidation or pullback, indicating potential upward momentum.
Sell Entry: A bearish candlestick pattern (e.g., bearish engulfing) suggests a downturn is likely.
Exit Conditions:
Exits are triggered by the appearance of reversal candlestick patterns or through predefined SL/TP levels.
The strategy adapts to varying market conditions by analyzing candlestick structures dynamically.
Ideal Use Cases
Short-Term Trading: Designed for day traders and scalpers targeting quick moves on shorter timeframes.
Highly Liquid Markets: Performs best in markets with high liquidity, such as Nifty, Bank Nifty, or major forex pairs, where candlestick patterns provide reliable signals.
30-Minute Timeframe: For optimal results, the strategy is recommended for use on a 30-minute timeframe.
Transparency and Realism
Backtesting Parameters:
The default backtesting settings simulate realistic trading conditions, including commissions and slippage, ensuring that results are not misleading.
Trade sizes are calibrated to risk sustainable amounts (.05% maximum equity per trade).
Dataset Selection:
This strategy has been tested on diverse datasets to produce a statistically significant number of trades, ensuring robust performance evaluation.
Why This Strategy is Unique
This script stands apart by offering a refined approach to price action trading. Unlike generic indicator mashups, it provides traders with an actionable, candlestick-focused methodology tailored for volatile, high-liquidity markets.
The strategy is both simple to understand and powerful in execution, making it an excellent tool for traders who want to develop their skills in raw price action analysis while maintaining strict risk management.
Key Features
Candlestick-Based Entry and Exit Signals:
1. Risk Management:
- Risk-to-Reward Ratio (RTR):
Set a customizable risk-to-reward ratio to calculate target prices based on stop-loss levels.
Default: 3:1
order size added -100
2. Opening Range Identification
- Opening Range High and Low:
The script detects the high and low of the first trading session using Pine Script's session functions.
These levels are plotted as visual guides on the chart:
- High: Lime-colored circles.
- Low: Red-colored circles.
3. Trade Entry Logic
- Long Entry:
A long trade is triggered when the price closes above the opening range high.
- Entry condition: Crossover of the price above the opening range high.
-Short Entry:
A short trade is triggered when the price closes below the opening range low.
- Entry condition: Crossunder of the price below the opening range low.
Both entries are conditional on the absence of an existing position.
4. Stop Loss and Take Profit
- Long Position:
- Stop Loss: Previous candle's low.
- Take Profit: Calculated based on the RTR.
- **Short Position:**
- **Stop Loss:** Previous candle's high.
- **Take Profit:** Calculated based on the RTR.
The strategy plots these levels for visual reference:
- Stop Loss: Red dashed lines.
- Take Profit: Green dashed lines.
5. Visual Enhancements
-Trade Level Highlighting:
The script dynamically shades the areas between the entry price and SL/TP levels:
- Red shading for the stop-loss region.
- Green shading for the take-profit region.
How to Use:
1.Input Configuration:
Adjust the Risk-to-Reward ratio, max trades per day, and session end time to suit your trading preferences.
2.Visual Cues:
Use the opening range high/low lines and shading to identify potential breakout opportunities.
3.Execution:
The strategy will automatically enter and exit trades based on the conditions. Review the plotted SL and TP levels to monitor the risk-reward setup.
Important Notes:
- This strategy is designed for intraday trading and works best in markets with high volatility during the opening session.
- Backtest the strategy on your preferred market and timeframe to ensure compatibility.
- Proper risk management and position sizing are essential when using this strategy in live markets.
Please let me know if you have any doubts.
MACD Aggressive Scalp SimpleComment on the Script
Purpose and Structure:
The script is a scalping strategy based on the MACD indicator combined with EMA (50) as a trend filter.
It uses the MACD histogram's crossover/crossunder of zero to trigger entries and exits, allowing the trader to capitalize on short-term momentum shifts.
The use of strategy.close ensures that positions are closed when specified conditions are met, although adjustments were made to align with Pine Script version 6.
Strengths:
Simplicity and Clarity: The logic is straightforward and focuses on essential scalping principles (momentum-based entries and exits).
Visual Indicators: The plotted MACD line, signal line, and histogram columns provide clear visual feedback for the strategy's operation.
Trend Confirmation: Incorporating the EMA(50) as a trend filter helps avoid trades that go against the prevailing trend, reducing the likelihood of false signals.
Dynamic Exit Conditions: The conditional logic for closing positions based on weakening momentum (via MACD histogram change) is a good way to protect profits or minimize losses.
Potential Improvements:
Parameter Inputs:
Make the MACD (12, 26, 9) and EMA(50) values adjustable by the user through input statements for better customization during backtesting.
Example:
pine
Copy code
macdFast = input(12, title="MACD Fast Length")
macdSlow = input(26, title="MACD Slow Length")
macdSignal = input(9, title="MACD Signal Line Length")
emaLength = input(50, title="EMA Length")
Stop Loss and Take Profit:
The strategy currently lacks explicit stop-loss or take-profit levels, which are critical in a scalping strategy to manage risk and lock in profits.
ATR-based or fixed-percentage exits could be added for better control.
Position Size and Risk Management:
While the script uses 50% of equity per trade, additional options (e.g., fixed position sizes or risk-adjusted sizes) would be beneficial for flexibility.
Avoid Overlapping Signals:
Add logic to prevent overlapping signals (e.g., opening a new position immediately after closing one on the same bar).
Backtesting Optimization:
Consider adding labels or markers (label.new or plotshape) to visualize entry and exit points on the chart for better debugging and analysis.
The inclusion of performance metrics like max drawdown, Sharpe ratio, or profit factor would help assess the strategy's robustness during backtesting.
Compatibility with Live Trading:
The strategy could be further enhanced with alert conditions using alertcondition to notify the trader of buy/sell signals in real-time.

DemaRSI StrategyThis is a repost to a old script that cant be updated anymore, the request was made on Feb, 27, 2016.
Here's a engaging description for the tradingview script:
**DemaRSI Strategy: A Proven Trading System**
Join thousands of traders who have already experienced the power of this highly effective strategy. The DemaRSI system combines two powerful indicators - DEMA (Double Exponential Moving Average) and RSI (Relative Strength Index) - to generate profitable trades with minimal risk.
**Key Features:**
* **Trend-Following**: Our algorithm identifies strong trends using a combination of DEMA and RSI, allowing you to ride the waves of market momentum.
* **Risk Management**: The system includes built-in stop-loss and take-profit levels, ensuring that your gains are protected and losses are minimized.
* **Session-Based Trading**: Trade during specific sessions only (e.g., London or New York) for even more targeted results.
* **Customizable Settings**: Adjust the length of moving averages, RSI periods, and other parameters to suit your trading style.
**What You'll Get:**
* A comprehensive strategy that can be used with any broker or platform
* Easy-to-use interface with customizable settings
* Real-time performance metrics and backtesting capabilities
**Start Trading Like a Pro Today!**
This script is designed for intermediate to advanced traders who want to take their trading game to the next level. With its robust risk management features, this strategy can help you achieve consistent profits in various market conditions.
**Disclaimer:** This script is not intended as investment advice and should be used at your own discretion. Trading carries inherent risks, and losses are possible.
~Llama3

MicuRobert EMA Cross StrategyThis is a repost of a old strategy that cant be updated anymore, it was a request for a user made in Oct, 6, 2015
Here's a possible engaging description for the tradingview script:
**MicuRobert EMA Cross V2: A Powerful Trading Strategy**
Join the ranks of successful traders with this advanced strategy, designed to help you profit from market trends. The MicuRobert EMA Cross V2 combines two essential indicators - Exponential Moving Average (EMA) and Divergence EMA (DEMA) - to generate buy and sell signals.
**Key Features:**
* **Trading Session Filter**: Only trade during your preferred session, ensuring you're in sync with market conditions.
* **Trailing Stop**: Automatically adjust stop-loss levels to lock in profits or limit losses.
* **Customizable Trade Size**: Set the size of each trade based on your risk tolerance and trading goals.
**How it Works:**
The script uses two EMAs (5-period and 34-period) to identify trends. When the shorter EMA crosses above the longer one, a buy signal is generated. Conversely, when the shorter EMA falls below the longer one, a sell signal is triggered. The strategy also incorporates divergence analysis between price action and the EMAs.
**Visual Aids:**
* **EMA Plots**: Visualize the two EMAs on your chart to gauge market momentum.
* **Buy/Sell Signals**: See when buy or sell signals are generated, along with their corresponding entry prices.
* **Trailing Stop Lines**: Monitor stop-loss levels as they adjust based on price action.
**Get Started:**
Download this script and start trading like a pro! With its robust features and customizable settings, the MicuRobert EMA Cross V2 is an excellent addition to any trader's arsenal.
~Llama3

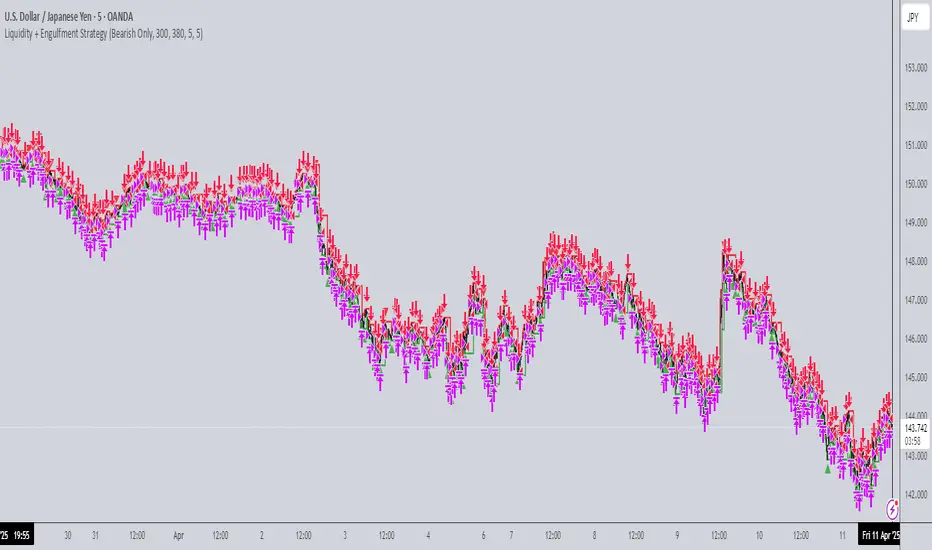
Liquidity + Engulfment StrategyThis strategy identifies potential trading opportunities by combining bullish and bearish engulfing candle patterns with liquidity seal-off points. The logic is based on the concept of engulfing candles, which signal a shift in market sentiment, and liquidity lines, which represent local price extremes (highs and lows) that can indicate potential reversal or continuation points.
Key Features:
Mode Selection
The strategy allows for three modes: "Both", "Bullish Only", and "Bearish Only". Users can choose whether to trade both directions, only bullish setups, or only bearish setups.
Time Range
Users can define a specific time range for when the strategy is active, enabling tailored analysis and trade execution over a desired period.
Engulfing Candles
Bullish Engulfing: A candle that closes above the high of the previous bearish candle, signaling potential upward momentum.
Bearish Engulfing: A candle that closes below the low of the previous bullish candle, indicating a potential downtrend.
Liquidity Seal-Off Points
The strategy detects local highs and local lows within a specified lookback period, which can serve as critical support and resistance points.
A bullish signal is triggered when the price touches a lower liquidity point (local low), and a bearish signal is triggered at a higher liquidity point (local high).
Signal Confirmation
Signals are only triggered when both an engulfing candle and the price action at a liquidity seal-off point align. This helps filter out weaker signals.
Consecutive signals are prevented by locking the trade direction after an initial signal and waiting for the liquidity line to be broken before re-triggering a signal.
Entry and Exit Conditions
The strategy can enter both long (bullish) or short (bearish) positions based on the mode and signals.
Exit is based on opposing signals or reaching predefined stop-loss and take-profit levels.
Alerts
The strategy supports alert conditions to notify users when bullish engulfing after a lower liquidity touch or bearish engulfing after an upper liquidity touch is detected.
MultiLayer Awesome Oscillator Saucer Strategy [Skyrexio]Overview
MultiLayer Awesome Oscillator Saucer Strategy leverages the combination of Awesome Oscillator (AO), Williams Alligator, Williams Fractals and Exponential Moving Average (EMA) to obtain the high probability long setups. Moreover, strategy uses multi trades system, adding funds to long position if it considered that current trend has likely became stronger. Awesome Oscillator is used for creating signals, while Alligator and Fractal are used in conjunction as an approximation of short-term trend to filter them. At the same time EMA (default EMA's period = 100) is used as high probability long-term trend filter to open long trades only if it considers current price action as an uptrend. More information in "Methodology" and "Justification of Methodology" paragraphs. The strategy opens only long trades.
Unique Features
No fixed stop-loss and take profit: Instead of fixed stop-loss level strategy utilizes technical condition obtained by Fractals and Alligator to identify when current uptrend is likely to be over (more information in "Methodology" and "Justification of Methodology" paragraphs)
Configurable Trading Periods: Users can tailor the strategy to specific market windows, adapting to different market conditions.
Multilayer trades opening system: strategy uses only 10% of capital in every trade and open up to 5 trades at the same time if script consider current trend as strong one.
Short and long term trend trade filters: strategy uses EMA as high probability long-term trend filter and Alligator and Fractal combination as a short-term one.
Methodology
The strategy opens long trade when the following price met the conditions:
1. Price closed above EMA (by default, period = 100). Crossover is not obligatory.
2. Combination of Alligator and Williams Fractals shall consider current trend as an upward (all details in "Justification of Methodology" paragraph)
3. Awesome Oscillator shall create the "Saucer" long signal (all details in "Justification of Methodology" paragraph). Buy stop order is placed one tick above the candle's high of last created "Saucer signal".
4. If price reaches the order price, long position is opened with 10% of capital.
5. If currently we have opened position and price creates and hit the order price of another one "Saucer" signal another one long position will be added to the previous with another one 10% of capital. Strategy allows to open up to 5 long trades simultaneously.
6. If combination of Alligator and Williams Fractals shall consider current trend has been changed from up to downtrend, all long trades will be closed, no matter how many trades has been opened.
Script also has additional visuals. If second long trade has been opened simultaneously the Alligator's teeth line is plotted with the green color. Also for every trade in a row from 2 to 5 the label "Buy More" is also plotted just below the teeth line. With every next simultaneously opened trade the green color of the space between teeth and price became less transparent.
Strategy settings
In the inputs window user can setup strategy setting: EMA Length (by default = 100, period of EMA, used for long-term trend filtering EMA calculation). User can choose the optimal parameters during backtesting on certain price chart.
Justification of Methodology
Let's go through all concepts used in this strategy to understand how they works together. Let's start from the easies one, the EMA. Let's briefly explain what is EMA. The Exponential Moving Average (EMA) is a type of moving average that gives more weight to recent prices, making it more responsive to current price changes compared to the Simple Moving Average (SMA). It is commonly used in technical analysis to identify trends and generate buy or sell signals. It can be calculated with the following steps:
1.Calculate the Smoothing Multiplier:
Multiplier = 2 / (n + 1), Where n is the number of periods.
2. EMA Calculation
EMA = (Current Price) × Multiplier + (Previous EMA) × (1 − Multiplier)
In this strategy uses EMA an initial long term trend filter. It allows to open long trades only if price close above EMA (by default 50 period). It increases the probability of taking long trades only in the direction of the trend.
Let's go to the next, short-term trend filter which consists of Alligator and Fractals. Let's briefly explain what do these indicators means. The Williams Alligator, developed by Bill Williams, is a technical indicator designed to spot trends and potential market reversals. It uses three smoothed moving averages, referred to as the jaw, teeth, and lips:
Jaw (Blue Line): The slowest of the three, based on a 13-period smoothed moving average shifted 8 bars ahead.
Teeth (Red Line): The medium-speed line, derived from an 8-period smoothed moving average shifted 5 bars forward.
Lips (Green Line): The fastest line, calculated using a 5-period smoothed moving average shifted 3 bars forward.
When these lines diverge and are properly aligned, the "alligator" is considered "awake," signaling a strong trend. Conversely, when the lines overlap or intertwine, the "alligator" is "asleep," indicating a range-bound or sideways market. This indicator assists traders in identifying when to act on or avoid trades.
The Williams Fractals, another tool introduced by Bill Williams, are used to pinpoint potential reversal points on a price chart. A fractal forms when there are at least five consecutive bars, with the middle bar displaying the highest high (for an up fractal) or the lowest low (for a down fractal), relative to the two bars on either side.
Key Points:
Up Fractal: Occurs when the middle bar has a higher high than the two preceding and two following bars, suggesting a potential downward reversal.
Down Fractal: Happens when the middle bar shows a lower low than the surrounding two bars, hinting at a possible upward reversal.
Traders often combine fractals with other indicators to confirm trends or reversals, improving the accuracy of trading decisions.
How we use their combination in this strategy? Let’s consider an uptrend example. A breakout above an up fractal can be interpreted as a bullish signal, indicating a high likelihood that an uptrend is beginning. Here's the reasoning: an up fractal represents a potential shift in market behavior. When the fractal forms, it reflects a pullback caused by traders selling, creating a temporary high. However, if the price manages to return to that fractal’s high and break through it, it suggests the market has "changed its mind" and a bullish trend is likely emerging.
The moment of the breakout marks the potential transition to an uptrend. It’s crucial to note that this breakout must occur above the Alligator's teeth line. If it happens below, the breakout isn’t valid, and the downtrend may still persist. The same logic applies inversely for down fractals in a downtrend scenario.
So, if last up fractal breakout was higher, than Alligator's teeth and it happened after last down fractal breakdown below teeth, algorithm considered current trend as an uptrend. During this uptrend long trades can be opened if signal was flashed. If during the uptrend price breaks down the down fractal below teeth line, strategy considered that uptrend is finished with the high probability and strategy closes all current long trades. This combination is used as a short term trend filter increasing the probability of opening profitable long trades in addition to EMA filter, described above.
Now let's talk about Awesome Oscillator's "Sauser" signals. Briefly explain what is the Awesome Oscillator. The Awesome Oscillator (AO), created by Bill Williams, is a momentum-based indicator that evaluates market momentum by comparing recent price activity to a broader historical context. It assists traders in identifying potential trend reversals and gauging trend strength.
AO = SMA5(Median Price) − SMA34(Median Price)
where:
Median Price = (High + Low) / 2
SMA5 = 5-period Simple Moving Average of the Median Price
SMA 34 = 34-period Simple Moving Average of the Median Price
Now we know what is AO, but what is the "Saucer" signal? This concept was introduced by Bill Williams, let's briefly explain it and how it's used by this strategy. Initially, this type of signal is a combination of the following AO bars: we need 3 bars in a row, the first one shall be higher than the second, the third bar also shall be higher, than second. All three bars shall be above the zero line of AO. The price bar, which corresponds to third "saucer's" bar is our signal bar. Strategy places buy stop order one tick above the price bar which corresponds to signal bar.
After that we can have the following scenarios.
Price hit the order on the next candle in this case strategy opened long with this price.
Price doesn't hit the order price, the next candle set lower low. If current AO bar is increasing buy stop order changes by the script to the high of this new bar plus one tick. This procedure repeats until price finally hit buy order or current AO bar become decreasing. In the second case buy order cancelled and strategy wait for the next "Saucer" signal.
If long trades has been opened strategy use all the next signals until number of trades doesn't exceed 5. All trades are closed when the trend changes to downtrend according to combination of Alligator and Fractals described above.
Why we use "Saucer" signals? If AO above the zero line there is a high probability that price now is in uptrend if we take into account our two trend filters. When we see the decreasing bars on AO and it's above zero it's likely can be considered as a pullback on the uptrend. When we see the stop of AO decreasing and the first increasing bar has been printed there is a high probability that this local pull back is finished and strategy open long trade in the likely direction of a main trend.
Why strategy use only 10% per signal? Sometimes we can see the false signals which appears on sideways. Not risking that much script use only 10% per signal. If the first long trade has been open and price continue going up and our trend approximation by Alligator and Fractals is uptrend, strategy add another one 10% of capital to every next saucer signal while number of active trades no more than 5. This capital allocation allows to take part in long trades when current uptrend is likely to be strong and use only 10% of capital when there is a high probability of sideways.
Backtest Results
Operating window: Date range of backtests is 2023.01.01 - 2024.11.25. It is chosen to let the strategy to close all opened positions.
Commission and Slippage: Includes a standard Binance commission of 0.1% and accounts for possible slippage over 5 ticks.
Initial capital: 10000 USDT
Percent of capital used in every trade: 10%
Maximum Single Position Loss: -5.10%
Maximum Single Profit: +22.80%
Net Profit: +2838.58 USDT (+28.39%)
Total Trades: 107 (42.99% win rate)
Profit Factor: 3.364
Maximum Accumulated Loss: 373.43 USDT (-2.98%)
Average Profit per Trade: 26.53 USDT (+2.40%)
Average Trade Duration: 78 hours
These results are obtained with realistic parameters representing trading conditions observed at major exchanges such as Binance and with realistic trading portfolio usage parameters.
How to Use
Add the script to favorites for easy access.
Apply to the desired timeframe and chart (optimal performance observed on 3h BTC/USDT).
Configure settings using the dropdown choice list in the built-in menu.
Set up alerts to automate strategy positions through web hook with the text: {{strategy.order.alert_message}}
Disclaimer:
Educational and informational tool reflecting Skyrex commitment to informed trading. Past performance does not guarantee future results. Test strategies in a simulated environment before live implementation

Bollinger Bands + RSI StrategyThe Bollinger Bands + RSI strategy combines volatility and momentum indicators to spot trading opportunities in intraday settings. Here’s a concise summary:
Components:
Bollinger Bands: Measures market volatility. The lower band signals potential buying opportunities when the price is considered oversold.
Relative Strength Index (RSI): Evaluates momentum to identify overbought or oversold conditions. An RSI below 30 indicates oversold, suggesting a buy, and above 70 indicates overbought, suggesting a sell.
Strategy Execution:
Buy Signal : Triggered when the price falls below the lower Bollinger Band while the RSI is also below 30.
Sell Signal : Activated when the price exceeds the upper Bollinger Band with an RSI above 70.
Exit Strategy : Exiting a buy position is considered when the RSI crosses back above 50, capturing potential rebounds.
Advantages:
Combines price levels with momentum for more reliable signals.
Clearly defined entry and exit points help minimize emotional trading.
Considerations:
Can produce false signals in very volatile or strongly trending markets.
Best used in markets without a strong prevailing trend.
This strategy aids traders in making decisions based on technical indicators, enhancing their ability to profit from short-term price movements.

Ichimoku + RSI + MACD Strategy1. Relative Strength Index (RSI)
Overview:
The Relative Strength Index (RSI) is a momentum oscillator that measures the speed and change of price movements. It ranges from 0 to 100 and is typically used to identify overbought or oversold conditions in a market.
How to Use with Ichimoku:
Long Entry: Look for RSI to be above 30 (indicating it is not oversold) when the price is above the Ichimoku Cloud.
Short Entry: Look for RSI to be below 70 (indicating it is not overbought) when the price is below the Ichimoku Cloud.
2. Moving Average Convergence Divergence (MACD)
Overview:
The MACD is a trend-following momentum indicator that shows the relationship between two moving averages of a security’s price. It consists of the MACD line, signal line, and histogram.
How to Use with Ichimoku:
Long Entry: Enter a long position when the MACD line crosses above the signal line while the price is above the Ichimoku Cloud.
Short Entry: Enter a short position when the MACD line crosses below the signal line while the price is below the Ichimoku Cloud.
Combined Strategy Example
Here’s a brief outline of how to structure a trading strategy using Ichimoku, RSI, and MACD:
Long Entry Conditions:
Price is above the Ichimoku Cloud.
RSI is above 30.
MACD line crosses above the signal line.
Short Entry Conditions:
Price is below the Ichimoku Cloud.
RSI is below 70.
MACD line crosses below the signal line.
Exit Conditions:
Exit long when MACD line crosses below the signal line.
Exit short when MACD line crosses above the signal line.

CCI Threshold StrategyThe CCI Threshold Strategy is a trading approach that utilizes the Commodity Channel Index (CCI) as a momentum indicator to identify potential buy and sell signals in financial markets. The CCI is particularly effective in detecting overbought and oversold conditions, providing traders with insights into possible price reversals. This strategy is designed for use in various financial instruments, including stocks, commodities, and forex, and aims to capitalize on price movements driven by market sentiment.
Commodity Channel Index (CCI)
The CCI was developed by Donald Lambert in the 1980s and is primarily used to measure the deviation of a security's price from its average price over a specified period.
The formula for CCI is as follows:
CCI=(TypicalPrice−SMA)×0.015MeanDeviation
CCI=MeanDeviation(TypicalPrice−SMA)×0.015
where:
Typical Price = (High + Low + Close) / 3
SMA = Simple Moving Average of the Typical Price
Mean Deviation = Average of the absolute deviations from the SMA
The CCI oscillates around a zero line, with values above +100 indicating overbought conditions and values below -100 indicating oversold conditions (Lambert, 1980).
Strategy Logic
The CCI Threshold Strategy operates on the following principles:
Input Parameters:
Lookback Period: The number of periods used to calculate the CCI. A common choice is 9, as it balances responsiveness and noise.
Buy Threshold: Typically set at -90, indicating a potential oversold condition where a price reversal is likely.
Stop Loss and Take Profit: The strategy allows for risk management through customizable stop loss and take profit points.
Entry Conditions:
A long position is initiated when the CCI falls below the buy threshold of -90, indicating potential oversold levels. This condition suggests that the asset may be undervalued and due for a price increase.
Exit Conditions:
The long position is closed when the closing price exceeds the highest price of the previous day, indicating a bullish reversal. Additionally, if the stop loss or take profit thresholds are hit, the position will be exited accordingly.
Risk Management:
The strategy incorporates optional stop loss and take profit mechanisms, which can be toggled on or off based on trader preference. This allows for flexibility in risk management, aligning with individual risk tolerances and trading styles.
Benefits of the CCI Threshold Strategy
Flexibility: The CCI Threshold Strategy can be applied across different asset classes, making it versatile for various market conditions.
Objective Signals: The use of quantitative thresholds for entry and exit reduces emotional bias in trading decisions (Tversky & Kahneman, 1974).
Enhanced Risk Management: By allowing traders to set stop loss and take profit levels, the strategy aids in preserving capital and managing risk effectively.
Limitations
Market Noise: The CCI can produce false signals, especially in highly volatile markets, leading to potential losses (Bollinger, 2001).
Lagging Indicator: As a lagging indicator, the CCI may not always capture rapid market movements, resulting in missed opportunities (Pring, 2002).
Conclusion
The CCI Threshold Strategy offers a systematic approach to trading based on well-established momentum principles. By focusing on overbought and oversold conditions, traders can make informed decisions while managing risk effectively. As with any trading strategy, it is crucial to backtest the approach and adapt it to individual trading styles and market conditions.
References
Bollinger, J. (2001). Bollinger on Bollinger Bands. New York: McGraw-Hill.
Lambert, D. (1980). Commodity Channel Index. Technical Analysis of Stocks & Commodities, 2, 3-5.
Pring, M. J. (2002). Technical Analysis Explained. New York: McGraw-Hill.
Tversky, A., & Kahneman, D. (1974). Judgment under uncertainty: Heuristics and biases. Science, 185(4157), 1124-1131.

Bullish B's - RSI Divergence StrategyThis indicator strategy is an RSI (Relative Strength Index) divergence trading tool designed to identify high-probability entry and exit points based on trend shifts. It utilizes both regular and hidden RSI divergence patterns to spot potential reversals, with signals for both bullish and bearish conditions.
Key Features
Divergence Detection:
Bullish Divergence: Signals when RSI indicates momentum strengthening at a lower price level, suggesting a reversal to the upside.
Bearish Divergence: Signals when RSI shows weakening momentum at a higher price level, indicating a potential downside reversal.
Hidden Divergences: Looks for hidden bullish and bearish divergences, which signal trend continuation points where price action aligns with the prevailing trend.
Volume-Adjusted Entry Signals:
The strategy enters long trades when RSI shows bullish or hidden bullish divergence, indicating an upward momentum shift.
An optional volume filter ensures that only high-volume, high-conviction trades trigger a signal.
Exit Signals:
Exits long positions when RSI reaches a customizable overbought level, typically indicating a potential reversal or profit-taking opportunity.
Also closes positions if bearish divergence signals appear after a bullish setup, providing protection against trend reversals.
Trailing Stop-Loss:
Uses a trailing stop mechanism based on ATR (Average True Range) or a percentage threshold to lock in profits as the price moves in favor of the trade.
Alerts and Custom Notifications:
Integrated with TradingView alerts to notify the user when entry and exit conditions are met, supporting timely decision-making without constant monitoring.
Customizable Parameters:
Users can adjust the RSI period, pivot lookback range, overbought level, trailing stop type (ATR or percentage), and divergence range to fit their trading style.
Ideal Usage
This strategy is well-suited for trend traders and swing traders looking to capture reversals and trend continuations on medium to long timeframes. The divergence signals, paired with trailing stops and volume validation, make it adaptable for multiple asset classes, including stocks, forex, and crypto.
Summary
With its focus on RSI divergence, trailing stop-loss management, and volume filtering, this strategy aims to identify and capture trend changes with minimized risk. This allows traders to efficiently capture profitable moves and manage open positions with precision.
This Strategy BEST works with GLD!

RVI Crossover Strategy[Kopottaja]Overview of the RVI Crossover Strategy
Strategy Name: RVI Crossover Strategy
Purpose: The RVI Crossover Strategy is based on the crossover signals between the Relative Vigor Index (RVI) and its moving average signal line. This strategy aims to identify potential buy and sell signals by evaluating the market’s directional trend.
Key Indicator Features
Relative Vigor Index (RVI): This indicator measures the momentum of price changes over a specified period and helps identify the market’s current trend. The RVI is based on the idea that prices generally close higher than they open in an uptrend (and lower in a downtrend). The RVI helps provide an indication of the strength and direction of a trend.
Signal Line: A moving average (e.g., SMA) is applied to the RVI values, creating a "signal line." When the RVI crosses above or below this line, it signals a potential trading opportunity.
Calculations and Settings
Calculating the RVI: The RVI is calculated by comparing the difference between the close and open prices to the difference between high and low prices. This provides information about the direction and momentum of price movement:
RVI= Sum(SWMA(high−low))Sum(SWMA(close−open))
where SWMA is a smoothed weighted moving average over a specified period.
Signal Line Calculation: The RVI value is smoothed by applying a simple moving average (SMA) to create the signal line. This signal line helps filter crossover signals for improved accuracy.
Buy and Sell Conditions: Buy and sell conditions are identified based on crossovers between the RVI and its signal line.
Buy Signal: A buy condition is triggered when the RVI crosses above the signal line, provided that the "Bearish" condition (trend confirmation) is met.
Sell Signal: A sell condition occurs when the RVI crosses below the signal line, alongside the "Bullish" trend confirmation.
Volume-Weighted Moving Averages (VWMA): VWMA indicators are used to assess price-volume relationships over different timeframes:
Fast VWMA: A short-period volume-weighted moving average.
Slow VWMA: A longer-period volume-weighted moving average. These values are used to strengthen the buy and sell conditions by confirming trend directions (Bullish or Bearish).
Disclaimer: This is an educational and informational tool. Past performance is not indicative of future results. Always backtest before using in live markets
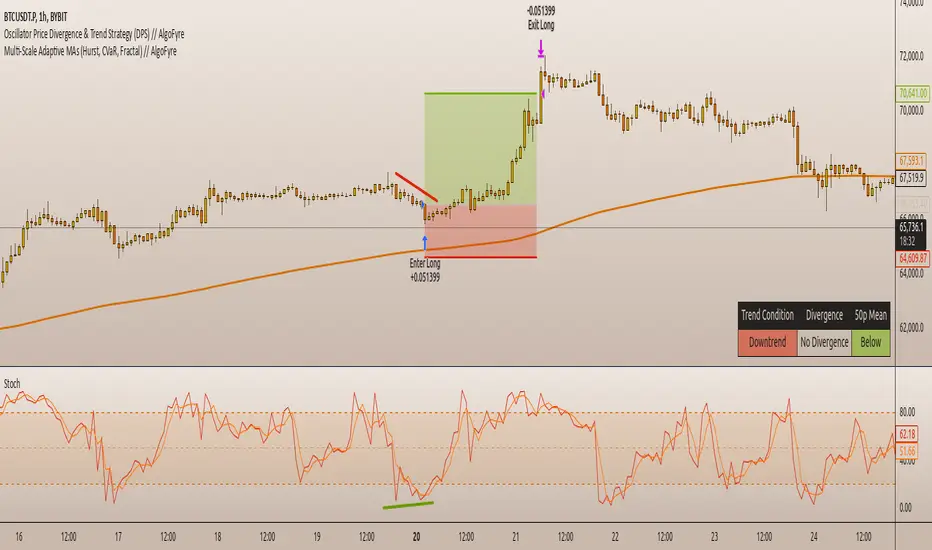
Oscillator Price Divergence & Trend Strategy (DPS) // AlgoFyreThe Oscillator Price Divergence & Trend Strategy (DPS) strategy combines price divergence and trend indicators for trend trading. It uses divergence conditions to identify entry points and a trend source for directional bias. The strategy incorporates risk management through dynamic position sizing based on a fixed risk amount. It allows for both long and short positions with customizable stop-loss and take-profit levels. The script includes visualization options for entry, stop-loss, and take-profit levels, enhancing trade analysis.
TABLE OF CONTENTS
🔶 ORIGINALITY
🔸Divergence-Trend Combination
🔸Dynamic Position Sizing
🔸Customizable Risk Management
🔶 FUNCTIONALITY
🔸Indicators
🞘 Trend Indicator
🞘 Oscillator Source
🔸Conditions
🞘 Long Entry
🞘 Short Entry
🞘 Take Profit
🞘 Stop Loss
🔶 INSTRUCTIONS
🔸Adding the Strategy to the Chart
🔸Configuring the Strategy
🔸Backtesting and Practice
🔸Market Awareness
🔸Visual Customization
🔶 CONCLUSION
▅▅▅▅▅▅▅▅▅▅▅▅▅▅▅▅▅▅▅▅▅▅▅▅▅▅▅▅▅▅▅▅▅▅▅▅▅▅▅▅▅▅▅▅▅
🔶 ORIGINALITY The Divergence Trend Trading with Dynamic Position Sizing strategy uniquely combines price divergence indicators with trend analysis to optimize entry and exit points. Unlike static trading strategies, it employs dynamic position sizing based on a fixed risk amount, ensuring consistent risk management. This approach allows traders to adapt to varying market conditions by adjusting position sizes according to predefined risk parameters, enhancing both flexibility and control in trading decisions. The strategy's integration of customizable stop-loss and take-profit levels further refines its risk management capabilities, making it a robust tool for both trending and volatile markets.
🔸Divergence-Trend Combination By combining trend direction with divergence conditions, the strategy enhances the accuracy of entry signals, aligning trades with prevailing market trends.
🔸Dynamic Position Sizing This strategy calculates position sizes dynamically, based on a fixed risk amount, allowing traders to maintain consistent risk exposure across trades.
🔸Customizable Risk Management Traders can set flexible risk-reward ratios and adjust stop-loss and take-profit levels, tailoring the strategy to their risk tolerance and market conditions.
🔶 FUNCTIONALITY The Divergence Trend Trading with Dynamic Position Sizing strategy leverages a combination of trend indicators and price and oscillator divergences to identify optimal trading opportunities. This strategy is designed to capitalize on medium to long-term price movements and works best on h1, h4 or D1 timeframes. It allows traders to manage risk effectively while taking advantage of both long and short positions.
🔸Indicators 🞘 Trend Indicator: A long trend is used to determine market direction, ensuring trades align with prevailing trends.
Recommendation: We recommend using the Adaptive MAs (Hurst, CVaR, Fractal) // AlgoFyre indicator with the following settings for trend detection. However, you can use any trend indicator that suits your trading style, e.g. an EMA 200.
🞘 Oscillator Source: The oscillator source is used for momentum price divergence identification. Any momentum oscillator can be used, e.g. RSI, Stochastic etc. A good oscillator is the Stochastic with the following settings:
🔸Conditions 🞘 Long Entry: A long entry condition is met if price closes above the trend AND selected divergence conditions are met, e.g. regular bullish divergence with a 10 bar lookback period with the divergence being below the 50 point mean. If the info table shows all 3 columns in the same color, the entry conditions are met and a position is opened.
🞘 Short Entry: A short entry condition is met if price closes below the trend AND selected divergence conditions are met, e.g. regular bearish divergence with a 10 bar lookback period with the divergence being above the 50 point mean.
🞘 Take Profit: Take Profit is determined by the Risk to Reward Ratio settings depending on the price distance between the entry price and the stop loss price, e.g. if stop loss is 1% away from entry and Risk Reward Ratio is 3:1 then Take Profit will be set at 3% from entry.
🞘 Stop Loss: Stop loss is a fixed level away from the trend source. For long positions, stop loss is set below the trend, and for short positions, above the trend.
🔶 INSTRUCTIONS The Divergence Trend Trading with Dynamic Position Sizing strategy can be set up by adding it to your TradingView chart and configuring parameters such as the oscillator source, trend source, and risk management settings. This strategy is designed to capitalize on short-term price movements by dynamically adjusting position sizes based on predefined risk parameters. Enhance the accuracy of signals by combining this strategy with additional indicators like trend-following or momentum-based tools. Adjust settings to better manage risk and optimize entry and exit points.
🔸Adding the Strategy to the Chart:
Go to your TradingView chart.
Click on the "Indicators" button at the top.
Search for "Divergence Trend Trading with Dynamic Position Sizing // AlgoFyre" in the indicators list.
Click on the strategy to add it to your chart.
🔸Configuring the Strategy:
Open the strategy settings by clicking on the gear icon next to its name on the chart.
Oscillator Source: Select the source for the oscillator. An oscillator like Stochastic needs to be attached to the chart already in order to be used as an oscillator source to be selectable.
Trend Source: Choose the trend source to determine market direction. A trend indicator like Adaptive MAs (Hurst, CVaR, Fractal) // AlgoFyre needs to be attached to the chart already in order to be used as a trend source to be selectable.
Stop Loss Percentage: Set the stop loss distance from the trend source as a percentage.
Risk/Reward Ratio: Define the desired risk/reward ratio for trades.
🔸Backtesting and Practice:
Backtest the strategy on historical data to understand how it performs in various market environments.
Practice using the strategy on a demo account before implementing it in live trading.
🔸Market Awareness:
Keep an eye on market news and events that might cause extreme price movements. The strategy reacts to price data and might not account for news-driven events that can cause large deviations.
🔸Visual Customization Visualization Settings: Customize the display of entry price, take profit, and stop loss levels.
Color Settings: Switch to the AlgoFyre theme or set custom colors for bullish, bearish, and neutral states.
Table Settings: Enable or disable the information table and adjust its position.
🔶 CONCLUSION
The Divergence Trend Trading with Dynamic Position Sizing strategy provides a robust framework for capitalizing on short-term market trends by combining price divergence with dynamic position sizing. This strategy leverages divergence conditions to identify entry points and utilizes a trend source for directional bias, ensuring trades align with prevailing market conditions. By incorporating dynamic position sizing based on a fixed risk amount, traders can effectively manage risk and adapt to varying market conditions. The strategy's customizable stop-loss and take-profit levels further enhance its risk management capabilities, making it a versatile tool for both trending and volatile markets. With its strategic blend of technical indicators and risk management, the Divergence Trend Trading strategy offers traders a comprehensive approach to optimizing trade execution and maximizing potential returns.