No Wick Strategy (No-wick candles) — by Sh1n1gam1**No Wick Strategy - Momentum Trading System**
This strategy identifies and trades "no wick" or "minimal wick" candles, which often indicate strong directional momentum and conviction in the market.
**STRATEGY CONCEPT:**
The No Wick Strategy capitalizes on candles that show strong directional commitment - bullish candles with little to no bottom wick (buyers in control from the start) and bearish candles with little to no top wick (sellers dominating from the open).
**HOW IT WORKS:**
📈 **LONG ENTRIES:**
- Identifies bullish candles with minimal/no bottom wick
- Places buy limit order slightly below the signal candle's open
- Enters only during specified trading session
📉 **SHORT ENTRIES:**
- Identifies bearish candles with minimal/no top wick
- Places sell limit order slightly above the signal candle's close
- Enters only during specified trading session
**KEY FEATURES:**
✅ Customizable trading session (New York timezone)
✅ Flexible wick threshold (0% for strict, up to X% for flexibility)
✅ ATR-based stop loss for dynamic risk management
✅ Configurable risk-reward ratio via TP multiplier
✅ Auto-cancellation of unfilled orders after X bars
✅ Body size filters (minimum and maximum)
✅ Visual signals and pending order levels
✅ Position status display
**RISK MANAGEMENT:**
- Stop Loss: Based on ATR multiplier
- Take Profit: Multiple of stop loss distance
- One position at a time
- No pyramiding or position flipping
**RECOMMENDED TIMEFRAMES:**
- M1 and M5 for scalping
- M15 and H1 for day trading
- H4 and Daily for swing trading
**MARKETS:**
Suitable for forex pairs, indices (NQ, ES), commodities, and liquid stocks.
**DEFAULT SETTINGS:**
- Trading Session: 09:30-11:00 ET (NY morning session)
- ATR SL Multiplier: 1.5
- TP Multiplier: 2.0 (2:1 RR ratio)
- Wick Threshold: 5%
- Order Cancellation: 5 bars
**TIPS FOR OPTIMIZATION:**
1. Adjust trading session to match your market's most active hours
2. Test different wick thresholds (0-10%) based on market volatility
3. Optimize body size filters for your specific instrument
4. Backtest different ATR multipliers for your risk tolerance
5. Consider market conditions - works best in trending markets
**IMPORTANT NOTES:**
- Uses limit orders for better entry prices
- Does not close opposing positions (no position flipping)
- Respects trading session boundaries strictly
- All times are in America/New_York timezone
**AUTHOR:** Sh1n1gam1
**VERSION:** 1.0
**SUPPORT:** Comments and suggestions welcome!
Happy Trading! 📊
스크립트에서 "momentum"에 대해 찾기

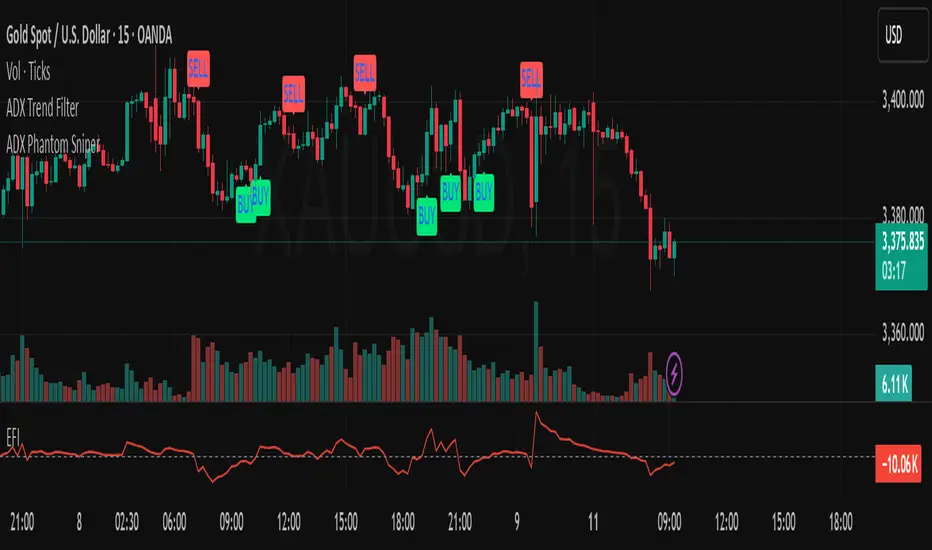
ADX Phantom SniperADX Phantom Sniper is a precision trend-following tool that combines three powerful forces:
1. ADX & DI Crossover Trigger – Detects strong directional moves only when the trend strength exceeds a defined threshold.
2. Multi-Timeframe (MTF) Confirmation – Executes on the current chart timeframe (e.g., M15) only if the higher timeframe (H1) confirms the same trend direction.
3. Force Index Momentum Filter – Filters entries based on bullish/bearish momentum to avoid weak signals.
Signal Logic:
BUY: EMA14 > EMA100, price above EMA14, +DI crosses above -DI, ADX > threshold, Stochastic crosses above signal line in the bullish zone (>50), MTF trend aligned, Force Index > 0 (optional).
SELL: EMA14 < EMA100, price below EMA14, -DI crosses above +DI, ADX > threshold, Stochastic crosses below signal line in the bearish zone (<50), MTF trend aligned, Force Index < 0 (optional).
Features:
Noise filtering with trend structure + higher timeframe alignment
On-chart BUY/SELL labels for easy signal spotting
Optional Force Index filter toggle
Adjustable ADX threshold, EMA lengths, Stochastic settings, and higher timeframe choice
Suitable for scalping and swing entries depending on timeframe
Recommended Setup:
Primary chart: M15
Higher timeframe confirmation: H1
Combine with your preferred risk management rules.
Disclaimer:
This tool is for educational purposes only and is not financial advice. Past performance does not guarantee future results. Use at your own risk.
Expanded Reversal System (4 Pattern Types)Overview
This is the final, refined version of a comprehensive candlestick reversal strategy, built with a core focus on reliability and safety. Its unique execution logic is designed to prevent common backtesting errors and ensure that the integrated risk management works precisely as intended on any timeframe.
The strategy aims to capture high-momentum reversals by identifying an expanded set of classic candlestick patterns and waiting for confirmation before entering a trade.
The "Confirm and Execute" Engine 🛡️
To eliminate bugs seen in simpler backtesting models, this strategy uses a deliberate, three-step execution process:
Signal: It first identifies a high-probability reversal pattern on a "Signal Candle."
Confirmation: It then waits for the next candle to break the high or low of the signal candle. This confirms momentum is moving in the desired direction.
Execution: Finally, it enters a market order on the open of the following candle.
This method ensures a robust and stable entry, allowing the Stop Loss and Take Profit orders to function with 100% reliability.
An Expanded Arsenal of Reversal Signals
This strategy looks for four distinct types of bullish and bearish patterns, giving it more opportunities to find valid trades:
Flexible Pin Bars: Loosened rules for Hammers and Shooting Stars to capture more opportunities.
Classic Engulfing Patterns: Identifies powerful, full-body engulfing candles.
Piercing Patterns & Dark Cloud Covers: Recognizes strong two-candle reversal signals.
Built-in Professional Risk Management 🎯
Automated Position Sizing: Every trade is automatically sized to risk exactly 2% of your current account equity.
Defined Exits: Once a trade is open, it is held until either the pre-calculated Stop Loss or Take Profit is hit. The strategy will not exit early or be influenced by new signals while in a trade.
Asymmetrical Risk/Reward: The strategy targets a 1:6 R:R for long trades and a 1:4 R:R for short trades.
How To Use
Apply the strategy to your chart.
Set your chart's timeframe. This version produced very strong results on the 3-Minute chart.
Review the detailed performance report in the 'Strategy Tester' tab.
Disclaimer: This strategy is provided for informational and educational purposes. All trading involves substantial risk, and past performance is not a guarantee of future results. Please use and adapt this tool responsibly.

ETH/SOL 1D Dynamic Trend Core - STRATEGY v 45Overview
The Dynamic Trend Core is a sophisticated, multi-layer trading engine designed to identify high-probability, trend-following opportunities. Its core philosophy is rooted in confluence, meaning it requires multiple conditions across trend, momentum, and volume to align before generating a signal. This approach aims to filter out market noise and provide a clearer view of the underlying trend.
The script includes a comprehensive backtesting engine for strategy optimization and a rich, intuitive visual interface for real-time analysis.
How It Works: Core Logic
The engine validates signals through several sequential layers:
Primary Trend Analysis (SAMA): The foundation is a Self-Adjusting Moving Average (SAMA) that dynamically determines the primary market direction (Bullish, Bearish, or Consolidation).
Momentum Confirmation: Signals are then qualified using a blend of the Natural Market Slope and a Cyclic RSI to ensure momentum is firmly aligned with the established trend.
Advanced Filtering Suite: A suite of optional filters provides robust confirmation and allows for deep customization:
Volume & ADX: Confirms that trades are supported by sufficient market participation and trend strength.
Market Regime: Gauges broad market health (e.g., using TOTAL market cap) to avoid trading against the entire market.
Multi-Timeframe (MTF) Analysis: Aligns signals with the dominant trend on a higher timeframe (e.g., Weekly).
BTC Cycle Analysis: Positions trades within the context of historical Bitcoin cycles using models like the Halving Cycle or Mayer Multiple.
On-Chart Visuals & Features
The script provides full transparency into its logic with a powerful on-chart interface.
IMPORTANT: For the live visual elements to function correctly, you must enable "Recalculate on every tick" in the script's settings (Settings > Properties).
Power Core Gauge: Located at the bottom-center of the chart, this gauge is the heart of the system. It displays the number of filter conditions currently met (e.g., 5/6) and "powers up" by glowing brighter as more conditions align, indicating a fully confirmed signal is ready.
Live Conditions Panel: This panel in the bottom-right corner acts as a real-time pre-flight checklist. It shows the status (pass/fail) of every individual filter, so you know exactly why a signal is, or is not, being generated.
Energized Trendline: The primary SAMA trendline changes color and intensity based on the strength and direction of the trend, offering immediate visual context.
BTC Halving Cycle Visualizer: Provides a background color guide to the different phases of the Bitcoin halving cycle for macro context.
How to Use & Configure
Select Operation Mode:
Backtest Mode: Use this to test different settings on historical data and find optimal configurations for a specific asset and timeframe.
Alerts-Only Mode: Use this for live trading to generate alert signals without cluttering the chart with backtest data. (Contact publisher for access to this version)
Configure Your Filters:
Start with the default filter settings.
If a potential setup is missed, check the Live Conditions Panel to see which specific filter blocked the signal.
Enable, disable, or adjust filters in the script's settings to match your trading style and the asset's characteristics.
Manage Your Risk:
Go to the "Risk & Exit" settings to configure your Stop Loss and Take Profit parameters to match your personal risk tolerance.
Disclaimer: This script is for educational and informational purposes only. It is not financial advice. All trading involves risk, and past performance is not indicative of future results. Please conduct your own research and backtesting before making any trading decisions.

Mutanabby_AI | Algo Pro Strategy# Mutanabby_AI | Algo Pro Strategy: Advanced Candlestick Pattern Trading System
## Strategy Overview
The Mutanabby_AI Algo Pro Strategy represents a systematic approach to automated trading based on advanced candlestick pattern recognition and multi-layered technical filtering. This strategy transforms traditional engulfing pattern analysis into a comprehensive trading system with sophisticated risk management and flexible position sizing capabilities.
The strategy operates on a long-only basis, entering positions when bullish engulfing patterns meet specific technical criteria and exiting when bearish engulfing patterns indicate potential trend reversals. The system incorporates multiple confirmation layers to enhance signal reliability while providing comprehensive customization options for different trading approaches and risk management preferences.
## Core Algorithm Architecture
The strategy foundation relies on bullish and bearish engulfing candlestick pattern recognition enhanced through technical analysis filtering mechanisms. Entry signals require simultaneous satisfaction of four distinct criteria: confirmed bullish engulfing pattern formation, candle stability analysis indicating decisive price action, RSI momentum confirmation below specified thresholds, and price decline verification over adjustable lookback periods.
The candle stability index measures the ratio between candlestick body size and total range including wicks, ensuring only well-formed patterns with clear directional conviction generate trading signals. This filtering mechanism eliminates indecisive market conditions where pattern reliability diminishes significantly.
RSI integration provides momentum confirmation by requiring oversold conditions before entry signal generation, ensuring alignment between pattern formation and underlying momentum characteristics. The RSI threshold remains fully adjustable to accommodate different market conditions and volatility environments.
Price decline verification examines whether current prices have decreased over a specified period, confirming that bullish engulfing patterns occur after meaningful downward movement rather than during sideways consolidation phases. This requirement enhances the probability of successful reversal pattern completion.
## Advanced Position Management System
The strategy incorporates dual position sizing methodologies to accommodate different account sizes and risk management approaches. Percentage-based position sizing calculates trade quantities as equity percentages, enabling consistent risk exposure across varying account balances and market conditions. This approach proves particularly valuable for systematic trading approaches and portfolio management applications.
Fixed quantity sizing provides precise control over trade sizes independent of account equity fluctuations, offering predictable position management for specific trading strategies or when implementing precise risk allocation models. The system enables seamless switching between sizing methods through simple configuration adjustments.
Position quantity calculations integrate seamlessly with TradingView's strategy testing framework, ensuring accurate backtesting results and realistic performance evaluation across different market conditions and time periods. The implementation maintains consistency between historical testing and live trading applications.
## Comprehensive Risk Management Framework
The strategy features dual stop loss methodologies addressing different risk management philosophies and market analysis approaches. Entry price-based stop losses calculate stop levels as fixed percentages below entry prices, providing predictable risk exposure and consistent risk-reward ratio maintenance across all trades.
The percentage-based stop loss system enables precise risk control by limiting maximum loss per trade to predetermined levels regardless of market volatility or entry timing. This approach proves essential for systematic trading strategies requiring consistent risk parameters and capital preservation during adverse market conditions.
Lowest low-based stop losses identify recent price support levels by analyzing minimum prices over adjustable lookback periods, placing stops below these technical levels with additional buffer percentages. This methodology aligns stop placement with market structure rather than arbitrary percentage calculations, potentially improving stop loss effectiveness during normal market fluctuations.
The lookback period adjustment enables optimization for different timeframes and market characteristics, with shorter periods providing tighter stops for active trading and longer periods offering broader stops suitable for position trading approaches. Buffer percentage additions ensure stops remain below obvious support levels where other market participants might place similar orders.
## Visual Customization and Interface Design
The strategy provides comprehensive visual customization through eight predefined color schemes designed for different chart backgrounds and personal preferences. Color scheme options include Classic bright green and red combinations, Ocean themes featuring blue and orange contrasts, Sunset combinations using gold and crimson, and Neon schemes providing high visibility through bright color selections.
Professional color schemes such as Forest, Royal, and Fire themes offer sophisticated alternatives suitable for business presentations and professional trading environments. The Custom color scheme enables precise color selection through individual color picker controls, maintaining maximum flexibility for specific visual requirements.
Label styling options accommodate different chart analysis preferences through text bubble, triangle, and arrow display formats. Size adjustments range from tiny through huge settings, ensuring appropriate visual scaling across different screen resolutions and chart configurations. Text color customization maintains readability across various chart themes and background selections.
## Signal Quality Enhancement Features
The strategy incorporates signal filtering mechanisms designed to eliminate repetitive signal generation during choppy market conditions. The disable repeating signals option prevents consecutive identical signals until opposing conditions occur, reducing overtrading during consolidation phases and improving overall signal quality.
Signal confirmation requirements ensure all technical criteria align before trade execution, reducing false signal occurrence while maintaining reasonable trading frequency for active strategies. The multi-layered approach balances signal quality against opportunity frequency through adjustable parameter optimization.
Entry and exit visualization provides clear trade identification through customizable labels positioned at relevant price levels. Stop loss visualization displays active risk levels through colored line plots, ensuring complete transparency regarding current risk management parameters during live trading operations.
## Implementation Guidelines and Optimization
The strategy performs effectively across multiple timeframes with optimal results typically occurring on intermediate timeframes ranging from fifteen minutes through four hours. Higher timeframes provide more reliable pattern formation and reduced false signal occurrence, while lower timeframes increase trading frequency at the expense of some signal reliability.
Parameter optimization should focus on RSI threshold adjustments based on market volatility characteristics and candlestick pattern timeframe analysis. Higher RSI thresholds generate fewer but potentially higher quality signals, while lower thresholds increase signal frequency with corresponding reliability considerations.
Stop loss method selection depends on trading style preferences and market analysis philosophy. Entry price-based stops suit systematic approaches requiring consistent risk parameters, while lowest low-based stops align with technical analysis methodologies emphasizing market structure recognition.
## Performance Considerations and Risk Disclosure
The strategy operates exclusively on long positions, making it unsuitable for bear market conditions or extended downtrend periods. Users should consider market environment analysis and broader trend assessment before implementing the strategy during adverse market conditions.
Candlestick pattern reliability varies significantly across different market conditions, with higher reliability typically occurring during trending markets compared to ranging or volatile conditions. Strategy performance may deteriorate during periods of reduced pattern effectiveness or increased market noise.
Risk management through stop loss implementation remains essential for capital preservation during adverse market movements. The strategy does not guarantee profitable outcomes and requires proper position sizing and risk management to prevent significant capital loss during unfavorable trading periods.
## Technical Specifications
The strategy utilizes standard TradingView Pine Script functions ensuring compatibility across all supported instruments and timeframes. Default configuration employs 14-period RSI calculations, adjustable candle stability thresholds, and customizable price decline verification periods optimized for general market conditions.
Initial capital settings default to $10,000 with percentage-based equity allocation, though users can adjust these parameters based on account size and risk tolerance requirements. The strategy maintains detailed trade logs and performance metrics through TradingView's integrated backtesting framework.
Alert integration enables real-time notification of entry and exit signals, stop loss executions, and other significant trading events. The comprehensive alert system supports automated trading applications and manual trade management approaches through detailed signal information provision.
## Conclusion
The Mutanabby_AI Algo Pro Strategy provides a systematic framework for candlestick pattern trading with comprehensive risk management and position sizing flexibility. The strategy's strength lies in its multi-layered confirmation approach and sophisticated customization options, enabling adaptation to various trading styles and market conditions.
Successful implementation requires understanding of candlestick pattern analysis principles and appropriate parameter optimization for specific market characteristics. The strategy serves traders seeking automated execution of proven technical analysis techniques while maintaining comprehensive control over risk management and position sizing methodologies.

Energy Advanced Policy StrategyThis trading strategy emphasizes both technical trading as well as sentiment trading. Using news and government policy decisions, it can determine either positive or negative sentiment in the energy sector.
How the Strategy Works
This strategy has two main parts that work together to find good trades:
1. The "Policy & Sentiment Engine "
Policy Event Detection : The script spots potential big news or policy changes by looking for big, sudden price moves and huge trading volume. You can play with the Policy Event Volume Threshold and Policy Event Price Threshold (%) settings to make it more or less sensitive.
Sentiment Score : When the script finds a positive or negative event, it adds to a sentiment score. This score isn't forever, though; it fades over time, so the newest events matter the most.
Manual Override : The Manual News Sentiment setting lets you tell the script exactly what the market's mood is for a set time, which is perfect for when you already know about a big upcoming announcement.
The strategy only looks for a trade if the overall feeling is bullish enough. This makes sure you're trading with the big, fundamental forces of the market, not against them.
2. Technical Confirmation & Precision
After the policy and sentiment part gives a green light, the strategy uses a variety of technical indicators to confirm the trend and ideal entry positions.
Long-Term Trend : The script makes sure the market is in a strong uptrend by checking if the fast and medium-speed moving averages are going up, and if the price is above a long-term moving average.
Momentum : The MACD is used to make sure the price's upward momentum is getting stronger, not weaker.
Oscillator : It also uses the RSI to check if the market has gone up too much, too fast, which could mean it's about to turn around.
How to Use the Script
You can customize this strategy to fit your trading style and how much risk you're comfortable with. The inputs are grouped into logical sections for easy adjustment.
News & Policy Analysis : You can play with the Policy Event thresholds to make the script more or less sensitive to market shocks. And you can always use the Manual News Sentiment to take over when you're watching a specific news event.
Technical Analysis : Feel free to change the settings for things like the moving averages, RSI, and MACD to match what you like to trade and on what timeframe.

Parabolic SAR Strategy with MACD Confirmation & Trend Zone Highl📝 Description (SEO + Follower-Friendly):
🚀 Powerful Trend Strategy Using Parabolic SAR + MACD
This advanced Pine Script combines the classic Parabolic SAR trend-following system with MACD crossover confirmation, improving entry precision and filtering out false signals. The script also features:
✅ Dynamic trend zone background highlighting when SAR is below price
✅ MACD filter ensures trades align with market momentum
✅ Custom SAR logic with adaptive acceleration
✅ Clean visual SAR plots for easy trend tracking
✅ Fully backtestable with strategy.entry logic
🔎 Ideal for traders seeking early trend entries, momentum confirmation, and visual clarity.
📈 Works on all timeframes and pairs — perfect for swing traders, scalpers, and crypto enthusiasts.
💡 Use it as a base strategy or combine with your favorite indicators.
❤️ If you find this helpful, don't forget to like, comment, and follow for more premium strategies!
Options Strategy V2.0📈 Options Strategy V2.0 – Intraday Reversal-Resilient Momentum System
Overview:
This strategy is designed specifically for intraday SPY, TSLA, MSFT, etc. options trading (0DTE or 1DTE), using high-probability signals derived from a confluence of technical indicators: EMA crossovers, RSI thresholds, ATR-based risk control, and volume spikes. The strategy aims to capture strong directional moves while avoiding overtrading, thanks to a built-in cooldown logic and optional time/session filters.
⚙️ Core Concept
The strategy executes trades only in the direction of the prevailing trend, determined by short- and long-term Exponential Moving Averages (EMA). Entry signals are generated when the Relative Strength Index (RSI) confirms momentum in the direction of the trend, and volume spikes suggest institutional activity.
To increase adaptability and user control, it includes a highly customizable parameter set for both long and short entries independently.
📌 Key Features
✅ Trend-Following Logic
Long entries are only allowed when EMA(short) > EMA(long)
Short entries are only allowed when EMA(short) < EMA(long)
✅ RSI Confirmation
Long: Requires RSI crossover above a configurable threshold
Short: Requires RSI crossunder below a configurable threshold
Optional rejection filters: Entry blocked above/below specific RSI extremes
✅ Volume Spike Filter
Confirms institutional participation by comparing current volume to an average multiplied by a user-defined factor.
✅ ATR-Based Risk Management
Both Stop Loss (SL) and Take Profit (TP) are dynamically calculated using ATR × a multiplier.
TP/SL ratio is fully configurable.
✅ Cooldown Control
After every trade, the system waits for a set number of bars before allowing new entries.
This prevents overtrading and increases signal quality.
Optionally, cooldown is ignored for reversal trades, ensuring the system can react immediately to a confirmed trend change.
✅ Candle Body Filter (Noise Control)
Avoids trades on candles with too small bodies relative to wicks (often noise or indecision candles).
✅ VWAP Confirmation (Optional)
Ensures price is trading above VWAP for long entries, or below for short entries.
✅ Time & Session Filters
Trades only during regular market hours (09:30–16:00 EST).
No-trade zone (e.g., 14:15–15:45 EST) to avoid low-liquidity traps or late-day whipsaws.
✅ End-of-Day Auto Close
All open positions are force-closed at 15:55 EST, protecting against overnight risk (especially relevant for 0DTE options).
📊 Visual Aids
EMA plots show trend direction
VWAP line provides real-time mean-reversion context
Stop Loss and Take Profit lines appear dynamically with each trade
Alerts notify of entry signals and exit triggers
🔧 Customization Panel
Nearly every element of the strategy can be tailored:
EMA lengths (short and long, for both sides)
RSI thresholds and length
ATR length, SL multiplier, and TP/SL ratio
Volume spike sensitivity
Minimum EMA distance filter
Candle body ratio filter
Session restrictions
Cooldown logic (duration + reversal exception)
This makes the strategy extremely versatile, allowing both conservative and aggressive configurations depending on the trader’s profile and the market context.
📌 Example Use Case: SPY Options (0DTE or 1DTE)
This system was designed and tested specifically for SPY and other intraday options trading, where:
Delta is around 0.50 or higher
Trades are short-lived (often 1–5 candles)
You aim to trade 1–3 signals per day, filtering out weak entries
🚫 Important Notes
It is not a scalping strategy; it relies on confirmed breakouts with trend support
No pyramiding or re-entries without cooldown to preserve risk integrity
Should be used with real-time alerts and manual broker execution
📈 Alerts Included
📈 Long Entry Signal
📉 Short Entry Signal
⚠️ Auto-closed all positions at 15:55 EST
✅ Proven Settings – Real Trades + Backtest Results
The current version of the strategy includes the optimal settings I’ve arrived at through extensive backtesting, as well as 3 months of real trading with consistent profitability. These results reflect real-world execution under live market conditions using 0DTE SPY options, with disciplined trade management and risk control.
🧠 Final Thoughts
Options Strategy V2.0 is a robust, highly tunable intraday strategy that blends momentum, trend-following, and volume confirmation. It is ideal for disciplined traders focused on SPY or other 0DTE/1DTE options, and it includes guardrails to reduce false signals and improve execution timing.
Perfect for those who seek precision, flexibility, and risk-defined setups—not blind automation.

Day Trading Strategy (With Risk Management)This is a day trading strategy based on fast and slow EMA crossovers combined with RSI filtering to enhance trade accuracy. Designed for intraday use, it generates buy signals when the fast EMA crosses above the slow EMA and sell signals when it crosses below, but only if the RSI confirms momentum is favorable to avoid false entries in choppy markets.
The strategy includes built-in risk management with configurable stop-loss and take-profit levels set at 1% by default, helping to limit losses and secure profits quickly within the trading day. Clear buy and sell signals are plotted on the chart, and alerts notify traders in real time when trading opportunities arise.
Ideal for short-term traders, this system provides a disciplined, mechanical approach to capturing intraday trends with momentum confirmation and essential risk controls. It is fully customizable to fit different day trading instruments, timeframes, and risk appetites.

BTC 1m Chop Top/Bottom Reversal (Stable Entries)Strategy Description: BTC 5m Chop Top/Bottom Reversal (Stable Entries)
This strategy is engineered to capture precise reversal points during Bitcoin’s choppy or sideways price action on the 5-minute timeframe. It identifies short-term tops and bottoms using a confluence of volatility bands, momentum indicators, and price structure, optimized for high-probability scalping and intraday reversals.
Core Logic:
Volatility Filter: Uses an EMA with ATR bands to define overextended price zones.
Momentum Divergence: Confirms reversals using RSI and MACD histogram shifts.
Price Action Filter: Requires candle confirmation in the direction of the trade.
Locked Signal Logic: Prevents repaints and disappearing trades by confirming signals only once per bar.
Trade Parameters:
Short Entry: Above upper band + overbought RSI + weakening MACD + bearish candle
Long Entry: Below lower band + oversold RSI + strengthening MACD + bullish candle
Take Profit: ±0.75%
Stop Loss: ±0.4%
This setup is tuned for traders using tight risk control and leverage, where execution precision and minimal drawdown tolerance are critical.

Intra Bullish Strategy - Profit Ping v4.0ProfitPing 4.0 is a high-precision intraday swing trading strategy designed for global equity markets, including the US, South Africa, and Australia. The system identifies high-probability BUY and EXIT signals using a confluence of technical indicators and real-time volume dynamics.
🧠 Key Features:
Dual EMA Crossover (7 & 14) for short-term trend confirmation
Volume Spike Detection based on 20-period moving average
RSI Momentum Filter (ideal zone: 55–65) to avoid overbought entries
MACD Histogram & Signal Line Sync for trend momentum validation
Candlestick Pattern Filtering (e.g. bullish engulfing, flags, breakout candles)
Multi-Timeframe Confirmation (optional) for intraday trend alignment
Dynamic Risk-to-Reward Logic built into alert framework
Webhook-compatible JSON alerts for automation to Google Sheets, Power BI, and IBKR
🛠️ Alert System:
BUY alert triggers when all bullish conditions align
EXIT alert triggers only if a previous BUY exists for that ticker
Trade status is updated live in Google Sheets and integrated with Power BI dashboards
Orphaned EXITs (no matched BUY) are tracked separately for accuracy review
🔄 Ideal For:
Traders seeking 1:2 to 1:5 risk/reward setups
Automation-focused workflows (via TradingView → Google Sheets → Power BI)
Swing traders wanting clean visual logs, automated P&L tracking, and optional IBKR execution

1EMA + 1MACD + 1RSI Crypto Strategy AB 092Title: EMA + MACD + RSI Crypto Strategy
Overview:
This is a trend-following and momentum-based crypto trading strategy built for 1H, 4H, and 1D timeframes, combining three proven indicators:
EMA 50 & EMA 200 Crossover – identifies long-term trend direction.
MACD Crossover (12, 26, 9) – confirms momentum shift.
RSI Filter (14) – avoids overbought/oversold traps and refines entries.
Buy Entry Conditions:
EMA 50 > EMA 200 (Golden Cross)
MACD line crosses above signal line
RSI is between 45 and 70
Sell Entry Conditions:
EMA 50 < EMA 200 (Death Cross)
MACD line crosses below signal line
RSI is between 30 and 55
Risk Management:
Configurable Take Profit and Stop Loss percentages via inputs.
Default: 3% TP, 1.5% SL (adjustable based on timeframe and asset volatility).
Best For:
Intraday trades on 1H (BTC, ETH, SOL)
Swing trades on 4H
Position entries on 1D (top 50 altcoins)
This script includes visual Buy/Sell signals, alert conditions, and customizable SL/TP logic — making it a clean, actionable, and reliable strategy for crypto traders.

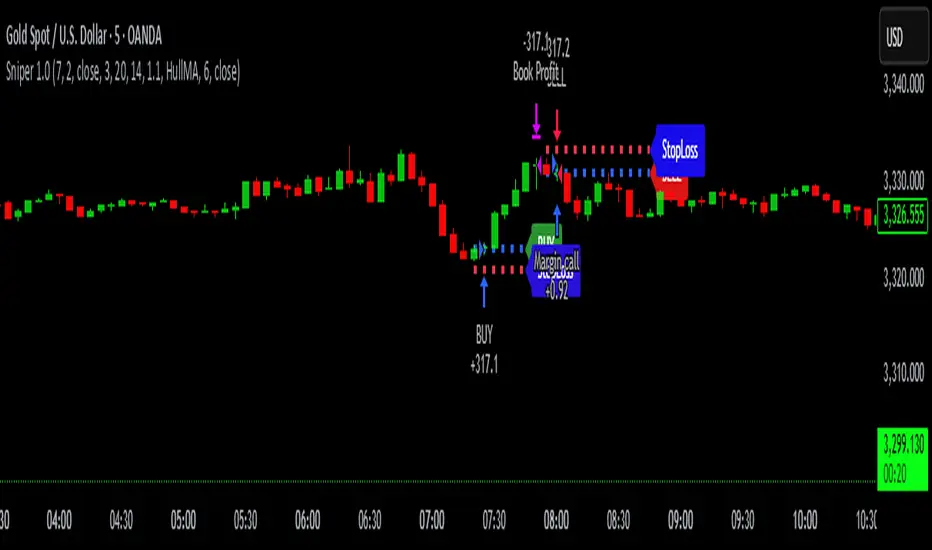
Sniper 1.0Overview
The tool is a powerful, real-time trendline-based breakout tool enhanced with RSI confirmation and EMA insights. Designed for scalpers and intraday traders, this script blends smart price action with momentum analytics to help identify high-probability breakout opportunities with precision. tool pridict TOP and BOTTOM easily.
User Benefits
Improved Entry Accuracy: Catch TOP and BOTTOM
Trend Confidence: Visual trendlines adapt in real-time based on ATR slopes.
Multi-Timeframe Insights: Analyze lower timeframe breakouts with 15-minute RSI filtering.
Speed & Clarity: Get directional hints with a color-coded EMA.
Flexible Backpainting: Backtest with dynamic trendlines or forward-only for cleaner real-time visuals.
Key Features
Dynamic Trendlines: Automatically plots real-time up/down trendlines using pivot points and ATR slope mechanics.
Breakout Signals with RSI Confirmation: Identifies breakouts when price crosses trendlines and RSI supports the move.
EMA Trend Filter: Highlights trend strength with EMA and signals momentum shifts.
Custom Timeframe RSI Input: Leverage higher or lower timeframe RSI for added signal filtering.
Alert Ready: Set alerts for bullish or bearish breakouts confirmed by RSI.
Pro Reversal Strategie - FinalCore Functionality Description
The "Pro Reversal Strategy" script is a comprehensive and highly customizable trading system for TradingView. Its core idea is based on a mean-reversion strategy, which aims to capitalize on price extremes where the price is likely to revert to its statistical mean. This script ist full AI generated. There ist no support and no financial advice.
To identify entry points, the script combines classic indicators like the RSI (to detect overbought and oversold conditions) and Bollinger Bands (to measure volatility extremes).
However, the script's strength lies in its confluence logic: a simple RSI or Bollinger Band signal is not enough to trigger a trade. Instead, a series of filters are applied to enhance the quality of the trade signals. These include:
Trend Filter: Trades are only taken in the direction of the higher-level trend (defined by a 200-period Moving Average).
Volatility and Volume Filter: ADX and volume analysis ensure that the market has sufficient momentum for a move.
Market Structure Analysis: Concepts like Fair Value Gaps (FVG), liquidity zones, and the Volume Profile (VRVP/POC) are used to place trades in high-probability zones.
Momentum Filter: Special "Vector Candles" confirm the strength of buyers or sellers at the moment of the signal.
Furthermore, the script offers advanced features for risk and trade management, including automatic position sizing based on a percentage risk and dynamic exit strategies like a breakeven stop and a trailing stop-loss (Chandelier ATR).
A detailed info panel visualizes all key metrics in real-time directly on the chart. Thanks to its versatile configuration options, the script can be adapted for various trading styles, including swing trading, day trading, and scalping.
Core Strategies & Filters (English)
Here is a breakdown of the specific strategies and confirmation filters used within the script:
RSI Mean Reversion: Uses the Relative Strength Index (RSI) to identify overbought (> rsiSellShort) and oversold (< rsiBuyLong) conditions, which serve as the primary trigger for a potential price reversal.
Bollinger Bands (BB) Volatility Filter: Trades are confirmed when the price touches or exceeds the outer Bollinger Bands. This indicates a move to a statistical extreme in terms of volatility, reinforcing the reversal thesis.
Trend Filter (200 SMA): Ensures that long trades are only considered in a general uptrend (price > SMA 200) and short trades in a downtrend (price < SMA 200), preventing trades against the dominant market direction.
ADX Trend Strength Filter: Utilizes the Average Directional Index (ADX) to confirm that a market is trending with sufficient strength. Trades are filtered out during weak or non-trending phases (adx < adxThreshold).
Volume Profile (VRVP / POC): Analyzes volume at specific price levels to identify high-volume nodes (Point of Control - POC). This acts as a filter to avoid entering trades directly into a zone of strong support or resistance.
Vector Candle Filter: Identifies "Vector Candles" – large, high-volume candles that close strongly near their high (bullish) or low (bearish). This custom filter confirms strong conviction behind the initial reversal signal.
Market Structure (FVG & Liquidity): Incorporates advanced price action concepts. It looks for entries after a liquidity zone above a previous high/low has been tapped (Liquidity Grab) or when price enters a Fair Value Gap (FVG), adding a layer of institutional trading logic.
Chart Pattern Recognition: Optionally identifies classic chart patterns like "W-Patterns" (Double Bottom), "M-Patterns" (Double Top), and Ascending Triangles to provide additional visual confirmation for traders.
Position Sizing (Risk %): Automatically calculates the trade size based on a user-defined percentage of the total equity (riskPct) and the distance to the stop-loss, ensuring consistent risk management for every trade.
Dynamic Exit Management: Implements advanced exit strategies beyond a fixed take-profit. This includes moving the stop-loss to Breakeven after a certain risk-to-reward ratio is met and using a Trailing Stop-Loss (e.g., Chandelier ATR) to lock in profits as a trade develops.

Opening-Range BreakoutNote: Default trading date range looks mediocre. Set date range to "Entire History" to see full effect of the strategy. 50.91% profitable trades, 1.178 profit factor, steady profits and limited drawdown. Total P&L: $154,141.18, Max Drawdown: $18,624.36. High R^2
█ Overview
The Opening-Range Breakout strategy is a mechanical, session‑based day‑trading system designed to capture the initial burst of directional momentum immediately following the market open. It defines a user‑configurable “opening range” window, measures its high and low boundaries, then places breakout stop orders at those levels once the range closes. Built‑in filters on minimum range width, reward‑to‑risk ratios, and optional reversal logic help refine entries and manage risk dynamically.
█ How It Works
Opening‑Range Formation
Between 9:30–10:15 AM ET (configurable), the script tracks the highest high and lowest low to form the day’s opening range box.
On the first bar after the range window closes, the range high (OR_high) and low (OR_low) are “locked in.”
Range‑Width Filter
To avoid false breakouts in low‑volatility mornings, the range must be at least X% of the current price (default 0.35%).
If the measured opening-range width < minimum threshold, no orders are placed that day.
Entry & Order Placement
Long: a stop‑buy order at the opening‑range high.
Short: a stop‑sell order at the opening‑range low.
Only one side can trigger (or both if reverse logic is enabled after a losing trade).
Risk Management
Once triggered, each trade uses an ATR‑style stop-loss defined as a percentage retracement of the range (default 50% of range width).
Profit target is set at a configurable Reward/Risk Ratio (default 1.1×).
Optional: Reverse on Stop‑Loss – if the initial breakout loses, immediately reverse into the opposite side on the same day.
Session Exit
Any open positions are closed at the end of the regular trading day (default 3:45 PM ET window end, with hard flat at session close).
Visual cues are provided via green (range high) and red (range low) step‑line plots directly on the chart, allowing you to see the range box and breakout triggers in real time.
█ Why It Works
Early Momentum Capture: The first 15 – 60 minutes of trading encapsulate overnight news digestion and institutional order flow, creating a well‑defined volatility “range.”
Mechanical Discipline: Clear, rule‑based entries and exits remove emotional guesswork, ensuring consistency.
Volatility Filtering: By requiring a minimum range width, the system avoids choppy, low‑range days where false breakouts are common.
Dynamic Sizing: Stops and targets scale with the opening range, adapting automatically to each day’s volatility environment.
█ How to Use
Set Your Instruments & Timeframe
-Apply to any futures contract on a 1‑ to 5‑minute chart.
-Ensure chart timezone is set to America/New_York.
Configure Inputs
-Opening‑Range Window: e.g. “0930-1015” for a 45‑minute range.
-Min. OR Width (%): e.g. 0.35 for 0.35% of current price.
-Reward/Risk Ratio: e.g. 1.1 for a modest profit target above your stop.
-Max OR Retracement %: e.g. 50 to set stop at 50% of range width.
-One Trade Per Day: toggle to limit to a single breakout.
-Reverse on Stop Loss: toggle to flip direction after a losing breakout.
Monitor the Chart
-Watch the green and red range boundaries form during the session open.
-Orders will automatically submit on the first bar after the range window closes, conditioned on your filters.
Review & Adjust
-Backtest across multiple months to validate performance on your preferred contract.
-Tweak range duration, minimum width, and R/R multiple to fit your risk tolerance and desired win‑rate vs. expectancy balance.
█ Settings Reference
Input Defaults
Opening‑Range Window - Time window to form OR (HHMM-HHMM) - 0930–1015
Regular Trading Day - Full session for EOD flat (HHMM-HHMM) - 0930–1545
Min. OR Width (%) - Minimum OR size as % of close to trigger orders - 0.35
Reward/Risk Ratio - Profit target multiple of stop‑loss distance - 1.1
Max OR Retracement (%) - % of OR width to use as stop‑loss distance - 50
One Trade Per Day - Limit to a single breakout order per day - false
Reverse on Stop Loss - Reverse direction immediately after a losing trade - true
Disclaimer
This strategy description and any accompanying code are provided for educational purposes only and do not constitute financial advice or a solicitation to trade. Futures trading involves substantial risk, including possible loss of capital. Past performance is not indicative of future results. Traders should assess their own risk tolerance and conduct thorough backtesting and forward-testing before committing real capital.

Intraday Combo Strategy HHStochastic RSI Momentum/Reversal quickly identifies overbought/oversold zones
MACD Momentum/Trend confirms a trend reversal, a late but powerful signal
Supertrend Trend Tracking provides clear and concise buy/sell signals
Bollinger Bands Volatility shows price deviation during breakouts/squeezes
ADX Trend Strength measures trend strength to filter out false signals

NOMANOMA Adaptive Confidence Strategy —
What is NOMA?
NOMA is a next-generation, confidence-weighted trading strategy that fuses modern trend logic, multi-factor market structure, and adaptive risk controls—delivering a systematic edge across futures, stocks, forex, and crypto markets. Designed for precision, adaptability, and hands-off automation, NOMA provides actionable trade signals and real-time alerts so you never miss a high-conviction opportunity.
Key Benefits & Why Use NOMA?
Trade With Confidence, Not Guesswork:
NOMA combines over 11 institutional-grade confirmations (market structure, order flow, volatility, liquidity, SMC/ICT concepts, and more) into a single “confidence score” engine. Every trade entry is filtered through customizable booster weights, so only the strongest opportunities trigger.
Built-In Alerts:
Get instant notifications on all entries, take-profits, trailing stop events, and exits. Connect alerts to your mobile, email, or webhook for seamless automation or just peace of mind.
Advanced Position Management:
Supports up to 5 separate take-profit levels with adjustable quantities, plus dynamic and stepwise trailing stops. Protects your gains and adapts exit logic to market movement, not just static targets.
Anti-Chop/No Trade Zones:
Eliminate low-probability, sideways market conditions using the “No Chop Zone” filter, so you only trade in meaningful, trending environments.
Full Market Session Control:
Restrict trades to custom sessions (e.g., New York hours) for added discipline and to avoid overnight risk.
— Ideal for day traders and prop-firm requirements.
Multi-Asset & Timeframe Support:
Whether you trade micro futures, stocks, forex, or crypto, NOMA adapts its TP/SL logic to ticks, pips, or points and works on any timeframe.
How NOMA Works (Feature Breakdown)
1. Adaptive Trend Engine
Uses a custom NOMA line that blends classic moving averages with dynamic momentum and a proprietary “Confidence Momentum Oscillator” overlay.
Visual trend overlay and color fill for easy chart reading.
2. Multi-Factor Confidence Scoring
Each trade is scored on up to 11 confidence “boosters,” including:
Market Manipulation & Accumulation (detects smart money traps and true range expansions)
Accumulation/Distribution (AD line)
ATR Volatility Rank (prioritizes trades when volatility is “just right”)
COG Cross (center of gravity reversal points)
Change of Character/Break of Structure (CHoCH/BOS logic, SMC/ICT style)
Order Blocks, Breakers, FVGs, Inducements, OTE (Optimal Trade Entry) Zones
You control the minimum score required for a trade to trigger, plus the weight of each factor (customize for your asset or style).
3. Smart Trade Management
Step Take-Profits:
Up to 5 profit targets, each with individual contract/quantity splits.
Step Trailing Stop:
Trail your stop with a ratcheting logic that tightens after each TP is hit, or use a fully dynamic ATR-based trail for volatile markets.
Kill-Switch:
Instant trailing stop logic closes all open contracts if price reverses sharply.
4. Session Filter & Cooldown Logic
Restricts trading to key sessions (e.g., NY open) to avoid low-liquidity or dead zones.
Cooldown bars prevent “overtrading” or rapid re-entries after an exit.
5. Chop Zone Filter
Optionally blocks trades during flat/choppy periods using a custom “NOMA spread” calculation.
When enabled, background color highlights no-trade periods for clarity.
6. Real-Time Alerts
Receive alerts for:
Trade entries (long & short, with confidence score)
Every take-profit target hit
Trailing stop exits or full position closes
Easy setup: Create alerts for all conditions and get notified instantly.
Customization & Inputs
TP/SL Modes: Choose between manual, ATR-multiplied, or hybrid take-profit and trailing logic.
Position Sizing: Fixed contracts/quantity per trade, with customizable splits for scaling out.
Session Settings: Restrict to any time window.
Confidence Engine: User-controlled weights and minimum score—tailor for your asset.
Risk & Volatility Filters: ATR length/multiplier, min/max range, and more.
How To Use
Add NOMA to your chart.
Customize your settings (session, TPs, confidence scores, etc.).
Set up TradingView alerts (“Any Alert() function call”) to receive notifications.
Monitor trade entries, profit targets, and stops directly on your chart or in your inbox.
Adjust confidence weights as you optimize for your favorite asset.
Pro Tips
Start with default settings—they are optimized for NQ micro futures, 15m timeframe.
Increase the minimum confidence score or weights for stricter filtering in volatile or low-liquidity markets.
Adjust your take-profit and trailing stop settings to match your trading style (scalping vs. swing).
Enable “No Chop Zone” during sideways conditions for cleaner signals.
Test in strategy mode before trading live to dial in your risk and settings.
Disclaimer
This script is for educational and research purposes only. No trading system guarantees future results.
Performance will vary by symbol, timeframe, and market regime—always test settings and use at your own risk. Not investment advice.
If alerts or strategy entries are not triggering as expected, try lowering the minimum confidence score or disabling certain boosters.
This will come with a user manual please do not hesitate to message me to gain access. TO THE MOON AND BEYOND

Aether SignalAether Signal is a professional TradingView indicator engineered for advanced traders who demand precise analysis, smart money concepts, and robust risk management. It systematically incorporates institutional trading techniques, automated level detection, and multi-level profit-taking for exceptional trade execution.
Support & Resistance: Aether Signal automatically identifies key support and resistance levels using mathematically rigorous algorithms, ensuring that traders see the most significant price barriers for their entries and exits.
Smart Money Concepts: The indicator is grounded in institutional trading logic, analyzing market structure to pinpoint where large market participants are engaging. It leverages volume and price interaction at critical zones, similar to harmonic liquidity nodes in professional strategies.
Precise Entry Points: Entry signals are generated when strict confluence conditions are met, ensuring signals align with underlying market structure, high-volume footprints, and optimal momentum. Stops are logically placed just beyond the validated support or resistance—on the opposite side of the key zone.
Triple Take Profits: Aether Signal equips traders to maximize returns with three intelligently placed take profit levels (TP1, TP2, TP3), allowing for strategic scaling out and adaptive trade management.
Supply & Demand Zones: The indicator scans for market imbalances by identifying high-probability supply and demand areas driven by institutional activity and volume anomalies, guiding traders toward potent reversal or continuation setups.
Advanced Risk Management: Robust risk controls are integrated, including logical stop loss suggestions and trade selection filters, to minimize overtrading and enhance consistency.
Win Rate: The system claims a win rate of up to 96% under optimal settings and strict adherence to its entry criteria, setting a high benchmark for performance (note: actual results may vary depending on market conditions and trader discipline).
Aether Signal is tailored for traders seeking the edge of institutional-grade analytics—offering comprehensive structure analysis, actionable alerts, and performance-focused features that merge automation with trader control.

US Index First 30m Candle Strategy (10m Chart)Strategy Description for Publishing
Title: US Index First 30-Minute Candle Strategy (10m Chart)
Overview:
This Pine Script implements a trading strategy designed to capitalize on price movements within the first 30 minutes of the U.S. stock market opening. It is specifically tailored for use on a 15-minute chart and is optimized for trading U.S. indices during regular market hours.
Features:
Session Time Configuration: The strategy operates within the U.S. market hours, specifically from 9:30 AM to 4:00 PM (Eastern Time).
First 30-Minute Candle Aggregation: The script identifies the high and low of the first 30-minute candle, which is considered a critical time frame for market momentum.
Single Trade Per Day: To minimize risk, the strategy is designed to execute only one trade per day based on the established range of the first 30 minutes.
Dynamic Trade Conditions: Buy and sell signals are generated when the price breaks above the high or below the low of the first 30-minute candle, with defined stop-loss and take-profit levels based on a customizable risk-reward ratio.
How It Works:
Initialization:
At the start of each trading day, the script resets the high and low values for the first 30 minutes.
Range Locking: After the first 30 minutes, the high and low values are locked, allowing for trade entries based on these levels.
Trade Execution:
Long Entry: Triggered when the price moves above the locked high.
Short Entry: Triggered when the price drops below the locked low.
Risk Management: Each trade comes with a stop-loss and take-profit mechanism to manage potential losses and secure profits.
Visuals:
The script also plots the locked high and low levels on the chart, providing a visual reference for traders.
Conclusion:
This strategy leverages the volatility often seen in the first 30 minutes of trading, aiming to capture significant price movements while maintaining a disciplined trading approach. It is suitable for traders looking to implement a systematic strategy based on early market behavior.
Usage:
To use this strategy, simply add the script to your TradingView chart, set your desired parameters, and monitor for trade signals during the specified market hours. Adjust the risk-reward ratio as needed to align with your trading style.

HSI First 30m Candle Strategy (5m Chart)## HSI First Candle Breakout Strategy
USE on 10m TF for max profit rate.
**The HSI First Candle Breakout Strategy** is a systematic trading approach tailored for Hang Seng Index Futures during the main Hong Kong day session. The strategy is designed to capture early market momentum by reacting to the first significant move of the day.
### How It Works
- **Reference Candle:** At the start of each day session (09:00), the high and low of the first 15-minute candle are recorded.
- **Breakout Trigger:**
- A **buy (long) trade** is initiated if price breaks above the first candle’s high.
- A **sell (short) trade** is initiated if price breaks below the first candle’s low.
- **Stop Loss & Take Profit:**
- Stop-loss is placed on the opposite side of the reference candle.
- Take-profit target is set at a distance equal to the size of the reference candle (1R).
- **Filters:**
- Skip the day if the first candle’s range exceeds 200 index points.
- Only the first triggered direction is traded per session.
- All trades are closed before the market closes if neither target nor stop is hit.
- **Execution:** The strategy works best on intraday charts (5m or 15m) and is ideal for traders seeking disciplined, systematic intraday setups.
### Key Features
- Captures the day’s initial momentum burst.
- Strict risk management with predefined stops and targets.
- One trade per day, reducing overtrading and noise.
- Clear-cut, rule-based, and objective system—no discretion required.
**This strategy offers a transparent and robust framework for traders to systematically capture high-probability breakouts in the Hang Seng Index Futures market.**

Eliora Gold 1min (Heikin Ashi)Eliora -focused trading strategy designed for anything on the 1-minute timeframe using Heikin Ashi candles. This mode combines advanced market logic with structured risk management to deliver smooth, disciplined trade execution.
Key Features:
✅ Trend Confirmation – Aligns with dominant market direction for higher accuracy.
✅ ATR-Based Volatility Filter – Avoids high-risk conditions and chaotic price action.
✅ Candle Strength Logic – Filters weak setups, focusing on strong momentum.
✅ Balanced Risk/Reward – Calculates stop-loss and take-profit dynamically for consistent results.
✅ Cooldown & Overtrade Protection – Limits frequency to maintain trade quality.
This version of Eliora is built for scalpers and intraday traders seeking high-probability entries with graceful exits.

Pullback Pro Dow Strategy v7 (ADX Filter)
### **Strategy Description (For TradingView)**
#### **Title:** Pullback Pro: Dow Theory & ADX Strategy
---
#### **1. Summary**
This strategy is designed to identify and trade pullbacks within an established trend, based on the core principles of Dow Theory. It uses market structure (pivot highs and lows) to determine the trend direction and an Exponential Moving Average (EMA) to pinpoint pullback entry opportunities.
To enhance trade quality and avoid ranging markets, an ADX (Average Directional Index) filter is integrated to ensure that entries are only taken when the trend has sufficient momentum.
---
#### **2. Core Logic: How It Works**
The strategy's logic is broken down into three main steps:
**Step 1: Trend Determination (Dow Theory)**
* The primary trend is identified by analyzing recent pivot points.
* An **Uptrend** is confirmed when the script detects a pattern of higher highs and higher lows (HH/HL).
* A **Downtrend** is confirmed by a pattern of lower highs and lower lows (LH/LL).
* If neither pattern is present, the strategy considers the market to be in a range and will not seek trades.
**Step 2: Entry Signal (Pullback to EMA)**
* Once a clear trend is established, the strategy waits for a price correction.
* **Long Entry:** In a confirmed uptrend, a long position is initiated when the price pulls back and crosses *under* the specified EMA.
* **Short Entry:** In a confirmed downtrend, a short position is initiated when the price rallies and crosses *over* the EMA.
**Step 3: Confirmation & Risk Management**
* **ADX Filter:** To ensure the trend is strong enough to trade, an entry signal is only validated if the ADX value is above a user-defined threshold (e.g., 25). This helps filter out weak signals during choppy or consolidating markets.
* **Stop Loss:** The initial Stop Loss is automatically and logically placed at the last market structure point:
* For long trades, it's placed at the `lastPivotLow`.
* For short trades, it's placed at the `lastPivotHigh`.
* **Take Profit:** Two Take Profit levels are calculated based on user-defined Risk-to-Reward (R:R) ratios. The strategy allows for partial profit-taking at the first target (TP1), moving the remainder of the position to the second target (TP2).
---
#### **3. Input Settings Explained**
**① Dow Theory Settings**
* **Pivot Lookback Period:** Determines the sensitivity for detecting pivot highs and lows. A smaller number makes it more sensitive to recent price swings; a larger number focuses on more significant, longer-term pivots.
**② Entry Logic (Pullback)**
* **Pullback EMA Length:** Sets the period for the Exponential Moving Average used to identify pullback entries.
**③ Risk & Exit Management**
* **Take Profit 1 R:R:** Sets the Risk-to-Reward ratio for the first take-profit target.
* **Take Profit 1 (%):** The percentage of the position to be closed when TP1 is hit.
* **Take Profit 2 R:R:** Sets the Risk-to-Reward ratio for the final take-profit target.
**④ Filters**
* **Use ADX Trend Filter:** A master switch to enable or disable the ADX filter.
* **ADX Length:** The lookback period for the ADX calculation.
* **ADX Threshold:** The minimum ADX value required to confirm a trade signal. Trades will only be placed if the ADX is above this level.
---
#### **4. Best Practices & Recommendations**
* This is a trend-following system. It is designed to perform best in markets that exhibit clear, sustained trending behavior.
* It may underperform in choppy, sideways, or strongly ranging markets. The ADX filter is designed to help mitigate this, but no filter is perfect.
* **Crucially, you must backtest this strategy thoroughly** on your preferred financial instrument and timeframe before considering any live application.
* Experiment with the `Pivot Lookback Period`, `Pullback EMA Length`, and `ADX Threshold` to optimize performance for a specific market's characteristics.
---
#### **DISCLAIMER**
This script is provided for educational and informational purposes only. It does not constitute financial advice. All trading involves a high level of risk, and past performance is not indicative of future results. You are solely responsible for your own trading decisions. The author assumes no liability for any financial losses you may incur from using this strategy. Always conduct your own research and due diligence.

MA Crossover Strategy with TP/SL (5 EMA Filter)How the Strategy Works on a 5-Minute Chart:
Data Input (5-Minute Candles):
Every single data point (candle) on your chart will represent 5 minutes of price action (Open, High, Low, Close for that 5-minute period).
All calculations (MAs, EMA, signals) will be based on these 5-minute price data points.
Moving Average Calculations:
Fast MA (10-period SMA): This will be the Simple Moving Average of the closing prices of the last 10 five-minute candles. It reacts relatively quickly to recent price changes.
Slow MA (30-period SMA): This will be the Simple Moving Average of the closing prices of the last 30 five-minute candles. It represents a slightly longer-term trend compared to the Fast MA.
5 EMA (5-period EMA): This is the Exponential Moving Average of the closing prices of the last 5 five-minute candles. Being an EMA, it gives more weight to the most recent 5-minute prices, making it very responsive to immediate price action.
Signal Generation (Entry Conditions):
Long Entry Signal:
The 10-period SMA crosses above the 30-period SMA (indicating a potential bullish shift in the short-to-medium term trend).
AND the current 5-minute candle's closing price is above the 5-period EMA (confirming that the immediate price momentum is also bullish and supporting the crossover).
If both conditions are met at the close of a 5-minute candle, a "Buy" signal is generated.
Short Entry Signal:
The 10-period SMA crosses below the 30-period SMA (indicating a potential bearish shift).
AND the current 5-minute candle's closing price is below the 5-period EMA (confirming immediate bearish momentum).
If both conditions are met at the close of a 5-minute candle, a "Sell" signal is generated.
Trade Execution:
When a signal is triggered, the strategy enters a trade (long or short) at the closing price of that 5-minute candle.
Immediately upon entry, it places two contingent orders:
Take Profit (Target): Set at 2% (by default) away from your entry price. For a long trade, it's 2% above; for a short trade, 2% below.
Stop Loss: Set at 1% (by default) away from your entry price. For a long trade, it's 1% below; for a short trade, 1% above.
The trade will remain open until either the Take Profit or Stop Loss price is hit by subsequent 5-minute candles.
Implications for Trading on a 5-Minute Chart:
Increased Trade Frequency: You will likely see many more signals and trades compared to higher timeframes (like 1-hour or daily charts). This means more potential opportunities but also more transaction costs (commissions, slippage).
Sensitivity to Noise: Lower timeframes are more prone to "market noise" – small, random price fluctuations that don't indicate a true trend. While the 5 EMA filter helps, some false signals might still occur.
Faster Price Action: Price movements can be very rapid on a 5-minute chart. Your take profit or stop loss levels might be hit very quickly, sometimes within the same or next few candles.
Parameter Optimization is Crucial: The default MA lengths (10, 30) and EMA (5) might not be optimal for every asset or market condition on a 5-minute chart. You'll need to backtest extensively and potentially adjust these lengths, as well as the targetPerc and stopPerc, to find what works best for the specific instrument you're trading.
Risk Management: The fixed percentage stop loss is vital on a 5-minute chart due to its volatility. Without it, a few unfavorable moves could lead to significant losses.
