Daily Open Shift The "Daily Open Shift" System (V2.0)
1. The Setup (Indicators & Timeframe)
• Timeframe: 15-Minute Chart (Execution).
• Key Levels: Daily Open (DO) or New York Open (NYO).
• Trend Indicators:
o 24 & 42 EMA Ribbon (Exponential Moving Averages).
o 30-Minute Supertrend.
________________________________________
2. Phase 1: Establish The Bias (The Filter)
This is the V2 upgrade. We do not trade against the day's opening momentum.
1. Mark the Open: Draw a horizontal line at the Daily Open (00:00) or Session Open.
2. The "First 2H" Rule: Observe the price action for the first 2 hours after the open.
o First 2H are Green/Bullish? → You are LONG BIAS only for the rest of the session. (Ignore all sell signals).
o First 2H are Red/Bearish? → You are SHORT BIAS only for the rest of the session. (Ignore all buy signals).
________________________________________
3. Phase 2: The Signal (The Switch)
Wait for the chart to confirm your bias technically.
1. The Switch: Price must cross and close a 15M candle on the correct side of the Daily Open.
o Longs: Price switches from below to above DO.
o Shorts: Price switches from above to below DO.
2. Indicator Confluence:
o EMAs: Must be crossed in your direction (Green for Long, Red for Short).
o 30M Supertrend: Must match your direction.
________________________________________
4. Phase 3: The Entry (The Trigger)
We never chase the breakdown. We wait for the price to come to us.
1. The Pullback: Wait for the price to retrace and touch/wick into the 24/42 EMA Ribbon.
2. The Confirmation: Watch the candle that touches the EMA.
o It must reject the EMA (wick off it) and close respecting the trend.
o Do not enter if the candle closes forcefully through the EMA, breaking structure.
3. Execution: Enter Market Order immediately on that candle close.
________________________________________
5. Phase 4: Risk Management (The Math)
This is the V2 upgrade. We aim for higher profitability.
1. Stop Loss (SL):
o Longs: Placed strictly below the lowest EMA band.
o Shorts: Placed strictly above the highest EMA band.
o Logic: If price crosses the EMA band completely, the trend is dead. Get out.
2. Take Profit (TP):
o FIXED 3R (Reward = 3x Risk).
o Example: If Risk is $100, TP is set to make $300.
o Rule: Do not move the TP. Do not close early. Let the math play out.
________________________________________
Summary Checklist (Print This)
Time: Is the First 2H bias clear? (Green=Buy / Red=Sell)
Switch: Did price close above/below the Daily Open?
Trend: Are EMAs crossed and Supertrend agreeing?
Patience: Did I wait for the price to pull back to the EMA band?
Trigger: Did the candle close respecting the EMA?
Execution: Market Entry + Stop Loss behind EMA + Fixed 3R Target.
Mindset: Am I at "2/10" emotion? Set the trade and walk away.
스크립트에서 "momentum"에 대해 찾기

Quantum X StrategyQuantum X Strategy is a structured market-behavior based trading model developed for Midcap Nifty on the 15-minute timeframe.
It focuses on identifying directional strength, momentum alignment, and price participation using a multi-factor confirmation approach.
Rather than relying on a single indicator, the strategy evaluates multiple dimensions of price movement to determine whether the market environment is favorable for participation. This helps in avoiding random entries during low-quality or sideways conditions.
🔍 Conceptual Framework
The strategy dynamically observes:
Momentum expansion and contraction
Trend participation strength
Directional consistency over recent price action
Each market condition contributes to an internal decision process, allowing trades only when sufficient alignment is present. This approach helps filter out noise and improves trade selectivity.
📊 Trade Execution Philosophy
Trades are initiated only when market structure shows clear directional intent
Both bullish and bearish opportunities are evaluated independently
Positions are exited when momentum balance weakens or returns to a neutral state
No over-trading during indecisive phases
The system is designed to stay inactive during uncertain market conditions, which is a key part of its risk-aware behavior.
🕒 Backtesting Scope
For consistency and reliability, the strategy logic is activated only from January 2024 onward, ensuring analysis is focused on recent market behavior rather than outdated volatility patterns.
⚙️ Usage Guidelines
Instrument: MIDCAPNIFTY
Timeframe: 15 Minutes
Suitable for intraday and short-term positional observation
Works best when combined with disciplined risk management
⚠️ Disclaimer
This strategy is provided strictly for educational and research purposes.
Market conditions change, and past performance does not guarantee future results. Users should always forward-test and apply their own risk management before live use.

FxAST LiteWave Universal Profiles (intraday / swing)FxAST Lite Wave — Universal (Profiles)
This strategy is intended for educational and analytical use.
Derivative works must retain attribution and license terms.
_____________________________________________________________________________
Overview
FxAST Lite Wave is a rule-based trend participation strategy designed to adapt across multiple markets and timeframes using a simple profile switch.
Rather than attempting to predict reversals or tops and bottoms, the strategy focuses on identifying continuation opportunities once directional alignment and market participation are already present.
Its purpose is to provide a structured, repeatable framework for studying trend behavior and managing trades within established directional moves.
_______________________________________________________________________________
How It Works
FxAST Lite Wave evaluates market conditions using a layered confirmation process that includes:
• Directional bias
• Trend alignment
• Momentum participation
• Volatility suitability
• Market regime awareness
Trades are only considered when these conditions align, helping to reduce low-quality signals and overtrading during unfavorable environments.
Two built-in profiles are provided:
Intraday — designed for shorter-term participation
Swing — designed for higher-timeframe continuation
_______________________________________________________________________________
Core Concepts (Plain English)
Direction
Identifies which side of the market is currently in control.
This answers:
“Is pressure aligned for continuation?”
_______________________________________________________________________________
Momentum
Confirms that price is moving with intent rather than drifting or stalling.
This answers:
“Is participation present?”
_______________________________________________________________________________
Regime
Filters out unfavorable conditions such as congestion, compression, or low-energy chop.
This answers:
“Is this a tradable environment?”
_______________________________________________________________________________
Continuation Focus
Entries are designed to occur after alignmen t, not at arbitrary turning points.
The strategy favors:
• Pullbacks within trend
• Momentum resumption
• Sustained directional movement
_______________________________________________________________________________
Risk & Trade Management
FxAST Lite Wave includes structured trade management logic:
• Volatility-aware initial risk
• Optional partial profit taking
• Optional breakeven and trailing behavior
• Optional time-based exits
• Optional equity-based position sizing
A built-in on-chart Backtesting HUB displays live performance statistics for transparency and review.
_______________________________________________________________________________
Philosophy
FxAST Lite Wave is intentionally not a signal-spamming strategy .
It is designed to:
• Reduce decision fatigue
• Encourage rule-based consistency
• Support disciplined execution
If you need:
precise entries → use price action
precise exits → use structure
system context → use Lite Wave
_______________________________________________________________________________
Disclaimer
This strategy is provided for educational and analytical purposes only and does not constitute financial advice. Trading involves risk, and users are responsible for their own decisions. responsible for their own decisions.

Optimized BTC Mean Reversion (RSI 20/65)📈 Optimized BTC Mean Reversion (RSI 20/65)
Optimized BTC Mean Reversion (RSI 20/65) is a rule-based trading strategy designed to capture mean-reversion moves in strong market structures, primarily optimized for Bitcoin, but adaptable to other liquid cryptocurrencies.
The strategy combines RSI extremes, Stochastic momentum, and EMA trend filtering to identify high-probability reversal zones while maintaining strict risk management.
🔍 Strategy Logic
This system focuses on entering trades when price temporarily deviates from equilibrium, while still respecting the broader trend.
✅ Long Conditions
RSI below 20 (oversold)
Stochastic below 25
Price trading above the 200 EMA (or within a controlled deviation)
Designed to buy sharp pullbacks in bullish conditions
❌ Short Conditions
RSI above 65 (overbought)
Stochastic above 75
Price trading below the 200 EMA
Designed to sell relief rallies in bearish conditions
🛡 Risk Management
Fixed Stop Loss: 4%
Fixed Take Profit: 6%
Risk/Reward: 1 : 1.5
No pyramiding (single position at a time)
Full equity position sizing (adjustable)
All exits are predefined at entry, ensuring consistency and emotional discipline.
📊 Indicators Used
200 EMA – Trend direction filter
RSI (14) – Mean-reversion trigger (20 / 65 levels)
Stochastic Oscillator – Momentum confirmation
👁 Visual Features
EMA plotted directly on chart
Real-time Stop Loss, Take Profit, and Entry Price lines
Clear long/short entry markers
Works on all timeframes (optimized for intraday and swing trading)
🔔 Alerts
Long entry alerts
Short entry alerts
(Perfect for automation or discretionary execution)
⚠️ Disclaimer
This strategy is intended for educational and research purposes only. Past performance does not guarantee future results. Always test on a demo account and adjust risk parameters to your own trading plan.

SVTR [Ultimate]SVTR v1.0 is a fully automated trading strategy designed to identify high-probability market opportunities using structured momentum, trend validation, and risk-controlled execution logic.
This strategy is not a simple signal generator.
It is a complete decision engine that evaluates market conditions, confirms entries with multiple filters, and manages trades automatically according to predefined logic.
Built for traders who want consistency, discipline, and objective execution, SVTR removes emotional bias and delivers rule-based trading across different market environments.
KEY FEATURES
• Fully automated entry and exit logic
• Multi-layer confirmation system
• Momentum and trend validation
• Smart trade filtering to reduce noise
• Works on multiple markets and timeframes
• Non-repainting logic
• Alert-ready for automation and integrations
AUTOMATED STRATEGY LOGIC
SVTR continuously analyzes the market and only executes trades when all required conditions align.
This prevents overtrading and avoids weak or low-quality setups.
The strategy is designed to:
Enter when momentum and direction are confirmed
Avoid choppy and uncertain market phases
Exit trades based on objective, rule-driven logic
Maintain consistency regardless of emotions or bias
WHY THIS STRATEGY?
Most traders fail not because of bad ideas, but because of:
Late entries
Emotional decisions
Overtrading
Lack of discipline
SVTR v1.0 solves these problems by automating the decision process and executing trades exactly as designed, every time.
You trade the system.
Not your emotions.
WHO IS IT FOR?
• Traders looking for automated execution
• System-based and rule-driven traders
• Swing traders and intraday traders
• Traders who want consistency over discretion
• Users who want a ready-to-use strategy framework
IMPORTANT NOTES
• Invite-Only / Private access
• Source code is protected
• Designed for backtesting, automation, and live monitoring
• Strategy behavior may vary depending on market conditions and settings
VERSION
v1.0 – Initial Private Release
Future updates may include optimizations, additional filters, and performance improvements.
FINAL STATEMENT
SVTR v1.0 is built for traders who value structure, confirmation, and automation over guesswork.
If you are looking for a strategy that executes with discipline, filters weak setups, and operates as a complete automated system, this strategy is designed for you.

Sinals 15m - RSI 7 e 9This strategy is designed to capture continuation moves on the 15-minute chart by combining trend filters, momentum indicators, and strong-candle confirmation. The core idea is to enter trades shortly after EMA crossovers that signal direction, as long as momentum and candle strength support the move.

[SM-021] Gaussian Trend System [Optimized]This script is a comprehensive trend-following strategy centered around a Gaussian Channel. It is designed to capture significant market movements while filtering out noise during consolidation phases. This version (v2) introduces code optimizations using Pine Script v6 Arrays and a new Intraday Time Control feature.
1. Core Methodology & Math
The foundation of this strategy is the Gaussian Filter, originally conceptualized by @DonovanWall.
Gaussian Poles: Unlike standard moving averages (SMA/EMA), this filter uses "poles" (referencing signal processing logic) to reduce lag while maintaining smoothness.
Array Optimization: In this specific iteration, the f_pole function has been refactored to utilize Pine Script Arrays. This improves calculation efficiency and rendering speed compared to recursive variable calls, especially when calculating deep historical data.
Channel Logic: The strategy calculates a "Filtered True Range" to create High and Low bands around the main Gaussian line.
Long Entry: Price closes above the High Band.
Short Entry: Price closes below the Low Band.
2. Signal Filtering (Confluence)
To reduce false signals common in trend-following systems, the strategy employs a "confluence" approach using three additional layers:
Baseline Filter: A 200-period (customizable) EMA or SMA acts as a regime filter. Longs are only taken above the baseline; Shorts only below.
ADX Filter (Volatility): The Average Directional Index (ADX) is used to measure trend strength. If the ADX is below a user-defined threshold (default: 20), the market is considered "choppy," and new entries are blocked.
Momentum Check: A Stochastic RSI check ensures that momentum aligns with the breakout direction.
3. NEW: Intraday Session Filter
Per user requests, a time-based filter has been added to restrict trading activity to specific market sessions (e.g., the New York Open).
How it works: Users can toggle a checkbox to enable/disable the filter.
Configuration: You can define a specific time range (Default: 09:30 - 16:00) and a specific Timezone (Default: New York).
Logic: The strategy longCondition and shortCondition now check if the current bar's timestamp falls within this window. If outside the window, no new entries are generated, though existing trades are managed normally.
4. Risk Management
The strategy relies on volatility-based exits rather than fixed percentage stops:
ATR Stop Loss: A multiple of the Average True Range (ATR) is calculated at the moment of entry to set a dynamic Stop Loss.
ATR Take Profit: An optional Reward-to-Risk (RR) ratio can be set to place a Take Profit target relative to the Stop Loss distance.
Band Exit: If the trend reverses and price crosses the opposite band, the trade is closed immediately to prevent large drawdowns.
Credits & Attribution
Original Gaussian Logic: Developed by @DonovanWalll. This script utilizes his mathematical formula for the pole filters.
Strategy Wrapper & Array Refactor: Developed by @sebamarghella.
Community Request: The Intraday Session Filter was added to assist traders focusing on specific liquidity windows.
Disclaimer: This strategy is for educational purposes. Past performance is not indicative of future results. Please use the settings menu to adjust the Session Time and Risk parameters to fit your specific asset class.

Combined Signal + Auto Day Plan + Volume📘 TradingView Description — Combined Signal + Auto Day Plan + Volume
Strategy Overview
This strategy combines trend-following signals, daily context levels, and volume confirmation to generate high-probability intraday trading setups.
It is designed to filter noise, identify trend direction early, and avoid trades during low-quality market conditions.
🔷 1. Combined Signal Logic
The strategy merges multiple indicators to produce a single, cleaner signal:
Long Signal
Trend bias is bullish
Momentum histogram (MACD/Custom) shows upward pressure
Price crosses above the midline (WMA/EMA/etc.)
Volume supports the move
Short Signal
Trend bias is bearish
Momentum histogram shows downward pressure
Price crosses below the midline
Volume supports the move
This reduces false breakouts and ensures signals appear only during strong directional moves.
🔶 2. Auto Day Plan Levels (D-1 → D)
The script automatically reads previous day levels and displays them on today’s session:
Previous Day High (PDH)
Previous Day Low (PDL)
Previous Day Close (PDC)
Previous Day Mid / Range Zones
Optional FIB levels or custom zones
These levels act as intraday support/resistance, helping identify breakout, reversal, and retest opportunities.
Behavior:
D-1 levels are plotted from today’s open until today’s close.
Levels do not overlap into the wrong day.
Optional: extend lines to next day (D+1) for planning.
🔷 3. Volume Confirmation
To improve entry accuracy, the script checks for strength in volume:
Volume > X-period average
Volume spike detection
Relative Volume (RVOL) filter
Optional low-volume avoidance
A trade is taken only when the market shows real participation, reducing traps and sideways chop trades.
🔶 4. Entry & Exit Logic
Entry
Long Entry: Combined bull signal + volume confirmation
Short Entry: Combined bear signal + volume confirmation
Exit
Long Exit → Histogram turns down (hist < hist )
Short Exit → Histogram turns up (hist > hist )
Optional:
Auto SL at PDL/PDH
Trailing based on midline
Take profit using FIB or volatility levels
💠 5. Visuals
The chart plots:
Buy/Sell markers
D-1 support/resistance lines
Trend direction midline
Volume confirmation label
Combined signal status
Colors and styles can be customized from the input panel.
🎯 6. Purpose of the Strategy
This is a complete intraday automation tool combining:
✔ Trend
✔ Momentum
✔ Volume strength
✔ Key day levels
The goal is to provide structured, mechanical, rule-based trading — reducing emotional decisions and improving consistency.

New Age US ORB═════════════════════════════════════════════════════════════
NEW AGE US ORB
Opening Range Breakout Strategy with Neon Glow Effect
═════════════════════════════════════════════════════════════
🔒 INVITE-ONLY ACCESS
This script requires an invitation to use.
To request access, please send me a private message.
═════════════════════════════════════════════════════════════
🎯 OVERVIEW
The New Age US ORB is a clean, professional Opening Range Breakout (ORB) strategy with a futuristic visual style featuring dynamic neon glow effects.
Designed for Crypto (BTC/USD) and Indices (US100, US30, SPX) trading.
Best results on 5-minute or 15-minute chart with Regular Candles.
The strategy captures the first 15 minutes of US market activity (9:30-9:45 NY) and trades breakouts in the direction of the initial move.
💎 WHAT MAKES THIS UNIQUE
Unlike standard ORB indicators, this strategy combines:
• Proprietary 3-layer Neon Glow visualization for enhanced box visibility
• Integrated US Session backgrounds for market context
• Smart Session Filter to avoid low-probability late entries
• Separate Long/Short TP management for asymmetric markets
• Automatic EOD position closure for overnight risk control
• Daily trade limiter to prevent overtrading
• Global Timezone Support - works correctly for traders worldwide
This combination of visual design and risk management features is not available in standard ORB scripts.
Trade Smarter, not Harder.
📦 WHAT IS ORB?
The Opening Range Breakout (ORB) strategy is based on the concept that the first 15 minutes of the US market session often sets the tone for the rest of the day. The High and Low established during this period act as key support/resistance levels.
• Price breaks ABOVE ORB High → Bullish momentum (LONG)
• Price breaks BELOW ORB Low → Bearish momentum (SHORT)
⚡ KEY FEATURES
📦 ORB BOX VISUALIZATION
• Automatically captures High/Low of 9:30-9:45 NY candle
• Dynamic color change:
→ Cyan: Price ABOVE ORB High (Bullish)
→ Red: Price BELOW ORB Low (Bearish)
• Extends throughout the trading session
✨ NEON GLOW EFFECT
• 3-layer glow effect around the ORB box
• Layered borders (8px → 5px → 3px) with gradient transparency
• Creates futuristic, high-visibility appearance
• Toggle on/off in settings
🕐 US SESSION BACKGROUNDS
• US Open (9:30-11:30 NY) - Blue
• Lunch Break (11:30-13:30 NY) - Orange
• Afternoon (13:30-16:00 NY) - Green
• Visual reference only - helps identify optimal trading windows
⏱️ SESSION FILTER
• Configurable trading window (default: until 11:50 NY)
• Prevents late entries when momentum fades
• EOD auto-close in YOUR selected timezone (default: 21:45)
🎚️ RISK MANAGEMENT
• ORB Box Stop Loss: SL at opposite ORB level + buffer
• Separate Take Profit settings for Long/Short
• Points or Percentage mode
• Daily trade limit (default: 6 trades max)
📊 INFO DASHBOARD
• Real-time status panel (top right)
• Shows: Timezone, Status, Session, Direction, Trades, SL/TP, EOD, ORB levels
⚙️ SETTINGS
TIMEZONE
└── Your Timezone: Select from 12 global timezones (Default: Europe/Zurich)
Available: UTC, New York, Chicago, Los Angeles, London, Berlin,
Zurich, Paris, Tokyo, Hong Kong, Singapore, Sydney
ORB BOX (9:30-9:45 NY)
├── Show ORB Box: true/false
└── Neon Glow Effect: true/false
US SESSION BACKGROUNDS
├── Show Session Background: true/false
├── US Open Color (9:30-11:30)
├── Lunch Color (11:30-13:30)
└── Afternoon Color (13:30-16:00)
SESSION FILTER
├── Enable Session Filter: true/false
├── Session End Hour (NY): 0-23
└── Session End Minute (NY): 0-59
DAILY CLOSE (Your Timezone)
├── Enable Daily Close: true/false
├── EOD Hour: 0-23
└── EOD Minute: 0-59
TRADE LIMITS
├── Enable Daily Limit: true/false
└── Max Trades per Day: 1-10
STOP LOSS
├── Enable ORB Box SL: true/false
└── SL Buffer: Points distance from ORB level
TAKE PROFIT - LONG
├── Enable TP Long: true/false
├── Mode: Points / Percent
├── TP Long Points: Distance in points
└── TP Long Percent: Distance in %
TAKE PROFIT - SHORT
├── Enable TP Short: true/false
├── Mode: Points / Percent
├── TP Short Points: Distance in points
└── TP Short Percent: Distance in %
COLORS
├── Bullish: Default #00ffbb (Cyan)
└── Bearish: Default #ff1100 (Red)
📈 HOW TO USE
1. Apply to BTC/USD or US100 on 5min or 15min timeframe
2. Use Regular Candles for realistic results
3. Go to Strategy Properties → Enable ☑️ "Recalculate On Bar Close"
4. Select your Timezone in settings (for correct EOD close time)
5. Wait for ORB box to complete (9:45 NY)
6. Strategy enters automatically on breakout:
→ LONG when price closes above ORB High
→ SHORT when price closes below ORB Low
7. Manage risk with ORB Box SL and TP settings
8. All positions close at EOD time (in your timezone)
🔔 ALERTS
• LONG Entry - Breakout above ORB High
• SHORT Entry - Breakout below ORB Low
• EOD Close - End of day position close
💡 BEST PRACTICES
• Most effective during US Open session (9:30-11:30 NY)
• Avoid Lunch session (11:30-13:30) - lower volatility
• ORB levels act as support/resistance all day
• Wider TP for trending days, tighter for ranging markets
• Use session filter to avoid late, low-probability entries
═════════════════════════════════════════════════════════════
© AL_R4D1 - New Age Style Trading Tools
═════════════════════════════════════════════════════════════

Trend Flow & Breakout Professional [Strategy]Description:
🌪️ Overview
Stop guessing. Start following the flow.
The Trend Flow & Breakout Professional is a high-precision visual trading system designed to solve the biggest problem traders face: Choppy Markets & Fakeouts.
Instead of relying on lagging indicators that generate false signals, this engine uses a proprietary "Momentum Alignment Algorithm" to identify when price action is entering a genuine expansion phase. It transforms complex trend data into a clean, easy-to-read visual roadmap, allowing you to catch the meat of the move while filtering out the noise.
🔮 Key Features
1. The "Traffic Light" Visual System Trading is 90% psychology. This script reduces mental fatigue by coloring the chart background to reflect the dominant market state:
🟢 Green Zone (Bullish Flow): Momentum is accelerating upwards. The system suggests holding long positions and ignoring minor pullbacks.
🔴 Red Zone (Bearish Flow): Structure has broken down. The system suggests defensive measures or short entries.
Note: The background remains active as long as the trend structure holds, preventing you from exiting trades too early.
2. Smart Noise Filtering Unlike standard crossover strategies that get destroyed in sideways ranges, this system includes a Multi-Layer Trend Filter. It only triggers a signal when:
Short-term momentum aligns perfectly with the medium-term direction.
Volatility expands significantly (breakout confirmation).
Price successfully clears key long-term structural resistance (The "Blue Sky" Zone).
3. Built-in "Smart Strategy" Backtester We have integrated a professional-grade position management module. You can customize how the strategy executes trades in the settings:
Mode A: Sniper (Trend Reversal): Enters heavily on the first confirmed breakout and holds until the trend reverses. Ideal for swing traders.
Mode B: Builder (Pyramiding): Adds to the position incrementally as the trend confirms its strength, maximizing profit during strong runs.
4. Cooldown Mechanism To prevent over-trading, the algorithm includes a smart "Cooldown Period" that prevents signal spamming during high-volatility consolidations.
⚙️ How to Trade This System
Wait for the Signal:
Look for the "Buy" / "Sell" labels accompanied by a bright Neon Candle.
Ensure the background color shifts (e.g., from Grey/Red to Green).
Ride the Zone:
Do not exit just because of one red candle. As long as the Background remains Green, the trend is healthy.
The background color acts as your "psychological anchor," helping you let profits run.
Exit / Reversal:
A complete background color flip (e.g., Green to Red) indicates a structural trend failure. This is your signal to close positions or flip directions.
⚠️ Disclaimer
This tool is for educational and technical analysis purposes only. Past performance does not guarantee future results. Always use proper risk management.

VWolf - Raptor ClawOVERVIEW
The 'VWolf - Raptor Claw' is a straightforward scalping strategy designed for high-frequency trades based on the Stochastic RSI indicator. It focuses exclusively on identifying potential trend reversals through stochastic cross signals in extreme zones, without the need for additional confirmations. This makes it highly responsive to market movements, capturing rapid price shifts while maintaining simplicity.
This strategy is best suited for highly liquid and volatile markets like forex, indices, and major cryptocurrencies, where quick momentum shifts are common. It is ideal for experienced scalpers who prioritize fast entries and exits, but it can also be adapted for swing trading in lower timeframes.
Entry Conditions:
Long Entry:Stochastic RSI crosses above the oversold threshold (typically 20), indicating a potential bullish reversal.
Short Entry:Stochastic RSI crosses below the overbought threshold (typically 80), indicating a potential bearish reversal.
Exit Conditions:
Stop Loss: Set at the minimum (for longs) or maximum (for shorts) within a configurable lookback window to reduce risk.
Take Profit: Defined by a risk-reward ratio (RRR) input to optimize potential gains relative to risk.
CONCLUSION
The 'VWolf - Raptor Claw' strategy is perfect for traders seeking a simple yet aggressive approach to the markets. It capitalizes on sharp momentum shifts in extreme zones, relying on precise stop loss and take profit settings to capture rapid profits while minimizing risk. This approach is highly effective in high-volatility environments where quick decision-making is essential.
FOR MORE INFORMATION VISIT vwolftrading.com

VWolf - Quantum DriftOVERVIEW
The Quantum Drift strategy is a sophisticated, highly customizable trading approach designed to identify market entries and exits by leveraging multiple technical indicators. The strategy uniquely combines the Dynamic Exponential Moving Average (DEMA), QQE indicators, Volume Oscillator, and Hull Moving Average (HULL), enabling precise detection of trend direction, momentum shifts, and volatility adjustments. It stands out due to its adaptability across different market conditions by allowing significant user customization through various input parameters.
RECOMMENDED USE
Markets: Ideal for Forex and Stocks due to the strategy's volatility-sensitive and trend-following nature.
Timeframes: Best suited for medium to higher timeframes (15m, 1H, 4H), where clearer trend signals and less noise occur, enhancing strategy reliability.
CONCLUSION
The Quantum Drift strategy is tailored for intermediate to advanced traders seeking a versatile and adaptive system. Its strength lies in combining momentum, volatility, and trend-following components, providing robust entry and exit signals. However, its effectiveness relies significantly on accurate parameter tuning by traders familiar with the underlying indicators and market behavior.
FOR MORE INFORMATION VISIT vwolftrading.com

VWolf – Hull VectorOVERVIEW
VWolf – Hull Vector is a momentum-driven trend strategy centered on the Hull Moving Average (HMA) angle. It layers optional confirmations from EMA/DEMA alignment, DMI/ADX strength, and Supertrend triggers to filter lower-quality entries and improve trade quality.
Risk is controlled through capital-based position sizing, ATR-anchored stops and targets, and dynamic trade management (partial exits and stop movement). The strategy supports Backtest and Forwardtest modes with configurable date ranges, and a market profile toggle (Forex vs. Stocks) to adjust internal scaling for price behavior.
RECOMMENDED USE
Markets: Major Forex pairs, index CFDs/futures, and liquid stocks with clean trend legs.
Styles: Intraday and swing applications where momentum continuation is common.
Volatility Regimes: Performs best in trending or expanding-volatility environments; consider tightening thresholds in choppy phases.
Workflow Tips:Start with HMA angle + ST trigger only; then layer DEMA and DMI/ADX if you need more selectivity.
Use Forwardtest dates to simulate out-of-sample performance after tuning Backtest parameters.
Re-evaluate angle thresholds when switching between Forex and Stocks modes.
Strengths
Clear momentum core (HMA angle) with optional, orthogonal filters (trend alignment, strength, trigger).
Robust risk tooling: ATR/ST stops, two-step profits, and capital-based sizing.
Testing discipline: Native Backtest/Forwardtest scoping supports walk-forward validation.
Broad portability: Works across instruments thanks to market-aware scaling.
Precautions
Over-filtering risk: Enabling all gates simultaneously may under-trade; calibrate selectivity to your timeframe.
Sideways markets: Expect more whipsaws when slope hovers near zero; raise angle threshold or rely more on ADX gating.
Overfitting hazard: Tune on one regime, then verify with Forwardtest windows and alternative markets/timeframes.

AI ALGO [Ganesh]Core Strategy Components\
1. EMA (Exponential Moving Average) SystemThe strategy uses three EMAs to identify trend direction:
EMA 48 (longer-term trend)
EMA 2 (short-term momentum)
EMA 21 (medium-term trend)
How it works:
Bullish trend: When price is above EMA 21 (green cloud)
Bearish trend: When price is below EMA 21 (red cloud)
EMA Cloud: The area between EMA 2 and EMA 48/21 provides visual trend confirmation
Optional higher timeframe (HTF) analysis for multi-timeframe confirmation
2. DEMA ATR (Double EMA + Average True Range)
This is a dynamic support/resistance indicator that adapts to volatility:Components:
DEMA (Double Exponential Moving Average): Smooths price action with less lag
ATR Bands: Creates upper and lower bands based on volatility (ATR × 1.7 factor)
Signal Generation:
Green line: Uptrend (DEMA ATR rising)
Red line: Downtrend (DEMA ATR falling)
Acts as a trailing stop-loss level that adjusts with market volatility
3. Smart Trail System (Fibonacci-Based)
An advanced trailing stop system using modified true range calculations:Key Features:
Calculates true range using Wilder's smoothing method
Creates Fibonacci retracement levels (61.8%, 78.6%, 88.6%) from the trail line
Adaptive stop-loss: Adjusts based on ATR factor (4.2) and smoothing (4)
Trend Detection:
Bullish: Price > Trailing line (blue zones)
Bearish: Price < Trailing line (red zones)
The Fibonacci zones show potential support/resistance areas
4. ZigZag Indicator Identifies significant swing highs and lows:
Length parameter: 13 (sensitivity control)
Labels: Higher Highs (HH), Lower Lows (LL), etc.
Helps identify trend reversals and key pivot points
5. Support & Resistance Levels
Strength-based S/R: Identifies horizontal support/resistance zones
Zone width: Adjustable percentage-based zones
High/Low zones: Marks significant price levels
Trading LogicEntry Conditions (Implied)The strategy likely enters trades when:Long Entry:
Price crosses above DEMA ATR (green)
Price is above EMA 21 (bullish EMA cloud)
Smart Trail confirms uptrend
Price bounces from Fibonacci support levels
Short Entry:
Price crosses below DEMA ATR (red)
Price is below EMA 21 (bearish EMA cloud)
Smart Trail confirms downtrend
Price rejects from Fibonacci resistance levels
Exit/Stop-Loss Strategy
Trailing stops: Using Smart Trail Fibonacci levels
Dynamic stops: DEMA ATR line acts as a moving stop-loss
Risk management: Position sizing at 50% of equity per trade
Dashboard Features1. Weekly Performance Table
Tracks trades per day of the week
Shows win/loss statistics
Calculates win rate percentage
2. Monthly Performance Table
Monthly P&L breakdown
Yearly performance summary
Color-coded returns (green = profit, red = loss)
Strategy Parameters
Initial Capital: $5,000
Commission: 0.02% per trade
Position Size: 50% of equity
Pyramiding: Disabled (no adding to positions)
Calculation: On bar close (not tick-by-tick)
Visual Elements
EMA clouds: Green (bullish) / Red (bearish)
DEMA ATR line: Dynamic support/resistance
Smart Trail zones: Fibonacci-based colored bands
ZigZag lines: Swing high/low connections
S/R zones: Horizontal support/resistance areas
Strategy Philosophy
This is a trend-following strategy with dynamic risk management that:
Uses multiple timeframes for confirmation
Adapts to volatility through ATR-based indicators
Provides clear visual cues for trend direction
Includes comprehensive performance tracking
Combines momentum (EMAs) with volatility (ATR) for robust signals
The strategy works best in trending markets and uses the Fibonacci trail system to maximize profits while protecting against reversals with adaptive stop-losses.

Crypto Intraday Strategy by SAIFOverview
A comprehensive intraday trading strategy designed for cryptocurrency markets, combining multiple technical indicators and risk management principles to identify high-probability trading opportunities.
Key Features
Multi-Timeframe Analysis
Utilizes exponential moving averages for trend identification
Incorporates swing structure analysis for support and resistance levels
Applies momentum and trend strength filters
Risk Management
Configurable risk-reward ratios (default 1.6:1)
Maximum risk per trade capped at 3.1% of equity
Dynamic stop-loss placement based on market structure
Position sizing at 2% of equity per trade
Advanced Filters
Trend strength confirmation using ADX indicator
Momentum validation through multiple oscillators
Market correlation analysis for additional confluence
Optional weekend trading filter to avoid low-liquidity periods
Swing Structure Recognition
Automatically identifies key swing highs and lows
Uses pivot points to determine optimal entry zones
Prevents entries too far from established support/resistance
Trade Execution
The strategy employs a one-way trading approach, entering positions only when multiple technical conditions align. Each trade includes pre-defined stop-loss and take-profit levels calculated at entry.
Customization Options
Adjustable swing detection sensitivity
Configurable EMA distance thresholds
Optional correlation filters
Weekend trading toggle
Risk parameters can be modified to suit individual preferences
Important Disclaimers
⚠️ Educational Purpose Only: This strategy is provided for educational and informational purposes. Past performance does not guarantee future results.
⚠️ Risk Warning: Trading cryptocurrencies carries substantial risk of loss. Only trade with capital you can afford to lose.
⚠️ Not Financial Advice: This tool does not constitute financial, investment, or trading advice. Always conduct your own research and consult with qualified financial professionals.
⚠️ Backtesting Limitations: Historical backtesting results may not reflect actual trading conditions due to slippage, execution delays, and changing market dynamics.
Fees & Slippage
Commission: 0.12% per trade
Slippage: 2 ticks accounted for in backtesting
Recommended Usage
Thoroughly backtest on your preferred trading pairs
Start with small position sizes when live trading
Monitor performance across different market conditions
Adjust parameters based on asset volatility and your risk tolerance

Options Scalper v2 - SPY/QQQHere's a comprehensive description of the Options Scalper v2 strategy:
---
## Options Scalper v2 - SPY/QQQ
### Overview
A multi-indicator confluence-based scalping strategy designed for trading SPY and QQQ options on short timeframes (1-5 minute charts). The strategy uses a scoring system to generate high-probability CALL and PUT signals by requiring alignment across multiple technical indicators before triggering entries.
---
### Core Logic
The strategy operates on a **scoring system (0-9 points)** where both bullish (CALL) and bearish (PUT) conditions are evaluated independently. A signal only fires when:
1. A recent EMA crossover occurred (within the last 3 bars)
2. The direction's score meets the minimum threshold (default: 4 points)
3. The signal's score is higher than the opposite direction
4. Enough bars have passed since the last signal (cooldown period)
5. Price action occurs during valid trading sessions
---
### Indicators Used
| Indicator | Purpose | CALL Condition | PUT Condition |
|-----------|---------|----------------|---------------|
| **9/21 EMA Cross** | Primary trigger | Fast EMA crosses above slow | Fast EMA crosses below slow |
| **200 EMA** | Trend filter | Price above 200 EMA | Price below 200 EMA |
| **RSI (14)** | Momentum filter | RSI between 45-65 | RSI between 35-55 |
| **VWAP** | Institutional level | Price above VWAP | Price below VWAP |
| **MACD (12,26,9)** | Momentum confirmation | MACD line > Signal line | MACD line < Signal line |
| **Stochastic (14,3)** | Overbought/Oversold | Oversold or K > D | Overbought or K < D |
| **Volume** | Participation confirmation | Spike on green candle | Spike on red candle |
| **Price Structure** | Breakout detection | Higher high formed | Lower low formed |
---
### Scoring Breakdown
**CALL Score (Max 9 points):**
- Recent EMA cross up: +2 pts
- EMA alignment (fast > slow): +1 pt
- RSI in bullish range: +1 pt
- Above VWAP: +1 pt
- MACD bullish: +1 pt
- Volume spike on green candle: +1 pt
- Stochastic setup: +1 pt
- Above 200 EMA: +1 pt
- Breaking higher high: +1 pt
**PUT Score (Max 9 points):**
- Recent EMA cross down: +2 pts
- EMA alignment (fast < slow): +1 pt
- RSI in bearish range: +1 pt
- Below VWAP: +1 pt
- MACD bearish: +1 pt
- Volume spike on red candle: +1 pt
- Stochastic setup: +1 pt
- Below 200 EMA: +1 pt
- Breaking lower low: +1 pt
---
### Risk Management
The strategy uses **ATR-based dynamic stops and targets**:
| Parameter | Default | Description |
|-----------|---------|-------------|
| Stop Loss | 1.5x ATR | Distance below entry for longs, above for shorts |
| Take Profit | 2.0x ATR | Creates a 1:1.33 risk-reward ratio |
Positions are also closed on:
- Opposite direction signal (flip trade)
- Take profit or stop loss hit
---
### Session Filtering
Trades are restricted to high-liquidity periods by default:
- **Morning Session:** 9:30 AM - 11:00 AM EST
- **Afternoon Session:** 2:30 PM - 3:55 PM EST
This avoids choppy midday price action and captures the highest volume periods.
---
### Input Parameters
| Parameter | Default | Description |
|-----------|---------|-------------|
| Fast EMA | 9 | Fast moving average period |
| Slow EMA | 21 | Slow moving average period |
| Trend EMA | 200 | Long-term trend filter |
| RSI Length | 14 | RSI calculation period |
| RSI Overbought | 65 | Upper RSI threshold |
| RSI Oversold | 35 | Lower RSI threshold |
| Volume Multiplier | 1.2x | Volume spike detection threshold |
| Min Signal Strength | 4 | Minimum score required to trigger |
| Crossover Lookback | 3 | Bars to consider crossover "recent" |
| Min Bars Between Signals | 5 | Cooldown period between signals |
---
### Visual Elements
**Chart Plots:**
- Green line: 9 EMA (fast)
- Red line: 21 EMA (slow)
- Gray line: 200 EMA (trend)
- Purple dots: VWAP
**Signal Markers:**
- Green triangle up + "CALL" label: Buy call signal
- Red triangle down + "PUT" label: Buy put signal
- Small circles: EMA crossover reference points
**Info Table (Top Right):**
- Real-time CALL and PUT scores
- RSI, MACD, Stochastic values
- VWAP and 200 EMA position
- Recent crossover status
- Current signal state
---
### Alerts
| Alert Name | Trigger |
|------------|---------|
| CALL Entry | Standard call signal fires |
| PUT Entry | Standard put signal fires |
| Strong CALL | Call signal with score ≥ 6 |
| Strong PUT | Put signal with score ≥ 6 |
---
### Recommended Usage
| Setting | 0DTE Scalping | Intraday Swings |
|---------|---------------|-----------------|
| Timeframe | 1-2 min | 5 min |
| Min Signal Strength | 5-6 | 4 |
| ATR Stop Mult | 1.0 | 1.5 |
| ATR TP Mult | 1.5 | 2.0 |
| Option Delta | 0.40-0.50 | 0.30-0.40 |
---
### Key Improvements Over v1
1. **Requires actual crossover** - Eliminates false signals from simple trend continuation
2. **Balanced scoring** - Both directions evaluated equally, highest score wins
3. **Signal cooldown** - Prevents overtrading with minimum bar spacing
4. **Multi-indicator confluence** - 8 factors must align for signal generation
5. **Volume-candle alignment** - Volume spikes only count when matching candle direction
---
### Disclaimer
This strategy is for educational purposes. Backtest thoroughly before live trading. Options trading involves significant risk of loss. Past performance does not guarantee future results.

The Truth Sniper: Breathing Edition**Overview**
This is a highly advanced trend-following strategy designed to filter out market noise ("Fakeouts") and manage risk using a dynamic "Breathing Ratchet" mechanism. It combines traditional trend analysis with institutional money flow logic to identify the true market direction.
**Key Features**
**1. The Conflict Zone (Gray Zone Filter)**
Most strategies fail during low-volume accumulation or distribution phases. This algorithm introduces a "Conflict Zone" logic:
* **True Rally (Green):** Price is above EMA50 AND Money Flow (VFI) is positive.
* **True Drop (Red):** Price is below EMA50 AND Money Flow (VFI) is negative.
* **Conflict (Gray Background):** When Price and Money Flow disagree (e.g., Price rising on negative volume), the background turns Gray. **Trading is disabled** in these zones to avoid bull/bear traps.
**2. Breathing Stop-Loss Mechanism (Volatility Adjusted)**
The Stop Loss isn't static. It "breathes" based on market heat (Volume/RSI):
* **High Heat (High Volatility):** The SL loosens its grip, moving towards the bottom of the Fibonacci zone to allow price fluctuation without premature exits.
* **Low Heat (Low Volatility):** The SL tightens aggressively towards the price to lock in profits during slow momentum.
**3. The Ratchet Lock (Slippage Prevention)**
To ensure maximum profit retention, the "Breathing" mechanism is governed by a **Ratchet Logic**:
* **For Longs:** The Stop Loss can ONLY move UP. If the "Breathing" calculation suggests lowering the stop (due to increased volatility), the Ratchet blocks it, keeping the SL at the highest historical level.
* **For Shorts:** The Stop Loss can ONLY move DOWN.
**4. Fibonacci Exit Zones**
Exits are calculated based on a 60-day dynamic High/Low lookback, creating "Zones" (0-23.6%, 23.6-38.2%, etc.) that the price must conquer. The SL trails these zones mechanically.
**Visual Guide**
* **Lime/Red Background:** Active Trade Zone (Confirmed Trend).
* **Gray Background:** Conflict Zone (Stay Out / Hold).
* **Purple 'X':** The exact price level where the Stop Loss was hit (Fixed marker).
* **Stepline:** The active Stop Loss level (Visible only during open trades).
**Disclaimer**
This script is for educational and research purposes only. Always manage your risk.

W/M Pattern Strategy + MACD/RSI Confirmation V3.0 by ThaungkmitlW/M Pattern Strategy + MACD/RSI Confirmation V3.0
Description Text:
This script is a comprehensive Strategy (backtestable) that combines classical Chart Patterns with momentum indicators to identify high-probability reversal setups. It focuses on detecting "W" Patterns (Double Bottoms/Higher Lows) and "M" Patterns (Double Tops/Lower Highs), filtered by MACD and RSI to reduce false signals.
How It Works
The strategy relies on a "Confluence" of three factors before triggering an entry:
1. Price Action Patterns (W & M)
W Pattern (Bullish): The script detects Pivot Lows. If a new Pivot Low is higher than the previous one (forming a Higher Low structure), it marks a potential "W" pattern.
M Pattern (Bearish): The script detects Pivot Highs. If a new Pivot High is lower than the previous one (forming a Lower High structure), it marks a potential "M" pattern.
2. MACD Confirmation (Zero Line)
Price action alone is not enough. The script waits for the MACD Line to cross the Zero Line:
Buy: MACD crosses UP over 0 (indicating bullish momentum shift).
Sell: MACD crosses DOWN under 0 (indicating bearish momentum shift).
3. RSI Threshold
To ensure the trend has strength, the RSI (Relative Strength Index) acts as a final filter:
Buy Condition: RSI must be above 50.
Sell Condition: RSI must be below 50.
Visual Features
Pivot Labels: Automatically marks Pivot High (Red Triangle) and Pivot Low (Green Triangle).
Pattern Lines: Draws lines connecting the swing points when a potential W or M pattern is detected.
Signals: Displays "BUY" or "SELL" labels with text explaining the setup (e.g., "W+MACD+RSI").
Background: Highlights the chart background (Green/Red) when a valid trade signal occurs.
EMAs: Plots EMA 10 (Blue) and EMA 15 (Red) to help you visualize the immediate trend direction.
Settings
Pivot Left/Right Bars: Adjust the sensitivity of the Swing detection.
MACD Settings: Fast, Slow, and Signal lengths (Standard 12, 26, 9).
RSI Settings: Adjust Length and the Threshold level (Default is 50).
Backtesting
This is a strategy script, meaning you can use the Strategy Tester panel below the chart to see how this logic performs on historical data for your chosen timeframe and asset.
Disclaimer: This tool is for educational purposes. Past performance in backtesting does not guarantee future results.

YCGH Ultimate Stocks Breakout Sniper📈 YCGH Ultimate Stocks Breakout Sniper
Overview
A sophisticated momentum-based breakout strategy designed to capture high-probability directional moves during volatility expansion phases. This system identifies breakout opportunities when price decisively breaks through established ranges, combining multiple technical filters to enhance signal quality and minimize false breakouts.
🎯 Strategy Features
Core Methodology:
Proprietary breakout detection algorithm
Multi-layered confirmation filters for signal validation
Adaptive trailing stops for profit protection
Systematic risk management with daily drawdown controls
Key Components:
✅ Volatility Expansion Filter - Only trades during periods of elevated market volatility to avoid choppy, range-bound conditions
✅ Optional Trend Alignment - Configurable trend filter (EMA/SMA/RMA/WMA) to align entries with broader market direction
✅ ROC Momentum Filter - Daily rate-of-change filter to capture strong momentum days (optional)
✅ Comprehensive Exit Strategy:
Fixed stop-loss (default 2%)
Take-profit targets (default 9%)
Dynamic trailing stops (2% activation, 0.5% offset)
✅ Flexible Direction Trading:
Auto-detect mode: Long+Short for perpetuals, Long-only for spot/equities
Manual override options available
Suitable for both crypto and stock markets
📊 Market Applicability
Optimized for: Cryptocurrency perpetual contracts and equity markets (1H-4H timeframes)
Also effective on: Futures and high-liquidity spot markets
The strategy adapts to different market regimes through configurable volatility and trend filters, making it versatile across various trading instruments and timeframes.
⚙️ Risk Management
Position Sizing: Percentage-based allocation with leverage support
Intraday Loss Limit: Maximum 10% drawdown protection (configurable)
Realistic Cost Modeling: 0.025% commission + 1 tick slippage
No Pyramiding: Single position management for controlled risk exposure
📈 Performance Visualization
Includes a comprehensive monthly returns table displaying:
Year-by-year performance breakdown
Monthly profit/loss percentages
Visual color-coding (green for profits, red for losses)
Clean, modern design with transparent styling
🔐 Access & Pricing
This is a PROTECTED, invite-only strategy.
The source code is not open-source and requires paid access for usage.
How to Get Access:
📧 Email: brijamohanjha@gmail.com
Include in your email:
Your TradingView username
Markets/assets you plan to trade
Preferred timeframe
What You'll Receive:
Full strategy access with invite-only permissions
Complete parameter documentation
Setup and optimization guidance
Implementation support
⚠️ Important Disclosures
Backtesting Parameters:
Commission: 0.025% per trade
Slippage: 1 tick
Results reflect realistic trading conditions
Risk Warning:
Past performance does not guarantee future results. This strategy involves substantial risk and may not be suitable for all investors. Users should thoroughly understand the risks and customize parameters based on their risk tolerance and market conditions.
📞 Contact for Access
Email: brijamohanjha@gmail.com
For questions about functionality, pricing, optimization, or market-specific settings, please reach out via email.
Note: This is a premium, paid strategy. Access is granted manually after consultation and payment confirmation.

YCGH Crypto ultimate Breakout StrategyAdvanced Momentum Breakout Strategy - Optimized for crypto markets, proven effective on equities
Core Features:
Multi-layered signal generation combining volatility expansion and momentum confirmation
Adaptive risk management with dynamic stops, profit targets, and trailing mechanisms
Systematic position sizing with configurable leverage (designed for perpetual/margin trading)
Volatility regime filters to avoid false breakouts during low-momentum periods
Optional trend alignment for directional bias confirmation
Comprehensive backtesting with realistic slippage and commission modeling
Daily drawdown limits for capital preservation
Performance:
Applicable across multiple timeframes (1H, 4H, Daily)
Works on both spot and derivatives markets
Long and short position capability
Interested in using this strategy? This is a paid service. For access to the complete script and implementation support, email: brijamohanjha@gmail.com

Triple EMA + RSI + ATRThis comprehensive trading system combines triple EMA alignment, RSI momentum filtering, and dynamic ATR-based risk management. The strategy enters positions only when fast, medium, and slow EMAs align in proper order (bullish or bearish), confirmed by RSI remaining within defined thresholds (not overbought/oversold) and a volume spike above its moving average. Exits are managed intelligently using a multi-tier approach: a fixed stop-loss based on ATR, a first profit target at a predefined risk-reward ratio, and a trailing stop that activates after reaching a second, higher profit tier. Designed for trend-following with built-in momentum and volume confirmation, it features professional order execution with configurable commission and slippage for realistic backtesting. Visual cues including colored backgrounds and signal shapes enhance chart clarity.

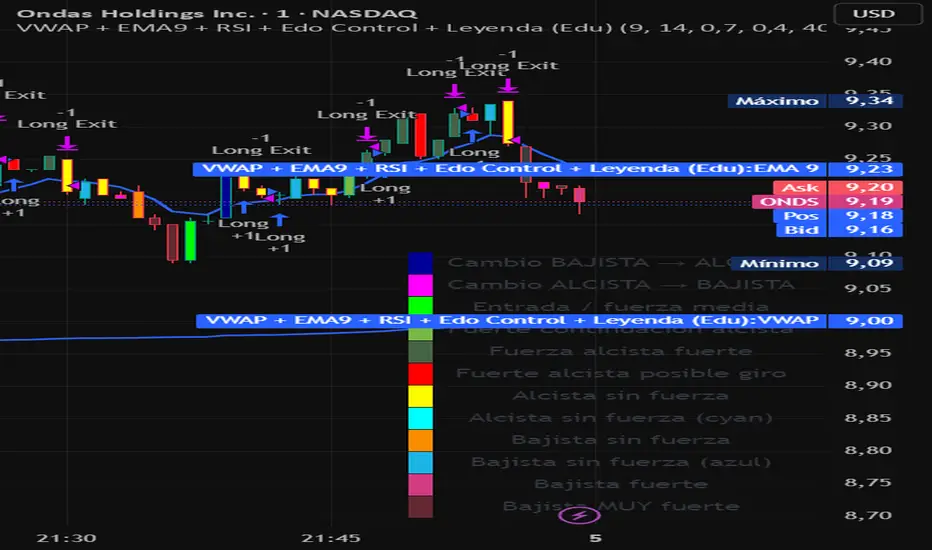
VWAP + EMA9 + RSI + Edo Control (Edu)VWAP + EMA9 + RSI + Edo Control (Edu)
A complete intraday scalping system that combines institutional levels, fast trend signaling and enhanced candle-color analysis for maximum clarity and confirmation.
This indicator includes:
1. VWAP (Volume Weighted Average Price)
The institutional reference line used to determine value zones, liquidity bias and directional pressure.
2. EMA9 (Fast Exponential Moving Average)
A micro-trend guide that reacts quickly to short-term movements and improves timing on pullback entries.
3. RSI (Relative Strength Index)
A clean momentum filter using the classic >50 (bullish) and <50 (bearish) bias.
Edo Control – Advanced Colored Candle System
This version integrates Edo Control, a custom candle-color engine that visualizes market strength shifts based on Williams %R, directional movement and ADX behavior.
Each candle color represents a different market condition, such as:
Trend acceleration
Trend weakening
Possible reversals
Momentum spikes
Bullish or bearish pressure
Transition zones
A built-in movable legend explains the meaning of each color directly on the chart, so traders can identify conditions instantly without guessing.
Why this indicator works
The combination of VWAP + EMA9 + RSI + colored candle strength creates a multi-layer confirmation system that cuts noise and highlights only meaningful setups.
Designed for 1m, 3m, 5m charts, but also effective on higher timeframes.
Suitable for: stocks, indices, futures, forex, crypto.
Long Only EMA Strategy (9/20 with 200 EMA Filter)Details:
This strategy is built around a very simple idea: follow the primary trend and enter only when momentum supports it.
It uses three EMAs on a standard candlestick chart:
1. 9‑period EMA – short‑term momentum
2. 20‑period EMA – medium‑term structure
3. 200‑period EMA – long‑term trend filter
The strategy is ** long‑only ** and is mainly designed for swing trading and positional trading.
It avoids counter‑trend trades by taking entries only when price is trading ** above the 200 EMA **, which is commonly used as a long‑term trend reference.
The rules are deliberately kept simple so that they are easy to understand, modify, and test on different markets and timeframes.
---
Key Features
1. **Trend‑Filtered Entries**
- Fresh long positions are considered only when:
- The 9 EMA crosses above the 20 EMA
- The closing price is **above** the 200 EMA
- This attempts to combine short‑term momentum with a higher‑timeframe trend filter.
2. **Clean Exit Logic**
- The long position is exited when the closing price crosses **below** the 20 EMA.
- This creates an objective, rule‑based way to trail the trade as long as the medium‑term structure remains intact.
3. **Long‑Only, No Short Selling**
- The script intentionally ignores short setups.
- This makes it suitable for markets or accounts where short selling is restricted, or for traders who prefer to participate only on the long side of the market.
4. **Simple Visuals**
- All three EMAs are plotted directly on the chart:
- 9 EMA (fast)
- 20 EMA (medium)
- 200 EMA (trend)
- Trade entries and exits are handled by TradingView’s strategy engine, so users can see results in the Strategy Tester as well as directly on the chart.
5. **Backtest‑Friendly Structure**
- Uses TradingView’s built‑in `strategy()` framework.
- Can be applied to different symbols, timeframes, and markets (equities, indices, crypto, etc.).
- Works on standard candlestick charts, which are supported by TradingView’s backtesting engine.
6. **Configurable in Code**
- The EMA periods are defined in the code and can be easily adjusted.
- Users can tailor the parameters to fit their own style (for example, faster EMAs for intraday trading, slower EMAs for positional trades).
---
How to Use
1. **Add the Strategy to Your Chart**
1. Open any symbol and select a **standard candlestick chart**.
2. Apply the strategy from your “My Scripts” section.
3. Make sure it is enabled so that the trades and results appear.
2. **Select Timeframe**
- The logic can be tested on various timeframes:
- Higher timeframes (1H, 4H, 1D) for swing and positional setups.
- Lower timeframes (5m, 15m) for more active trading, if desired.
- Users should experiment and see where the strategy behaves more consistently for their chosen market.
3. **Read the Signals**
- **Entry:**
- A long trade is opened when the 9 EMA crosses above the 20 EMA while the closing price is above the 200 EMA.
- **Exit:**
- The open long position is closed when the closing price crosses below the 20 EMA.
- All orders are generated automatically once the strategy is attached to the chart.
4. **Use the Strategy Tester**
- Go to the **Strategy Tester** tab in TradingView.
- Check:
- Net profit / drawdown
- Win rate and average trade
- List of trades and the equity curve
- Change the date range and timeframe to see how stable the results are over different periods.
5. **Adjust Parameters if Needed**
- Advanced users can open the code and experiment with:
- EMA lengths (for example 8/21 with 200, or 10/30 with 200)
- Risk sizing and capital settings within the `strategy()` call
- Any changes should be thoroughly re‑tested before considering real‑world application.
---
Practical Applications
1. **Swing Trading on Daily Charts**
- Can be applied to stocks, indices, or ETFs on the daily timeframe.
- The 200 EMA acts as a trend filter to stay aligned with the broad direction, while the 9/20 crossover helps catch medium‑term swings inside that trend.
2. **Positional Trades on Higher Timeframes**
- On 4H or 1D charts, this approach can help in holding trades for several days to weeks.
- The exit rule based on the 20 EMA crossing helps avoid emotional decisions and provides a rules‑based way to trail the trend.
3. **Trend‑Following Filter**
- Even if used purely as a filter, the 200 EMA condition can help traders:
- Avoid taking long trades when the market is in a clear downtrend.
- Focus only on instruments that are trading above their long‑term average.
4. **Educational Use**
- The script is intentionally kept straightforward so that newer users can:
- Learn how a moving average crossover strategy works.
- See how to combine a short‑term signal with a long‑term filter.
- Understand how TradingView’s strategy engine handles entries and exits.
5. **Basis for Further Development**
- This can serve as a starting point for more advanced systems.
- Traders can extend it by adding:
- Additional filters (RSI, volume, volatility filters, time‑of‑day filters, etc.)
- Risk management rules (fixed stop loss, take profit, trailing stops).
- The current version is kept minimal on purpose, so modifications are easy to implement and test.
---
Important Notes & Disclaimer
1. This strategy is provided **for testing, research, and educational purposes only**.
2. It is ** not ** a recommendation to buy or sell any financial instrument.
3. Past performance on historical data does not guarantee similar results in live markets.
4. Markets are risky and trading can lead to financial loss; users should always do their own research, manage risk appropriately, and consult a qualified financial professional if needed.
5. Before using any strategy with real capital, it is strongly advised to:
- Forward test it on a demo / paper trading account.
- Check how it behaves during different market phases (trending, sideways, high‑volatility conditions).
You are free to modify the parameters and logic to better align it with your own trading style and risk tolerance.
