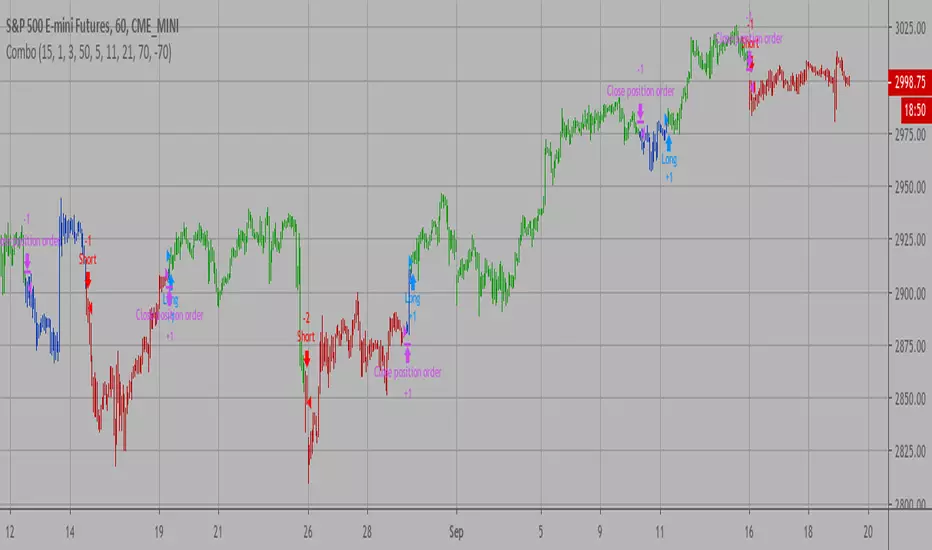
Combo Backtest 123 Reversal & Ergodic TSI This is combo strategies for get a cumulative signal.
First strategy
This System was created from the Book "How I Tripled My Money In The
Futures Market" by Ulf Jensen, Page 183. This is reverse type of strategies.
The strategy buys at market, if close price is higher than the previous close
during 2 days and the meaning of 9-days Stochastic Slow Oscillator is lower than 50.
The strategy sells at market, if close price is lower than the previous close price
during 2 days and the meaning of 9-days Stochastic Fast Oscillator is higher than 50.
Second strategy
r - Length of first EMA smoothing of 1 day momentum 4
s - Length of second EMA smoothing of 1 day smoothing 8
u- Length of third EMA smoothing of 1 day momentum 6
Length of EMA signal line 3
Source of Ergotic TSI Close
This is one of the techniques described by William Blau in his book "Momentum,
Direction and Divergence" (1995). If you like to learn more, we advise you to
read this book. His book focuses on three key aspects of trading: momentum,
direction and divergence. Blau, who was an electrical engineer before becoming
a trader, thoroughly examines the relationship between price and momentum in
step-by-step examples. From this grounding, he then looks at the deficiencies
in other oscillators and introduces some innovative techniques, including a
fresh twist on Stochastics. On directional issues, he analyzes the intricacies
of ADX and offers a unique approach to help define trending and non-trending periods.
WARNING:
- For purpose educate only
- This script to change bars colors.
스크립트에서 "momentum"에 대해 찾기

Script Criptomaníacos FuturesThis Script runs a strategy for long and short entries.
The strategy is based on a breakout system, that enters long or short based on previous support and resistences, and a series of indicators in order to read the trend and momentum of price charts.
We are only able to place entry orders when the background collor indicates price matches with the Trend/Momentum filters, being green for long and red for short trades.
The exit will always based on a trailling stop.
__________________________________________
Esse script roda uma estratégia para entradas em long e short.
A estratégia é baseada em um estratégias de rompimento, que entra Long ou Short baseado em suportes e resistências anteriores, além de uma série de indicadores afim de ler a tendência e o momentum do gráfico de preço.
Só estamos autorizados a emitir ordens de entrada quando o Background indica que o preço concorda com os filtros de Tendência/Momentum, sendo verde para Long (compra) e Short (venda).
A saída sempre vai ser baseada em um método de trailling stop.

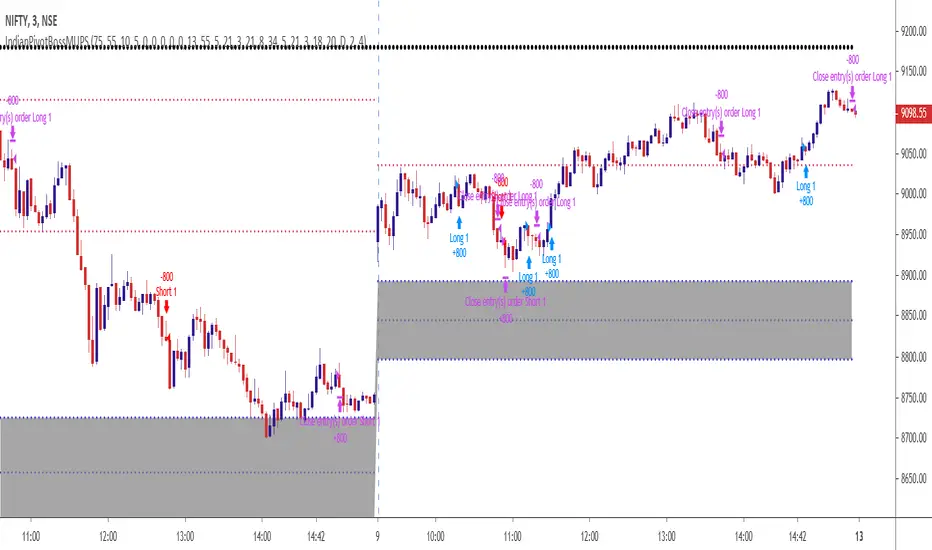
IndianPivotBossMUPSThis is a new avatar of the MUPS (ManojUltimatePivotScalpingStrategy).
This Indicator is to be used with the following Indicators :
1) IndianPivotBossPEMA
2) IndianPivotBossPIVOTRSI
3) IndianPivotBossDPWMACD
4) IndianPivotBossPIVOTSHIFT
BcondA = crossover(close,dtime_up) or low > dtime_up
BcondB = crossover(low,imap) or crossover(low,dpivotema) or crossover(low,imapw) or crossover(low,imapm)
//BcondC = crossover(low,ddtime_pivot)
BcondD = crossover(low,wtime_pivot)
BcondE = crossover(low,mtime_pivot)
BcondF = crossover(low,idtime_pivot)
BcondG = imacd > 0 or imacdw > 0 or imacdm > 0
BcondH = (rsipe > 50 and rsipe > rsippe) or (rsipew > 50 and rsipew > rsippew) or (rsipem > 50 and rsipem > rsippem)
BcondI = crossover(imacd,0) and close > maFast
//BcondI = ( dtime_pwd < ema(dtime_pwd,8) and crossover(low,dtime_r1))
EcondS = (imacd < 0 or crossunder(imacd,0) or close < maSlow) and rsipe < 50 and rsippe < 50 //crossunder(high,dtime_pivot) or crossunder(high,dpivotema) or crossunder(close,wtime_pivot) or crossunder(high,idtime_pivot) or crossunder(rsipe,rsippe) or crossunder(rsipe,50) or crossunder(high,dtime_r1)
Objective :
To enter into a trade when the direction, trend and momentum is confirmed.
Rules :
The following are the broad conditions for taking a long position. Reverse is for Short.
Direction - Defined by price crossing either daily cpr / weekly pivot / monthly pivot / intraday 125 min pivot
Trend - Defined by IndianPivotBossPIVOTSHIFT and IndiaPivotBossDPWMACD. The latter is a variant of the former. The former gives advance indication of a trend, while the latter confirms moments later.
Momentum - Defined by IndianPivotBossPIVOTRSI.
The strategy takes long when direction is established by the price crossing pivots and trend is established with pivot shift indicator sloping upwards which is further confirmed by DPWMACD, which is a variant of pivot shift indicator, crossing midline and sloping upwards and Momentum is established by Pivot RSI indicator when it crosses 50 and is above its own EMA.
Exits are usually at close. In case if the combination fizzles out, the strategy shows exit signal if any of the 3 ie, direction / trend / momentum fizzles out.
It is suggested to close down the positions at day end as sometimes the strategy continues the position overnight if deemed fit.
Other Rules when you take a long trade based on the signal.
1) Ensure the price is above PEMA and PEMA is upward sloping.
2) Ensure the Pivot shift indicator is upward sloping; Ensure the DPWMACD is also upward sloping.
3) Ensure the Daily Pivot RSI is above 50 and is above its own EMA.
This is not a holy grail. Hence have a proper position sizing which is your ultimate defense.
IMPORTANT : WHEN YOU USE THIS INDICATOR ALONG WITH 1,2,3,4 MENTIONED IN THE TOP PORTION OF THIS POST, PLS ENSURE THAT THE STRATEGY CHOSEN IS MUPS AS ALL THOSE MENTIONED ABOVE ARE ALSO STRATEGIES ON ITS OWN. MUPS COMBINES ALL THESE.
Trading Public School ST1This is a derivative of Trading Public School "TTM Squeeze" volatility indicator, as discussed in his book "Mastering the Trade" (chapter 11).
Black crosses on the midline show that the market just entered a squeeze ( Bollinger Bands are with in Keltner Channel). This signifies low volatility , market preparing itself for an explosive move (up or down). Gray crosses signify "Squeeze release".
Mr.Carter suggests waiting till the first gray after a black cross, and taking a position in the direction of the momentum (for ex., if momentum value is above zero, go long). Exit the position when the momentum changes (increase or decrease --- signified by a color change). My (limited) experience with this shows, an additional indicator like ADX / WaveTrend, is needed to not miss good entry points. Also, Mr.Carter uses simple momentum indicator , while I have used a different method (linreg based) to plot the histogram. 100% Profit & loss 10% Only

Combo Backtest 123 Reversal & CMOfilt This is combo strategies for get a cumulative signal.
First strategy
This System was created from the Book "How I Tripled My Money In The
Futures Market" by Ulf Jensen, Page 183. This is reverse type of strategies.
The strategy buys at market, if close price is higher than the previous close
during 2 days and the meaning of 9-days Stochastic Slow Oscillator is lower than 50.
The strategy sells at market, if close price is lower than the previous close price
during 2 days and the meaning of 9-days Stochastic Fast Oscillator is higher than 50.
Second strategy
This indicator plots a CMO which ignores price changes which are less
than a threshold value. CMO was developed by Tushar Chande. A scientist,
an inventor, and a respected trading system developer, Mr. Chande developed
the CMO to capture what he calls "pure momentum". For more definitive
information on the CMO and other indicators we recommend the book The New
Technical Trader by Tushar Chande and Stanley Kroll.
The CMO is closely related to, yet unique from, other momentum oriented
indicators such as Relative Strength Index, Stochastic, Rate-of-Change, etc.
It is most closely related to Welles Wilder`s RSI, yet it differs in several ways:
- It uses data for both up days and down days in the numerator, thereby directly
measuring momentum;
- The calculations are applied on unsmoothed data. Therefore, short-term extreme
movements in price are not hidden. Once calculated, smoothing can be applied to the
CMO, if desired;
- The scale is bounded between +100 and -100, thereby allowing you to clearly see
changes in net momentum using the 0 level. The bounded scale also allows you to
conveniently compare values across different securities.
WARNING:
- For purpose educate only
- This script to change bars colors.

Combo Backtest 123 Reversal & CMOav This is combo strategies for get a cumulative signal.
First strategy
This System was created from the Book "How I Tripled My Money In The
Futures Market" by Ulf Jensen, Page 183. This is reverse type of strategies.
The strategy buys at market, if close price is higher than the previous close
during 2 days and the meaning of 9-days Stochastic Slow Oscillator is lower than 50.
The strategy sells at market, if close price is lower than the previous close price
during 2 days and the meaning of 9-days Stochastic Fast Oscillator is higher than 50.
Second strategy
This indicator plots average of three different length CMO's. This indicator
was developed by Tushar Chande. A scientist, an inventor, and a respected
trading system developer, Mr. Chande developed the CMO to capture what he
calls "pure momentum". For more definitive information on the CMO and other
indicators we recommend the book The New Technical Trader by Tushar Chande
and Stanley Kroll.
The CMO is closely related to, yet unique from, other momentum oriented
indicators such as Relative Strength Index, Stochastic, Rate-of-Change, etc.
It is most closely related to Welles Wilder?s RSI, yet it differs in several ways:
- It uses data for both up days and down days in the numerator, thereby directly
measuring momentum;
- The calculations are applied on unsmoothed data. Therefore, short-term extreme
movements in price are not hidden. Once calculated, smoothing can be applied to
the CMO, if desired;
- The scale is bounded between +100 and -100, thereby allowing you to clearly see
changes in net momentum using the 0 level. The bounded scale also allows you to
conveniently compare values across different securities.
WARNING:
- For purpose educate only
- This script to change bars colors.
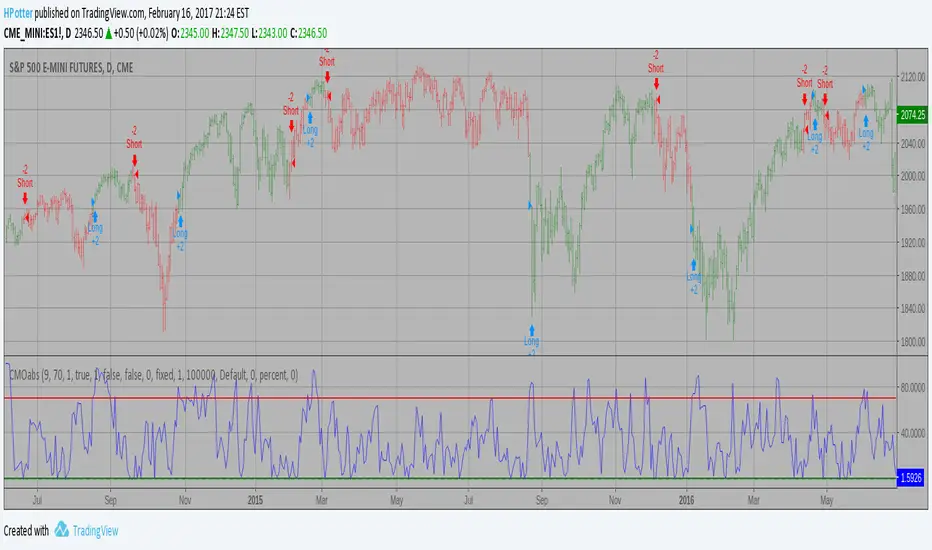
Combo Backtest 123 Reversal & CMOabsThis is combo strategies for get a cumulative signal.
First strategy
This System was created from the Book "How I Tripled My Money In The
Futures Market" by Ulf Jensen, Page 183. This is reverse type of strategies.
The strategy buys at market, if close price is higher than the previous close
during 2 days and the meaning of 9-days Stochastic Slow Oscillator is lower than 50.
The strategy sells at market, if close price is lower than the previous close price
during 2 days and the meaning of 9-days Stochastic Fast Oscillator is higher than 50.
Second strategy
This indicator plots the absolute value of CMO. CMO was developed by Tushar
Chande. A scientist, an inventor, and a respected trading system developer,
Mr. Chande developed the CMO to capture what he calls "pure momentum". For
more definitive information on the CMO and other indicators we recommend the
book The New Technical Trader by Tushar Chande and Stanley Kroll.
The CMO is closely related to, yet unique from, other momentum oriented indicators
such as Relative Strength Index, Stochastic, Rate-of-Change, etc. It is most closely
related to Welles Wilder`s RSI, yet it differs in several ways:
- It uses data for both up days and down days in the numerator, thereby directly
measuring momentum;
- The calculations are applied on unsmoothed data. Therefore, short-term extreme
movements in price are not hidden. Once calculated, smoothing can be applied to
the CMO, if desired;
- The scale is bounded between +100 and -100, thereby allowing you to clearly see
changes in net momentum using the 0 level. The bounded scale also allows you to
conveniently compare values across different securities.
WARNING:
- For purpose educate only
- This script to change bars colors.

Combo Backtest 123 Reversal & CMO & WMA This is combo strategies for get a cumulative signal.
First strategy
This System was created from the Book "How I Tripled My Money In The
Futures Market" by Ulf Jensen, Page 183. This is reverse type of strategies.
The strategy buys at market, if close price is higher than the previous close
during 2 days and the meaning of 9-days Stochastic Slow Oscillator is lower than 50.
The strategy sells at market, if close price is lower than the previous close price
during 2 days and the meaning of 9-days Stochastic Fast Oscillator is higher than 50.
Second strategy
This indicator plots Chande Momentum Oscillator and its WMA on the
same chart. This indicator plots the absolute value of CMO.
The CMO is closely related to, yet unique from, other momentum oriented
indicators such as Relative Strength Index, Stochastic, Rate-of-Change,
etc. It is most closely related to Welles Wilder?s RSI, yet it differs
in several ways:
- It uses data for both up days and down days in the numerator, thereby
directly measuring momentum;
- The calculations are applied on unsmoothed data. Therefore, short-term
extreme movements in price are not hidden. Once calculated, smoothing
can be applied to the CMO, if desired;
- The scale is bounded between +100 and -100, thereby allowing you to clearly
see changes in net momentum using the 0 level. The bounded scale also allows
you to conveniently compare values across different securities.
WARNING:
- For purpose educate only
- This script to change bars colors.

TRIX strategy (lirshah)TRIX is an indicator that combines trend with momentum. The triple smoothed moving average covers the trend, while the 1-period percentage change measures momentum. In this regard, TRIX is similar to MACD and PPO. The standard setting for TRIX is 15 for the triple smoothed EMA and 9 for the signal line.
this strategy gives signals according to TRIX plot movement and has good resaults on xbtusd,btcusd, ethusd ,and ...

CMO & WMA Backtest ver 2.0 This indicator plots Chandre Momentum Oscillator and its WMA on the
same chart. This indicator plots the absolute value of CMO.
The CMO is closely related to, yet unique from, other momentum oriented
indicators such as Relative Strength Index, Stochastic, Rate-of-Change,
etc. It is most closely related to Welles Wilder?s RSI, yet it differs
in several ways:
- It uses data for both up days and down days in the numerator, thereby
directly measuring momentum;
- The calculations are applied on unsmoothed data. Therefore, short-term
extreme movements in price are not hidden. Once calculated, smoothing
can be applied to the CMO, if desired;
- The scale is bounded between +100 and -100, thereby allowing you to clearly
see changes in net momentum using the 0 level. The bounded scale also allows
you to conveniently compare values across different securities.

CMOfilt BacktestThis indicator plots a CMO which ignores price changes which are less
than a threshold value. CMO was developed by Tushar Chande. A scientist,
an inventor, and a respected trading system developer, Mr. Chande developed
the CMO to capture what he calls "pure momentum". For more definitive
information on the CMO and other indicators we recommend the book The New
Technical Trader by Tushar Chande and Stanley Kroll.
The CMO is closely related to, yet unique from, other momentum oriented
indicators such as Relative Strength Index, Stochastic, Rate-of-Change, etc.
It is most closely related to Welles Wilder`s RSI, yet it differs in several ways:
- It uses data for both up days and down days in the numerator, thereby directly
measuring momentum;
- The calculations are applied on unsmoothed data. Therefore, short-term extreme
movements in price are not hidden. Once calculated, smoothing can be applied to the
CMO, if desired;
- The scale is bounded between +100 and -100, thereby allowing you to clearly see
changes in net momentum using the 0 level. The bounded scale also allows you to
conveniently compare values across different securities.
You can change long to short in the Input Settings
Please, use it only for learning or paper trading. Do not for real trading.

CMOabs Backtest This indicator plots the absolute value of CMO. CMO was developed by Tushar
Chande. A scientist, an inventor, and a respected trading system developer,
Mr. Chande developed the CMO to capture what he calls "pure momentum". For
more definitive information on the CMO and other indicators we recommend the
book The New Technical Trader by Tushar Chande and Stanley Kroll.
The CMO is closely related to, yet unique from, other momentum oriented indicators
such as Relative Strength Index, Stochastic, Rate-of-Change, etc. It is most closely
related to Welles Wilder`s RSI, yet it differs in several ways:
- It uses data for both up days and down days in the numerator, thereby directly
measuring momentum;
- The calculations are applied on unsmoothed data. Therefore, short-term extreme
movements in price are not hidden. Once calculated, smoothing can be applied to
the CMO, if desired;
- The scale is bounded between +100 and -100, thereby allowing you to clearly see
changes in net momentum using the 0 level. The bounded scale also allows you to
conveniently compare values across different securities.
You can change long to short in the Input Settings
Please, use it only for learning or paper trading. Do not for real trading.
CMO & WMA Backtest This indicator plots Chande Momentum Oscillator and its WMA on the
same chart. This indicator plots the absolute value of CMO.
The CMO is closely related to, yet unique from, other momentum oriented
indicators such as Relative Strength Index, Stochastic, Rate-of-Change,
etc. It is most closely related to Welles Wilder?s RSI, yet it differs
in several ways:
- It uses data for both up days and down days in the numerator, thereby
directly measuring momentum;
- The calculations are applied on unsmoothed data. Therefore, short-term
extreme movements in price are not hidden. Once calculated, smoothing
can be applied to the CMO, if desired;
- The scale is bounded between +100 and -100, thereby allowing you to clearly
see changes in net momentum using the 0 level. The bounded scale also allows
you to conveniently compare values across different securities.

Ergotic TSI Strategy Backtest r - Length of first EMA smoothing of 1 day momentum 4
s - Length of second EMA smoothing of 1 day smoothing 8
u- Length of third EMA smoothing of 1 day momentum 6
Length of EMA signal line 3
Source of Ergotic TSI Close
This is one of the techniques described by William Blau in his book "Momentum,
Direction and Divergence" (1995). If you like to learn more, we advise you to
read this book. His book focuses on three key aspects of trading: momentum,
direction and divergence. Blau, who was an electrical engineer before becoming
a trader, thoroughly examines the relationship between price and momentum in
step-by-step examples. From this grounding, he then looks at the deficiencies
in other oscillators and introduces some innovative techniques, including a
fresh twist on Stochastics. On directional issues, he analyzes the intricacies
of ADX and offers a unique approach to help define trending and non-trending periods.
You can use in the xPrice any series: Open, High, Low, Close, HL2, HLC3, OHLC4 and ect...
You can change long to short in the Input Settings
Please, use it only for learning or paper trading. Do not for real trading.

ORB Fusion Adaptive🎯 ORB Fusion Adaptive Strategy
Professional Opening Range Breakout Trading System
═══════════════════════════════════════════════════════════════════════════════
The first fully-automated, multi-instrument ORB strategy on TradingView.
💡 WHAT IT DOES:
Automatically trades Opening Range breakouts and failed breakout reversals with intelligent position sizing, professional risk management, and complete trade lifecycle tracking. Built for serious backtesting and live trading.
⚡ KEY FEATURES:
✓ Automated Entry & Exit (breakouts + reversals)
✓ Adaptive Position Sizing (3 modes: Fixed, Risk-Based, Risk-Based Initial)
✓ Multi-Instrument Support (Futures, Forex, Crypto, Stocks)
✓ Advanced Risk Management (daily limits, drawdown protection)
✓ ML-Powered Breakout Filtering (pContinue/pFail scoring)
✓ Failed Breakout Detection (high-probability reversals)
✓ Native Trailing Stops (Pine Script v5)
✓ Multi-Target Management (T1, T2, T3)
✓ Real-Time Performance Dashboard
✓ Comprehensive Backtesting (5+ years tested)
🎯 STRATEGY LOGIC:
Entry Signals
The strategy enters trades on two high-probability setups:
1. ORB Breakouts
• Detects when price breaks above/below Opening Range
• Confirms with volume (configurable threshold)
• ML filter scores probability of continuation
• Enters within 3 bars of breakout (no late entries)
• Stop placed at ORB midpoint or ATR-based
• Targets at Fibonacci extensions (1.0x, 1.618x, 2.5x ORB range)
2. Failed Breakout Reversals
• Monitors for breakouts that fail and reverse
• Confirms failure after price returns inside ORB
• Automatic reversal entry with tight stops
• Three profit targets (0.5x, 1.0x, 1.5x ORB range)
• Historical 65-75% win rate on reversals
Exit Management
• Stop Loss: Multiple methods (ATR, ORB Mid, ORB Opposite, Hybrid)
• Native Trailing Stop: Activates after configurable R-multiple profit
• Profit Targets: Single target or scaled exits at T1/T2/T3
• Daily Stop: Halts trading after max daily loss
• Drawdown Protection: Circuit breaker at max drawdown threshold
🔧 ADAPTIVE POSITION SIZING:
The strategy's most powerful feature - intelligent position sizing that adapts to your instrument and account:
Mode 1: Fixed
• Simple contract/lot size
• Best for: Testing, stable position sizing
• Use case: "Always trade 2 contracts"
Mode 2: Risk-Based (Current Equity)
• Size = (Current Equity × Risk%) / (Stop Distance × Point Value)
• Compounds with wins, reduces with losses
• Best for: Aggressive compounding
• Use case: Maximize geometric growth
Mode 3: Risk-Based (Initial Capital)
• Size = (Initial Capital × Risk%) / (Stop Distance × Point Value)
• No compounding - consistent risk exposure
• Best for: Professional risk management
• Use case: Live trading with stable risk
Multi-Instrument Intelligence
Auto-detects and calculates correctly for:
• Futures: Uses contract point value (ES $50/pt, NQ $20/pt, MES $5/pt, MNQ $2/pt)
• Forex: Uses pip value per lot (Standard/Mini/Micro/Nano)
• Crypto: Uses contract multiplier (1.0 BTC, 0.001 BTC, etc)
• Stocks: Uses $1 per share
Manual override available if auto-detect fails.
📊 RISK MANAGEMENT:
Multi-Layer Protection
• Per-Trade Risk: 0.5-2% of capital (configurable)
• Daily Risk Limit: Max 4% loss per day (halts trading)
• Max Drawdown Pause: Circuit breaker at 12% drawdown
• Position Size Limits: Min/max contracts enforced
• Max Stop Distance: ATR-based hard limit (prevents catastrophic losses)
Trailing Stop System
• Uses Pine Script's native trail_price and trail_offset
• Activates after configurable R-multiple profit (default 0.5R)
• Trail distance: ATR-based (tight 0.5 ATR to loose 2.0 ATR)
• Works reliably in backtesting AND live trading
• No manual stop management needed
🌍 GLOBAL MARKET SUPPORT:
Configurable Sessions
Unlike basic ORB indicators, this strategy works globally:
• US Equities: 9:30 AM ET default
• Forex London: Custom session 08:00-08:30 GMT
• Forex NY: Custom session 13:30-14:00 GMT
• Asian Markets: Custom session with Tokyo timezone
• Crypto: 24/7 support with custom ORB windows
Timezone support includes:
America/New_York, Europe/London, Asia/Tokyo, Asia/Hong_Kong, UTC, and more.
Session ORBs
• Asian Session ORB (Tokyo open)
• London Session ORB (Forex primary)
• NY Session ORB (US market hours)
Critical for Forex traders working multiple sessions.
📈 BACKTESTING CAPABILITIES:
Realistic Simulation
• Commission: Configurable (default $1 per order)
• Slippage: 2 ticks default (adjustable)
• Volume Confirmation: Prevents unrealistic fills
• RTH Filtering: Optional Regular Trading Hours only
• Bar Magnifier: Improved intrabar execution
Performance Metrics Dashboard
Real-time statistics displayed:
• Total Trades & Win Rate
• Net P&L & Profit Factor
• Current Drawdown
• Daily P&L tracking
• Position details (if in trade)
• Position sizing mode & current size
Historical Testing
• Supports 5000+ bars of history
• Test across multiple market conditions
• Bull markets, bear markets, range-bound periods
• Optimize by day type (trend vs rotation)
🎛️ CUSTOMIZATION OPTIONS:
ORB Settings
• Timeframe: 5, 15, 30, or 60 minutes
• Confirmation: Close, Wick, or Body
• Volume: On/off with multiplier threshold
• LTF Precision: Sub-minute high/low detection
• RTH Filter: Regular Trading Hours only option
Breakout Detection
• ML Filtering: Enable/disable with thresholds
• Failed Breakout: Sensitivity (2-10 bars)
• Failure Buffer: ATR-based confirmation
• Entry Window: Bars after signal (prevents late entries)
Stop Methods
• ATR: Tight dynamic stops (recommended)
• ORB Mid: Structural stop at midpoint
• ORB Opposite: Wide stop at opposite boundary
• Hybrid: Best of ATR and structural
Target Methods
• Single: One target, full exit
• Scaled: Partial exits at T1/T2/T3 (recommended)
• Trail Only: No fixed targets, trail to exit
🔬 OPTIMIZATION GUIDE:
For Futures (ES, NQ, MNQ, MES)
• ORB: 30 min
• Confirmation: Close
• Volume: ON (1.5x)
• Stop Method: ATR (1.0x multiplier)
• Position Mode: Risk-Based (Initial)
• Risk Per Trade: 1.5%
• Failed Breakouts: ENABLE
For Forex Majors
• ORB: 60 min (or 15 min at London open)
• Confirmation: Close
• Volume: OFF (tick volume unreliable)
• Stop Method: ATR (1.5x multiplier)
• Position Mode: Risk-Based (Initial)
• Risk Per Trade: 1.0%
• Custom Session: 0800-0900 GMT
• Timezone: Europe/London
For Crypto (BTC, ETH)
• ORB: 60 min
• Confirmation: Close
• Volume: OFF or ON (1.2x)
• Stop Method: ATR (2.0x wider stops)
• Position Mode: Fixed or Risk-Based
• Risk Per Trade: 2.0% (higher volatility)
• Custom Session: Define your preferred window
For Stocks/ETF
• ORB: 15-30 min
• Confirmation: Body (most conservative)
• Volume: ON (2.0x threshold)
• Stop Method: Hybrid
• Position Mode: Risk-Based (Initial)
• Risk Per Trade: 1.0%
• RTH Only: ENABLED
• Gap Analysis: ENABLED
💎 ADVANCED FEATURES:
Initial Balance Analysis
• First hour range tracking (A + B periods)
• IB extensions at 0.5x, 1.0x, 1.5x, 2.0x
• Day type classification (Trend/Normal/Rotation)
• Adjusts strategy behavior by day type
ORB Extensions
• Fibonacci targets: 1.272x, 1.5x, 1.618x, 2.0x, 2.618x, 3.0x
• Dynamic monitoring for take-profit zones
• Extension tracking in statistics
VWAP Integration
• Institutional benchmark reference
• Standard deviation bands (1σ and 2σ)
• Breakout alignment scoring
• Context for trade quality
Gap Analysis
• Overnight gap detection
• Gap fill target projection
• Gap fill rate statistics
• Direction bias from gap type
Comprehensive Statistics
• Bull/Bear breakout win rates
• Reversal win rate (typically 65-75%)
• Day type distribution
• Extension statistics
• Gap fill rate
• Real-time performance tracking
🎨 VISUAL FEEDBACK:
Enhanced Plots
• ORB levels (High/Low/Mid continuous lines)
• Entry markers (L for long, S for short, 🔥 for reversals)
• Extension levels with labels
• Session ORBs (Asian/London/NY)
• IB levels and extensions
• VWAP with bands
• Failed breakout markers
Color-Coded Momentum Boxes
• Blue: Inside ORB (consolidation)
• Green: Above ORB (bullish momentum)
• Red: Below ORB (bearish momentum)
• Orange: Failed breakout zones
• Variable intensity based on distance
Dynamic Dashboards
• Main Dashboard: ORB status, breakout info, setup details, market context
• Strategy Dashboard: Trades, Win%, P&L, Profit Factor, Daily P&L, Drawdown, Position info
• Narrative Dashboard: Plain-language market interpretation
Three Display Modes
• Simple: Clean chart, essential ORB only
• Standard: ORB + IB + Sessions + VWAP (recommended)
• Advanced: All features + statistics
🔔 ALERT SYSTEM:
Strategy Alerts
• Breakout Entry (with ML probabilities)
• Failed Breakout Entry (with targets)
• Stop Hit (position closed)
• Target Hit (T1, T2, T3 partials)
• Extension Reached (profit zone)
• IB Break (potential trend day)
All alerts include:
• Direction and setup type
• Entry price and position size
• Stop and target levels
• ML scores (if enabled)
• Setup grade (A+ to D)
• Win rate context
⏱️ TIMEFRAMES: 1m-15m optimal (works on all)
💎 INSTRUMENTS: Futures, Forex, Crypto, Stocks, Indices
🎓 SKILL LEVEL: Intermediate to Advanced
📚 WHAT'S INCLUDED:
Comprehensive Documentation
• 200+ lines of detailed tooltips
• Every setting fully explained
• Optimization guides by market
• Position sizing calculator explanations
• Risk management framework
• Best practices and common pitfalls
Ready-to-Use Configurations
• Default settings optimized for ES/NQ
• Recommended settings for each instrument type
• Conservative vs Aggressive profiles
• Scalping vs Swing configurations
Full Transparency
• All calculations shown in dashboard
• Position sizing visible in real-time
• Strategy performance metrics live
• No black boxes or hidden logic
🚨 RISK DISCLAIMERS:
CRITICAL INFORMATION - PLEASE READ:
• This is a trading strategy that executes real trades in backtesting
• Past performance does NOT guarantee future results
• All trading involves substantial risk of loss
• Never risk money you cannot afford to lose
• This is NOT financial advice - for educational purposes only
• Requires understanding of ORB methodology and risk management
• Test thoroughly on paper/demo account before live trading
• Position sizing must be configured correctly for your account
• Stop losses are NOT guaranteed in all market conditions
• Slippage and commissions will affect live results
• Volatile markets may trigger circuit breakers (drawdown pause)
Strategy-Specific Risks:
• Opening range breakouts can fail (hence the reversal system)
• Volume confirmation may limit signals in low-volume instruments
• Custom sessions must match your market's actual hours
• Multi-instrument support requires correct point value configuration
• Trailing stops may exit early in volatile conditions
• Daily limits may prevent recovery trades
• Backtesting results may not match live execution
Position Sizing Warnings:
• Risk-Based modes can size large positions if stops are tight
• Always set max position size limits appropriate for your account
• Verify point values are correct for your instrument
• Test with small size first
• Monitor position size in dashboard before every trade
🎓 WHO THIS IS FOR:
Best Suited For:
• Traders with ORB methodology knowledge
• Those seeking a fully-automated system
• Backtesting enthusiasts
• Multi-instrument traders
• Risk-conscious systematic traders
• Traders who understand position sizing
Not Recommended For:
• Complete beginners to trading
• Those seeking "set and forget" with zero monitoring
• Traders unwilling to backtest first
• Those who don't understand risk management
• Accounts under $5,000 (position sizing too small)
💡 PRO TIPS:
Backtesting Best Practices
• Start with 2+ years of data
• Include both bull and bear markets
• Test on same timeframe you'll trade (5-min for 5-min ORB)
• Account for commissions/slippage realistically
• Verify win rate >45% and profit factor >1.3
Position Sizing
• Use Risk-Based (Initial Capital) for most consistent results
• Start with 1% risk per trade, increase to 1.5-2% if comfortable
• Set max position size to prevent oversizing
• Verify point values are correct before live trading
• Monitor dashboard for actual size before each trade
Risk Management
• NEVER disable daily loss limit
• Keep max drawdown pause at 12% or lower
• Use ATR stop method for best R:R
• Enable trailing stops for trend capturing
• Take partial profits at T1 (at least 30-40%)
Failed Breakout Trading
• These are your highest win-rate setups (65-75%)
• Always enable this feature
• Use tighter stops on reversals than breakouts
• Don't chase if you miss the entry window
• Three targets allow you to scale out profitably
ML Filtering
• Dramatically improves breakout quality
• Reduce signals but increase win rate
• Start with default thresholds (pCont≥0.55, pFail≤0.35)
• Lower signals = higher quality in choppy markets
• Can disable for more signals in strong trends
⚙️ TECHNICAL DETAILS:
Strategy Engine
• Pine Script v5
• Native strategy.entry() and strategy.exit()
• Trailing stops use trail_price/trail_offset (no repainting)
• Proper position sizing with strategy.position_size
• Realistic fills with commission and slippage
• Bar magnifier for improved intrabar execution
Performance
• Optimized for 1-minute to 15-minute charts
• Supports 5000+ bars of history
• Efficient calculations (no arrays in hot loops)
• Max 500 visual objects (boxes/lines/labels)
• No repainting - all signals confirmed on bar close
Position Sizing Engine
• Auto-detects Futures, Forex, Crypto, Stocks
• Uses syminfo.pointvalue when available
• Falls back to manual configuration
• Proper rounding to exchange increments
• Min/max limits enforced
Risk System
• Per-trade risk percentage enforced
• Daily P&L tracking
• Drawdown from peak equity
• Circuit breakers halt trading when limits hit
• Resets daily for fresh start
🔄 VERSION HISTORY:
Current Version: 1.0 (Initial Release)
• Complete ORB breakout + reversal strategy
• Adaptive position sizing (3 modes)
• Multi-instrument support
• Advanced risk management
• Native trailing stops
• ML filtering integration
• Comprehensive backtesting
• Real-time performance dashboard
Planned Updates:
• Additional session templates (Tokyo, Sydney)
• More stop methods
• Enhanced ML model training
• Volatility regime detection
• Trade journal export
═══════════════════════════════════════════════════════════════════════════════
Trade the opening range with institutional precision.
Automated entries. Intelligent sizing. Professional risk management.
Test first. Trade smart. Scale safely.
Taking you to school. — Dskyz, Trade with insight. Trade with anticipation.

ParetoCapital AlogrithmThis strategy is a volatility-based breakout system designed to trade only when the market shows sufficient expansion and directional clarity.
It operates by:
Filtering market regime using a long-term trend reference to avoid trading against dominant momentum.
Activating only during elevated volatility, ensuring trades are taken when price movement has enough energy to justify risk.
Entering via breakout orders, not market orders, so trades are triggered only if price confirms continuation.
Applying strict risk control, with capital usage and risk capped per trade.
Separating backtest logic from live execution, using fixed external order sizing for consistency in automation.
The strategy is intended for systematic, automated execution and avoids overtrading by remaining inactive during low-volatility or unclear market conditions.

Trend Pulse Channel StrategyOverview
Trend Pulse Channel Strategy is a long-only trend-following breakout strategy built around an adaptive multi-pole smoothing filter and a volatility-adjusted price channel.
The strategy is designed to participate in sustained directional moves by entering only when price confirms momentum strength beyond a dynamic upper boundary, while avoiding mean-reversion and low-quality consolidation phases.
This script is published as a strategy and includes realistic backtesting assumptions for position sizing, commissions, and slippage.
Core Concept
At the heart of the strategy is a multi-pole adaptive EMA-based filter, inspired by advanced digital signal smoothing techniques.
Using multiple poles allows the filter to reduce noise while preserving responsiveness to genuine trend changes.
To adapt the channel width to changing market conditions, the strategy applies the same filtering logic to True Range, producing a volatility-aware envelope rather than a static or fixed-percentage band.
This combination allows the strategy to:
Track directional bias using a smoothed central filter
Adjust channel width dynamically based on market volatility
Trigger entries only when price expansion confirms trend strength
Entry Logic
A long position is opened when:
Price crosses above the upper channel band
The signal occurs within the user-defined date range
This condition represents a volatility-confirmed breakout aligned with the prevailing directional filter.
Exit Logic
The long position is closed when:
Price crosses back below the upper band
This exit logic aims to stay in trending moves while exiting when upside momentum weakens.
The strategy does not open short positions by design.
Inputs and Defaults
The default inputs are selected to balance smoothness, responsiveness, and stability:
Source (HLC3): Reduces single-price noise by averaging high, low, and close
Period (144): Defines the primary smoothing horizon of the adaptive filter
Poles (4): Controls the smoothness vs. responsiveness trade-off
Range Multiplier (1.414): Scales the volatility envelope using filtered True Range
Reduced Lag (optional): Applies lag compensation to improve responsiveness
Fast Response (optional): Blends multi-pole and single-pole filters for quicker reaction at the cost of smoothness
All inputs are fully configurable and can be adjusted to suit different instruments and timeframes.
Risk Management & Position Sizing
The strategy uses:
Position size: 10% of equity per trade
No pyramiding
Long positions only
This sizing approach is intended to reflect sustainable risk exposure rather than aggressive capital deployment. Users may further adjust position size based on their own risk tolerance.
Backtesting Assumptions
The strategy is tested using :
Initial capital: 10,000
Commission: 0.1%
Slippage: 1 tick
Order fill model: Standard OHLC
These settings are chosen to provide more realistic performance estimates compared to idealized backtests.
This strategy is best suited for :
Trend-oriented markets
Higher timeframes where breakouts are more reliable
Users seeking systematic trend participation rather than frequent scalping
In sideways or range-bound market conditions, price may cross the channel boundaries frequently.
This can result in a higher number of entry and exit signals that do not develop into sustained trends.
For this reason, the strategy should be used with an understanding of basic technical analysis concepts, including market structure, trend identification, and consolidation behavior.
It is intended as a decision-support tool, not a standalone trading system.
Users—whether beginners or experienced traders—should avoid relying solely on this strategy and are encouraged to combine it with broader market context and additional analysis methods.
Disclaimer
This script is provided for educational and analytical purposes only. It does not constitute financial advice. Past performance does not guarantee future results.

9 EMA Trend-Flow StrategyThis strategy avoids trading inside the noise and waits for Bitcoin to "coil up" before exploding.
1. Chart Setup
Timeframe: 5 Minutes
Bollinger Bands: Length 20, Standard Deviation 2 (Default).
RSI (Relative Strength Index): Length 14.
EMA (Exponential Moving Average): Length 200 (Trend Filter).
2. The Rules
Long Setup (Buy)
The Trend Filter: Price must be above the 200 EMA.
The Squeeze: The Bollinger Bands must visually contract (narrow), indicating volatility is dying down.
The Trigger: A 5m candle closes strongly above the Upper Bollinger Band.
Confirmation: RSI must be rising and above 50 (but ideally not yet "pegged" at 90+).
Short Setup (Sell)
The Trend Filter: Price must be below the 200 EMA.
The Squeeze: The Bollinger Bands contract.
The Trigger: A 5m candle closes strongly below the Lower Bollinger Band.
Confirmation: RSI must be falling and below 50.
Execution Guide
Entry Technique
Don't enter immediately when the candle touches the band. Wait for the candle close.
Why? Bitcoin frequently "wicks" through bands to trap traders (fakeouts) before reversing. A solid close outside the band confirms momentum.
Exit Strategy (Take Profit)
Target 1 (Conservative): Close 50% of the position when price expands to a fixed risk-reward ratio (e.g., 1.5R).
Target 2 (Runner): Keep the remaining position open as long as price "walks the band" (stays outside or touching the outer band). Close the rest when a candle finally closes back inside the Bollinger Bands.
Stop Loss
Placement: Place your Stop Loss (SL) slightly below the Middle Band (the 20 SMA) at the time of entry.
Trailing: As the price moves in your favor, move your SL to trail the Middle Band.

Intraday Options/Futures Naked By TradeEarnIntraday Momentum Strategy (Futures & Options)
Description: This is a specialized Intraday Momentum system designed for Indian Indices Nifty, BankNifty, FinNifty, Sensex and Crude Oil. It is engineered to simplify the automation process by standardizing quantity management for single-leg execution via third-party bridges.
Originality & Utility: Unlike standard momentum strategies, this script solves the complexity of position sizing across different asset classes. It features a custom "Smart Quantity" engine that automatically differentiates between Futures (Raw Quantity) and Index Options (Lot Multipliers), allowing traders to switch instruments without manually calculating order sizes.
Key Features:
Dual Mode: Supports both Futures (Long/Short) and Options Buying (Long CE / Long PE).
Smart Quantity Logic:
Futures/Crude: Inputs are treated as raw quantity (e.g., 1 Lot = 1 Qty).
Index Options: Inputs are automatically multiplied by the standard market lot size (e.g., 1 Lot Nifty = 25 Qty).
Rupee-Based Risk: Target, Stop Loss, and Trailing SL are defined in absolute Rupees (INR) rather than percentages, offering precise P&L control.
Choppiness Filter: Combines RSI and ADX to filter out low-volatility ranges.
Entry Logic:
Buy Signal: Green Impulse Candle + RSI > 55 + ADX > 20
Sell Signal: Red Impulse Candle + RSI < 45 + ADX > 20
Strategy Settings & Backtesting:
Commission: The strategy is backtested with a commission of ₹20 per order to reflect realistic net P&L.
Slippage: Users should account for realistic slippage in live trading, which is not factored into the script's hard values.
⚠️ Disclaimer & Statutory Warning
Strictly for Educational & Backtesting Purposes
1. SEBI Registration Status: The author of this script/strategy is NOT a SEBI registered Research Analyst (RA) or Investment Advisor (IA). This tool is provided solely to assist in backtesting logic and educational analysis. It does not constitute a recommendation to buy, sell, or hold any securities.
2. Market Risk: Investment in the securities market, particularly in Derivatives (Futures & Options), is subject to market risks. You may lose your entire capital. Please read all related scheme documents carefully before investing.
3. No Guarantees: Past performance of this algorithm (as shown in backtest results) is not indicative of future performance. Market conditions change, and slippage or execution errors can occur during live trading.
4. User Responsibility: By using this script, you acknowledge that you are solely responsible for your own trading decisions and financial losses. You are advised to consult a SEBI-registered financial advisor before deploying real capital. This script is intended for manual or semi-automated analysis and may not be compliant with high-frequency trading (HFT) regulations.

Candlestick Pattern Strategy with Risk Management + AlertsThis strategy is built to detect volatility-driven squeeze expansion moves and automatically backtest both Breakout Longs and Breakdown Shorts with adjustable take-profit, stop-loss and volume confirmation filters.
It includes a built-in Auto-Optimizer, allowing the script to test multiple TP/SL/RSI/Volume profiles and automatically select the best configuration for the current market environment. Works across Stocks, Crypto and Forex — with each market automatically adjusting core system parameters.
🚀 Strategy Features
Feature Description
🔥 Long + Short Squeeze Detection Entries triggered by volatility expansion + BB break + strong momentum
⚙️ Auto-Optimizer Searches multiple TP/SL/RSI/Volume settings & selects best performer
📈 Full Backtest-Ready Strategy Includes stops, take profits + built-in performance table
🔔 Real-Time Alerts Get alerted instantly when a long or short squeeze event forms
🔄 Multi-Market Mode Tailored volatility & smoothing settings for Stocks / Crypto / Forex
🧠 Vol Spike Validation Filters signals using relative volume impulse
🏁 Trade Exit Logic Dynamic SL/TP calculated automatically based on optimized parameters
📊 How It Works
Detects breakouts above upper Bollinger band or breakdowns below lower band
Confirms strength using ATR expansion + Volume Surge
Confirms momentum using RSI selection (9/14/20 based on profile)
Enters Long/Short squeeze trade depending on breakout direction
Risk management automatically deploys TP + SL, optimized or manual
Displays performance statistics after backtest execution
🧬 Auto-Optimizer Logic
If Optimizer Mode = ON, the script tests:
Variable Range Tested
TP % 8 → 15%
SL % 4 → 8%
Volume Spike Filter 1.5 → 3.0x
RSI Window 9 / 14 / 20
The configuration that produces the highest score becomes active automatically for signals + backtest.
🛎 Alerts Included
🔥 Long Squeeze Alert
💀 Short Squeeze Alert
You can create TradingView alerts using → Add Alert → ANY alert() function call
Recommended Use
✔ Backtest system performance across assets
✔ Use Optimizer mode to find ideal TP/SL profiles
✔ Enable alerts for real-time squeeze entries
✔ Works best on 1h / 4h / 1D timeframes
🚫 Not financial advice — for research + strategy development only

Monthly DI+ & RSI StrategyOverview This strategy is designed to capture significant trend reversals and continuations on the Monthly timeframe. It combines the trend-following capability of the Directional Movement Index (DMI) with the fast momentum detection of RSI (Period 6).
Core Logic The strategy triggers a long position based on a dual-confirmation system. It looks for a specific "handshake" between Trend (DI) and Momentum (RSI).
Entry Conditions (OR Logic) A Buy signal is generated if EITHER of the following occurs:
Trend Trigger: DI+ crosses over DI- (while RSI is already bullish, trading above its SMA).
Momentum Trigger: RSI(6) crosses over RSI SMA(14) (while the trend is already bullish, with DI+ > DI-).
Exit Condition (Stop Loss)
Trend Reversal: The position is closed immediately if DI- crosses over DI+, indicating the bullish trend has been invalidated.
Default Settings
Timeframe: Optimized for 1M (Monthly) charts.
RSI: Length 6
RSI SMA: Length 14
DMI: Length 14 / Smoothing 14
Risk Warning This script is for educational purposes only. Past performance does not guarantee future results. Always backtest on your specific asset classes before trading.

Daily Open Shift The "Daily Open Shift" System (V2.0)
1. The Setup (Indicators & Timeframe)
• Timeframe: 15-Minute Chart (Execution).
• Key Levels: Daily Open (DO) or New York Open (NYO).
• Trend Indicators:
o 24 & 42 EMA Ribbon (Exponential Moving Averages).
o 30-Minute Supertrend.
________________________________________
2. Phase 1: Establish The Bias (The Filter)
This is the V2 upgrade. We do not trade against the day's opening momentum.
1. Mark the Open: Draw a horizontal line at the Daily Open (00:00) or Session Open.
2. The "First 2H" Rule: Observe the price action for the first 2 hours after the open.
o First 2H are Green/Bullish? → You are LONG BIAS only for the rest of the session. (Ignore all sell signals).
o First 2H are Red/Bearish? → You are SHORT BIAS only for the rest of the session. (Ignore all buy signals).
________________________________________
3. Phase 2: The Signal (The Switch)
Wait for the chart to confirm your bias technically.
1. The Switch: Price must cross and close a 15M candle on the correct side of the Daily Open.
o Longs: Price switches from below to above DO.
o Shorts: Price switches from above to below DO.
2. Indicator Confluence:
o EMAs: Must be crossed in your direction (Green for Long, Red for Short).
o 30M Supertrend: Must match your direction.
________________________________________
4. Phase 3: The Entry (The Trigger)
We never chase the breakdown. We wait for the price to come to us.
1. The Pullback: Wait for the price to retrace and touch/wick into the 24/42 EMA Ribbon.
2. The Confirmation: Watch the candle that touches the EMA.
o It must reject the EMA (wick off it) and close respecting the trend.
o Do not enter if the candle closes forcefully through the EMA, breaking structure.
3. Execution: Enter Market Order immediately on that candle close.
________________________________________
5. Phase 4: Risk Management (The Math)
This is the V2 upgrade. We aim for higher profitability.
1. Stop Loss (SL):
o Longs: Placed strictly below the lowest EMA band.
o Shorts: Placed strictly above the highest EMA band.
o Logic: If price crosses the EMA band completely, the trend is dead. Get out.
2. Take Profit (TP):
o FIXED 3R (Reward = 3x Risk).
o Example: If Risk is $100, TP is set to make $300.
o Rule: Do not move the TP. Do not close early. Let the math play out.
________________________________________
Summary Checklist (Print This)
Time: Is the First 2H bias clear? (Green=Buy / Red=Sell)
Switch: Did price close above/below the Daily Open?
Trend: Are EMAs crossed and Supertrend agreeing?
Patience: Did I wait for the price to pull back to the EMA band?
Trigger: Did the candle close respecting the EMA?
Execution: Market Entry + Stop Loss behind EMA + Fixed 3R Target.
Mindset: Am I at "2/10" emotion? Set the trade and walk away.

Quantum X StrategyQuantum X Strategy is a structured market-behavior based trading model developed for Midcap Nifty on the 15-minute timeframe.
It focuses on identifying directional strength, momentum alignment, and price participation using a multi-factor confirmation approach.
Rather than relying on a single indicator, the strategy evaluates multiple dimensions of price movement to determine whether the market environment is favorable for participation. This helps in avoiding random entries during low-quality or sideways conditions.
🔍 Conceptual Framework
The strategy dynamically observes:
Momentum expansion and contraction
Trend participation strength
Directional consistency over recent price action
Each market condition contributes to an internal decision process, allowing trades only when sufficient alignment is present. This approach helps filter out noise and improves trade selectivity.
📊 Trade Execution Philosophy
Trades are initiated only when market structure shows clear directional intent
Both bullish and bearish opportunities are evaluated independently
Positions are exited when momentum balance weakens or returns to a neutral state
No over-trading during indecisive phases
The system is designed to stay inactive during uncertain market conditions, which is a key part of its risk-aware behavior.
🕒 Backtesting Scope
For consistency and reliability, the strategy logic is activated only from January 2024 onward, ensuring analysis is focused on recent market behavior rather than outdated volatility patterns.
⚙️ Usage Guidelines
Instrument: MIDCAPNIFTY
Timeframe: 15 Minutes
Suitable for intraday and short-term positional observation
Works best when combined with disciplined risk management
⚠️ Disclaimer
This strategy is provided strictly for educational and research purposes.
Market conditions change, and past performance does not guarantee future results. Users should always forward-test and apply their own risk management before live use.
