RSI Divergence[UgurTash] – Real-Time📈 RSI Divergence – Real-Time, Adaptive, and Intelligent RSI Divergence Detection
🚀 What Does This Indicator Do?
RSI Divergence is a real-time divergence detection tool that helps traders identify bullish and bearish divergences between price and the Relative Strength Index (RSI). Unlike traditional RSI-based indicators, this script offers:
✅ Real-time detection – No need to wait for bar closes or repainting.
✅ Dynamic time-frame adaptation – The script automatically adjusts RSI settings based on the selected chart time frame.
✅ Multi-layered divergence analysis – Supports short-term, medium-term, and long-term divergence detection with an optional all-term mode that dynamically selects the best configuration.
🛠 How Does It Work?
Pivot-Based Divergence Detection:
The script analyzes pivot points on both price and RSI to determine valid divergences.
Bullish divergence occurs when price forms a lower low but RSI trends higher, indicating potential upward momentum.
Bearish divergence occurs when price forms a higher high but RSI trends lower, signaling possible weakness.
Adaptive RSI Calculation:
The RSI length is dynamically adjusted based on the chosen time frame:
Short-Term: RSI (7) for 1-5 min charts.
Medium-Term: RSI (14) for 15-60 min charts.
Long-Term: RSI (28) for 4H+ charts.
In All-Term Mode, the script automatically determines the best RSI length based on the active chart timeframe.
Smart Visualization & Alerts:
Bullish divergences are marked with green lines & labels.
Bearish divergences are highlighted in red.
Users can customize symbol size, divergence labels, and colors.
Instant alerts notify traders as soon as a divergence is detected.
🎯 How to Use This Indicator?
📌 For Trend Reversals: Look for bullish divergences at key support levels and bearish divergences at resistance zones.
📌 For Trend Continuation: Combine divergence signals with moving averages, volume analysis, or price action strategies to confirm trades.
📌 For Scalping & Swing Trading: Adjust the time-frame settings to match your trading style.
🏆 What Makes This Indicator Original?
🔹 Unlike standard RSI divergence indicators, this script features real-time analysis with no repainting, allowing for instant trading decisions.
🔹 The time-frame adaptive RSI makes it dynamic and suitable for any market condition.
🔹 The multi-term divergence detection offers flexibility, giving traders a precise view of both short-term & long-term market structure.
⚠ Note: No indicator guarantees 100% accuracy. Always use additional confirmations and sound risk management strategies.
If you find this tool useful, don’t forget to support & share! 🚀
스크립트에서 "market structure"에 대해 찾기

PRC-ALMA | QuantEdgeBIntroducing PRC-ALMA by QuantEdgeB
Overview
The PRC-ALMA (Percentile Adaptive ALMA) is an advanced dynamic trend and volatility filtering indicator that leverages the Arnaud Legoux Moving Average (ALMA) combined with Percentile Rank Filtering and Median Absolute Deviation (MAD) Bands. It is designed to enhance market structure clarity, detect breakout zones, and provide trade signals by dynamically adjusting its filtering based on recent price action.
____
Key Features
1. 📈 Adaptive ALMA Smoothing:
- Uses ALMA for smoothing price action while reducing lag.
- Provides a more responsive moving average than traditional EMAs and SMAs.
2. 📊 Percentile Rank-Based Thresholds:
- Determines upper and lower regions using 75th and 25th percentile ranks.
- Allows for adaptive thresholding based on historical price movements.
3. 🎯 Median Absolute Deviation (MAD) Volatility Filtering:
- Filters out noise using robust statistical deviation measures.
- MAD Bands dynamically adjust based on volatility expansion and contraction.
4. 🔄 Dynamic Trade Signals:
- Generates long signals when price exceeds the upper threshold.
- Generates short signals when price drops below the lower threshold.
5. 🎨 Customizable Color Modes & Visual Enhancements:
- Choose between multiple color schemes to match trading preferences.
- Optional candlestick coloring to indicate market sentiment shifts.
____
How It Works
1. ALMA Calculation:
- The indicator starts by computing the ALMA (Arnaud Legoux Moving Average) with a customizable length, offset, and sigma.
2. Percentile Rank Filtering:
- It then calculates the 75th and 25th percentile ranks over a selected period, determining dynamic levels for trend identification.
3. Volatility Adjustment Using Median Absolute Deviation (MAD):
- MAD is applied to filter noise and adapt the upper/lower bands based on market volatility.
- The higher the MAD multiplier, the wider the bands, allowing more price fluctuations before a signal triggers.
4. Entry & Exit Conditions:
- Long Entry: When price crosses above the upper percentile band + MAD filter.
- Short Entry: When price crosses below the lower percentile band - MAD filter.
5. Visual Enhancements:
- Dynamic band plotting with shading between percentile ranks.
- Candlestick coloring to visually indicate long/short sentiment shifts.
____
Practical Applications
✅ Trend Following & Momentum Trading – Uses ALMA for trend smoothing and percentile-based breakouts.
✅ Mean Reversion Strategies – Adaptive MAD filtering ensures only significant deviations trigger signals.
✅ Multi-Timeframe Trading – Works on intraday, daily, and weekly timeframes based on user customization.
✅ Noise Reduction – Eliminates minor fluctuations while capturing meaningful market moves.
____
🛠 Settings
-ALMA Length: 24 – Defines the smoothing period for the Arnaud Legoux Moving Average.
-ALMA Offset: 0.7 – Adjusts the shift factor, controlling responsiveness.
-ALMA Sigma: 4 – Determines the smoothing strength, balancing trend-following and noise reduction.
-Percentile Length: 21 – Lookback period for calculating percentile rank levels.
-Median Period: 21 – The period used for the Median Absolute Deviation (MAD) filter.
-Median Multiplier: 1.8 – Adjusts the sensitivity of the MAD filter, impacting how signals are generated.
-Color Mode: Strategy – Various visual themes available for better chart readability.
-Signal Label: Off - If turned off the indicator produced a Long or Cash signal when the trend changes.
📌 Conclusion
The PRC-ALMA | QuantEdgeB is an advanced valuation and signal generation tool that dynamically adjusts based on market conditions. By combining ALMA for trend smoothing, percentile rank thresholds, and MAD-based volatility filtering, it provides traders with a versatile indicator for momentum, breakout, and mean reversion strategies.
Key Takeaways:
✔ Smooth & Adaptive – ALMA ensures minimal lag while maintaining trend responsiveness.
✔ Dynamic Overbought/Oversold Zones – Adjusts to real-time market conditions using percentile-based bands.
✔ Volatility-Aware Filtering – Uses MAD to eliminate market noise, making signals more reliable.
✔ Customizable & Multi-Timeframe Ready – Works on various asset classes and timeframes with adjustable settings.
🔹 Disclaimer: Past performance is not indicative of future results. No trading strategy can guarantee success in financial markets.
🔹 Strategic Advice: Always backtest, optimize, and align parameters with your trading objectives and risk tolerance before live trading.

Liquidity Sweep Filter [AlgoAlpha]Unlock a deeper understanding of market liquidity with the Liquidity Sweep Filter by AlgoAlpha. This indicator identifies liquidity sweeps, highlighting key price levels where large liquidations have occurred. By visualizing major and minor liquidation events, traders can better anticipate potential reversals and market structure shifts, making this an essential tool for those trading in volatile conditions.
Key Features :
🔍 Liquidity Sweep Detection – Identifies and highlights areas where liquidity has been swept, distinguishing between major and minor liquidation events.
📊 Volume Profile Integration – Displays a volume profile overlay, helping traders spot high-activity price zones where the market is likely to react.
📈 Trend-Based Filtering – Utilizes an adaptive trend detection algorithm to refine liquidity sweeps based on market direction, reducing noise.
🎨 Customizable Visualization – Modify colors, thresholds, and display settings to tailor the indicator to your trading style.
🔔 Alerts for Liquidity Sweeps & Trend Changes – Stay ahead of the market by receiving alerts when significant liquidity events or trend shifts occur.
How to Use:
🛠 Add the Indicator : Add the Liquidity Sweep Filter to your chart and configure the settings based on your preferred sensitivity. Adjust the major sweep threshold to filter out smaller moves.
📊 Analyze Liquidity Zones and trend direction : Look for liquidation levels where large buy or sell stops have been triggered. Major sweeps indicate strong reactions, while minor sweeps show gradual liquidity absorption. You can also see which levels are high in liquidity by the transparency of the levels.
🔔 Set-Up Alerts : Use the in-built alerts so you don't miss a trading opportunity
How It Works :
The Liquidity Sweep Filter detects liquidity events by tracking swing highs and lows (defined as a pivot where neighboring candles are lower/higher than it) where traders are likely to have placed stop-loss orders. It evaluates volume and price action, marking areas where liquidity has been absorbed by the market. Additionally, the integrated trend filter ensures that only relevant liquidity sweeps are highlighted based on market direction, lows in an uptrend and highs in a downtrend. The trend filter works by calculating a basis, and defining trend shifts when the closing price crosses over the upper or lower bands.The included volume profile further enhances analysis by displaying key trading zones where price may react.

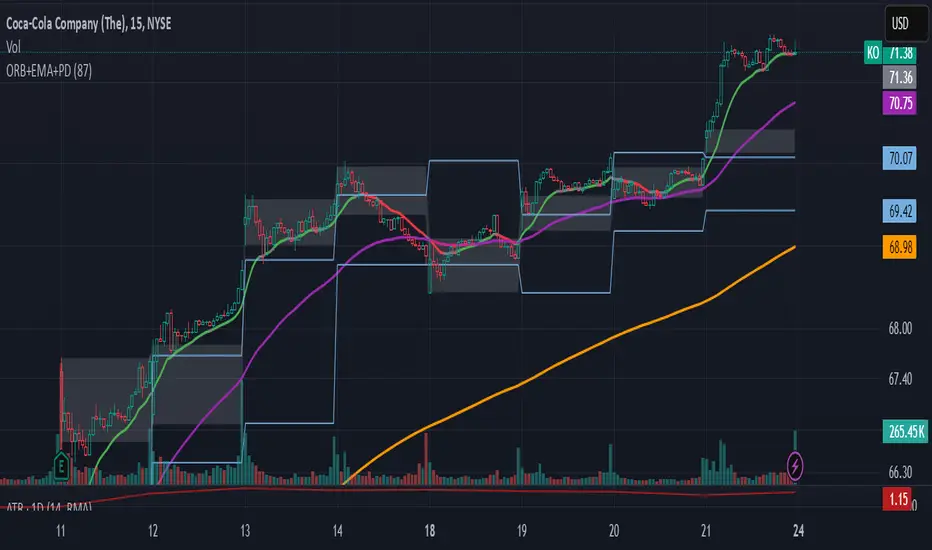
ORB-5Min + Adaptive 12/48 EMA + PDH/PDL
Overview:
This indicator combines the 5-Minute Opening Range Breakout (ORB), Adaptive 12/48 Exponential Moving Averages (EMAs), and Previous Day High/Low (PDH/PDL) levels to help traders identify key intraday levels and market trends.
Key Components and Logic:
5-Minute Opening Range Breakout (ORB):
Displays the high and low from the first 5-minute candle of the trading session.
Includes customizable opacity for the range fill.
Helps traders spot breakout opportunities and key support/resistance zones.
Adaptive 12/48 EMA System:
Displays EMAs for 9, 12, 48, and 200 periods.
The 12 EMA changes color based on whether the price is entirely above or below it.
The 48 EMA changes color depending on its relationship with the 12 EMA.
Provides dynamic trend identification and potential entry/exit signals.
Previous Day High/Low (PDH/PDL):
Displays the previous day’s high and low levels.
Useful for tracking key intraday support/resistance levels and potential reversal points.
Summary:
This script stands out by blending three popular intraday tools into a single comprehensive indicator. The combined visualization provides a layered market context that assists traders in making informed decisions quickly. The color-adaptive EMAs add clarity to trend direction, while the ORB and PDH/PDL levels highlight significant price zones for breakout or reversal trades.
How to Use:
Breakout Trades: Watch for price breaks above the ORB high or below the ORB low, especially when supported by EMA trends.
Trend Confirmation: Use the color-adaptive 12/48 EMA system to gauge momentum and market direction.
Reversal or Continuation: Observe how price reacts around PDH/PDL levels, especially if confluence with EMAs occurs.
This indicator is suitable for day traders seeking a clear and efficient way to track market structure, identify trends, and spot potential trade opportunities during regular market hours.
Peak Reaction Zones [BigBeluga]Peak Reaction Zones is an advanced Smart Money Concept (SMC) indicator that identifies the most recent swing high and swing low zones, helping traders determine premium and discount areas for optimal trade positioning.
🔵 Key Features:
Swing High & Low Zones:
Automatically detects the latest swing high and swing low levels.
Helps traders identify key reaction points where price is likely to respond.
Premium & Discount Concept:
The high zone represents a premium area, where price is overextended and may reverse.
The low zone represents a discount area, where price is undervalued and may bounce.
The midline dynamically marks the equilibrium of the range.
Adjustable Zone Width:
Users can fine-tune the width of the zones to match their trading style.
Wider zones capture broader reaction ranges, while narrower zones focus on precise levels.
Zone Retest Signals:
Blue markers appear when price retests the lower reaction zone, signaling potential support.
Orange markers appear when price retests the upper reaction zone, indicating possible resistance.
Price Labels for Key Levels:
Displays the price value of the swing high, swing low, and midline for quick reference.
Helps traders recognize major reaction points at a glance.
🔵 Usage:
Smart Money Trading: Utilize the premium and discount concept to align trades with institutional order flow.
Zone Reactions: Watch for price tests of reaction zones and use the retest signals to confirm potential reversals.
Midline Confirmation: If price holds above or below the midline, it can indicate directional bias.
Scalping & Swing Trading: Short-term traders can look for zone rejections, while swing traders can use the levels for trend continuation setups.
Peak Reaction Zones is a must-have tool for traders looking to trade with Smart Money Concepts, allowing for precise entries and exits based on key liquidity areas and market structure.

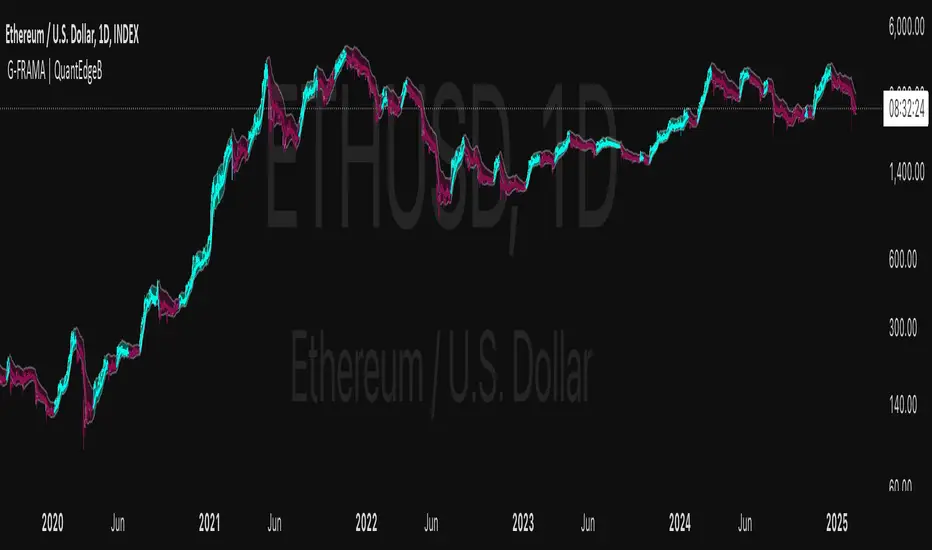
G-FRAMA | QuantEdgeBIntroducing G-FRAMA by QuantEdgeB
Overview
The Gaussian FRAMA (G-FRAMA) is an adaptive trend-following indicator that leverages the power of Fractal Adaptive Moving Averages (FRAMA), enhanced with a Gaussian filter for noise reduction and an ATR-based dynamic band for trade signal confirmation. This combination results in a highly responsive moving average that adapts to market volatility while filtering out insignificant price movements.
_____
1. Key Features
- 📈 Gaussian Smoothing – Utilizes a Gaussian filter to refine price input, reducing short-term noise while maintaining responsiveness.
- 📊 Fractal Adaptive Moving Average (FRAMA) – A self-adjusting moving average that adapts its sensitivity to market trends.
- 📉 ATR-Based Volatility Bands – Dynamic upper and lower bands based on the Average True Range (ATR), improving signal reliability.
- ⚡ Adaptive Trend Signals – Automatically detects shifts in market structure by evaluating price in relation to FRAMA and its ATR bands.
_____
2. How It Works
- Gaussian Filtering
The Gaussian function preprocesses the price data, giving more weight to recent values and smoothing fluctuations. This reduces whipsaws and allows the FRAMA calculation to focus on meaningful trend developments.
- Fractal Adaptive Moving Average (FRAMA)
Unlike traditional moving averages, FRAMA uses fractal dimension calculations to adjust its smoothing factor dynamically. In trending markets, it reacts faster, while in sideways conditions, it reduces sensitivity, filtering out noise.
- ATR-Based Volatility Bands
ATR is applied to determine upper and lower thresholds around FRAMA:
- 🔹 Long Condition: Price closes above FRAMA + ATR*Multiplier
- 🔻 Short Condition: Price closes below FRAMA - ATR
This setup ensures entries are volatility-adjusted, preventing premature exits or false signals in choppy conditions.
_____
3. Use Cases
✔ Adaptive Trend Trading – Automatically adjusts to different market conditions, making it ideal for both short-term and long-term traders.
✔ Noise-Filtered Entries – Gaussian smoothing prevents false breakouts, allowing for cleaner entries.
✔ Breakout & Volatility Strategies – The ATR bands confirm valid price movements, reducing false signals.
✔ Smooth but Aggressive Shorts – While the indicator is smooth in overall trend detection, it reacts aggressively to downside moves, making it well-suited for traders focusing on short opportunities.
_____
4. Customization Options
- Gaussian Filter Settings – Adjust length & sigma to fine-tune the smoothness of the input price. (Default: Gaussian length = 4, Gaussian sigma = 2.0, Gaussian source = close)
- FRAMA Length & Limits – Modify how quickly FRAMA reacts to price changes.(Default: Base FRAMA = 20, Upper FRAMA Limit = 8, Lower FRAMA Limit = 40)
- ATR Multiplier – Control how wide the volatility bands are for long/short entries.(Default: ATR Length = 14, ATR Multiplier = 1.9)
- Color Themes – Multiple visual styles to match different trading environments.
_____
Conclusion
The G-FRAMA is an intelligent trend-following tool that combines the adaptability of FRAMA with the precision of Gaussian filtering and volatility-based confirmation. It is versatile across different timeframes and asset classes, offering traders an edge in trend detection and trade execution.
____
🔹 Disclaimer: Past performance is not indicative of future results. No trading strategy can guarantee success in financial markets.
🔹 Strategic Advice: Always backtest, optimize, and align parameters with your trading objectives and risk tolerance before live trading.
Opening Score with DivergenceOverview
The Opening Score Indicator is a versatile tool designed to help traders assess market sentiment, trend direction, and potential reversals. By combining Opening Range Breakout (ORB), VWAP, Trend, Volatility, and Divergence Detection, this indicator provides a composite score that adapts to different market conditions.
This version includes divergence detection between the Opening Score and price, which highlights potential trend reversals or continuations before they happen. When a regular divergence occurs, the histogram bar turns orange, signaling an increased probability of a trend change.
Best for Both Intraday & Longer-Term Charts
📊 Optimized for intraday trading → Works well on 1m to 30m timeframes for short-term strategies.
📈 Also effective on longer-term charts → Can be used on 1-hour, 4-hour, daily, or weekly charts to identify macro trends and momentum shifts.
🕰️ Adapts to different market conditions → Whether you’re a day trader, swing trader, or position trader, the Opening Score helps you track trend health and reversals.
How It Works
📊 Composite Opening Score Calculation
• ORB Signal → Detects bullish/bearish breakouts based on the opening range.
• VWAP Signal → Measures price positioning relative to VWAP for trend confirmation.
• Trend Signal → Uses a moving average to determine market direction.
• Volatility Signal → Tracks ATR changes to assess market strength.
• Divergence Detection → Identifies regular and hidden divergences for potential reversals or trend continuation.
🔹 Reversal Alerts with Color-Coded Histogram
• Green Bars → Normal bullish Opening Score.
• Red Bars → Normal bearish Opening Score.
• Orange Bars → Warning! Regular Divergence detected → Possible trend reversal.
🔹 Hidden & Regular Divergence Detection
• Regular Divergence (Reversal Signals)
• 📉 Bearish Regular Divergence → Price makes a Higher High, but Opening Score makes a Lower High → 🔻 Possible Downtrend Reversal.
• 📈 Bullish Regular Divergence → Price makes a Lower Low, but Opening Score makes a Higher Low → 🔼 Possible Uptrend Reversal.
• Hidden Divergence (Trend Continuation Signals)
• 📉 Bearish Hidden Divergence → Price makes a Lower High, but Opening Score makes a Higher High → 🔻 Trend Likely to Continue Down.
• 📈 Bullish Hidden Divergence → Price makes a Higher Low, but Opening Score makes a Lower Low → 🔼 Trend Likely to Continue Up.
How to Use It
✅ Watch for Reversal Alerts (Orange Bars) → These highlight potential market turning points.
✅ Use the Zero Line as a Trend Filter → A score above 0 suggests bullish conditions, while below 0 signals bearish conditions.
✅ Combine with Market Structure & Volume Profile → Works well when paired with support/resistance levels, liquidity zones, and order flow data.
✅ Adjust settings based on timeframe → Increase moving average length & lookback periods for longer-term analysis.
Why Use This Indicator?
🚀 Works for both short-term and long-term traders → Adapts to intraday and higher timeframes.
📊 Multi-Factor Analysis → Combines multiple key market indicators for better accuracy.
🎯 Customizable Weighting → Adjust the influence of each signal to suit your trading style.
✅ No Clutter – Only the Opening Score is plotted → Keeps your chart clean & efficient.
🔔 Recommended for Intraday Trading (1m – 30m) AND Longer-Term Analysis (1H – Weekly) → Use this indicator to enhance your trend detection & reversal strategy! 🚀
WAGMI LAB Trend Reversal Indicator HMA-Kahlman (m15)WAGMI HMA-Kahlman Trend Reversal Indicator
This indicator combines the Hull Moving Average (HMA) with the Kahlman filter to provide a dynamic trend reversal signal, perfect for volatile assets like Bitcoin. The strategy works particularly well on lower timeframes, making it ideal for intraday trading and fast-moving markets.
Key Features:
Trend Detection: It uses a blend of HMA and Kahlman filters to detect trend reversals, providing more accurate and timely signals.
Volatility Adaptability: Designed with volatile assets like Bitcoin in mind, this indicator adapts to rapid price movements, offering smoother trend detection during high volatility.
Easy Visualization: Buy (B) and Sell (S) signals are clearly marked with labels, helping traders spot trend shifts quickly and accurately.
Trendlines Module: The indicator plots trendlines based on pivot points, highlighting important support and resistance levels. This helps traders understand the market structure and identify potential breakout or breakdown zones.
Customizable: Adjust the HMA and Kahlman parameters to fit different assets or trading styles, making it flexible for various market conditions.
Usage Tips:
Best Timeframes: The indicator performs exceptionally well on lower timeframes (such as 15-minute to 1-hour charts), making it ideal for scalping and short-term trading strategies.
Ideal for Volatile Assets: This strategy is perfect for highly volatile assets like Bitcoin, but can also be applied to other cryptocurrencies and traditional markets with high price fluctuations.
Signal Confirmation: Use the trend signals (green for uptrend, red for downtrend) along with the buy/sell labels to help you confirm potential entries and exits. It's also recommended to combine the signals with other technical tools like volume analysis or RSI for enhanced confirmation.
Trendline Analysis: The plotted trendlines provide additional visual context to identify key market zones, supporting your trading decisions with a clear view of ongoing trends and possible reversal areas.
Risk Management: As with any strategy, always consider proper risk management techniques, such as stop-loss and take-profit levels, to protect against unforeseen market moves.

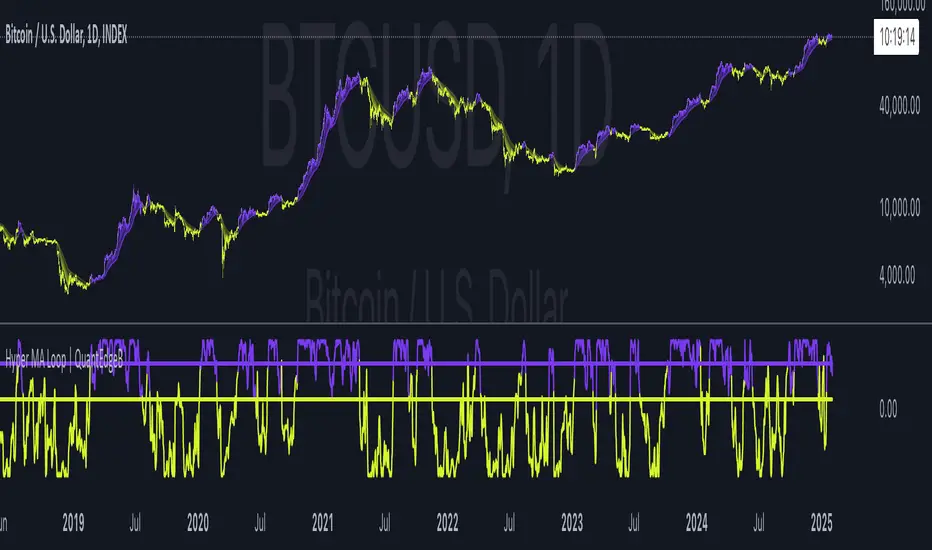
Hyper MA Loop | QuantEdgeBIntroducing Hyper MA Loop by QuantEdgeB
Hyper MA Loop | QuantEdgeB is an advanced trend-following indicator that leverages a custom Hyper Moving Average (HyMA) and an innovative loop-based scoring system to assess trend strength and direction. This tool is designed to provide a dynamic perspective on market momentum, allowing traders to capture trends effectively while filtering out market noise.
Key Features:
1. Hyper Moving Average (HyMA) 🟣
- A weighted moving average that enhances trend responsiveness by applying a custom
weight function.
- Ensures smoother trend detection while maintaining reactivity to price changes.
2. Loop-Based Trend Scoring 🔄
- Utilizes a for-loop function to analyze the movement of HyMA over a specified period.
- Compares current values to past values, generating a cumulative score indicating bullish or
bearish momentum.
- Dynamic thresholds adjust to market conditions for better trend filtering.
3. Threshold-Based Signal System ✅❌
- Long Signals: Triggered when the loop score exceeds the long threshold.
- Short Signals: Activated when the score falls below the short threshold.
- Avoids false signals by requiring sustained strength before confirming a trend.
4. Customizable Visualization & Colors 🎨
- Multiple color modes (Default, Solar, Warm, Cool, Classic) for tailored aesthetics.
- Extra plot options enhance visualization of market structure and volatility.
________
How It Works:
- HyMA Calculation : A unique moving average with a specialized weighting function to
smooth out price action.
- Loop Function : Iterates over past HyMA values, assessing whether price is consistently
higher or lower.
- Threshold Comparison : The loop score is compared against pre-set thresholds to
determine bullish or bearish conditions.
- Signal Generation :
1. Bullish (🔵): If the score crosses the long threshold
2. Bearish (🔴): If the score drops below the short threshold.
- Plotting & Styling : Dynamic candles and gradient overlays provide an intuitive
visualization of rend shifts.
________
Use Cases:
✅ Ideal for trend-following traders looking for solid trends confirmation.
✅ Helps filter out choppy market conditions by adjusting sensitivity dynamically.
✅ Works well with other indicators (e.g., ADX, volume-based filters) for added confirmation.
✅ Suitable for both short-term and long-term trend analysis.
________
Customization Options:
- Adjustable HyMA Length: Modify the responsiveness of the moving average. Default se to 2.
- For-Loop Parameters: Fine-tune how far back the trend analysis should consider. Default se to Start = 1 , End = -1.
- Thresholds for Long & Short: Control signal sensitivity to market fluctuations. Default set to Long = 40, Short = 8.
- Color Modes & Extra Plots: Personalize visualization for better clarity.
________
Conclusion:
The Hyper MA Loop | QuantEdgeB is a powerful, adaptive indicator that combines custom moving averages with loop-based trend analysis to deliver accurate, visually intuitive market signals. Whether you're looking to ride strong trends or filter out weak setups, this tool provides the precision and flexibility needed for effective decision-making. 🚀📈
🔹 Disclaimer: Past performance is not indicative of future results. No trading indicator can guarantee success in financial markets.
🔹 Strategic Consideration: As always, backtesting and strategic adjustments are essential to fully optimize this indicator for real-world trading. Traders should consider risk management practices and adapt settings to their specific market conditions and trading style.
ICT Dealing RangeICT Dealing Range
This indicator identifies and plots ICT (Inner Circle Trader) Dealing Ranges - key institutional areas where smart money accumulates or distributes positions before significant moves.
What is a Dealing Range?
A Dealing Range is a significant price area where institutional traders accumulate or distribute their positions. These ranges form through a specific sequence of price movements that indicate institutional order flow:
Bullish Dealing Range Sequence:
1. Initial High (H)
2. Initial Low (L)
3. Higher High (HH)
4. Lower Low (LL)
5. Break above HH (confirmation)
Bearish Dealing Range Sequence:
1. Initial Low (L)
2. Initial High (H)
3. Lower Low (LL)
4. Higher High (HH)
5. Break below LL (confirmation)
My Trading Strategy
Entry Methods:
1. Range Extreme Retests:
- After range formation, wait for price to return to either extreme
- Long entries at range bottom with stops below
- Short entries at range top with stops above
2. Mid-Line Strategy:
- Use the mid-line as a pivot point for reversals
- Long entries on mid-line bounce with stops below
- Short entries on mid-line rejection with stops above
Stop Loss Placement:
- When entering at extremes: Place stops beyond the mid
- When entering at mid-line: Place stops beyond the opposing extreme
- Always respect the structure's boundaries
Take Profit Targets:
- Minimum 2:1 Risk-Reward ratio
- For extreme entries: Target the opposite extreme
- For mid-line entries: Target the nearest extreme
Risk Management
- Never enter without a clear invalidation point
- Maintain minimum 2:1 RR ratio
- Consider market structure and higher timeframe context
Indicator Features
- Auto-detection of dealing range patterns
- Color-coded boxes (green for bullish, red for bearish)
- Optional mid-line display
- Customizable colors and styles
- Adjustable pivot lookback periods
Notes
This tool is based on ICT concepts but should be used in conjunction with other forms of analysis. The dealing range provides a framework for understanding institutional order flow, but proper risk management and market context are essential for successful trading.
Remember: The best trades often come from clean retests of these ranges after their initial formation. Patience in waiting for proper setups is key to successful implementation.

Timed Ranges [mktrader]The Timed Ranges indicator helps visualize price ranges that develop during specific time periods. It's particularly useful for analyzing market behavior in instruments like NASDAQ, S&P 500, and Dow Jones, which often show reactions to sweeps of previous ranges and form reversals.
### Key Features
- Visualizes time-based ranges with customizable lengths (30 minutes, 90 minutes, etc.)
- Tracks high/low range development within specified time periods
- Shows multiple cycles per day for pattern recognition
- Supports historical analysis across multiple days
### Parameters
#### Settings
- **First Cycle (HHMM-HHMM)**: Define the time range of your first cycle. The duration of this range determines the length of all subsequent cycles (e.g., "0930-1000" creates 30-minute cycles)
- **Number of Cycles per Day**: How many consecutive cycles to display after the first cycle (1-20)
- **Maximum Days to Display**: Number of historical days to show the ranges for (1-50)
- **Timezone**: Select the appropriate timezone for your analysis
#### Style
- **Box Transparency**: Adjust the transparency of the range boxes (0-100)
### Usage Example
To track 30-minute ranges starting at market open:
1. Set First Cycle to "0930-1000" (creates 30-minute cycles)
2. Set Number of Cycles to 5 (will show ranges until 11:30)
3. The indicator will display:
- Range development during each 30-minute period
- Visual progression of highs and lows
- Color-coded cycles for easy distinction
### Use Cases
- Identify potential reversal points after range sweeps
- Track regular time-based support and resistance levels
- Analyze market structure within specific time windows
- Monitor range expansions and contractions during key market hours
### Tips
- Use in conjunction with volume analysis for better confirmation
- Pay attention to breaks and sweeps of previous ranges
- Consider market opens and key session times when setting cycles
- Compare range sizes across different time periods for volatility analysis

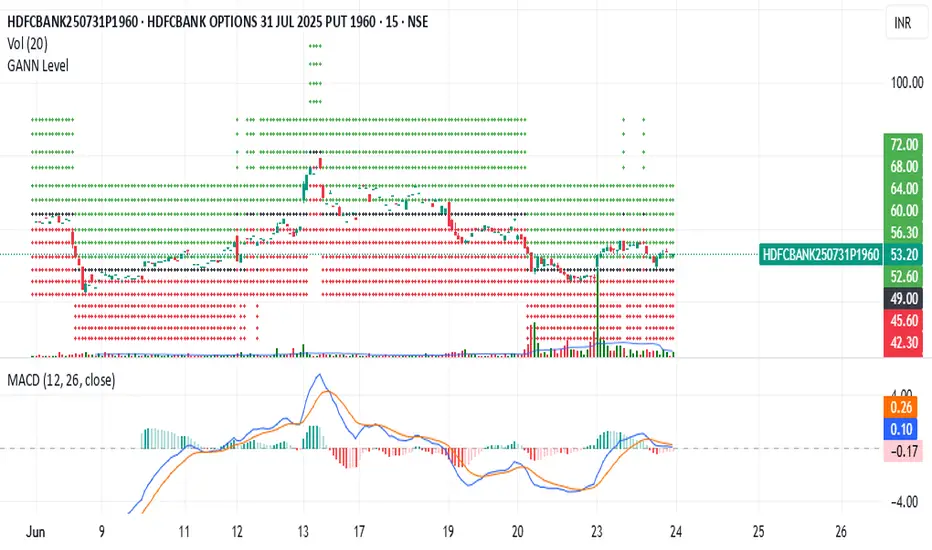
GANN Level (Salil Sir)GANN Level Indicator Description
This Pine Script calculates and plots Gann Levels based on a user-defined price input. It creates horizontal lines at key support and resistance levels derived from the input price, applying Gann's theory of market structure. The levels are dynamically calculated and squared for enhanced precision.
Key Features:
Manual Price Input:
The user inputs a round off of square root of base price (Manual_Input), which serves as the foundation for calculations.
Support and Resistance Levels:
Six resistance levels (R1 to R6) and six support levels (S1 to S6) are calculated by incrementing or decrementing the base price in steps of 0.25.
Squared Levels:
Each level is squared (level^2) to align with Gann's mathematical principles.
Visualization:
All levels, including the base price squared (GANN), are plotted as horizontal dotted lines:
Black Line: Base price squared (Gann Level).
Green Lines: Resistance levels.
Red Lines: Support levels.
Purpose:
The indicator helps traders identify potential support and resistance zones based on Gann's methodology, providing a mathematical framework for decision-making.
Usage:
Adjust the Manual Price in the settings to the desired value.
Observe the plotted levels for key support and resistance zones on the chart.
Use these levels to make informed trading decisions or to validate other indicators.
Multi Timeframe Market Formation [LuxAlgo]The Multi Timeframe Market Formation tool allows traders to analyze up to 6 different timeframes simultaneously to discover their current formation, S/R levels and their degree of synchronization with the current chart timeframe. Multi timeframe analysis made easy.
🔶 USAGE
By default, the tool displays the chart's timeframe formation plus up to 5 other formations on timeframes higher than the one in the chart.
When the chart formation is synchronized with any enabled timeframe formation, the tool displays labels and a trailing channel, it uses a gradient by default, so the more timeframes are synchronized, the more visible the labels and the trailing channel are.
All timeframes enabled in the settings panel must be higher than the chart timeframe, otherwise the tool will display an error message.
🔹 Formations
A formation is a market structure defined by a lower and an upper boundary (also known as support & resistance).
Each formation has a different symbol and color to identify it at a glance.
It helps traders to know the current market behavior and the tool displays up to 5 of them.
BULLISH (green ▲): higher high and higher low
BEARISH (red ▼): lower high and lower low
CONTRACTION (orange ◀): lower high and higher low
EXPANSION (blue ▶): higher high and lower low
SIDEWAYS (yellow ◀): Any that does not fit with the others
🔹 Multi Timeframe Formations
The tool displays up to 6 different timeframe formations, the chart timeframe plus 5 more configurable from the settings panel.
Each of them has an upper and lower limit, a timeframe, a color and an icon.
If a bound level is shared by more than one formation, the timeframes and symbols are displayed on the same line.
These are significant levels shared by different timeframes and traders need to be aware of them.
🔹 Sync With Chart Timeframe
If the current formation on the chart timeframe is in sync with any of the timeframes enabled in the settings panel, the tool will display this on the chart.
The more timeframes are in sync, the more they are visible, providing a clear visual representation of the common market behavior on multiple timeframes at the same time.
🔶 SETTINGS
Formation size: Size of market formations on the chart timeframe
🔹 Timeframes
TF1 to TF5: Activate/deactivate timeframe, set size of market formation and activate/deactivate high and low levels
🔹 Style
Show Labels: Enable/Disable Timeframe Sync Labels
Transparency Gradient: Enable/Disable Transparency Gradient
Show Trailing Channel | Multiplier: Enable/Disable Trailing Channel and set multiplier
Color for each formation

ELC Indicator**ELC Indicator – Enigma Liquidity Concept**
The ELC Indicator is a cutting-edge tool designed for traders who want to leverage price action and liquidity concepts for high-precision trading opportunities. Unlike conventional indicators that rely purely on trend-following or oscillatory methods, ELC incorporates a unique combination of market structure, Fibonacci retracement levels, and dynamic EMA filtering to detect key buy and sell zones. This original approach helps traders capture the most relevant market movements and anticipate potential reversals with higher confidence.
---
### **What the ELC Indicator Does**
The primary goal of the ELC Indicator is to identify liquidity zones and plot Fibonacci-based levels around detected buy or sell signals. It continuously monitors price action to identify instances where significant liquidity grabs occur, signaled by breakouts beyond recent highs or lows. Once a signal is detected, the indicator plots horizontal lines at key Fibonacci ratios (0%, 25%, 50%, 75%, 100%, 120%, and 180%) to give traders a clear visual framework for potential retracement or extension levels.
Additionally, the indicator includes a dynamic EMA filter, which ensures that buy signals are only triggered when the price is above the EMA and sell signals when the price is below the EMA. This filtering mechanism helps reduce false signals in choppy markets and aligns trades with the broader trend direction.
---
### **Key Features**
1. **Buy & Sell Signals**
- Buy signals are generated when a liquidity grab occurs below the previous low, and the closing price is above the candle body midpoint and the EMA.
- Sell signals are triggered when a liquidity grab occurs above the previous high, and the closing price is below the candle body midpoint and the EMA.
- Visual cues are provided via small upward (green) and downward (red) triangles on the chart.
2. **Fibonacci Levels**
- For each buy or sell signal, the indicator plots multiple horizontal lines at key Fibonacci levels. These levels can help traders set realistic profit targets and stop-loss levels.
- The plotted lines can be customized in terms of style (solid, dotted, dashed) and color (buy and sell line colors).
3. **Dynamic EMA Filtering**
- A customizable EMA filter is integrated into the logic to align trades with the prevailing trend.
- The EMA length is adjustable, allowing traders to fine-tune the indicator based on their trading style and market conditions.
4. **Alert System**
- Alerts can be enabled for both buy and sell signals, ensuring traders never miss an opportunity even when away from the screen.
- Alerts are triggered once per bar, ensuring timely notifications without excessive noise.
5. **Customizable Signal Visibility**
- Traders can toggle the visibility of the last 9 buy and sell signals. When this option is disabled, only the most recent signal is displayed, helping to declutter the chart.
---
### **How to Use the ELC Indicator**
- **Trend Following**: The ELC Indicator works well in trending markets by filtering signals based on the EMA direction. Traders can use the plotted Fibonacci levels to enter trades, set profit targets, and manage risk.
- **Reversal Trading**: The liquidity grab detection mechanism allows traders to capture potential market reversals. By waiting for price retracements to key Fibonacci levels after a signal, traders can enter trades with a favorable risk-to-reward ratio.
- **Scalping & Day Trading**: With its ability to plot key intraday levels and generate real-time alerts, the ELC Indicator is particularly useful for scalpers and day traders looking to exploit short-term market inefficiencies.
---
### **Concepts Underlying the Calculations**
1. **Liquidity Grabs**: The ELC Indicator’s core logic is based on detecting instances where the market moves beyond a recent high or low, triggering a liquidity grab. This often signals a potential reversal or continuation, depending on broader market conditions.
2. **Fibonacci Ratios**: Once a signal is detected, key Fibonacci levels are plotted to provide traders with actionable zones for trade entries, profit targets, or stop-loss placements.
3. **EMA Filtering**: The EMA acts as a dynamic trend filter, ensuring that signals are aligned with the dominant market direction. This reduces the likelihood of entering trades against the prevailing trend.
---
### **Why ELC is Unique**
The ELC Indicator stands out by combining multiple powerful trading concepts—liquidity, Fibonacci ratios, and EMA filtering—into a single tool that provides actionable and visually intuitive information. Unlike traditional trend-following indicators that lag behind price action, ELC proactively identifies key market turning points based on liquidity events. Its customizable features, real-time alerts, and comprehensive plotting of Fibonacci levels make it a versatile tool for traders across various styles and timeframes.
Whether you're a scalper looking for intraday opportunities or a swing trader aiming to capture larger moves, the ELC Indicator offers a robust framework for identifying and executing high-probability trades.
---
### **How to Get Started**
1. Add the ELC Indicator to your chart.
2. Customize the EMA length, line colors, and style based on your preference.
3. Enable alerts to receive real-time notifications of buy and sell signals.
4. Use the plotted Fibonacci levels to plan your trade entries, profit targets, and stop-loss levels.
5. Combine the signals from ELC with your existing market analysis for optimal results.
---
This unique approach makes the ELC Indicator a valuable tool for traders seeking precision, clarity, and consistency in their trading decisions.

Support Resistance Major/Minor [TradingFinder] Market Structure🔵 Introduction
Support and resistance levels are key concepts in technical analysis, serving as critical points where prices pause or reverse due to the interaction of supply and demand. These foundational elements in price action and classical technical analysis assist traders in understanding market behavior and making better trading decisions.
Support levels are zones where demand is strong enough to prevent further price declines, while resistance levels act as barriers that hinder price increases.
Support and resistance levels are divided into two main types: static and dynamic. Static levels are fixed horizontal lines on charts, formed based on historical price points, and are crucial due to repeated price reactions in these areas.
Dynamic levels, on the other hand, move with market trends and are often identified using tools like moving averages and trendlines. These levels are particularly useful for analyzing dynamic trends and identifying potential reversal points in financial markets.
The importance of support and resistance in technical analysis lies in their ability to pinpoint price reversal or continuation points. Professional traders use these levels to determine optimal entry and exit points and combine them with tools such as Fibonacci retracements or moving averages for precise strategies.
Detailed analysis of price behavior at these levels provides insights into trend strength and the likelihood of price breaks or reversals. By understanding these concepts, technical analysts can forecast future price movements and optimize their trading decisions using tools such as indicators and price action. Support and resistance levels, as a cornerstone of technical analysis, form the foundation for many trading strategies.
🔵 How to Use
The Static Support and Resistance Indicator is a vital tool for identifying significant price zones in financial markets. It automatically detects major and minor support and resistance levels in both short-term and long-term intervals, enabling traders to analyze price behavior accurately and develop optimal entry and exit strategies.
🟣 Major Long-Term Support and Resistance
Major Long-Term Support : The lowest price points recorded over long-term intervals that prevent further declines.
Major Long-Term Resistance : The highest price points in long-term intervals that limit further price increases.
🟣 Minor Long-Term Support and Resistance
Minor Long-Term Support : Temporary halts in price decline within a downtrend over long-term intervals.
Minor Long-Term Resistance : Short-term zones within long-term intervals where prices react negatively in an uptrend.
🟣 Major Short-Term Support and Resistance
Major Short-Term Support : The lowest price points in short-term intervals that act as barriers against sharp price drops.
Major Short-Term Resistance : The highest points in short-term intervals that prevent further price surges.
🟣 Minor Short-Term Support and Resistance
Minor Short-Term Support : Temporary halts in price decline within short-term downtrends.
Minor Short-Term Resistance : Zones where price reacts quickly and reverses in short-term uptrends.
🔵 Settings
Long Term S&R Pivot Period : Defines the interval for identifying long-term support and resistance levels (default: 21).
Short Term S&R Pivot Period : Defines the interval for identifying short-term support and resistance levels (default: 5).
🟣 Long-Term Lines
Major Line Display : Enable/disable major long-term lines.
Minor Line Display : Enable/disable minor long-term lines.
Major Line Colors : Green for support, red for resistance (long-term major levels).
Minor Line Colors : Light green for support, light red for resistance (long-term minor levels).
Major Line Style : Choose between solid, dotted, or dashed lines for major long-term levels.
Minor Line Style : Choose between solid, dotted, or dashed lines for minor long-term levels.
Major Line Width : Adjust the thickness of major long-term lines.
Minor Line Width : Adjust the thickness of minor long-term lines.
🟣 Short-Term Lines
Major Line Display : Enable/disable major short-term lines.
Minor Line Display : Enable/disable minor short-term lines.
Major Line Colors : Gray-green for support, gray-red for resistance (short-term major levels).
Minor Line Colors : Dark green for support, dark red for resistance (short-term minor levels).
Major Line Style : Choose between solid, dotted, or dashed lines for major short-term levels.
Minor Line Style : Choose between solid, dotted, or dashed lines for minor short-term levels.
Major Line Width : Adjust the thickness of major short-term lines.
Minor Line Width : Adjust the thickness of minor short-term lines.
🔵 Conclusion
Static support and resistance levels are among the most critical tools in technical analysis, helping traders identify key reversal or continuation points.
This indicator simplifies and enhances the analysis process by automatically detecting major and minor levels in both short-term and long-term intervals. It allows traders to customize settings to suit their trading strategies and analyze different market levels effectively.
Using this indicator improves price action analysis, enhances market understanding, and identifies trading opportunities. Applicable to all trading styles, from day trading to long-term investing, it is an essential tool for technical analysis.
Combining this indicator with other tools like trendlines, Fibonacci retracements, and moving averages enables comprehensive analysis and allows traders to navigate financial markets with greater confidence.

300-Candle Weighted Average Zones w/50 EMA SignalsThis indicator is designed to deliver a more nuanced view of price dynamics by combining a custom, weighted price average with a volatility-based zone and a trend filter (in this case, a 50-period exponential moving average). The core concept revolves around capturing the overall price level over a relatively large lookback window (300 candles) but with an intentional bias toward recent market activity (the most recent 20 candles), thereby offering a balance between long-term context and short-term responsiveness. By smoothing this weighted average and establishing a “zone” of standard deviation bands around it, the indicator provides a refined visualization of both average price and its recent volatility envelope. Traders can then look for confluence with a standard trend filter, such as the 50 EMA, to identify meaningful crossover signals that may represent trend shifts or opportunities for entry and exit.
What the Indicator Does:
Weighted Price Average:
Instead of using a simple or exponential moving average, this indicator calculates a custom weighted average price over the past 300 candles. Most historical candles receive a base weight of 1.0, but the most recent 20 candles are assigned a higher weight (for example, a weight of 2.0). This weighting scheme ensures that the calculation is not simply a static lookback average; it actively emphasizes current market conditions. The effect is to generate an average line that is more sensitive to the most recent price swings while still maintaining the historical context of the previous 280 candles.
Smoothing of the Weighted Average:
Once the raw weighted average is computed, an exponential smoothing function (EMA) is applied to reduce noise and produce a cleaner, more stable average line. This smoothing helps traders avoid reacting prematurely to minor price fluctuations. By stabilizing the average line, traders can more confidently identify actual shifts in market direction.
Volatility Zone via Standard Deviation Bands:
To contextualize how far price can deviate from this weighted average, the indicator uses standard deviation. Standard deviation is a statistical measure of volatility—how spread out the price values are around the mean. By adding and subtracting one standard deviation from the smoothed weighted average, the indicator plots an upper band and a lower band, creating a zone or channel. The area between these bands is filled, often with a semi-transparent color, highlighting a volatility corridor within which price and the EMA might oscillate.
This zone is invaluable in visualizing “normal” price behavior. When the 50 EMA line and the weighted average line are both within this volatility zone, it indicates that the market’s short- to mid-term trend and its average pricing are aligned well within typical volatility bounds.
Incorporation of a 50-Period EMA:
The inclusion of a commonly used trend filter, the 50 EMA, adds another layer of context to the analysis. The 50 EMA, being a widely recognized moving average length, is often considered a baseline for intermediate trend bias. It reacts faster than a long-term average (like a 200 EMA) but is still stable enough to filter out the market “chop” seen in very short-term averages.
By overlaying the 50 EMA on this custom weighted average and the surrounding volatility zone, the trader gains a dual-dimensional perspective:
Trend Direction: If the 50 EMA is generally above the weighted average, the short-term trend is gaining bullish momentum; if it’s below, the short-term trend has a bearish tilt.
Volatility Normalization: The bands, constructed from standard deviations, provide a sense of whether the price and the 50 EMA are operating within a statistically “normal” range. If the EMA crosses the weighted average within this zone, it signals a potential trend initiation or meaningful shift, as opposed to a random price spike outside normal volatility boundaries.
Why a Trader Would Want to Use This Indicator:
Contextualized Price Level:
Standard MAs may not fully incorporate the most recent price dynamics in a large lookback window. By weighting the most recent candles more heavily, this indicator ensures that the trader is always anchored to what the market is currently doing, not just what it did 100 or 200 candles ago.
Reduced Whipsaw with Smoothing:
The smoothed weighted average line reduces noise, helping traders filter out inconsequential price movements. This makes it easier to spot genuine changes in trend or sentiment.
Visual Volatility Gauge:
The standard deviation bands create a visual representation of “normal” price movement. Traders can quickly assess if a breakout or breakdown is statistically significant or just another oscillation within the expected volatility range.
Clear Trade Signals with Confirmation:
By integrating the 50 EMA and designing signals that trigger only when the 50 EMA crosses above or below the weighted average while inside the zone, the indicator provides a refined entry/exit criterion. This avoids chasing breakouts that occur in abnormal volatility conditions and focuses on those crossovers likely to have staying power.
How to Use It in an Example Strategy:
Imagine you are a swing trader looking to identify medium-term trend changes. You apply this indicator to a chart of a popular currency pair or a leading tech stock. Over the past few days, the 50 EMA has been meandering around the weighted average line, both confined within the standard deviation zone.
Bullish Example:
Suddenly, the 50 EMA crosses decisively above the weighted average line while both are still hovering within the volatility zone. This might be your cue: you interpret this crossover as the 50 EMA acknowledging the recent upward shift in price dynamics that the weighted average has highlighted. Since it occurred inside the normal volatility range, it’s less likely to be a head-fake. You place a long position, setting an initial stop just below the lower band to protect against volatility.
If the price continues to rise and the EMA stays above the average, you have confirmation to hold the trade. As the price moves higher, the weighted average may follow, reinforcing your bullish stance.
Bearish Example:
On the flip side, if the 50 EMA crosses below the weighted average line within the zone, it suggests a subtle but meaningful change in trend direction to the downside. You might short the asset, placing your protective stop just above the upper band, expecting that the statistically “normal” level of volatility will contain the price action. If the price does break above those bands later, it’s a sign your trade may not work out as planned.
Other Indicators for Confluence:
To strengthen the reliability of the signals generated by this weighted average zone approach, traders may want to combine it with other technical studies:
Volume Indicators (e.g., Volume Profile, OBV):
Confirm that the trend crossover inside the volatility zone is supported by volume. For instance, an uptrend crossover combined with increasing On-Balance Volume (OBV) or volume spikes on up candles signals stronger buying pressure behind the price action.
Momentum Oscillators (e.g., RSI, Stochastics):
Before taking a crossover signal, check if the RSI is above 50 and rising for bullish entries, or if the Stochastics have turned down from overbought levels for bearish entries. Momentum confirmation can help ensure that the trend change is not just an isolated random event.
Market Structure Tools (e.g., Pivot Points, Swing High/Low Analysis):
Identify if the crossover event coincides with a break of a previous pivot high or low. A bullish crossover inside the zone aligned with a break above a recent swing high adds further strength to your conviction. Conversely, a bearish crossover confirmed by a breakdown below a previous swing low can make a short trade setup more compelling.
Volume-Weighted Average Price (VWAP):
Comparing where the weighted average zone lies relative to VWAP can provide institutional insight. If the bullish crossover happens while the price is also holding above VWAP, it can mean that the average participant in the market is in profit and that the trend is likely supported by strong hands.
This indicator serves as a tool to balance long-term perspective, short-term adaptability, and volatility normalization. It can be a valuable addition to a trader’s toolkit, offering enhanced clarity and precision in detecting meaningful shifts in trend, especially when combined with other technical indicators and robust risk management principles.

Crypto Sectors Performance [Daveatt]IMPORTANT
⚠️ This script must be used on the Daily timeframe only.
OVERVIEW
This indicator brings the powerful sector analysis capabilities from velo.xyz/market's
Sector Performance chart to TradingView.
It enables traders to track and compare performance across the crypto market's major sectors, providing essential insights for sector rotation strategies and market analysis.
CALCULATION METHOD
The indicator calculates performance across six key crypto sectors: DeFi, Gaming, Layer 1s, Layer 2s, AI, and Memecoins.
For each sector, it computes a rolling percentage performance by averaging the performance of multiple representative tokens.
All sector performances are rebased to 0% at the start of each period, making relative comparisons clear and intuitive.
VISUALIZATION MODES
The script features two distinct visualization methods:
Plots Mode:
Displays continuous performance lines for each sector over time, ideal for tracking relative strength trends and sector momentum. Each sector has its own color-coded line with performance values clearly marked.
Bars Mode:
Presents current sector performance as vertical bars, offering an immediate visual comparison of sector gains and losses.
The bars are color-coded and labeled with exact percentage values for precise analysis.
For the "Bars Mode", I used the box.new() function
SECTOR COMPOSITION
Each sector comprises carefully selected representative tokens:
- DeFi: AAVE, 1INCH, JUP, MKR, UNI
- Gaming: GALA, AXS, RONIN, SAND
- Layer 1: BTC, ETH, AVAX, APT, SOL, BNB, SUI
- Layer 2: ARB, OP, ZK, POL, STRK, MNT
- AI: FET, NEAR, RENDER, TAO
- Memecoins: PEPE, BONK, SHIB, DOGE, WIFU, POPCAT
PERFORMANCE TRACKING
The indicator implements a rolling window approach for performance calculations.
Starting from 0% at the beginning of each period, it tracks relative performance with positive values indicating outperformance and negative values showing underperformance.
Multiple timeframe options (1W, 1M, 3M, 6M, and 1Y) allow for both short-term and long-term analysis.
APPLICATIONS
This tool proves invaluable for:
- Sector rotation analysis
- Identifying trending sectors
- Comparing relative strength
- Gauging market sentiment
- Understanding market structure through sector performance
Thanks for reading and for the support
Daveatt

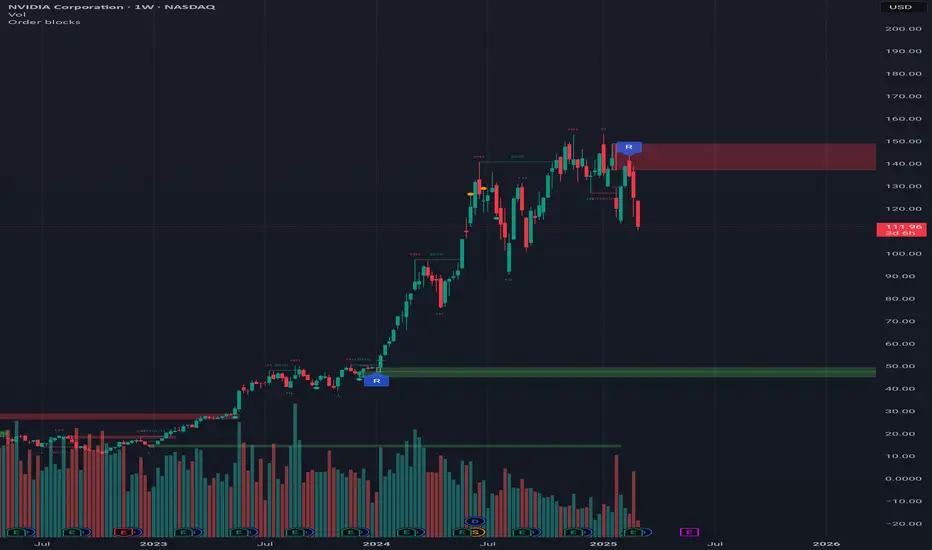
Order blocksHi all!
This indicator will show you found order blocks that can be used as supply or demand. It's my take on trying to create good order blocks and I hope it makes sense.
First off I suggest to verify the current trend before using an order block. This can be done in a variety of ways, one way could be to use my other script "Market structure" () which I use and suggest.
You can configure the indicator to behave differently depending on settings. These are the settings available:
• The order blocks created can be found in any higher timeframe defined in "Timeframe"
• The number of active order blocks are defined in "Count". If an order block is found the earliest order block will be replaced
• You can choose the type of order blocks that are found ("Bullish", "Bearish " or "Both") in "Type"
• The old order blocks can be kept if "Keep history" is checked
• Order blocks that are found are not removed when mitigated (entered) but when a new one appears. They can be removed when they are broken by price if "Remove broken zones" are checked
There is also a setting section called "Requirements" that defines what is required for an order block to be created. These are the settings:
• "Take out"
Check this if you want the base of the order block (the candle where the zone is drawn from (high and low)) to have to take out the previous candle (be higher or lower depending if the order block is bullish or bearish).
• "Consecutive rising/falling"
Each following candle in the reaction (the 3 reaction candles) needs to reach higher or lower (depending on bullish or bearish). Check this if you want that to be true.
• "Reaction"
Some sort of reaction is needed from the 3 candles creating the order block. This reaction is based on the value of the Average True Length (ATR) of length 14. You can here define a factor of the value from the ATR that these 3 candles needs to move in price. A higher need for a reaction (higher factor of the ATR) will create lesser zones. You can also choose to show this limit with the checkbox.
• "Fair Value Gap"
The reaction needs to create a gap (imbalance) in price. This gap is known as a "Fair Value Gap" and is created when the last candle's wick does not meet with the base candle's wick. Check this if you want this to be needed.
After these settings you can also choose the colors of the created zones. The ones that are active (called "Zones"), the ones that are replaced ("Replaced zones") and the ones that are broken ("Broken zones") (if this is enabled in "Remove broken zones").
I'm using my library "Touched" to be able to show you labels when the order blocks have a retest, false breakout and breakout. These labels can be hidden if you disable the labels under the style tab in the indicator settings.
The concept of order blocks is widely used among traders and can provide you with good supply or demand zones. I hope that this indicator makes sense.
My todo-list has a few things, but top of that list is adding alerts for zone interactions or creations. Please feel free to say what you want to be coded!
The order blocks in the publication chart are found in weekly timeframe but are shown on the daily timeframe. Other than that the image shows you zones from the default settings (which are based on the daily timeframe).
Best of luck trading!
Fibonacci Levels Strategy with High/Low Criteria-AYNETThis code represents a TradingView strategy that uses Fibonacci levels in conjunction with high/low price criteria over specified lookback periods to determine buy (long) and sell (short) conditions. Below is an explanation of each main part of the code:
Explanation of Key Sections
User Inputs for Higher Time Frame and Candle Settings
Users can select a higher time frame (timeframe) for analysis and specify whether to use the "Current" or "Last" higher time frame (HTF) candle for calculating Fibonacci levels.
The currentlast setting allows flexibility between using real-time or the most recent closed higher time frame candle.
Lookback Periods for High/Low Criteria
Two lookback periods, lowestLookback and highestLookback, allow users to set the number of bars to consider when finding the lowest and highest prices, respectively.
This determines the criteria for entering trades based on how recent highs or lows compare to current prices.
Fibonacci Levels Configuration
Fibonacci levels (0%, 23.6%, 38.2%, 50%, 61.8%, 78.6%, and 100%) are configurable. These are used to calculate price levels between the high and low of the higher time frame candle.
Each level represents a retracement or extension relative to the high/low range of the HTF candle, providing important price levels for decision-making.
HTF Candle Calculation
HTF candle data is calculated based on the higher time frame selected by the user, using the newbar check to reset htfhigh, htflow, and htfopen values.
The values are updated with each new HTF bar or as prices move within the same HTF bar to track the highest high and lowest low accurately.
Set Fibonacci Levels Array
Using the calculated HTF candle's high, low, and open, the Fibonacci levels are computed by interpolating these values according to the user-defined Fibonacci levels.
A fibLevels array stores these computed values.
Plotting Fibonacci Levels
Each Fibonacci level is plotted on the chart with a different color, providing visual indicators for potential support/resistance levels.
High/Low Price Criteria Calculation
The lowest and highest prices over the specified lookback periods (lowestLookback and highestLookback) are calculated and plotted on the chart. These serve as dynamic levels to trigger long or short entries.
Trade Signal Conditions
longCondition: A long (buy) signal is generated when the price crosses above both the lowest price criteria and the 50% Fibonacci level.
shortCondition: A short (sell) signal is generated when the price crosses below both the highest price criteria and the 50% Fibonacci level.
Executing Trades
Based on the longCondition and shortCondition, trades are entered with the strategy.entry() function, using the labels "Long" and "Short" for tracking on the chart.
Strategy Use
This strategy allows traders to utilize Fibonacci retracement levels and recent highs/lows to identify trend continuation or reversal points, potentially providing entry points aligned with larger market structure. Adjusting the lowestLookback and highestLookback along with Fibonacci levels enables a customizable approach to suit different trading styles and market conditions.

ICT Setup 03 [TradingFinder] Judas Swing NY 9:30am + CHoCH/FVG🔵 Introduction
Judas Swing is an advanced trading setup designed to identify false price movements early in the trading day. This advanced trading strategy operates on the principle that major market players, or "smart money," drive price in a certain direction during the early hours to mislead smaller traders.
This deceptive movement attracts liquidity at specific levels, allowing larger players to execute primary trades in the opposite direction, ultimately causing the price to return to its true path.
The Judas Swing setup functions within two primary time frames, tailored separately for Forex and Stock markets. In the Forex market, the setup uses the 8:15 to 8:30 AM window to identify the high and low points, followed by the 8:30 to 8:45 AM frame to execute the Judas move and identify the CISD Level break, where Order Block and Fair Value Gap (FVG) zones are subsequently detected.
In the Stock market, these time frames shift to 9:15 to 9:30 AM for identifying highs and lows and 9:30 to 9:45 AM for executing the Judas move and CISD Level break.
Concepts such as Order Block and Fair Value Gap (FVG) are crucial in this setup. An Order Block represents a chart region with a high volume of buy or sell orders placed by major financial institutions, marking significant levels where price reacts.
Fair Value Gap (FVG) refers to areas where price has moved rapidly without balance between supply and demand, highlighting zones of potential price action and future liquidity.
Bullish Setup :
Bearish Setup :
🔵 How to Use
The Judas Swing setup enables traders to pinpoint entry and exit points by utilizing Order Block and FVG concepts, helping them align with liquidity-driven moves orchestrated by smart money. This setup applies two distinct time frames for Forex and Stocks to capture early deceptive movements, offering traders optimized entry or exit moments.
🟣 Bullish Setup
In the Bullish Judas Swing setup, the first step is to identify High and Low points within the initial time frame. These levels serve as key points where price may react, forming the basis for analyzing the setup and assisting traders in anticipating future market shifts.
In the second time frame, a critical stage of the bullish setup begins. During this phase, the price may create a false break or Fake Break below the low level, a deceptive move by major players to absorb liquidity. This false move often causes smaller traders to enter positions incorrectly. After this fake-out, the price reverses upward, breaking the CISD Level, a critical point in the market structure, signaling a potential bullish trend.
Upon breaking the CISD Level and reversing upward, the indicator identifies both the Order Block and Fair Value Gap (FVG). The Order Block is an area where major players typically place large buy orders, signaling potential price support. Meanwhile, the FVG marks a region of supply-demand imbalance, signaling areas where price might react.
Ultimately, after these key zones are identified, a trader may open a buy position if the price reaches one of these critical areas—Order Block or FVG—and reacts positively. Trading at these levels enhances the chance of success due to liquidity absorption and support from smart money, marking an opportune time for entering a long position.
🟣 Bearish Setup
In the Bearish Judas Swing setup, analysis begins with marking the High and Low levels in the initial time frame. These levels serve as key zones where price could react, helping to signal possible trend reversals. Identifying these levels is essential for locating significant bearish zones and positioning traders to capitalize on downward movements.
In the second time frame, the primary bearish setup unfolds. During this stage, price may exhibit a Fake Break above the high, causing a brief move upward and misleading smaller traders into incorrect positions. After this false move, the price typically returns downward, breaking the CISD Level—a crucial bearish trend indicator.
With the CISD Level broken and a bearish trend confirmed, the indicator identifies the Order Block and Fair Value Gap (FVG). The Bearish Order Block is a region where smart money places significant sell orders, prompting a negative price reaction. The FVG denotes an area of supply-demand imbalance, signifying potential selling pressure.
When the price reaches one of these critical areas—the Bearish Order Block or FVG—and reacts downward, a trader may initiate a sell position. Entering trades at these levels, due to increased selling pressure and liquidity absorption, offers traders an advantage in profiting from price declines.
🔵 Settings
Market : The indicator allows users to choose between Forex and Stocks, automatically adjusting the time frames for the "Opening Range" and "Trading Permit" accordingly: Forex: 8:15–8:30 AM for identifying High and Low points, and 8:30–8:45 AM for capturing the Judas move and CISD Level break. Stocks: 9:15–9:30 AM for identifying High and Low points, and 9:30–9:45 AM for executing the Judas move and CISD Level break.
Refine Order Block : Enables finer adjustments to Order Block levels for more accurate price responses.
Mitigation Level OB : Allows users to set specific reaction points within an Order Block, including: Proximal: Closest level to the current price. 50% OB: Midpoint of the Order Block. Distal: Farthest level from the current price.
FVG Filter : The Judas Swing indicator includes a filter for Fair Value Gap (FVG), allowing different filtering based on FVG width: FVG Filter Type: Can be set to "Very Aggressive," "Aggressive," "Defensive," or "Very Defensive." Higher defensiveness narrows the FVG width, focusing on narrower gaps.
Mitigation Level FVG : Like the Order Block, you can set price reaction levels for FVG with options such as Proximal, 50% OB, and Distal.
CISD : The Bar Back Check option enables traders to specify the number of past candles checked for identifying the CISD Level, enhancing CISD Level accuracy on the chart.
🔵 Conclusion
The Judas Swing indicator helps traders spot reliable trading opportunities by detecting false price movements and key levels such as Order Block and FVG. With a focus on early market movements, this tool allows traders to align with major market participants, selecting entry and exit points with greater precision, thereby reducing trading risks.
Its extensive customization options enable adjustments for various market types and trading conditions, giving traders the flexibility to optimize their strategies. Based on ICT techniques and liquidity analysis, this indicator can be highly effective for those seeking precision in their entry points.
Overall, Judas Swing empowers traders to capitalize on significant market movements by leveraging price volatility. Offering precise and dependable signals, this tool presents an excellent opportunity for enhancing trading accuracy and improving performance

Range Detect SystemTechnical analysis indicator designed to identify potential significant price ranges and the distribution of volume within those ranges. The system helps traders calculate POC and show volume history. Also detecting breakouts or potential reversals. System identifies ranges with a high probability of price consolidation and helps screen out extreme price moves or ranges that do not meet certain volatility thresholds.
⭕️ Key Features
Range Detection — identifies price ranges where consolidation is occurring.
Volume Profile Calculation — indicator calculates the Point of Control (POC) based on volume distribution within the identified range, enhancing the analysis of market structure.
Volume History — shows where the largest volume was traded from the center of the range. If the volume is greater in the upper part of the range, the color will be green. If the volume is greater in the lower part, the color will be red.
Range Filtering — Includes multi-level filtering options to avoid ranges that are too volatile or outside normal ranges.
Visual Customization — Shows graphical indicators for potential bullish or bearish crossovers at the upper and lower range boundaries. Users can choose the style and color of the lines, making it easier to visualize ranges and important levels on the chart.
Alerts — system will notify you when a range has been created and also when the price leaves the range.
⭕️ How it works
Extremes (Pivot Points) are taken as a basis, after confirming the relevance of the extremes we take the upper and lower extremes and form a range. We check if it does not violate a number of rules and filters, perform volume calculations, and only then is the range displayed.
Pivot points is a built-in feature that shows an extremum if it has not been updated N bars to the left and N bars to the right. Therefore, there is a delay depending on the bars specified to check, which allows for a more accurate range. This approach allows not to make unnecessary recalculations, which completely eliminates the possibility of redrawing or range changes.
⭕️ Settings
Left Bars and Right Bars — Allows you to define the point that is the highest among the specified number of bars to the left and right of this point.
Range Logic — Select from which point to draw the range. Maximums only, Minimums only or both.
Use Wick — Option to consider the wick of the candles when identifying Range.
Breakout Confirmation — The number of bars required to confirm a breakout, after which the range will close.
Minimum Range Length — Sets the minimum number of candles needed for a range to be considered valid.
Row Size — Number of levels to calculate POC. *Larger values increase the script load.
% Range Filter — Dont Show Range is than more N% of Average Range.
Multi Filter — Allows use of Bollinger Bands, ATR, SMA, or Highest-Lowest range channels for filtering ranges based on volatility.
Range Hit — Shows graphical labels when price hits the upper or lower boundaries of the range, signaling potential reversal or breakout points.
Range Start — Show points where Range was created.

Multi Deviation VWAP [OmegaTools]The Multi Deviation VWAP is an original variation of the traditional VWAP indicator, designed to enhance your trading experience by providing more precise market insights. While the conventional VWAP calculates a single price level based on volume and price over a given period, the Multi Deviation VWAP goes a step further by introducing dynamic upper and lower bands that adapt to market conditions. These bands give traders a more comprehensive understanding of volatility and price action, making it an ideal tool for various trading strategies, especially for identifying potential price reversals or trend continuations.
Key Features:
Separate Calculation of Deviation Bands:
Unlike traditional VWAP bands, where both the upper and lower bands are symmetrically calculated using a single deviation value, the Multi Deviation VWAP calculates the deviations independently for the upper and lower bands. This allows for a more accurate reflection of market dynamics.
The upper deviation band is based on the average distance of closing prices above the VWAP, while the lower deviation band considers the average distance of closing prices below the VWAP.
This separation provides a more tailored approach, adapting to whether the market is showing bullish or bearish momentum, as opposed to a fixed, equal deviation in both directions.
Internal and External Bands:
Two sets of deviation bands are plotted: Internal Bands and External Bands, controlled by user inputs (factorone for internal and factortwo for external). These bands offer multiple levels of support and resistance based on market volatility.
The Internal Bands are closer to the VWAP and act as the first level of support/resistance, suitable for short-term or tighter trading ranges.
The External Bands are further from the VWAP and capture more significant market swings, useful for identifying larger trends or setting wider stop-losses.
Timeframe Flexibility:
The indicator allows traders to select the desired timeframe (1D by default) over which the VWAP and its deviation bands are calculated. This flexibility enables users to adapt the indicator to different trading styles, from intraday scalping to longer-term trend analysis.
Visual Enhancements:
Bullish and Bearish Colors: The bands are color-coded for quick visual interpretation. Bullish bands (lower deviations) are colored blue, while bearish bands (upper deviations) are colored red, making it easy to differentiate between market conditions at a glance.
Plot Fill: The area between the internal and external bands is shaded, providing clear visual zones of potential price containment, aiding in understanding the market structure and anticipating price movements.
How It Differs from a Standard VWAP:
Traditional VWAP provides a single price line that represents the volume-weighted average price over a given period, often used to identify general price trends.
In contrast, the Multi Deviation VWAP introduces upper and lower bands calculated separately based on price deviations above and below the VWAP, giving a more nuanced view of market volatility.
Symmetrical bands in traditional VWAP may not always accurately reflect the market's true behavior, especially in trending markets, where upward and downward price movements aren't always equal. By splitting the deviation calculations, this tool provides a more dynamic and realistic view of price action, adapting to whether the market is showing stronger upward or downward pressure.
Use Cases:
Trend Identification: The VWAP line acts as a central trend line, while the deviation bands offer levels of potential support and resistance. When price moves beyond the external bands, it may indicate overextension and potential reversal.
Volatility Trading: Traders can use the internal and external bands to set dynamic take-profit or stop-loss levels, allowing for flexible risk management depending on market conditions.
Range Trading: In consolidating markets, the Multi Deviation VWAP can help traders identify optimal buy and sell zones as the price oscillates between the upper and lower bands.
By incorporating independent deviation bands, this indicator provides traders with a more responsive tool that reflects market behavior more accurately, helping them make informed trading decisions with enhanced precision.
FCNC SpreadTitle: FCNC Spread Indicator
Description:
The FCNC Spread Indicator is designed to help traders analyze the price difference (spread) between two futures contracts: the front contract and the next contract. This type of analysis is commonly used in futures trading to identify market sentiment, arbitrage opportunities, and potential roll yield strategies.
How It Works:
Front Contract: The front contract represents the futures contract closest to expiration, often referred to as the near-month contract.
Next Contract: The next contract is the futures contract that follows the front contract in the expiration cycle, typically the next available month.
Spread Calculation: frontContract - nextContract represents the difference between the price of the front contract and the next contract.
Positive Spread: A positive value means that the front contract is more expensive than the next contract, indicating backwardation.
Negative Spread: A negative value means that the front contract is cheaper than the next contract, indicating contango.
How to Use:
Input Selection: Select your desired futures contracts for the front and next contract through the input settings. The script will fetch and calculate the closing prices of these contracts.
Spread Plotting: The calculated spread is plotted on the chart, with color-coding based on the spread's value (green for positive, red for negative).
Labeling: The spread value is dynamically labeled on the chart for quick reference.
Moving Average: A 20-period Simple Moving Average (SMA) of the spread is also plotted to help identify trends and smooth out fluctuations.
Applications:
Trend Identification: Analyze the spread to determine market sentiment and potential trend reversals.
Divergence Detection: Look for divergences between the spread and the underlying market to identify possible shifts in trend or market sentiment. Divergences can signal upcoming reversals or provide early warning signs of a change in market dynamics.
This indicator is particularly useful for futures traders who are looking to gain insights into the market structure and to exploit differences in contract pricing. By providing a clear visualization of the spread between two key futures contracts, traders can make more informed decisions about their trading strategies.