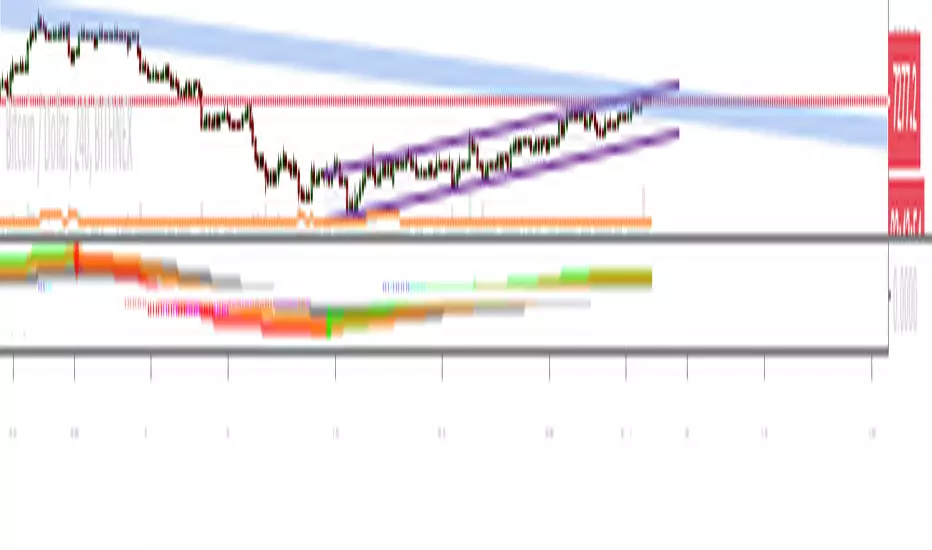
MACD VPT lag issue Most indicator use close as their primary source which is good but side effect of it is the lag in 1-2 candles
I created in the past the VPT indicator which is a volume indicator similar to OBV and I tranform it to be ised as a source insted of close . the reason for it since it a volume based indicator it faster and can help in the lag issue
So this script is just example how i change the source from close and put inside the VPT which make the MACD more responsive and faster
one problem of this indicator is that sometime it overshhot so with you can smooth it with len to desire result
So if you have lag indicator in one or two candels you can use this trick to try to solve it
스크립트에서 "macd"에 대해 찾기
MACD Volume weightedIts a MACD indicator and the only thing I have changed Is that its now volume weighted simple moving averages instead of normal sma.
EURUSD MACD ALERT 1min Long only Alert Script for AutoviewThis is the Alert Script for the EURUSD 1min Long only script. It is also scripted with the Autoview syntax in the message body of the alert to execute Long at market price and sell open orders at market price. These conditions are set based on the EURUSD 1min Long only script posted. You can adjust as needed.

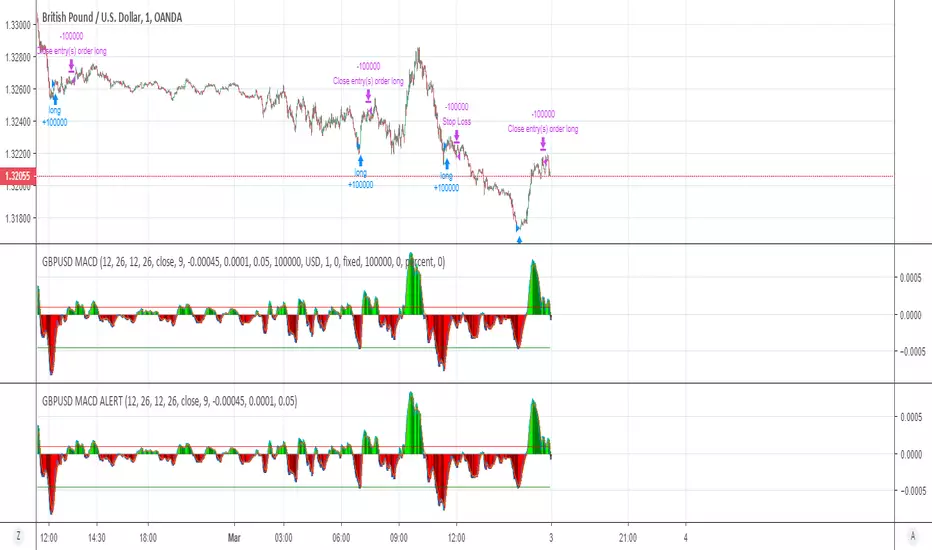
GBPUSD MACD ALERT 1min Long only Alert Script for AutoviewThis is the Alert Script for the GBPUSD 1min Long only script. It is also scripted with the Autoview syntax in the message body of the alert to execute Long at market price and sell open orders at market price. These conditions are set based on the GBPUSD 1min Long only script posted. You can adjust as needed.
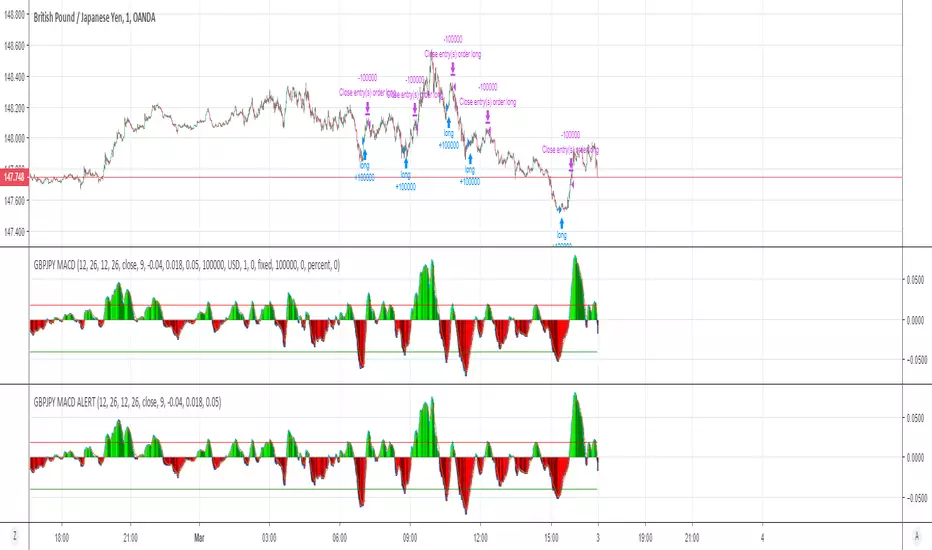
GBPJPY MACD ALERT 1min Long only Alert Script for AutoviewThis is the Alert Script for the GBPJPY 1min Long only script. It is also scripted with the Autoview syntax in the message body of the alert to execute Long at market price and sell open orders at market price. These conditions are set based on the GBPJPY 1min Long only script posted. You can adjust as needed.
Linhvb MACDMACD is quite popular to most traders. This is just a little customization for my trading system that I use 3-8-3 period.

Barssince Playground (Threshold & Persistence)Playground file for implementing MACD with threshold values while visualizing the persistence plot, which counts the amount of spent bars since the MACD delta crossed 0 value in either way.

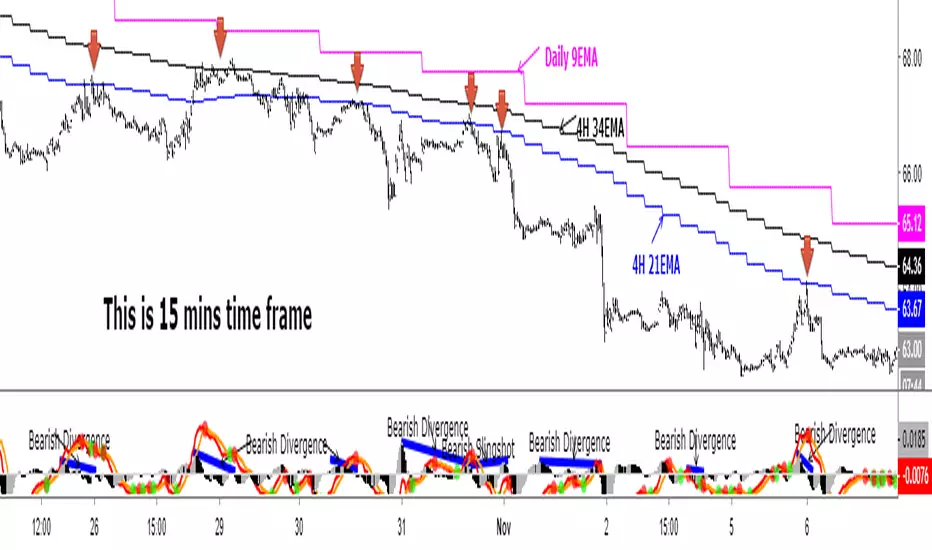
Daily 9 EMA Plotted at Other Than Daily Time Frame
Credit to the great @Zoen Triste for his original script at:
I just amend it for the Daily, 4H and other time frames. The main function of the Daily 9EMA (pink line) is to easily distinguish the big trend. It is also for multi time frames dynamic support / resistance when trading using tf lower than Daily, without having to toggle between the time frames. Everything is there at a single time frame chart. I like to day trade and switch to swing trade when there is a solid setup for it. To be able to do that, I use 15mins tf together with the Daily 9EMA, 4H 34EMA and 4H 21EMA.
How to trade using this setup?
First of all, if price is below the pink line (Daily 9EMA), it means the big trend is downtrend (and vice versa). When price retrace and reach the blue (4H 21EMA) or black (4H 34EMA) or the pink (Daily 9EMA) line (look at the red arrows), if there is bearish divergence / slingshot at the MACD's histogram together with a reversal candle such as pin bar (shooting star), dark cloud cover or bearish engulf, it's a short setup. We don't need to put the Stop Loss immediately. We can wait for the price to resume in the direction of the big trend to trail the SL.
I do add up daily and weekly pivots and trendlines for additional support / resistance for greater confidence. If the above setup occurs at certain pivots and trendline, we'll have a very high probability setup. Please see the zoomed-in chart as below:
When price is above the pink line, the setup is just the opposite.
My conclusion: When day trading using this setup at smaller time frames such as 15mins, we don't have to toggle between 4H and 15min time frames to see where is the EMA21 and EMA34 at 4H for the moment.
It's like we are able to see a microscopic and bird's eye views at the same time using a single time frame chart.
MACD - Combined Histogram & Histogram Line with Zero ScaleScript to combine MACD 'Histogram' & 'Histogram Line' and adds a 'Zero Scale'

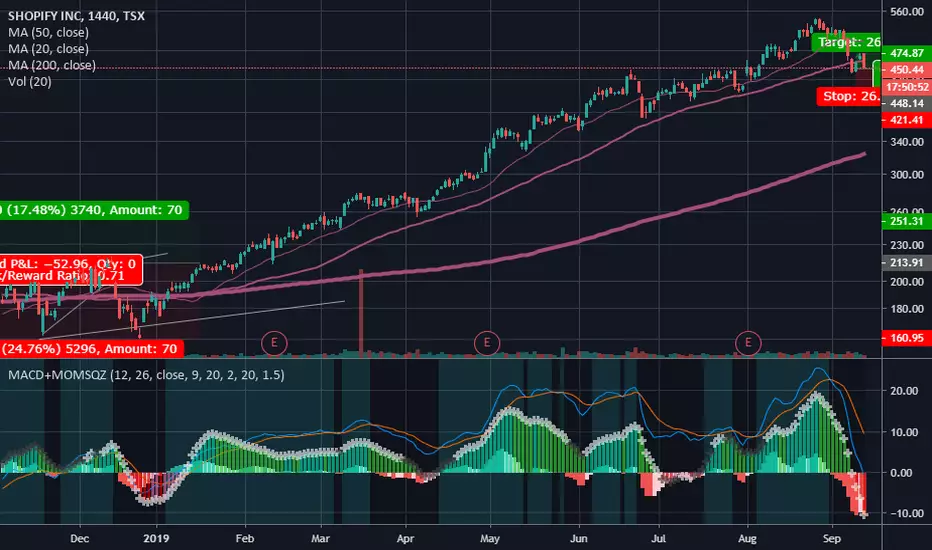
MACD+squeeze+DEMAThis indicator MACD DEMA and Squeeze Momentum from LazyBear and Toff. I combined them and added alert.
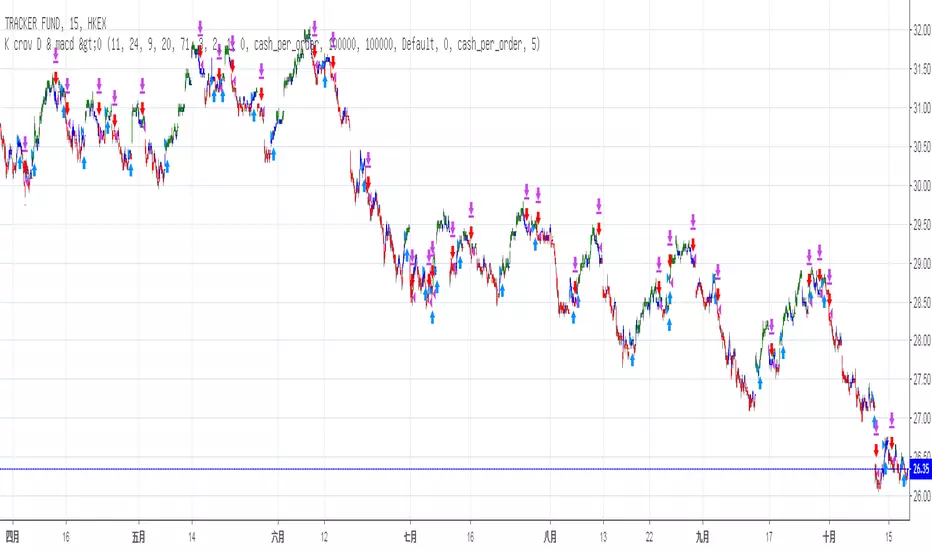
Stochastic & MACD Strategy Ver 1.0This strategy is inspired by ChartArt and jasonluk28.
The following input changes from the initial ChartArt version to achieve higher stability and profit:
Fast MA Len:11
Slow MA len: 24
Stoch Len: 20
No difference is found in minor changes (+-10) lv. of overbought/oversold
It works above 40% winning rate in Heng Heng Index, Shanghai Composite, Dow Jones Industrial Averge, S&P 500 NASDAQ, VT (World Total Market) and in 15 mins chart
Profit: above ~10 to 30% in less than 1year backtest for most major indice of China and US and ~62% in Heng Seng Index (Hong Kong) & 40.5% in SZSE Composite (Shen Zhen)
P.S. Profit: 700 (Tencent) +150.5%, 939 (CCB) +66.5%, 1299 (AIA) +45%, 2628 (CLIC) +41%, 1 (CK Hutchison) +31%
NFLX +82.5%, BABA +55.5%, AMZN +44%, GOOG +38%, MCD +24.5%
However, Loss in FB -19% , AMD -38.5%
Not suitable for stocks with great influences in News or Events ???


MACD of Linear Regression Slope Indicator I used MACD to find peak and trough points in the Linear Regression Slope


The best MACDMACD adjusted with a long-term black signal line and histogram for more consistency in trend indications.