Heatmap - Multi-Timeframe Indicators - StrategyHeatmap - Multi-Timeframe Indicators - Strategy
▪ Main features :
- 19 Timeframes: 1m, 3m, 5m, 10m, 15m, 30m, 45m, 1h, 2h, 3h, 4h, 5h, 6h, 8h, 10h, 12h, 1D, 1W, 1M
- 6 indicators per timeframe
- choose specific timeframes for indicators (example - 1 hour)
- or choose specific timeframe ranges (example - 1 hour to 1 month)
The general idea is that the higher timeframe signals are stronger than the lower timeframe ones.
When a trend is starting, it is first visible on the lower timeframes.
The more time passes, the more the trend propagates through higher timeframes.
The default settings are meant to show all the available features. You may fine-tune it to your specific needs.
How to choose the timeframe for the chart : use the lowest of the choosen timeframes for indicators.
If the heatmap doesn't display correctly on your device, you may check the Heatmap Theme 🎨 setting.
It doesn't repaint.
"Repaint" version available though - good to check the past history, but very bad for real-time analysis.
▪ Indicators used for trend detection
1. MACD Cross
2. Stochastic Cross
3. Stochastic Cross and Overbought or Oversold
4. Moving Average
5. Parabolic SAR
6. Heikin Ashi
▪ Find the best Heatmap settings with the Strategy Tester version.
The signals generated by the Heatmap are considered to be valid at the bar open .
The Strategy Tester, however, uses the bar close in its calculations.
Therefore, the results may seem to be worse than they can be.
The Profitability, Profit Factor and other stats should be taken into consideration relatively to other configurations of the same Heatmap.
▪ Using a score system to consider a change in trend valid.
Example: consider the signal valid if 65% or more of all indicators (max 6) among all timeframes (max 19) hint at a change in trend.
The % percent value can be inserted in settings.
When using the default settings or when all timeframes and indicators are activated,
the ratio of 100% downtrend or 100% uptrend may be less occuring. Adjust accordingly.
The signals across timeframes and indicators are aggregated to show simple entry and exit signals.
▪ Combined Alerts, to be set to fire once per bar open :
0 - 📈 Long! - Heatmap - Multi-TFI
0 - 📈 Short! - Heatmap - Multi-TFI
0 - 📈 Long Exit! - Heatmap - Multi-TFI
0 - 📈 Short Exit! - Heatmap - Multi-TFI
1 *** BUY or SELL (single alert) ***
1 *** Entries or Exits (single alert) ***
▪ Note : The initial load may be slow. If something doesn't seem to work, you can try the following:
- wait more time for it to load
- hide & show or remove & add back to chart
- don't add the indicator to chart multiple times in a short amount of time, as you may be rate limited
▪ Related Studies :
- Heatmap - Multi-Timeframe Indicators - Alerts
- Risk Management System (Stop Loss, Take Profit, Trailing Stop Loss, Trailing Take Profit) - it can be connected to Heatmap - Multi-Timeframe Indicators - Alerts
▪ Layout example:
스크립트에서 "macd"에 대해 찾기

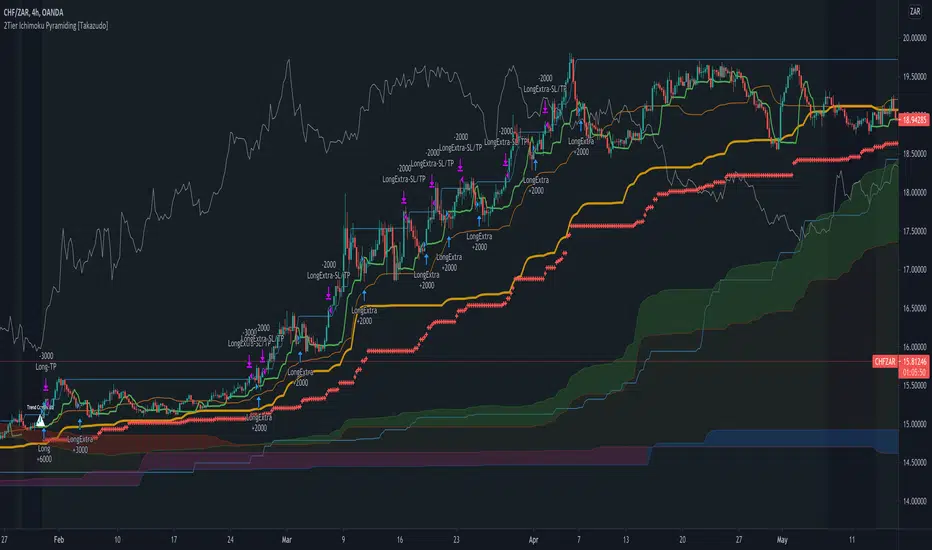
2Tier Ichimoku Pyramiding [Takazudo]Ichimoku based pyramiding strategy example that was tested on 4h TF.
makes the first entry when 2Tier Kumo breakout was occurred.
makes the extra entries when higher-low (on long) or lower-high (on short) was occurred.
uses short term MACD reversal + stop entry as a confirmation of the trend.
slack trailing stop loss.
changes entry quantity by the percentage of SL.
prevents the ranged entry.
This is just an example of how to trade using Ichimoku signals.
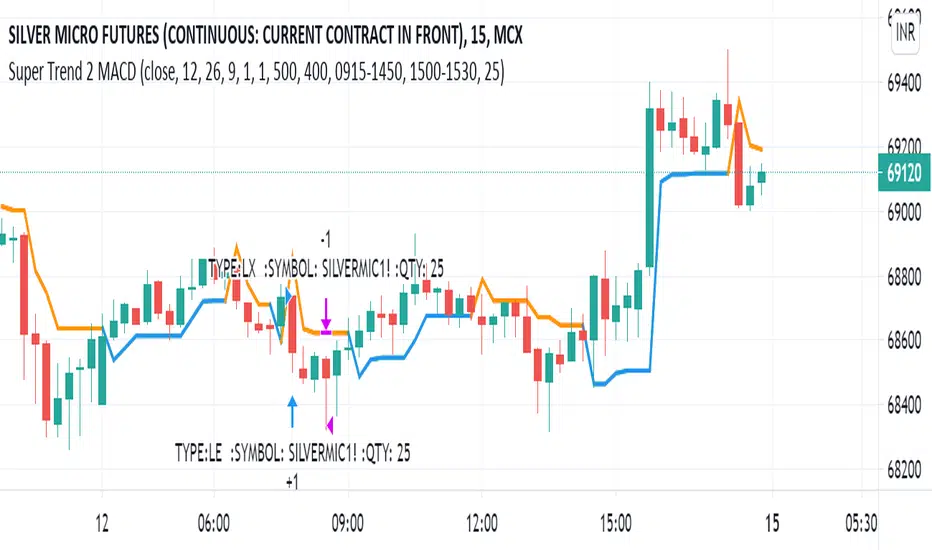
Super Trend 2 MACD pk singhalYou can automate complete strategies, and not just indicators using the TradingView free version. That’s right! explore 1000s of strategies from public library using free Tradingview and free APIBridge (paper trading). We will demonstrate this using SuperTrend strategy (not SuperTrend indicator).
Ultimate Strategy TemplateHello Traders
As most of you know, I'm a member of the PineCoders community and I sometimes take freelance pine coding jobs for TradingView users.
Off the top of my head, users often want to:
- convert an indicator into a strategy, so as to get the backtesting statistics from TradingView
- add alerts to their indicator/strategy
- develop a generic strategy template which can be plugged into (almost) any indicator
My gift for the community today is my Ultimate Strategy Template
Step 1: Create your connector
Adapt your indicator with only 2 lines of code and then connect it to this strategy template.
For doing so:
1) Find in your indicator where are the conditions printing the long/buy and short/sell signals.
2) Create an additional plot as below
I'm giving an example with a Two moving averages cross.
Please replicate the same methodology for your indicator wether it's a MACD, ZigZag, Pivots, higher-highs, lower-lows or whatever indicator with clear buy and sell conditions
//@version=4
study(title='Moving Average Cross', shorttitle='Moving Average Cross', overlay=true, precision=6, max_labels_count=500, max_lines_count=500)
type_ma1 = input(title="MA1 type", defval="SMA", options= )
length_ma1 = input(10, title = " MA1 length", type=input.integer)
type_ma2 = input(title="MA2 type", defval="SMA", options= )
length_ma2 = input(100, title = " MA2 length", type=input.integer)
// MA
f_ma(smoothing, src, length) =>
iff(smoothing == "RMA", rma(src, length),
iff(smoothing == "SMA", sma(src, length),
iff(smoothing == "EMA", ema(src, length), src)))
MA1 = f_ma(type_ma1, close, length_ma1)
MA2 = f_ma(type_ma2, close, length_ma2)
// buy and sell conditions
buy = crossover(MA1, MA2)
sell = crossunder(MA1, MA2)
plot(MA1, color=color_ma1, title="Plot MA1", linewidth=3)
plot(MA2, color=color_ma2, title="Plot MA2", linewidth=3)
plotshape(buy, title='LONG SIGNAL', style=shape.circle, location=location.belowbar, color=color_ma1, size=size.normal)
plotshape(sell, title='SHORT SIGNAL', style=shape.circle, location=location.abovebar, color=color_ma2, size=size.normal)
/////////////////////////// SIGNAL FOR STRATEGY /////////////////////////
Signal = buy ? 1 : sell ? -1 : 0
plot(Signal, title="🔌Connector🔌", transp=100)
Basically, I identified my buy, sell conditions in the code and added this at the bottom of my indicator code
Signal = buy ? 1 : sell ? -1 : 0
plot(Signal, title="🔌Connector🔌", transp=100)
Important Notes
🔥 The Strategy Template expects the value to be exactly 1 for the bullish signal , and -1 for the bearish signal
Now you can connect your indicator to the Strategy Template using the method below or that one
Step 2: Connect the connector
1) Add your updated indicator to a TradingView chart
2) Add the Strategy Template as well to the SAME chart
3) Open the Strategy Template settings and in the Data Source field select your 🔌Connector🔌 (which comes from your indicator)
From then, you should start seeing the signals and plenty of other stuff on your chart
🔥 Note that whenever you'll update your indicator values, the strategy statistics and visual on your chart will update in real-time
Settings
- Color Candles : Color the candles based on the trade state (bullish, bearish, neutral)
- Close positions at market at the end of each session : useful for everything but cryptocurrencies
- Session time ranges : Take the signals from a starting time to an ending time
- Close Direction : Choose to close only the longs, shorts, or both
- Date Filter : Take the signals from a starting date to an ending date
- Set the maximum losing streak length with an input
- Set the maximum winning streak length with an input
- Set the maximum consecutive days with a loss
- Set the maximum drawdown (in % of strategy equity)
- Set the maximum intraday loss in percentage
- Limit the number of trades per day
- Limit the number of trades per week
- Stop-loss: None or Percentage or Trailing Stop Percentage or ATR
- Take-Profit: None or Percentage or ATR
- Risk-Reward based on ATR multiple for the Stop-Loss and Take-Profit
This script is open-source so feel free to use it, and optimize it as you want
Alerts
Maybe you didn't know it but alerts are available on strategy scripts.
I added them in this template - that's cool because:
- if you don't know how to code, now you can connect your indicator and get alerts
- you have now a cool template showing you how to create alerts for strategy scripts
Source: www.tradingview.com
I hope you'll like it, use it, optimize it and most importantly....make some optimizations to your indicators thanks to this Strategy template
Special Thanks
Special thanks to @JosKodify as I borrowed a few risk management snippets from his website: kodify.net
Additional features
I thought of plenty of extra filters that I'll add later on this week on this strategy template
Best
Dave

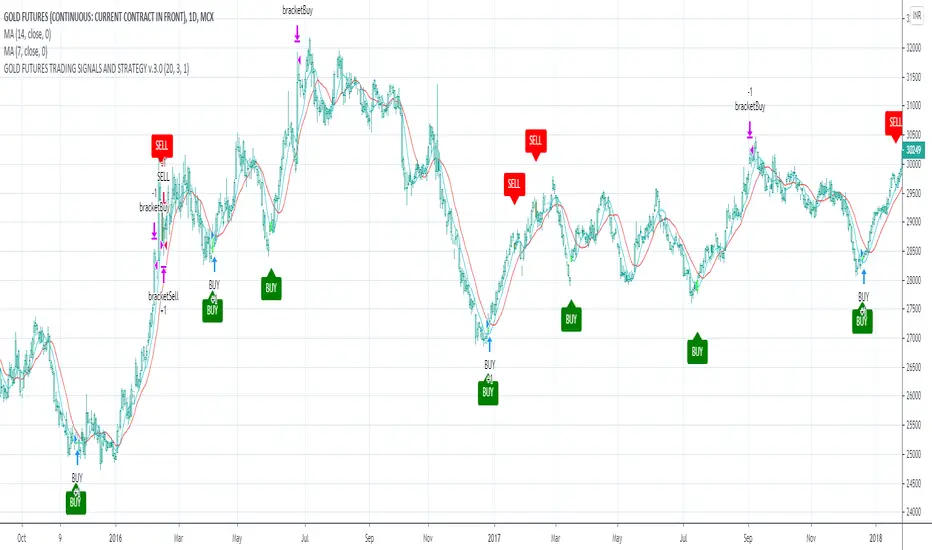
GOLD FUTURES TRADING STRATEGY AND SIGNALS WITH PERFORMANCE GOLD FUTURES GOLD1! , GOLDM , GC Trading Strategy And Signals, With Performance For Different Time Frames.
We present to your attention an indicator that, based on a strategy, generates buy / sell arrow signals and a gold futures trading strategy, which has shown its effectiveness in numerous tests on different time frames.
The strategy is based on a combination of ATR, Moving Average, MACD and RSI indicators.
If you consider gold as a tool for earning then active trading on the exchange, your choice is gold futures (gold futures). This derivative almost completely copies the movement of the price of physical gold, and is used by traders around the world to obtain from the fluctuations in the price of gold.
The strategy showed the best results for timeframes: H1, H2, H4, D1.
Recommended timeframe for this strategy: D1.
The strategy uses take-profit and stop-loss, which reduces risk and allows you to effectively use its trading, as well as the process of making trading decisions and predicting the movement of the gold price.
Gold and silver futures can be used to hedge against inflation, speculative play, an alternative investment grade, or as a commercial hedging method for investors looking for opportunities beyond traditional equities and fixed income securities.
The script can generate alters "Buy" and "Sell".
The presented indicator of signals for gold futures, as well as the strategy, can complement your existing strategy and increase its performance, and can also be considered as an independent trading strategy for gold futures contracts.
Full Screenshot chart with performance here.
Companion::DivergentCompanion::Divergent is a combined indicators strategy optimized for Bitcoin Markets and tested on Bitfinex.
Mainly, it is an Ichimoku based strategy.
Used indicators:
- Ichimoku (displayed on chart): trendline analysis;
- Double Hull MA (displayed on chart): trendline analysis;
- MACD (not displayed): confirmative/momentum detection;
- CCI (not displayed): confirmative/momentum detection;
- ATR: used toghether with Ichimoku to determine Stop Loss/Take Profit levels;
- VWMA: For implementing trailing stop orders based on volumes.
What the script does:
- determines trendlines combining mulitple indicators;
- automaticlally calculates Take profit and Stop Loss levels;
- permits automation generating Autoview signals;
- supports for margin trading. Spot trading will be added in the future.
It can be used on 1D or 1H timeframes but it can be adapted for other time frames tweaking the parameters. I used it a lot on Bitfinex on 1H timeframes. Please check parameters: if you will use the strategy on D or higher timeframes, the "Legacy Chikou analysis" option should be checked.
BACKTESTING
Backtest is not leveraged. Defaults are set as follow:
Capital: 10000
Percent of equity used for trades: 10%
Commission: 0.18% this is Bitfinex commission on orders
Change them accordingly on how you trade to get a more realistic backtest results.

Joseph Nemeth Heiken Ashi Renko MTF StrategyFor Educational Purposes. Results can differ on different markets and can fail at any time. Profit is not guaranteed. This only works in a few markets and in certain situations. Changing the settings can give better or worse results for other markets.
Nemeth is a forex trader that came up with a multi-time frame heiken ashi based strategy that he showed to an older audience crowd on a speaking event video. He seems to boast about his strategy having high success results and makes an astonishing claim that looking at heiken ashi bars instead of regular candlestick bar charts can show the direction of the trend better and simpler than many other slower non-price based indicators. He says pretty much every indicator is about the same and the most important indicator is price itself. He is pessimistic about the markets and seems to think it is rigged and there is a sort of cabal that created rules to favor themselves, such as the inability of traders to hedge in one broker account, and that to win you have to take advantage of the statistics involved in the game. He believes fundamentals, chart patterns such as cup and handle and head and shoulders, and fibonacci numbers don't matter, only price matters. The foundation of his trading strategy is based around heiken ashi bars because they show a statistical pattern that can supposedly be taken advantage of by them repeating around seventy or so percent of the time, and then combines this idea with others based on the lower time frames involved.
The first step he uses is to identify the trend direction in the higher time frame(daily or 4 hourly) using the color of the heiken ashi bar itself. If it is green then take only long position after the bar completes, if it is red then take only short position. Next, on a lower time frame(1 hour or 30 minutes) look for the slope of the 20 exponential moving average to be sloping upward if going long or the slope of the ema to be sloping downward if going short(the price being above the moving average can work too if it's too hard to visualize the slope). Then look for the last heiken ashi bar, similarly to the first step, if it is green take long position, if it is red take short position. Finally the entry indicator itself will decide the entry on the lowest time frame. Nemeth recommends using MACD or CCI or possibly combine the two indicators on a 5 min or 15 min or so time frame if one does not have access to renko or range bars. If renko bars are available, then he recommends a 5 or 10 tick bar for the size(although I'm not sure if it's really possible to remove the time frame from renko bars or if 5 or 10 ticks is universal enough for everything). The idea is that renko bars paint a bar when there is price movement and it's important to have movement in the market, plus it's a simple indicator to use visually. The exit strategy is when the renko or the lowest time frame indicator used gives off an exit signal or if the above conditions of the higher time frames are not being met(he was a bit vague on this). Enter trades with only one-fifth of your capital because the other fifths will be used in case the trades go against you by applying a hedging technique he calls "zero zone recovery". He is somewhat vague about the full workings(perhaps because he uses his own software to automate his strategy) but the idea is that the second fifth will be used to hedge a trade that isn't going well after following the above, and the other fifths will be used to enter on another entry condition or if the other hedges fail also. Supposedly this helps the trader always come out with a profit in a sort of bushido-like trading tactic of never accepting defeat. Some critics argue that this is simply a ploy by software automation to boost their trade wins or to sell their product. The other argument against this strategy is that trading while the heiken ashi bar has not completed yet can jack up the backtest results, but when it comes to trading in real time, the strategy can end up repainting, so who knows if Nemeth isn't involving repainting or not, however he does mention the trades are upon completion of the bar(it came from an audience member's question). Lastly, the 3 time frames in ascending or descending fashion seem to be spaced out by about factors of 4 if you want to trade other time frames other than 5/15min,30min/1hour, or 4hour/daily(he mentioned the higher time frame should be atleast a dozen times higher than the lower time frame).
Personally I have not had luck getting the seventy+ percent accuracy that he talks about, whether in forex or other things. I made the default on renko bars to an ATR size 1 setting because it looks like the most universal option if the traditional mode box size is too hard to guess, and I made it so that you can switch between ATR and Traditional mode just in case. I don't think the strategy repaints because I think TV set a default on the multi-time frame aspects of their code to not re-paint, but I could be wrong so you might want to watch out for that. The zero zone recovery technique is included in the code but I commented it out and/or remove it because TV does not let you apply hedging properly, as far as I know. If you do use a proper hedging strategy with this, you'll find a very interesting bushido type of trading style involved with the Japanese bars that can boost profits and win rates of around possibly atleast seventy percent on every trade but unfortunately I was not able to test this part out properly because of the limitation on hedging here, and who knows if the hedging part isn't just a plot to sell his product. If his strategy does involve the repainting feature of the heiken ashi bars then it's possible he might have been preaching fools-gold but it's hard to say because he did mention it is upon completion of the bars. If you find out if this strategy works or doesn't work or find out a good setting that I somehow didn't catch, please feel free to let me know, will gladly appreciate it. We are all here to make some money!

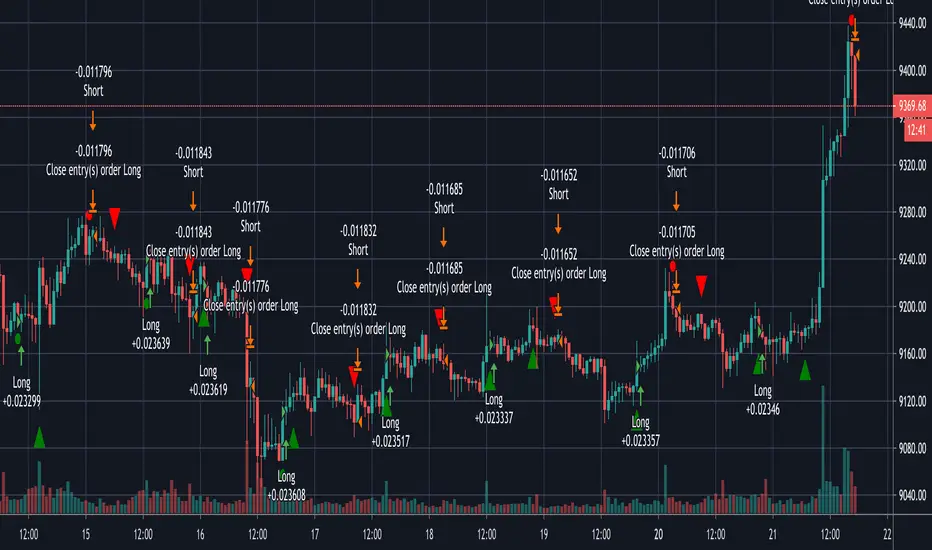
Ultimate multi-indicator strategy and script- AlphaNHBI created this to be the best multi-indicator strategy, with a matching alert script. This script is ideal for beginners, as well experienced traders who need direct indicators without any of the flashy unnecessary features. This script gets right to the point.
This strategy code was designed for the best mixture of most common indicators, allowing the user to mix and match any indicator he/she chooses. You are able to use sell signals that are either take profits and sell signals, or you are able to use the sell signals of one, or more indicators, OR you can use both (sell signals of indicators AND take profits and stop losses.)
Buying indicators allow you to use the MACD , stochastics, RSI , moving average, fibonacci, t3, Bollinger bands , fractals, and more.
This script works on anything with a chart. It can be applied to crypto, stocks, bonds, forex, etc.
If you would like the script that matches this strategy so that you can do REAL TRADING with LIVE TIME ALERTS, please DM me.
If anyone has suggestions on how to make this better, let me know! This is a growing script that I am building to be universally solid through different markets and through different market conditions!
The details of this backtest are the following:
Initial Capital: 5000
Order Size: 25%
Pyramiding: 10 (although, I don't usually use pyramiding myself, and you don't need to and you will still be largely profitable, by pyramiding definitely helps with smoothing results.)
Commission: 0.1% to match Binance fees

BUY/SELL_Strategy_Paydar_V.07BUY/SELL_Strategy_Paydar_V.07
Hello dear friends
This system can be considered as a signal system.
*** This system just Suggests you for points. ***
My suggestion is not to use this system alone and conclude about entry and exit points according to charts, news, market fluctuations and trend direction.
The agenda of this system is as follows:
- Buy signal means:
Time to enter the trade / buy / take a long position and ...
- Sell signal means:
Time to leave the trade / sell / exit the long position
* I suggest you use this system in trading for cryptocurrency and especially for bitcoin.
* My suggested time frame is 1 minute, because during this time and according to the settings of this system, a better result was obtained for me.
* I suggest using this system first in spot trading and then in future trading.
System function:
This system is based on the analysis of 74 different systems, which are:
> 19 indicators and oscillators separately which include:
MACD, RSI, STOCHASTIC, STOCHASTIC RSI, BOLLINGER BANDs, PARABOLIC SAR, VOLATILITY and ...
(All of which can be used on the Trading View site as a public domain and open source)
> 11 cases of previous oscillators and indicators in combination
(All of which can be used in public view and open source on the Trading View site)
> 27 items MA, EMA, VMA, WM, MSM, etc. in combination and separately
> 9 lines and areas of automatic support and resistance
(All of which can be used in public view and open source on the Trading View site)
> 8 different strategies, all of which can be used in public view and open source on the Trading View site
Points.
*** All indicators, oscillators, lines and areas of automatic support and resistance, strategies, etc. can be used as a public domain and open source on the Trading View site. ***
Comment on using this system as well as how to use it.
_______________________________________________________________________________
* In this system, the main and basic indicators and oscillators are used, all of which are in the public view and open source site in Trading View *
I am very grateful and very loyal to Trading View, which built all the indicators, oscillators and strategies, because I used them to build this strategy system.
_______________________________________________________________________________
Be successful and profitable.

Profitable Strategy Forex 80 by LukasHello all,
Herewith I publish my Forex strategy, it's works for major pairs only.
I ran more than a thousand test to get this result! :))
The strategy have more than 8 Buy and Sell signal condition with 2 core signal provider.
You can turn on/off each 7 signal and find the most profitable combination for each pairs.
If you trade on lower timeframe, you can turn on "Higher Timeframe MA".
It's also will trigger buy/sell when breakout from monthly high / low when entry condition meets.
You can set weekly or monthly.
I work on 4H timeframe when develop the script, so best use is 4H.
Basically i want to make reliable strategy that can automate trade
without the need to check chart every minutes! Hahha
So i think higher time frame is the best time to start,
and I found 4H chart on Forex have more clear structure and volatility .
I make the signal visible, it consist of 3 line represent The Pairs, Base and Counter pairs,
basically when Green line on top it means Base currency is strong, vice versa.
You may share your setting in the comment section, so others can try it :)
For this result I turn on Signal A,C,D,E,F
Signal A and B use special RSI
Signal C and D use special MACD
Signal E use RSI
Signal F use EMA and DEMA combination
In my opinion each pairs has unique character, some of them move faster than others.
So, adjust the setting for each pairs will benefit you more.
For further develop of this strategy, please give me feedback! :)

Bitcoin (BTC) Scalp / Short-term Short IndicatorThe purpose of this scalping Indicator is to help identifying Sell signals for short term trades on Bitcoin (Spot, Features, etc.) .
This script is working with more indicators and everything is balanced by hard work on (back)testing.
Result for users is a simple signal to SELL.
You can use it as easy indicator in your graph or create alerts.
I have the best results on 1min graph, with leverage and stop-loss feature.
This is my own version of scalping Sell Script / Indicator, which is a combination of few indicators, for example RSI , BB and price levels (actual and average) and works on standard candles.
SELL signal paints above the candle and you can set your target / trailing / stop-loss in the settings and check how it works in Strategy Tester.
Settings of this Indicator:
Take Profit
Stop Loss
Trailing Stop Loss
Trailing Stop Loss Offset
Initial Capital
Base Currency
Order size
Pyramiding
Commissions
Slippage
Average price lines (colors and visibility)
Plot background
These signals can be often observed at the beginning of a strong move, but there is a significant probability that these price levels will be revisited at a later point in time again.
Therefore these are interesting levels to place limit orders.
A Sell signal is defined as the last up candle before a sequence of down candles.
In my trading settings I have more but small positions, one safety limit order (for price averaging = better entry - easier close in profit) and stop-loss.
Sometimes trailing-profit feature have very nice profits.
Settings depends on your own money-management and free capital.
Don't ignore UP / DOWN trend. For UP trend I have an Indicator too (check my profile).
In addition to the upper/lower limits of each line, also average value is marked as this is an interesting area for price interaction and better view.
PM me to obtain access, more informations or support.
NOTICE: By requesting access to this script you acknowledge that you have read and understood that this is for research purposes only and I am not responsible for any financial losses you may incur by using this script.

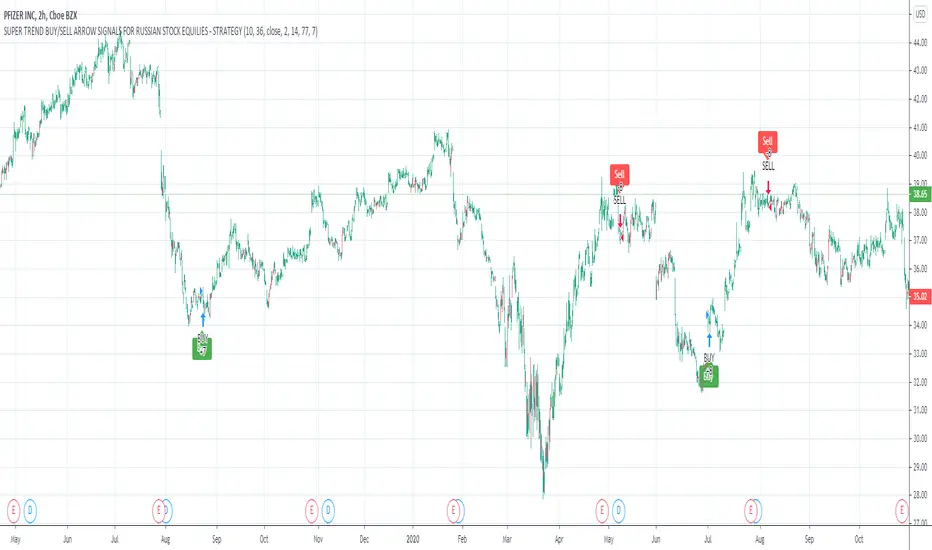
Pfizer (PFE) Buy/Sell Arrow Signals Indicator With Strategy Currently, pharmaceutical companies such as Pfizer NYSE:PFE , which are involved in the development of a vaccine against the virus and are showing success, are attractive to investors. The Pfizer NYSE:PFE Buy and Sell Arrow Signals Indicator With Performance is designed for trading Pfizer assets. This script analyzes historical data and current quotes and generates Buy and Sell trading signals. The indicator is based on a combination of large and small period moving averages combined with the ATR, MACD indicator. Bollinger Bands indicator is used for filter. Also shown is the performance of a strategy based on the Pfizer NYSE:PFE Buy / Sell Signals indicator.
prntscr.com
This Indicator works for timeframe 2H, 4H.
This script can also help identify trend and pivot points. It will be useful for active traders and investors who trade US stocks.
Bitcoin (BTC) Scalp / Short-term Long IndicatorThe purpose of this scalping Indicator is to help identifying Buy signals for short term trades on Bitcoin (Spot, Features, etc.) .
This script is working with more indicators and everything is balanced by hard work on (back)testing.
Result for users is a simple signal to BUY .
You can use it as easy indicator in your graph or create alerts.
I have the best results on 1min graph, with leverage and stop-loss feature.
This is my own version of scalping Buy Script / Indicator, which is a combination of few indicators, for example RSI, BB and price levels (actual and average) and works on standard candles .
LONG signal paints below the candle and you can set your target / trailing / stop-loss in the settings and check how it works in Strategy Tester .
Settings of this Indicator:
Take Profit
Stop Loss
Trailing Stop Loss
Trailing Stop Loss Offset
Initial Capital
Base Currency
Order size
Pyramiding
Commissions
Slippage
Average price lines (colors and visibility)
Plot background
These signals can be often observed at the beginning of a strong move, but there is a significant probability that these price levels will be revisited at a later point in time again.
Therefore these are interesting levels to place limit orders.
A Buy signal is defined as the last down candle before a sequence of up candles.
In my trading settings I have more but small positions, one safety limit order (for price averaging = better entry - easier close in profit) and stop-loss.
Sometimes trailing-profit feature have very nice profits.
Settings depends on your own money-management and free capital.
In addition to the upper/lower limits of each line, also average value is marked as this is an interesting area for price interaction and better view.
PM me to obtain access, more informations or support.
NOTICE: By requesting access to this script you acknowledge that you have read and understood that this is for research purposes only and I am not responsible for any financial losses you may incur by using this script.

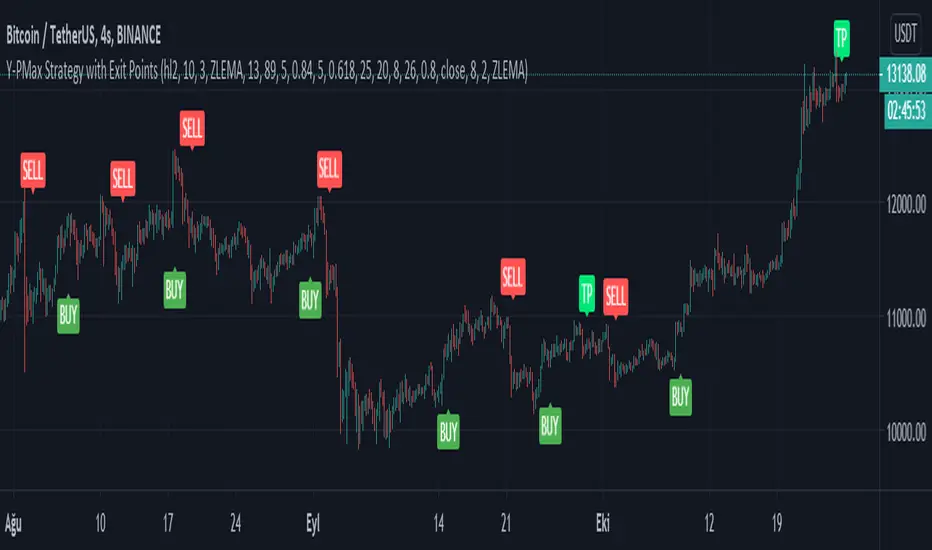
Y-Profit Maximizer Strategy with Exit PointsThis script based on KivancOzbilgic 's PMax indicator. I modified a bit. Added Filters, Exit (TP) Levels and few indicator in it. This script opening only Long Positions.
I have used this indicators in this strategy:
-Moving Stop Loss (Most) by ceyhun
-PMax Explorer STRATEGY & SCREENER
-Bollinger Bands on Macd
-Tillson T3 Moving Average by KIVANÇ fr3762
I am open to suggestions for improve this script.
PS: Script is in Turkish Language.
Higher High / Lower Low StrategyThis is a very simple trend following strategy for Day Trading. The premise is to follow the Moving Average for the trend direction and buy/sell the dips and blips in the trend.
1. In an uptrend, when the candle action offers a "dip", or a lower high, the strategy will then buy on the close of the candle that breaks the high of the previous candle.
2. In a downtrend, when the candle action offers a"blip", or a higher low, the strategy will then sell on the close of the candle that breaks the low of the previous candle.
3. The strategy will go Long only or Short only, not both. It must be manually reversed in the settings when a new trend is established.
4. The start month and year allow you to backtest from then until now. It's not one month at a time.
5. The strategy uses a reversal of the Stochastic %K variable as the exist. The setting for Period K controls the exit for backtesting purposes.
6. The strategy uses a moving average to determine the trend. The setting for the Period MA controls the SMA.
7. The strategy has the option of filtering the number of trades based on the direction of the MACD and/or the Signal line. This can either reduce or increase the probability, and is highly dependent on the price action of the instrument.
WARNING: I am not a licensed financial advisor. This script is intended for entertainment purposes only. I highly recommend you manually enter and exit positions per your own Trading Rules, and do not blindly follow any software or recommendation. Use of this script is elective and at your own discretion, and risk.
If you like this script, please give it a Thumb's Up, and leave a comment. If you would like any custom scripts developed, contact me to discuss it. All of my work here is open and available, free of charge. It can be copied and edited to suit your needs.

ELLIPSE: Bidirectional Swing Trading Strategy (Strategy Version)The eternal question that has occupied humanity since its early existence is what is the meaning of life and why am I here? On a daily basis this quest for meaning is distilled into a somewhat simpler question: What is the reason for getting up every morning?
For many of us, these thoughts arise even more as autumn arrives and it gets dark, bleak and cold outside. I guess it is easier to forget about the meaning of your life, while swimming on a sandy beach, enjoying a cocktail. Than you are living you life and you don’t need to rationalize it. Everything makes perfect sense!
In winter however, you need to get more “creative”. I, for example, would always try to change my perspective of things by doing something that makes my heart beat faster, like drinking a bottle of Heineken on a Friday evening or having endless conversations with my mates about stupid things, or kicking a ball against BALLONTHEROOF 7 on a Saturday morning. During the week, I would take out my frustrations on the fitness equipment at the local gym.
But what if all of this is canceled by CORONA? All that’s left is to work for the boss and run your 10km lap twice a week. The question is, what do you do now, with this huge amount of ”free” time than any old person would give anything for. When you are young time is never ending, when you are older it is never enough. Time has reached a different dimension in these days.
However, you can still do 2 things. You can slowly let the walls come to you and give up or you can actually do something useful with your time and find something that you are good at.
For us this choice was easy. After the success of our positioning trading strategy the MATRIX, at the time of the corona lockdown, we started making a swing trading strategy for the 4H timeframe, called ELLIPSE. We have included all feedback and any improvements we received about the positioning strategy and integrated it into the 4H script.
The main requirements of the script that we had set ourselves were:
Bidirectional
Low max drawdown
High profit factor
Works on all main crypto coins
By fully focusing ourselves on the script over the past few months, I can’t help but (unhumbly) say that we have not only succeeded in our mission, but that we have absolutely surpassed ourselves!
The only bright spot in this heavy corona time is, if a drug becomes available, there is extra money in the bank!
***The script is invite-only, message us to get script access***
-------------------------------------------------------------------------------------------------
User Guidelines:
The trading strategy was designed and optimized for trading cryptocurrencies only; furthermore it works best on established cryptocurrencies that have a clear historical trend such as:
BTCUSD
ETHUSD
LTCUSD
XRPUSD
ADAUSD
The trading strategy is based on swing trading methodology. The script must therefore be used on 4h candles only .
Use USD trading pairs only (e.g. use ETHUSD instead of the ETHBTC) since the individual trend is captured more effectively and therefore gives better results.
The trading strategy is bidirectional , both long and short entries are generated.
-------------------------------------------------------------------------------------------------
Indicators used in this strategy:
Ichimoku Cloud ; acts as the leading indicator.
Volume ; without strong volume , a market move is not valid.
MACD and Vortex ; both being used as confirmation indicators.
Choppiness index ; avoids trading in choppy markets.
Simple and Exponential Moving Averages ; prevents trading against the trend.
The trading strategy is easy to use, bidirectional, trend based and without repainting, meaning once a signal has been made it is permanent and that no future data is used in the decision making. It detects the trend and filters out market noise based on more than 10 technical indicators. ONLY when all indicators align with each other the algorithm prints a LONG or SHORT signal. The trading strategy provides high probability trading signals and minimizes risk! This script aims to capture the profit from short to medium trending moves and by doing so filters out non-substantial trends and avoids the associated risks with these trades.
-------------------------------------------------------------------------------------------------
Features:
NO Repaint once candle is closed.
Stop loss feature ; set your own stop loss to manage your risks.
Customizable Display for the Ichimoku cloud indicator display.
Bidirectional ; both long and short trading positions can be enabled.
Full backtest feature ; Easily generate your own backtest results for each asset (Strategy Version Script).
Alerts ; Get notified via email / pop-up / sms / app once a signal is given! (Alert Version Script).
-------------------------------------------------------------------------------------------------
Backtest results
Below are the back test results. Only well established cryptocurrencies are displayed with a clear historical trend:
Long and short trading positions,
Signal to signal trading (no multiple orders),
Initial Capital: 10 000 USD,
Order size: 10% of equity per trade,
commission fee 0.1%, period: start of chart,
Exchange-----Asset------Timeframe---Percent Profitable----Profit Factor---Total Trades----Max Drawdown----------Net Profit------
Bínance------BTCUSDT------4H-----------------54.4---------------5.32-----------------57----------------1.58%------------40.34%-(4034 USD)
Bínance------ETHUSD-------4H-----------------50.9---------------5.01---------------- 57----------------2.96%------------54.93%-(5493 USD)
Bínance------LTCUSD--------4H-----------------61.0---------------5.08-----------------59----------------2.09%------------57.06%-(5706 USD)
Bínance------XRPUSD-------4H-----------------43.13--------------3.52-----------------51----------------2.42%------------43.13%-(4313 USD)
Bínance------ADAUSD-------4H-----------------57.5---------------3.36-----------------47----------------3.46%------------40.82%-(4082 USD)
-------------------------------------------------------------------------------------------------
Reminder: Use this trading strategy at your own risk and trade responsibly. We are not responsible for any financial loss using this strategy.
***The script is invite-only, message us to get script access***

hc,bitmexi have tweaked the algorithm to use the difference in MACD to get the correct direction of entries rather than using direction of candles which are not always indicative of trend direction. These changes increase net profit, profitable trades, while reducing drawdown.
What is going on here? This strategy is pretty simple. We start by measuring a very long chunk of volume history on BitMEX:XBTUSD 1 hour chart to find out if the current volume is high or low. At 1.0 the indicator is showing we are at 100% of normal historical volume . The blue line is a measure of recent volume! This indicator gets interested when the volume drops below 90% of the regular volume (0.9), and then comes back up over 90%. There's usually a pump of increased price activity during this time. When the 0.9 line is crossed by the blue line, the indicator surveys the last 2 bars of price action to figure out which way we're going, long or short. Green is long. Red is short. To exit the trade we use a 7 period fast ema of the volume crossing under an 11 ema slower period which shows declining interest in the market signifying an end to the pump or dump. The profit factor is quite high with 5x leverage, but historically we see 50% drawdown -- very risky. 1x leverage looks nice and tight with very low drawdown. Play with the inputs to see what matches your own risk profile. I would not recommend taking this into much lower timeframes as trading fees are not included in the profit calculations. Please don't get burned trading on stupid high leverage. This indicator is probably not going to work well on alts, as Bitcoin FOMO build up and behavior is different. This whole indicator is tuned to Bitcoin , and attempts to trade only the meatiest part of the market moves.

The Profit Gate | Tier 1 Script | v1.0.0This script is used to optimized the trend of the stock based on volume , and many kind of moving average. You can use this to swing, or get the idea of long hold play. This work for Crypto as well as penny stock.
This script is best for Penny Stock, Big Cap, Crypto. It is generally based on the idea of averaging move of previous candles as well as current volume . This means if we have our candles at 15m, it will capture bunch of previous candles up to 10 years ahead to get an average move. This will give us a prediction of whether or not a stock will move up (Buy), or go down (Sell).
General Buy|Sell Tier 1
This script is used to optimized the trend of the stock based on volume , and many kind of moving average. You can use this to swing, or get the idea of long hold play. This work for Crypto as well as penny stock.
This script is best for Penny Stock, Big Cap, Crypto. It is generally based on the idea of averaging move of previous candles as well as current volume . This means if we have our candles at 15m, it will capture bunch of previous candles up to 10 years ahead to get an average move. This will give us a prediction of whether or not a stock will move up (Buy), or go down (Sell).
We also use Binary entropy function to optimize the original MACD .
This indicator should be able to tell you where to get in, out, or start to set trailing stop loss on the current position. I will constantly update this algorithm.
Trend analysis, This is ridge model that take in past data from the nearest certain number of candles then predict the next trend by an algorithm.
We also have standard deviation so we can apply it to find the best strike price with the highest probability to get ITM
Please DM me for access to this script

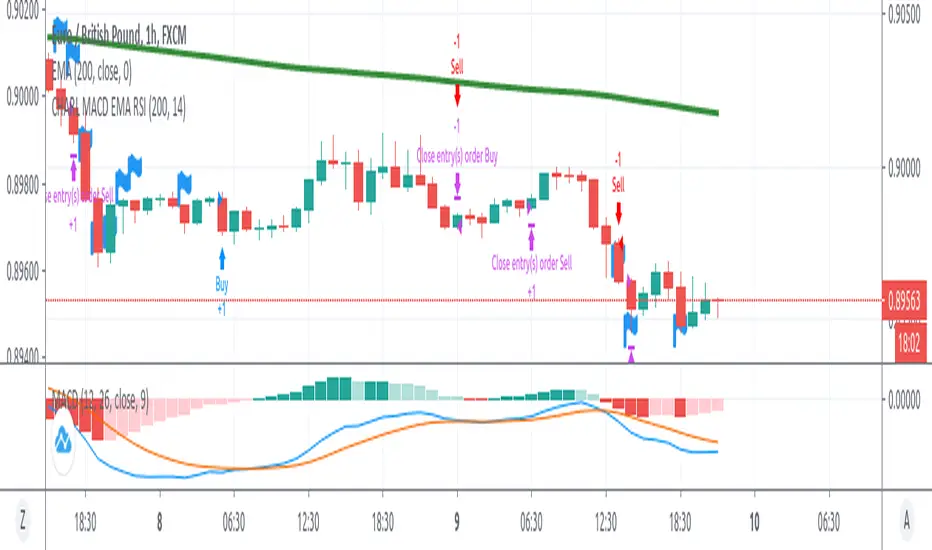
KDS_mzKaufdrucksystem (buying pressure system) after F.Held, coded by O.P and M.Z.
A combination of 5 adjusted conventional indicators and corresponding treshholds to generate a trend ranking between 0 and 5.
At crossover/under of KDS with buy/sell_border (2.5) a BUY and SELL signal is generated, respectivley.
Tested on indizes, ETFs and stocks for time frames from hours to weeks.
KDS 2.5 outperformed standard MACD and RSI approaches for stocks like TSLA, BOEING,WIRECARD.
KDS 0.5 outperformed standard approaches for SP500 and Nasdaq.
Backtesting was performed with 10% of equity of a 100000 $ depot ( slipage 1 Tick, 0.1% commision) on Lyxor DAX ETF from 2000 to September 2020.

Ruckard TradingLatinoThis strategy tries to mimic TradingLatino strategy.
The current implementation is beta.
Si hablas castellano o espanyol por favor consulta MENSAJE EN CASTELLANO más abajo.
It's aimed at BTCUSDT pair and 4h timeframe.
STRATEGY DEFAULT SETTINGS EXPLANATION
max_bars_back=5000 : This is a random number of bars so that the strategy test lasts for one or two years
calc_on_order_fills=false : To wait for the 4h closing is too much. Try to check if it's worth entering a position after closing one. I finally decided not to recheck if it's worth entering after an order is closed. So it is false.
calc_on_every_tick=false
pyramiding=0 : We only want one entry allowed in the same direction. And we don't want the order to scale by error.
initial_capital=1000 : These are 1000 USDT. By using 1% maximum loss per trade and 7% as a default stop loss by using 1000 USDT at 12000 USDT per BTC price you would entry with around 142 USDT which are converted into: 0.010 BTC . The maximum number of decimal for contracts on this BTCUSDT market is 3 decimals. E.g. the minimum might be: 0.001 BTC . So, this minimal 1000 amount ensures us not to entry with less than 0.001 entries which might have happened when using 100 USDT as an initial capital.
slippage=1 : Binance BTCUSDT mintick is: 0.01. Binance slippage: 0.1 % (Let's assume). TV has an integer slippage. It does not have a percentage based slippage. If we assume a 1000 initial capital, the recommended equity is 142 which at 11996 USDT per BTC price means: 0.011 BTC. The 0.1% slippage of: 0.011 BTC would be: 0.000011 . This is way smaller than the mintick. So our slippage is going to be 1. E.g. 1 (slippage) * 0.01 (mintick)
commission_type=strategy.commission.percent and commission_value=0.1 : According to: binance . com / en / fee / schedule in VIP 0 level both maker and taker fees are: 0.1 %.
BACKGROUND
Jaime Merino is a well known Youtuber focused on crypto trading
His channel TradingLatino
features monday to friday videos where he explains his strategy.
JAIME MERINO STANCE ON BOTS
Jaime Merino stance on bots (taken from memory out of a 2020 June video from him):
'~
You know. They can program you a bot and it might work.
But, there are some special situations that the bot would not be able to handle.
And, I, as a human, I would handle it. And the bot wouldn't do it.
~'
My long term target with this strategy script is add as many
special situations as I can to the script
so that it can match Jaime Merino behaviour even in non normal circumstances.
My alternate target is learn Pine script
and enjoy programming with it.
WARNING
This script might be bigger than other TradingView scripts.
However, please, do not be confused because the current status is beta.
This script has not been tested with real money.
This is NOT an official strategy from Jaime Merino.
This is NOT an official strategy from TradingLatino . net .
HOW IT WORKS
It basically uses ADX slope and LazyBear's Squeeze Momentum Indicator
to make its buy and sell decisions.
Fast paced EMA being bigger than slow paced EMA
(on higher timeframe) advices going long.
Fast paced EMA being smaller than slow paced EMA
(on higher timeframe) advices going short.
It finally add many substrats that TradingLatino uses.
SETTINGS
__ SETTINGS - Basics
____ SETTINGS - Basics - ADX
(ADX) Smoothing {14}
(ADX) DI Length {14}
(ADX) key level {23}
____ SETTINGS - Basics - LazyBear Squeeze Momentum
(SQZMOM) BB Length {20}
(SQZMOM) BB MultFactor {2.0}
(SQZMOM) KC Length {20}
(SQZMOM) KC MultFactor {1.5}
(SQZMOM) Use TrueRange (KC) {True}
____ SETTINGS - Basics - EMAs
(EMAS) EMA10 - Length {10}
(EMAS) EMA10 - Source {close}
(EMAS) EMA55 - Length {55}
(EMAS) EMA55 - Source {close}
____ SETTINGS - Volume Profile
Lowest and highest VPoC from last three days
is used to know if an entry has a support
VPVR of last 100 4h bars
is also taken into account
(VP) Use number of bars (not VP timeframe): Uses 'Number of bars {100}' setting instead of 'Volume Profile timeframe' setting for calculating session VPoC
(VP) Show tick difference from current price {False}: BETA . Might be useful for actions some day.
(VP) Number of bars {100}: If 'Use number of bars (not VP timeframe)' is turned on this setting is used to calculate session VPoC.
(VP) Volume Profile timeframe {1 day}: If 'Use number of bars (not VP timeframe)' is turned off this setting is used to calculate session VPoC.
(VP) Row width multiplier {0.6}: Adjust how the extra Volume Profile bars are shown in the chart.
(VP) Resistances prices number of decimal digits : Round Volume Profile bars label numbers so that they don't have so many decimals.
(VP) Number of bars for bottom VPOC {18}: 18 bars equals 3 days in suggested timeframe of 4 hours. It's used to calculate lowest session VPoC from previous three days. It's also used as a top VPOC for sells.
(VP) Ignore VPOC bottom advice on long {False}: If turned on it ignores bottom VPOC (or top VPOC on sells) when evaluating if a buy entry is worth it.
(VP) Number of bars for VPVR VPOC {100}: Number of bars to calculate the VPVR VPoC. We use 100 as Jaime once used. When the price bounces back to the EMA55 it might just bounce to this VPVR VPoC if its price it's lower than the EMA55 (Sells have inverse algorithm).
____ SETTINGS - ADX Slope
ADX Slope
help us to understand if ADX
has a positive slope, negative slope
or it is rather still.
(ADXSLOPE) ADX cut {23}: If ADX value is greater than this cut (23) then ADX has strength
(ADXSLOPE) ADX minimum steepness entry {45}: ADX slope needs to be 45 degrees to be considered as a positive one.
(ADXSLOPE) ADX minimum steepness exit {45}: ADX slope needs to be -45 degrees to be considered as a negative one.
(ADXSLOPE) ADX steepness periods {3}: In order to avoid false detection the slope is calculated along 3 periods.
____ SETTINGS - Next to EMA55
(NEXTEMA55) EMA10 to EMA55 bounce back percentage {80}: EMA10 might bounce back to EMA55 or maybe to 80% of its complete way to EMA55
(NEXTEMA55) Next to EMA55 percentage {15}: How much next to the EMA55 you need to be to consider it's going to bounce back upwards again.
____ SETTINGS - Stop Loss and Take Profit
You can set a default stop loss or a default take profit.
(STOPTAKE) Stop Loss % {7.0}
(STOPTAKE) Take Profit % {2.0}
____ SETTINGS - Trailing Take Profit
You can customize the default trailing take profit values
(TRAILING) Trailing Take Profit (%) {1.0}: Trailing take profit offset in percentage
(TRAILING) Trailing Take Profit Trigger (%) {2.0}: When 2.0% of benefit is reached then activate the trailing take profit.
____ SETTINGS - MAIN TURN ON/OFF OPTIONS
(EMAS) Ignore advice based on emas {false}.
(EMAS) Ignore advice based on emas (On closing long signal) {False}: Ignore advice based on emas but only when deciding to close a buy entry.
(SQZMOM) Ignore advice based on SQZMOM {false}: Ignores advice based on SQZMOM indicator.
(ADXSLOPE) Ignore advice based on ADX positive slope {false}
(ADXSLOPE) Ignore advice based on ADX cut (23) {true}
(STOPTAKE) Take Profit? {false}: Enables simple Take Profit.
(STOPTAKE) Stop Loss? {True}: Enables simple Stop Loss.
(TRAILING) Enable Trailing Take Profit (%) {True}: Enables Trailing Take Profit.
____ SETTINGS - Strategy mode
(STRAT) Type Strategy: 'Long and Short', 'Long Only' or 'Short Only'. Default: 'Long and Short'.
____ SETTINGS - Risk Management
(RISKM) Risk Management Type: 'Safe', 'Somewhat safe compound' or 'Unsafe compound'. ' Safe ': Calculations are always done with the initial capital (1000) in mind. The maximum losses per trade/day/week/month are taken into account. ' Somewhat safe compound ': Calculations are done with initial capital (1000) or a higher capital if it increases. The maximum losses per trade/day/week/month are taken into account. ' Unsafe compound ': In each order all the current capital is gambled and only the default stop loss per order is taken into account. That means that the maximum losses per trade/day/week/month are not taken into account. Default : 'Somewhat safe compound'.
(RISKM) Maximum loss per trade % {1.0}.
(RISKM) Maximum loss per day % {6.0}.
(RISKM) Maximum loss per week % {8.0}.
(RISKM) Maximum loss per month % {10.0}.
____ SETTINGS - Decimals
(DECIMAL) Maximum number of decimal for contracts {3}: How small (3 decimals means 0.001) an entry position might be in your exchange.
EXTRA 1 - PRICE IS IN RANGE indicator
(PRANGE) Print price is in range {False}: Enable a bottom label that indicates if the price is in range or not.
(PRANGE) Price range periods {5}: How many previous periods are used to calculate the medians
(PRANGE) Price range maximum desviation (%) {0.6} ( > 0 ): Maximum positive desviation for range detection
(PRANGE) Price range minimum desviation (%) {0.6} ( > 0 ): Mininum negative desviation for range detection
EXTRA 2 - SQUEEZE MOMENTUM Desviation indicator
(SQZDIVER) Show degrees {False}: Show degrees of each Squeeze Momentum Divergence lines to the x-axis.
(SQZDIVER) Show desviation labels {False}: Whether to show or not desviation labels for the Squeeze Momentum Divergences.
(SQZDIVER) Show desviation lines {False}: Whether to show or not desviation lines for the Squeeze Momentum Divergences.
EXTRA 3 - VOLUME PROFILE indicator
WARNING: This indicator works not on current bar but on previous bar. So in the worst case it might be VP from 4 hours ago. Don't worry, inside the strategy calculus the correct values are used. It's just that I cannot show the most recent one in the chart.
(VP) Print recent profile {False}: Show Volume Profile indicator
(VP) Avoid label price overlaps {False}: Avoid label prices to overlap on the chart.
EXTRA 4 - ZIGNALY SUPPORT
(ZIG) Zignaly Alert Type {Email}: 'Email', 'Webhook'. ' Email ': Prepare alert_message variable content to be compatible with zignaly expected email content format. ' Webhook ': Prepare alert_message variable content to be compatible with zignaly expected json content format.
EXTRA 5 - DEBUG
(DEBUG) Enable debug on order comments {False}: If set to true it prepares the order message to match the alert_message variable. It makes easier to debug what would have been sent by email or webhook on each of the times an order is triggered.
HOW TO USE THIS STRATEGY
BOT MODE: This is the default setting.
PROPER VOLUME PROFILE VIEWING: Click on this strategy settings. Properties tab. Make sure Recalculate 'each time the order was run' is turned off.
NEWBIE USER: (Check PROPER VOLUME PROFILE VIEWING above!) You might want to turn on the 'Print recent profile {False}' setting. Alternatively you can use my alternate realtime study: 'Resistances and supports based on simplified Volume Profile' but, be aware, it might consume one indicator.
ADVANCED USER 1: Turn on the 'Print price is in range {False}' setting and help us to debug this subindicator. Also help us to figure out how to include this value in the strategy.
ADVANCED USER 2: Turn on the all the (SQZDIVER) settings and help us to figure out how to include this value in the strategy.
ADVANCED USER 3: (Check PROPER VOLUME PROFILE VIEWING above!) Turn on the 'Print recent profile {False}' setting and report any problem with it.
JAIME MERINO: Just use the indicator as it comes by default. It should only show BUY signals, SELL signals and their associated closing signals. From time to time you might want to check 'ADVANCED USER 2' instructions to check that there's actually a divergence. Check also 'ADVANCED USER 1' instructions for your amusement.
EXTRA ADVICE
It's advised that you use this strategy in addition to these two other indicators:
* Squeeze Momentum Indicator
* ADX
so that your chart matches as close as possible to TradingLatino chart.
ZIGNALY INTEGRATION
This strategy supports Zignaly email integration by default. It also supports Zignaly Webhook integration.
ZIGNALY INTEGRATION - Email integration example
What you would write in your alert message:
||{{strategy.order.alert_message}}||key=MYSECRETKEY||
ZIGNALY INTEGRATION - Webhook integration example
What you would write in your alert message:
{ {{strategy.order.alert_message}} , "key" : "MYSECRETKEY" }
CREDITS
I have reused and adapted some code from
'Directional Movement Index + ADX & Keylevel Support' study
which it's from TradingView console user.
I have reused and adapted some code from
'3ema' study
which it's from TradingView hunganhnguyen1193 user.
I have reused and adapted some code from
'Squeeze Momentum Indicator ' study
which it's from TradingView LazyBear user.
I have reused and adapted some code from
'Strategy Tester EMA-SMA-RSI-MACD' study
which it's from TradingView fikira user.
I have reused and adapted some code from
'Support Resistance MTF' study
which it's from TradingView LonesomeTheBlue user.
I have reused and adapted some code from
'TF Segmented Linear Regression' study
which it's from TradingView alexgrover user.
I have reused and adapted some code from
"Poor man's volume profile" study
which it's from TradingView IldarAkhmetgaleev user.
FEEDBACK
Please check the strategy source code for more detailed information
where, among others, I explain all of the substrats
and if they are implemented or not.
Q1. Did I understand wrong any of the Jaime substrats (which I have implemented)?
Q2. The strategy yields quite profit when we should long (EMA10 from 1d timeframe is higher than EMA55 from 1d timeframe.
Why the strategy yields much less profit when we should short (EMA10 from 1d timeframe is lower than EMA55 from 1d timeframe)?
Any idea if you need to do something else rather than just reverse what Jaime does when longing?
FREQUENTLY ASKED QUESTIONS
FAQ1. Why are you giving this strategy for free?
TradingLatino and his fellow enthusiasts taught me this strategy. Now I'm giving back to them.
FAQ2. Seriously! Why are you giving this strategy for free?
I'm confident his strategy might be improved a lot. By keeping it to myself I would avoid other people contributions to improve it.
Now that everyone can contribute this is a win-win.
FAQ3. How can I connect this strategy to my Exchange account?
It seems that you can attach alerts to strategies.
You might want to combine it with a paying account which enable Webhook URLs to work.
I don't know how all of this works right now so I cannot give you advice on it.
You will have to do your own research on this subject. But, be careful. Automating trades, if not done properly,
might end on you automating losses.
FAQ4. I have just found that this strategy by default gives more than 3.97% of 'maximum series of losses'. That's unacceptable according to my risk management policy.
You might want to reduce default stop loss setting from 7% to something like 5% till you are ok with the 'maximum series of losses'.
FAQ5. Where can I learn more about your work on this strategy?
Check the source code. You might find unused strategies. Either because there's not a substantial increases on earnings. Or maybe because they have not been implemented yet.
FAQ6. How much leverage is applied in this strategy?
No leverage.
FAQ7. Any difference with original Jaime Merino strategy?
Most of the times Jaime defines an stop loss at the price entry. That's not the case here. The default stop loss is 7% (but, don't be confused it only means losing 1% of your investment thanks to risk management). There's also a trailing take profit that triggers at 2% profit with a 1% trailing.
FAQ8. Why this strategy return is so small?
The strategy should be improved a lot. And, well, backtesting in this platform is not guaranteed to return theoric results comparable to real-life returns. That's why I'm personally forward testing this strategy to verify it.
MENSAJE EN CASTELLANO
En primer lugar se agradece feedback para mejorar la estrategia.
Si eres un usuario avanzado y quieres colaborar en mejorar el script no dudes en comentar abajo.
Ten en cuenta que aunque toda esta descripción tenga que estar en inglés no es obligatorio que el comentario esté en inglés.
CHISTE - CASTELLANO
¡Pero Jaime!
¡400.000!
¡Tu da mun!

A Physicist's Bitcoin Trading Strategy
1. Summary
This strategy and indicator were designed for, and intended to be used to guide trading activity in, crypto markets, particularly Bitcoin. This strategy uses a custom indicator to determine the state of the market (bullish vs bearish) and allocates funds accordingly. This particular variation also uses the custom indicator to determine when the market is significantly oversold and takes advantage of the opportunity (it buys the dip). The specific mathematical formula that is used to calculate the underlying custom indicator allows the trader to get in before, or near the start of, the bull trends, and get out before the bear trends. The strategy's properties dialogue box includes many display settings and parameters for optimization and customization to meet the user's needs and risk tolerance; this is both a tool to gauge the market, as well as a trading strategy to beat the market. Guidelines for parameter settings are provided. A sample dataset of backtest results using randomized parameters, both within the guidelines and outside the guidelines, is available upon request; notably, all trials outperformed the intended market (Bitcoin) during the 9-year backtest period.
2. The Indicator and Strategy
2.1. The Indicator
A mathematical formula is used to determine the state of the market according to three different "frequencies", which, for lack of better terminology, are called fast, moderate, and slow indicators. There are two parameters for each of the three indicators, one called response time and the other is a simple look-back period. Finally, four exponential moving averages are used to smooth each indicator. In total, there are 18 different levels of bullishness/bearishness. The purpose of using three indicators, rather than one, is to capture the full character of the market, from a macro/global scope down to a micro/local scope. I.e. the full indicator looks at the forest, the trees, and the branches, simultaneously.
2.2. The Strategy
The trend-trading strategy is very simple; there are only four types of orders: 1) The entire position (e.g. all bitcoins held) is sold (if it hasn't already been totally sold) when the indicator becomes maximally bearish, 2) When the movement of the indicator is in the bullish direction, the strategy dollar-cost-average (DCA) buys at an exponentially decreasing rate, i.e. it buys more in the early stages of the transition from bear->bull. 3) When the indicator is maximally bullish, it goes "all-in" † (if it hasn't already gone all-in), i.e. it converts all available cash into the underlying security/token. And, 4) when the movement of the indicator is in the bearish direction, the strategy DCA sells (again, exponentially decreasing) to get out quickly. No leverage is used in this strategy. The strategy never takes a short position.
A second "buy-the-dip" strategy is also used, and it is the synergy of these two strategies, together, that is responsible for most of the outperformance in the backtests (this strategy handily beats the non-dip-buying variation in backtests). To do this, the custom indicator is used to determine when the market is significantly oversold on a short-term basis, and the strategy responds by DCA buying. However, unlike the DCA buying during bull/bear transitions, the buy-the-dip DCA buying increases with time. Specifically, within each candle that is short-term oversold, the strategy converts 10% x # of candles since becoming oversold (up to a max of 6 candles) of available cash into the underlying security/token. I.e. the first buy is 10% of available cash and occurs in the first oversold candle, the second buy is 20% of available cash and occurs in the second oversold candle, etc. up to six consecutive oversold candles. Lastly, to ensure no conflicting orders and no leverage (buying more than what is affordable with the available cash in the fund), buy-the-dip orders take precedence over the trend-trading orders enumerated in the previous paragraph.
† Technically the strategy goes 99.5% in when it goes "all-in". This is to ensure no leverage is used given that there may be a commission of 0.5%.
3. Backtest Results
Backtest results demonstrate significant outperformance over buy-and-hold. The default parameters of the strategy/indicator have been set by the author to achieve maximum (or, close to maximum) outperformance on backtests executed on the BTCUSD (Bitcoin) chart. However, significant outperformance over buy-and-hold is still easily achievable using non-default parameters. Basically, as long as the parameters are set to adequately capture the full character of the market, significant outperformance on backtests is achievable and is quite easy. In fact, after some experimentation, it seems as if underperformance hardly achievable and requires deliberately setting the parameters illogically (e.g. setting one parameter of the slow indicator faster than the fast indicator). In the interest of providing a quality product to the user, suggestions and guidelines for parameter settings are provided in section (6). Finally, some metrics of the strategy's outperformance on the BTCUSD chart are listed below, both for the default (optimal) parameters as well as for a random sample of parameter settings that adhere to the guidelines set forth in section (6).
Using the default parameters, relative to buy-and-hold strategy, backtested from August 2011 to August 2020,
Total cumulative outperformance (total return of strategy minus total return of buy-n-hold): 13,000,000%.
Rolling 1-year outperformance: mean 318%, median 84%, 1st quartile 55%, 3rd quartile, 430%.
Rolling 1-month outperformance: mean 2.8% (annualized, 39%), median -2.1%, 1st quartile -7.7%, 3rd quartile 13.2%, 10th percentile -13.9%, 90th percentile 24.5%.
Using the default parameters, relative to buy-and-hold strategy, during specific periods,
Cumulative outperformance during the past year (August 2019-August 2020): 37%.
12/17/2016 - 12/17/2017 (2017 bull market) absolute performance of 2563% vs buy-n-hold absolute performance of 2385%
11/29/2012 - 11/29/2013 (2013 bull market) absolute performance of 14033% vs buy-n-hold absolute performance of 9247%
Using a random sample (n=20) of combinations of parameter settings that adhere to the guidelines outlined in section (6), relative to buy-and-hold strategy, backtested from August 2011 to August 2020,
Average total cumulative outperformance, from August 2011 to August 2020: 2,000,000%.
Median total cumulative outperformance, from August 2011 to August 2020: 1,000,000%.
4. Limitations
This strategy is basically a DCA-swing trading strategy, and as such it is intended to be used on the 6-hr chart. Similar performance is expected on daily chart, 12-hr chart, and 4-hr chart, but performance is likely to be limited when used on charts of shorter time-frames. However, due to the flexibility afforded by the large quantity of parameters, as well as the tools included, it may be possible to tweak the indicator settings to get some outperformance on smaller time-frames. Admittedly, the author did not spend much time investigating this.
As is apparent in the backtests, this strategy has very limited absolute performance during large bear markets, such as Bitcoin's 2018 bear market. As described, it does outperform the underlying security by a large amount in backtests, but a large absolute return is unlikely during large and prolonged declines (unless, of course, your unit of account is the underlying token, in which case an outperformance of the underlying is, by definition, an absolute positive return).
This strategy is likely to underperform if used to trade ETFs of broad equity markets. This strategy may produce a small amount of outperformance when used to trade precious metals ETFs, given that the parameters are set optimally by the user.
5. Use
The default parameters have already been set for highly optimal backtest results on the chart of BTCUSD (Bitcoin / US Dollar BITSTAMP), (although, a different combination of parameter settings may yet produce better results). Still, there is a great number of combinations that can be explored, so the user is free to tweak the settings to meet his/her/their needs. Some display options are provided to give the user a visual aid while tweaking the parameters. These include a blue/red background display of the custom indicator, a calibration system, and options to display information about the backtest results. The background pattern represents the various levels of bullishness/bearishness as semi-transparent layers of blue and red, with blue corresponding with bullish and red corresponding with bearish.
The parameters that affect the indicator are the response times, the periods, and some EMA lengths. The parameters that affect the quantity of contracts (tokens/shares/bitcoins/etc) to be bought/sold are the transitionary buy/sell rates. There are also two sets of date parameters.
The response time and period parameters are direct inputs into the underlying math formula and are used to create the base-level indicators (fast, moderate, and slow). The response times control the speed of each of the three indicators (shorter is fast, longer is slower) and the period controls how much historical data is used in computation. Information about how these should be set are included in section (6). Another set of parameters control EMA look-back periods that serve to smooth the base-level indicators. Increasing these EMA lengths makes the overall indicator less sensitive to short-term price action, while reducing them does the opposite. The effect of these parameters are obvious when the background blue/red visualization is displayed. Another EMA length is an EMA for the entire indicator. Increasing this parameter reduces the responsiveness of the trading strategy (buy/sell orders) to quick/small changes of the overall level of the indicator, so as to avoid unnecessary buying and selling in times of relatively small and balanced price perturbations. Note, changing this parameter does not have an effect on the overall indicator itself, and thus will not affect the blue/red background representation.
The transitionary buy/sell rates control the portion of the available asset to be converted to the other. E.g. if the buy rate is set to 90%, then 90% of the available cash will be used to buy contracts/tokens/shares/bitcoins during transitions bullish transitions, e.g. if the available cash at the start of the bullish transition is $10,000 and the parameter is set to 90%, then $9,000 will be used to buy in the first candle during which the transition is bullish, then $900 will be used to buy in the second candle, then $90 in the third candle, etc.
There are two dates that can be set. The first is the date at which the strategy goes all in. This is included because the buy-and-hold strategy is the benchmark against which this strategy is compared, so setting this date to some time before the strategy starts to make trades will show, very clearly, the outperformance of the strategy, especially when the initial capital parameter in the Properties tab is equal to the price of one unit of the underlying security on the date that is set, e.g. all-in on Bitcoin on 8/20/2011 and set initial capital to the BTCUSD price on that date, which was $11.70. The second date is a date to control when the strategy can begin to place trades.
Finally (actually, firstly in the Inputs dialogue box), a set of checkbox inputs controls whether or not the backtest is on or off, and what is displayed. The display options are the blue/red (bull/bear) background layers †, a set of calibrators, a plot of the total strategy equity, a plot of the cash position of the strategy, a plot of the size of the position of the strategy in contracts/shares/units (labeled as BTC position), and a plot of the rolling 1-year performances of buy-and-hold and the strategy.
About the calibrators: The calibration system allows the user to quickly assess and calibrate how well the indicator... indicates. Quite simply, the system has two parts: one plot that is the cumulative sum of the product of the indicator level and the change in the underlying price, i.e. sum of ‡, over all candles. The second part is a similar plot that is reduced according to the quickness with which the indicator changes, i.e. sum of . Maximizing the first plot at the expense of the second will cause the indicator to match the price action very well but therefore it will change very rapidly, from bullish to bearish, which is visualized by a background pattern that changes frequently from blue to red to blue. Ignoring the first plot and maximizing the second will also cause the indicator to more closely match the price action, but the transitions will be slower and less frequent, and will therefore focus on identifying the major trends of the market.
† The blue/red background has many layers and will make the chart lag as the user interacts with it.
‡ Bearish states are coded as negative quantities, so a bearish state x negative price action = positive number, and bullish state x positive price action = positive number.
6. Suggestions and Guidelines
As described in section (2.1), the indicator used in this strategy was designed to determine the state of the market--whether it is bullish or bearish--as well as the change in the state of the market--whether it is increasingly bullish or increasingly bearish. As such, the following suggestions are provided based on the principles of the indicator's design,
1. Response Time 1 should be less than (<) Response Time 2 which should be < Response Time 3
2. Fast Period < Moderate Period < Slow Period
3. In terms of the period of a full market cycle (e.g. ~ 4 years for BTC, ~ 5.5 years for equities, etc.), response times 1, 2, and 3 should be about 0.3% to 1%, 3% to 20%, and 20% to 50% of a full market cycle period, respectively. However, this is a loose guideline.
4. In terms of the period of a full market cycle, periods 1, 2, and 3 should all be about 25% to 75% of a full cycle period. Again, this is a loose guideline.
4. EMA 1 Length < EMA 2 Length < EMA 3 Length < EMA 4 Length
5. EMA Lengths 1, 2, 3, and 4 should be limited to about 1/4th the length of a full market cycle. Note, EMA lengths are measured in bars (candles), not in days. 1/4th of 1000 days is 250 days which is 250 x 4 = 1000 6-hr candles.
The following guidelines are provided based on results of over 100 backtests on the BTCUSD chart using randomized parameters †,
1. 9 days < Response Time 1 < 14 days
2. 5 days < EMA 1 Length < 100 days
3. 600 days < EMA 4 length < 1000 days
4. The ratio of the EMA range (EMA 4 len - EMA 1 len) to the sum of EMA lengths (EMA 1 len + EMA 2 len + ...) be greater than 0.4
5. The ratio of the sum of EMA 1 and EMA 2 lengths to the sum of EMA 3 and EMA 4 lengths be less than 0.3.
A suggestion from the author: Given that backtests show a high degree of outperformance using the guidelines enumerated above, a good trading strategy may be to not rely on any one particular combination of parameters. Rather, a random set of combinations of parameter settings that adhere to the guidelines above could be used to create multiple instances of the strategy in a TradingView chart, each of which varies by a small amount due to their unique parameter settings. The proportion of the entire set of strategy instances that agree about the current state of the market could indicate to the trader the level of confidence of the indicator, in aggregate.
† A sample dataset of backtest results using randomized parameters is available upon request; notably, all trials outperformed the intended market (Bitcoin).
7. General Remarks About the Indicator
Other than some exponential moving averages, no traditional technical indicators or technical analysis tools are employed in this strategy. No MACD, no RSI, no CMF, no Bollinger bands, parabolic SARs, Ichimoku clouds, hoosawatsits, XYZs, ABCs, whatarethese. No tea leaves can be found in this strategy, only mathematics. It is in the nature of the underlying math formula, from which the indicator is produced, to quickly identify trend changes.
8. Remarks About Expectations of Future Results and About Backtesting
8.1. In General
As it's been stated in many prospectuses and marketing literature, "past performance is no guarantee of future results." Backtest results are retrospective, and hindsight is 20/20. Therefore, no guarantee can, nor should, be expressed by me or anybody else who is selling a financial product (unless you have a money printer, like the Federal Reserve does).
8.2. Regarding This Strategy
No guarantee of future results using this strategy is expressed by the author, not now nor at any time in the future.
With that written, the author is free to express his own expectations and opinions based on his intimate knowledge of how the indicator works, and the author will take that liberty by writing the following: As described in section (7), this trading strategy does not include any traditional technical indicators or TA tools (other than smoothing EMAs). Instead, this strategy is based on a principle that does not change, it employs a complex indicator that is based on a math formula that does not change, and it places trades based on five simple rules that do not change. And, as described in section (2.1), the indicator is designed to capture the full character of the market, from a macro/global scope down to a micro/local scope. Additionally, as described in section (3), outperformance of the market for which this strategy was intended during backtesting does not depend on luckily setting the parameters "just right." In fact, all random combinations of parameter settings that followed the guidelines outperformed the intended market in backtests. Additionally, no parameters are included within the underlying math formula from which the indicator is produced; it is not as if the formula contains a "5" and future outperformance would depend on that "5" being a "6" instead. And, again as described, it is in the nature of the formula to quickly identify trend changes. Therefore, it is the opinion of the author that the outperformance of this strategy in backtesting is directly attributable to the fundamental nature of the math formula from which the indicator is produced. As such, it is also the opinion of the author that continued outperformance by using this strategy, applied to the crypto (Bitcoin) market, is likely, given that the parameter settings are set reasonably and in accordance with the guidelines. The author does not, however, expect future outperformance of this strategy to match or exceed the outperformance observed in backtests using the default parameters, i.e. it probably won't outperform by anything close to 13,000,000% during the next 9 years.
Additionally, based on the rolling 1-month outperformance data listed in section (3), expectations of short-term outperformance should be kept low; the median 1-month outperformance was -2%, so it's basically a 50/50 chance that any significant outperformance is seen in any given month. The true strength of this strategy is to be out of the market during large, sharp declines and capitalizing on the opportunities presented at the bottom of those declines by buying the dip. Given that such price action does not happen every month, outperformance in the initial months of use is approximately as likely as underperformance.
9. Access
Those who are interested in using this strategy may send a personal message to inquire about how to gain access. Those who are interested in acquiring the sample dataset of backtest results may send a personal message to request a copy of the data.

RSPRO StrategyStrategy for RSPRO indicator
Based on resistance/support and bollinger band fluctuations this indicator also has filter with x bars after RSI overbought/oversell zones from settings.
There are two types of entries and signals: early (usually before trend changes) and main (when trend started to reverse)
Fits for BTC and any altcoins. And any assets. Good for both scalping and position trading (depends on timeframe that you use)
Best use it with big timeframes: 45 and 90min, 2 and 4 hours for position trading.
For scalping 5-30min timeframes are good too.
In Script settings you can specify:
1) RSI period, 14 by default.
2) Show early entries (squares), enabled by defaults.
3) Show main entries (triangles), enabled by defaults.
4) Enable/Disable filter to show main entries only after RSI overbought/oversell regions
Disabled by defaults and RSI is 67 for upper zone and 33 for lower zone.
You can also specify how many bars back before current bar this filter must do. It's 10 by default, you can vary it up to 90.
+With customisable start/end date, take profit and stop-loss.
This is invite only script. PM me if you want to test it.